souris 2011 post flood report -...
TRANSCRIPT
2011 POST- FLOOD REPORT For the
SOURIS RIVER BASIN
US Army Corps of Engineers St. Paul District Water Management & Hydrology Section Revised March, 2012
2011 POST- FLOOD REPORT For the
SOURIS RIVER BASIN
Submitted to The International Souris River Board
And to
The United States Department of the Interior Fish and Wildlife Service
Region 6
February 22, 2012 (Revised March 2012)
USACE, St. Paul District – 2011 Post-Flood Report for the Souris River Basin – Revised March 2012 Page i
TABLE OF CONTENTS
1. INTRODUCTION ...............................................................................................................1 2. BACKGROUND .................................................................................................................2
2.1. Basin and Reservoir Information .............................................................................2 2.2. 1989 International Agreement for Water Supply and Flood Control ......................2
3. FLOOD METEOROLOGY AND HYDROLOGY .............................................................3
3.1. Antecedent Conditions .............................................................................................3 3.1.1. Fall ...............................................................................................................7 3.1.2. Winter ..........................................................................................................7 3.1.3. Snow Surveys...............................................................................................7
3.2. Flood Conditions ......................................................................................................9 3.2.1. Saskatchewan .............................................................................................13 3.2.2. North Dakota ..............................................................................................14 3.2.3. Manitoba ....................................................................................................15 3.2.4. Flow Frequency and Flow Volumes ..........................................................16
4. COORDINATION OF FORECASTS AND RESERVOIR OPERATIONS ....................22
4.1. Operational and Liaison Responsibilities Under the 1989 International Agreement Between Canada and the United States ...............................................22
4.2. Forecasting and Flood Operations Coordination ...................................................23 4.3. Coordination with Stakeholders .............................................................................25
5. SPRING RUNOFF FORECASTS ....................................................................................26
5.1. 2011 Spring Forecasts ............................................................................................26 5.2. Future Runoff Forecast Modeling Enhancements .................................................32
6. RESERVOIR OPERATIONS ...........................................................................................33 6.1. Canadian Reservoirs ..............................................................................................33
6.1.1. Boundary Reservoir ...................................................................................34 6.1.2. Rafferty Reservoir ......................................................................................35 6.1.3. Alameda Reservoir .....................................................................................36
6.2. Upper Souris National Wildlife Refuge .................................................................36 6.2.1. Dam 41 .......................................................................................................39 6.2.2. Dam 83/Lake Darling ................................................................................39 6.2.3. Dam 96 .......................................................................................................44
6.3. J. Clark Salyer National Wildlife Refuge ..............................................................45 6.3.1. Inflow .........................................................................................................45 6.3.2. Impoundment Operation ............................................................................47 6.3.3. Outflow ......................................................................................................47
7. FIELD RECONNAISSANCE ..........................................................................................48
USACE, St. Paul District – 2011 Post-Flood Report for the Souris River Basin – Revised March 2012 Page ii
8. SUMMARY OF HYDRAULIC MODELING DURING THE FLOOD .........................50
9. IMPACT OF THE 2011 FLOOD ......................................................................................50 9.1. Saskatchewan .........................................................................................................51 9.2. North Dakota ..........................................................................................................52
9.2.1. General .......................................................................................................52 9.2.2. U.S. Fish & Wildlife Service Refuges .......................................................57
9.3. Manitoba ................................................................................................................59 9.3.1. Agriculture .................................................................................................59 9.3.2. Communities ..............................................................................................59 9.3.3. Infrastructure ..............................................................................................61
10. INTERPRETATION OF 1989 CANADA-UNITED STATES AGREEMENT ...............62 11. LESSONS LEARNED.......................................................................................................63
12. RECOMMENDATIONS ...................................................................................................65 13. SUMMARY .......................................................................................................................67 14. ACKNOWLEDGEMENTS ...............................................................................................68
15. REFERENCES ..................................................................................................................69
APPENDIX A: FIGURES .............................................................................................. A-1 APPENDIX B: SUPPLEMENTAL INFORMATION ....................................................B-1 APPENDIX C: FORECASTING AND FLOOD OPERATIONS COORDINATION ...C-1 APPENDIX D: COORDINATION WITH STAKEHOLDERS .................................... D-1 APPENDIX E: FLOOD PROFILES ............................................................................... E-1 APPENDIX F: FLOODED AREAS ................................................................................ F-1
USACE, St. Paul District – 2011 Post-Flood Report for the Souris River Basin – Revised March 2012 Page iii
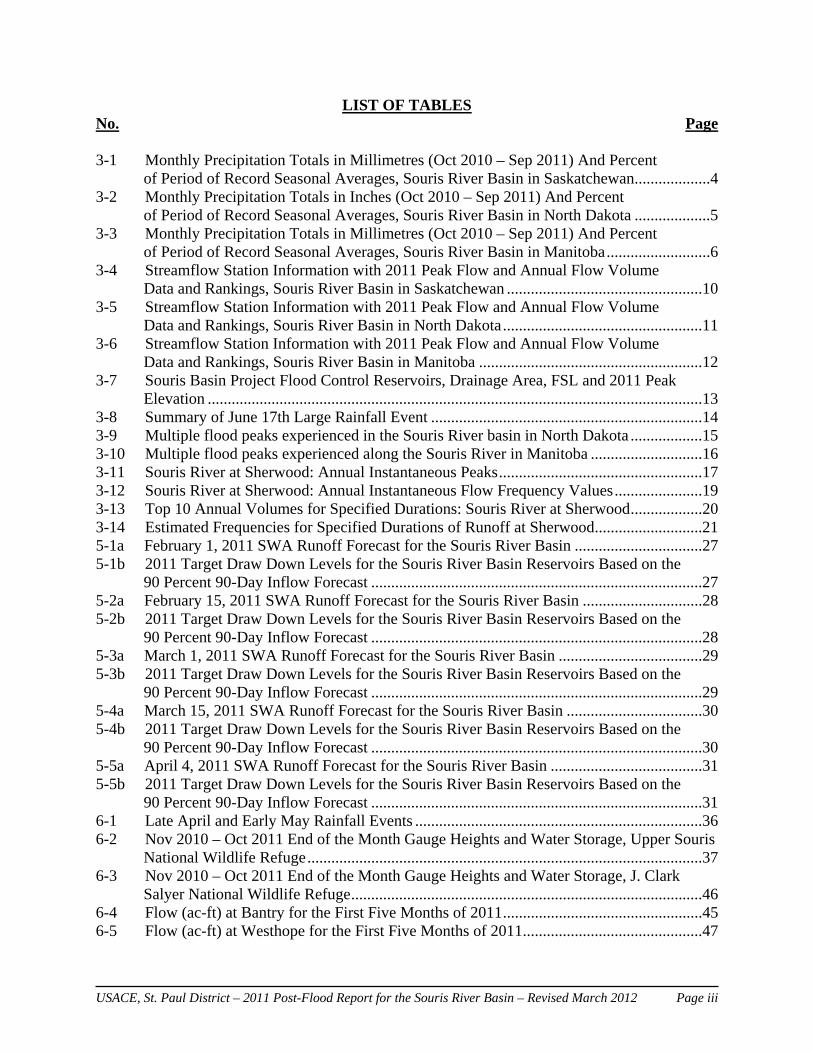
LIST OF TABLES No. Page 3-1 Monthly Precipitation Totals in Millimetres (Oct 2010 – Sep 2011) And Percent of Period of Record Seasonal Averages, Souris River Basin in Saskatchewan ...................4 3-2 Monthly Precipitation Totals in Inches (Oct 2010 – Sep 2011) And Percent of Period of Record Seasonal Averages, Souris River Basin in North Dakota ...................5 3-3 Monthly Precipitation Totals in Millimetres (Oct 2010 – Sep 2011) And Percent of Period of Record Seasonal Averages, Souris River Basin in Manitoba ..........................6 3-4 Streamflow Station Information with 2011 Peak Flow and Annual Flow Volume Data and Rankings, Souris River Basin in Saskatchewan .................................................10 3-5 Streamflow Station Information with 2011 Peak Flow and Annual Flow Volume Data and Rankings, Souris River Basin in North Dakota ..................................................11 3-6 Streamflow Station Information with 2011 Peak Flow and Annual Flow Volume Data and Rankings, Souris River Basin in Manitoba ........................................................12 3-7 Souris Basin Project Flood Control Reservoirs, Drainage Area, FSL and 2011 Peak Elevation ............................................................................................................................13 3-8 Summary of June 17th Large Rainfall Event ....................................................................14 3-9 Multiple flood peaks experienced in the Souris River basin in North Dakota ..................15 3-10 Multiple flood peaks experienced along the Souris River in Manitoba ............................16 3-11 Souris River at Sherwood: Annual Instantaneous Peaks ...................................................17 3-12 Souris River at Sherwood: Annual Instantaneous Flow Frequency Values ......................19 3-13 Top 10 Annual Volumes for Specified Durations: Souris River at Sherwood ..................20 3-14 Estimated Frequencies for Specified Durations of Runoff at Sherwood ...........................21 5-1a February 1, 2011 SWA Runoff Forecast for the Souris River Basin ................................27 5-1b 2011 Target Draw Down Levels for the Souris River Basin Reservoirs Based on the 90 Percent 90-Day Inflow Forecast ...................................................................................27 5-2a February 15, 2011 SWA Runoff Forecast for the Souris River Basin ..............................28 5-2b 2011 Target Draw Down Levels for the Souris River Basin Reservoirs Based on the 90 Percent 90-Day Inflow Forecast ...................................................................................28 5-3a March 1, 2011 SWA Runoff Forecast for the Souris River Basin ....................................29 5-3b 2011 Target Draw Down Levels for the Souris River Basin Reservoirs Based on the 90 Percent 90-Day Inflow Forecast ...................................................................................29 5-4a March 15, 2011 SWA Runoff Forecast for the Souris River Basin ..................................30 5-4b 2011 Target Draw Down Levels for the Souris River Basin Reservoirs Based on the 90 Percent 90-Day Inflow Forecast ...................................................................................30 5-5a April 4, 2011 SWA Runoff Forecast for the Souris River Basin ......................................31 5-5b 2011 Target Draw Down Levels for the Souris River Basin Reservoirs Based on the 90 Percent 90-Day Inflow Forecast ...................................................................................31 6-1 Late April and Early May Rainfall Events ........................................................................36 6-2 Nov 2010 – Oct 2011 End of the Month Gauge Heights and Water Storage, Upper Souris National Wildlife Refuge ...................................................................................................37 6-3 Nov 2010 – Oct 2011 End of the Month Gauge Heights and Water Storage, J. Clark Salyer National Wildlife Refuge ........................................................................................46 6-4 Flow (ac-ft) at Bantry for the First Five Months of 2011 ..................................................45 6-5 Flow (ac-ft) at Westhope for the First Five Months of 2011 .............................................47
USACE, St. Paul District – 2011 Post-Flood Report for the Souris River Basin – Revised March 2012 Page iv
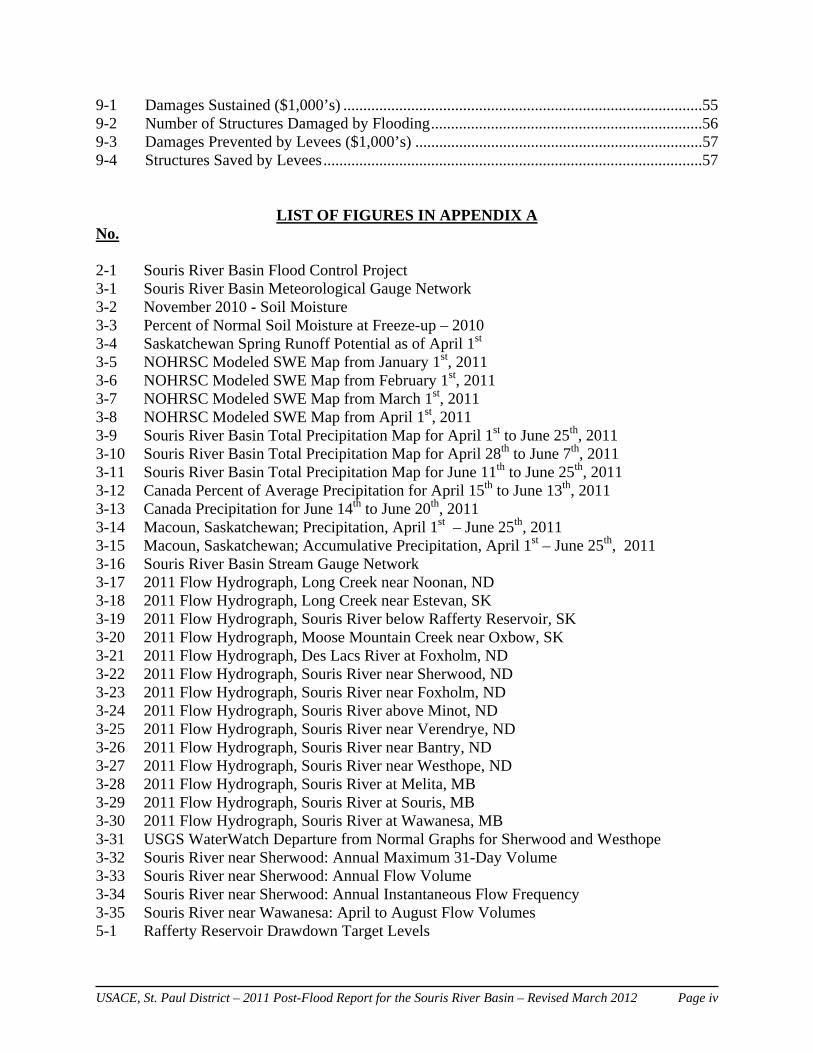
9-1 Damages Sustained ($1,000’s) ..........................................................................................55 9-2 Number of Structures Damaged by Flooding ....................................................................56 9-3 Damages Prevented by Levees ($1,000’s) ........................................................................57 9-4 Structures Saved by Levees ...............................................................................................57
LIST OF FIGURES IN APPENDIX A
No. 2-1 Souris River Basin Flood Control Project 3-1 Souris River Basin Meteorological Gauge Network 3-2 November 2010 - Soil Moisture 3-3 Percent of Normal Soil Moisture at Freeze-up – 2010 3-4 Saskatchewan Spring Runoff Potential as of April 1st 3-5 NOHRSC Modeled SWE Map from January 1st, 2011 3-6 NOHRSC Modeled SWE Map from February 1st, 2011 3-7 NOHRSC Modeled SWE Map from March 1st, 2011 3-8 NOHRSC Modeled SWE Map from April 1st, 2011 3-9 Souris River Basin Total Precipitation Map for April 1st to June 25th, 2011 3-10 Souris River Basin Total Precipitation Map for April 28th to June 7th, 2011 3-11 Souris River Basin Total Precipitation Map for June 11th to June 25th, 2011 3-12 Canada Percent of Average Precipitation for April 15th to June 13th, 2011 3-13 Canada Precipitation for June 14th to June 20th, 2011 3-14 Macoun, Saskatchewan; Precipitation, April 1st – June 25th, 2011 3-15 Macoun, Saskatchewan; Accumulative Precipitation, April 1st – June 25th, 2011 3-16 Souris River Basin Stream Gauge Network 3-17 2011 Flow Hydrograph, Long Creek near Noonan, ND 3-18 2011 Flow Hydrograph, Long Creek near Estevan, SK 3-19 2011 Flow Hydrograph, Souris River below Rafferty Reservoir, SK 3-20 2011 Flow Hydrograph, Moose Mountain Creek near Oxbow, SK 3-21 2011 Flow Hydrograph, Des Lacs River at Foxholm, ND 3-22 2011 Flow Hydrograph, Souris River near Sherwood, ND 3-23 2011 Flow Hydrograph, Souris River near Foxholm, ND 3-24 2011 Flow Hydrograph, Souris River above Minot, ND 3-25 2011 Flow Hydrograph, Souris River near Verendrye, ND 3-26 2011 Flow Hydrograph, Souris River near Bantry, ND 3-27 2011 Flow Hydrograph, Souris River near Westhope, ND 3-28 2011 Flow Hydrograph, Souris River at Melita, MB 3-29 2011 Flow Hydrograph, Souris River at Souris, MB 3-30 2011 Flow Hydrograph, Souris River at Wawanesa, MB 3-31 USGS WaterWatch Departure from Normal Graphs for Sherwood and Westhope 3-32 Souris River near Sherwood: Annual Maximum 31-Day Volume 3-33 Souris River near Sherwood: Annual Flow Volume 3-34 Souris River near Sherwood: Annual Instantaneous Flow Frequency 3-35 Souris River near Wawanesa: April to August Flow Volumes 5-1 Rafferty Reservoir Drawdown Target Levels
USACE, St. Paul District – 2011 Post-Flood Report for the Souris River Basin – Revised March 2012 Page v
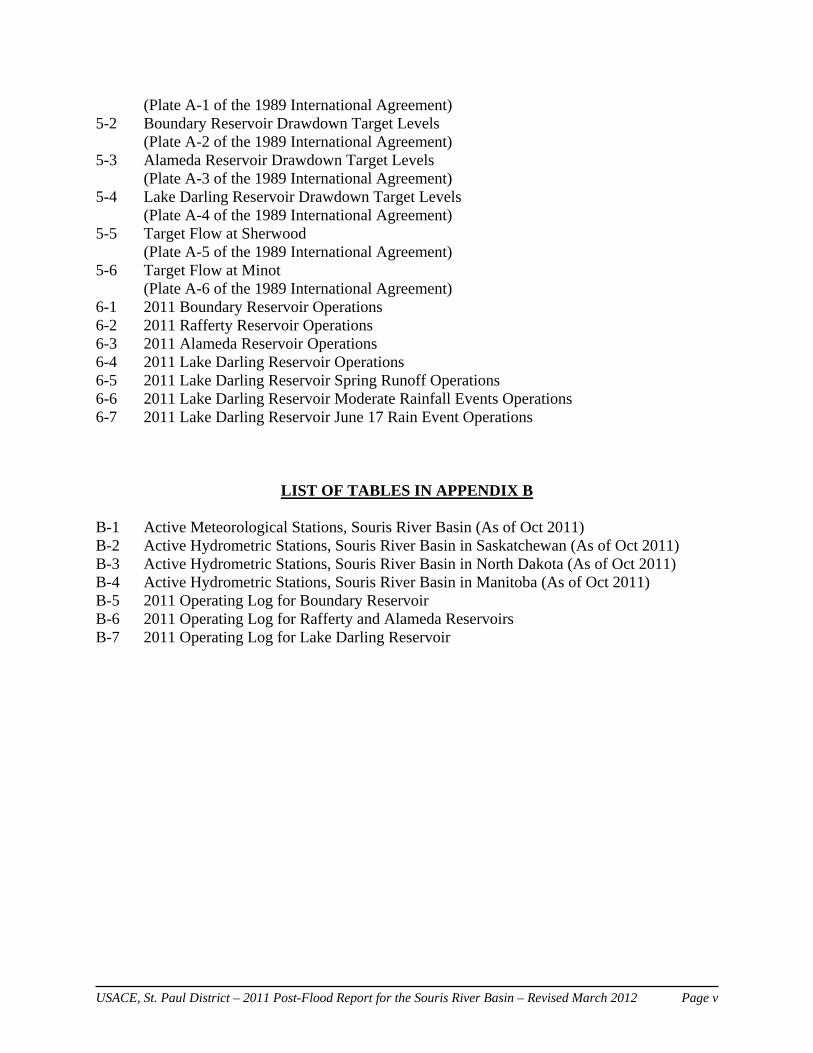
(Plate A-1 of the 1989 International Agreement) 5-2 Boundary Reservoir Drawdown Target Levels
(Plate A-2 of the 1989 International Agreement) 5-3 Alameda Reservoir Drawdown Target Levels
(Plate A-3 of the 1989 International Agreement) 5-4 Lake Darling Reservoir Drawdown Target Levels
(Plate A-4 of the 1989 International Agreement) 5-5 Target Flow at Sherwood
(Plate A-5 of the 1989 International Agreement) 5-6 Target Flow at Minot
(Plate A-6 of the 1989 International Agreement) 6-1 2011 Boundary Reservoir Operations 6-2 2011 Rafferty Reservoir Operations 6-3 2011 Alameda Reservoir Operations 6-4 2011 Lake Darling Reservoir Operations 6-5 2011 Lake Darling Reservoir Spring Runoff Operations 6-6 2011 Lake Darling Reservoir Moderate Rainfall Events Operations 6-7 2011 Lake Darling Reservoir June 17 Rain Event Operations
LIST OF TABLES IN APPENDIX B
B-1 Active Meteorological Stations, Souris River Basin (As of Oct 2011) B-2 Active Hydrometric Stations, Souris River Basin in Saskatchewan (As of Oct 2011) B-3 Active Hydrometric Stations, Souris River Basin in North Dakota (As of Oct 2011) B-4 Active Hydrometric Stations, Souris River Basin in Manitoba (As of Oct 2011) B-5 2011 Operating Log for Boundary Reservoir B-6 2011 Operating Log for Rafferty and Alameda Reservoirs B-7 2011 Operating Log for Lake Darling Reservoir
USACE, St. Paul District – 2011 Post-Flood Report for the Souris River Basin – Revised March 2012 Page vi
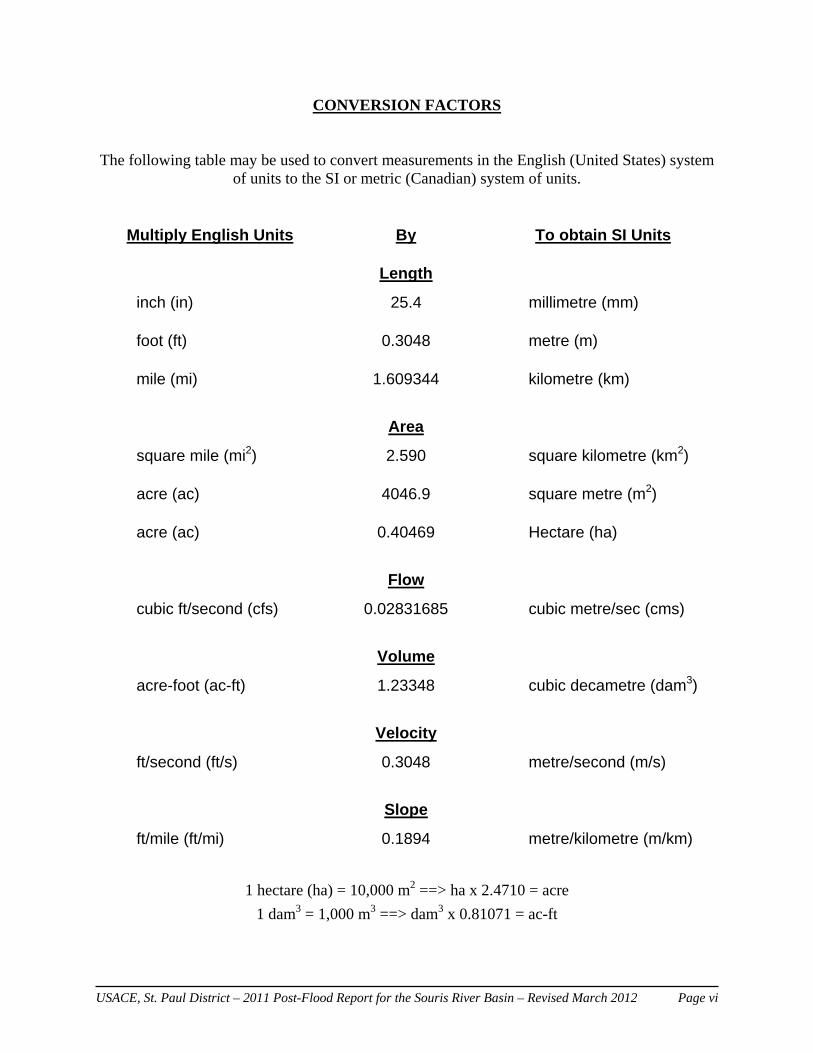
CONVERSION FACTORS
The following table may be used to convert measurements in the English (United States) system of units to the SI or metric (Canadian) system of units.
Multiply English Units By To obtain SI Units
Length
inch (in) 25.4 millimetre (mm)
foot (ft) 0.3048 metre (m)
mile (mi) 1.609344 kilometre (km)
Area
square mile (mi2) 2.590 square kilometre (km2)
acre (ac) 4046.9 square metre (m2)
acre (ac) 0.40469 Hectare (ha)
Flow
cubic ft/second (cfs) 0.02831685 cubic metre/sec (cms)
Volume
acre-foot (ac-ft) 1.23348 cubic decametre (dam3)
Velocity
ft/second (ft/s) 0.3048 metre/second (m/s)
Slope
ft/mile (ft/mi) 0.1894 metre/kilometre (m/km)
1 hectare (ha) = 10,000 m2 ==> ha x 2.4710 = acre
1 dam3 = 1,000 m3 ==> dam3 x 0.81071 = ac-ft
USACE, St. Paul District – 2011 Post-Flood Report for the Souris River Basin – Revised March 2012 Page 1
1.INTRODUCTION In 2011, high soil moisture content, above average snow pack, and persistent moderate spring rainfall and moderate to large summer rainfall combined to produce multiple flood peaks and record flooding throughout the Souris River Basin. In North Dakota, the flood necessitated the evacuation of approximately 12,000 residents from Minot and caused an estimated $600 million dollars of property and infrastructure damage. In Saskatchewan, states of emergency were declared in Weyburn and Estevan. Over 400 residents were evacuated from their homes, and almost every home in the Village of Roche Percee was inundated. Road closures, loss of roads and lift stations were noted among the damage to the infrastructure. In Manitoba, approximately 140 people were evacuated, either by mandatory order or voluntary request. Although flood fighting efforts throughout the province were generally successful, some infrastructure damages were sustained. In addition, the prolonged period of inundation caused a loss of agricultural productivity throughout the basin. This report documents the 2011 flood event in the Souris River basin and the flood operation of the Souris Basin Project under the 1989 International “Agreement between the Government of Canada and the Government of the United States for Water Supply and Flood Control in the Souris River Basin”. In accordance with the Agreement, flood operations were triggered on February 23rd, 2011, as declared by the International Souris River Board (ISRB). In addition, this report fulfills the requirement of Section 5.0 of Annex A to the Agreement, which states that the U.S. Army Corps of Engineers will prepare a post-flood report in any year in which flood operations occur under the Agreement and that report will become a part of the U.S. Fish and Wildlife Service report to the ISRB. Section 2 of this report contains background information on the Souris River basin and the Souris Basin Project. A discussion of the flood meteorology and hydrology is provided in Section 3 along with a detailed presentation of key flood parameters. Sections 4 through 6 deal with spring runoff forecasts, coordination, and reservoir operations. Field reconnaissance is discussed in Section 7, and a summary of the hydraulic modeling completed during the flood is provided in Section 8. Impacts of the 2011 flood are presented in Section 9. Section 10 reviews the 1989 International Agreement. Lessons learned are provided in Section 11 and recommendations are provided in Section 12. A brief summary is given in Section 13 and acknowledgements to the agencies, which supported the preparation of this report, are provided in Section 14. References for sources of information are provided in Section 15. Appendices A through F provide supporting information referenced in the main body of this report. Please note, in an attempt to finalize this report prior to the 2012 flood season, provisional hydrologic data are presented. Elevation data provided in the report for the portions of the Souris River in Saskatchewan and Manitoba has a vertical daum of Geodetic Survey of Canada (GSC). Elevation data provide in the report for the Souris River in North Dakota is based on the National Geodetic Vertical Datum 1929 Adjustment (NGVD Adj.) Appendix E is the exception to these general vertical datums. In Appendix E, the flood profile elevations for the Souris River in both North Dakota and Manitoba is based on a vertical datum of North American Vertical Datum of 1988 (NAVD 1988).
USACE, St. Paul District – 2011 Post-Flood Report for the Souris River Basin – Revised March 2012 Page 2
2.BACKGROUND 2.1 Basin and Reservoir Information The Souris River has its headwaters in the Province of Saskatchewan and flows generally in a southeasterly direction past Weyburn and Estevan, crossing the United States Border into the State of North Dakota near Sherwood, North Dakota. The river continues its southeasterly flow to Velva, North Dakota, where it reverses course and flows northeasterly to Towner, North Dakota and then northwesterly to the Canadian Border and into the Province of Manitoba near Westhope, North Dakota. Past the border the river flows north to Melita and then generally in a northeasterly direction past Souris and Wawanesa and into the Assiniboine River, a tributary of the Red River of the North. The Souris River valley is flat and shallow, and it has been extensively cultivated. Major reservoirs have been constructed in both the United States and Canadian portions of the basin, including Boundary, Rafferty and Alameda reservoirs in Saskatchewan, and Lake Darling in North Dakota. Boundary, Rafferty and Alameda reservoirs in Saskatchewan are operated by the Saskatchewan Watershed Authority (SWA). The basin also includes a number of wildlife refuges and small impoundments along the U.S. portion of the river. The U.S. Fish and Wildlife Service operates three national wildlife refuges located on the Souris River in North Dakota. Upper Souris National Wildlife Refuge is located near Foxholm, North Dakota, upstream of the City of Minot. J. Clark Salyer National Wildlife Refuge is located near Upham, North Dakota, downstream of the City of Towner. Des Lacs National Wildlife Refuge is located on the Des Lacs River (a tributary of the Souris River) near Kenmare, North Dakota. All of the major storage impoundments in the Souris River basin in North Dakota are located on national wildlife refuges and are operated by the U.S. Fish and Wildlife Service under water rights permits issued by the State of North Dakota.
2.2 1989 International Agreement for Water Supply and Flood Control Pursuant to the 1989 International “Agreement Between the Government of Canada and the Government of the United States of America for Water Supply and Flood Control in the Souris Basin,” flood control within the Souris basin is afforded by several reservoirs in Canada and the United States, collectively known as the “Souris Basin Project”. This term refers to the development and operation of the Saskatchewan works in Canada, the operation of the existing Boundary reservoir in Saskatchewan and the operation of the existing Lake Darling reservoir in North Dakota in the United States for flood control. The Saskatchewan works includes Rafferty Dam, Alameda Dam and the Boundary Diversion channel. Rafferty reservoir, Boundary reservoir, and Alameda reservoir are known collectively as the “Canadian reservoirs.” The project also includes a number of rural and levee improvements along the Souris River in North Dakota and improvements to other U.S. Fish and Wildlife refuge structures in North Dakota. Figure 2-1 in Appendix A shows a map of the Souris River Basin Project. As stated in Article X of the 1989 International Agreement, the entities responsible for flood control operation of the Souris Basin Project are the Government of Saskatchewan for the
USACE, St. Paul District – 2011 Post-Flood Report for the Souris River Basin – Revised March 2012 Page 3
Canadian reservoirs and the U.S. Department of the Army for Lake Darling. Practically, the day-to-day flood control responsibilities rest with the Saskatchewan Watershed Authority (SWA), a Crown corporation, in Canada and the U.S. Army Corps of Engineers in the United States (USACE). It is noted here that the flood control responsibilities of the SWA, previously known as Sask Water, were transferred to the Saskatchewan Watershed Authority established by the Saskatchewan Watershed Authority Act of 2005. Under the terms of Article X, non-flood operation of Lake Darling is the responsibility of the U.S. Department of the Interior and has been delegated to the U.S. Fish and Wildlife Service. A June 2, 1989 Memorandum of Understanding (MOU) between the Fish and Wildlife Service and the Corps of Engineers formalized and established the procedures, administration, cooperation and coordination between the two agencies for operation of Lake Darling for flood control purposes under the 1989 International Agreement and for identification and remediation of adverse impacts of the Souris Basin Project to fish and wildlife resources, refuge facilities and operations on the Upper Souris River and J. Clark Salyer National Wildlife refuges. In accordance with the operating plan for the Canadian reservoirs and Lake Darling, contained in “Annex A” of the 1989 International Agreement, flood control operation of the Souris Basin Project is triggered if a February 1st or subsequent spring runoff estimate shows a 50-percent chance of a 30-day unregulated runoff volume at the Sherwood Crossing equaling or exceeding 175,200 ac-ft (216 110 dam3), a 10-percent (10-year) flood volume, and/or the local 30-day runoff volume at Sherwood Crossing equaling or exceeding 30,000 ac-ft (37 000 dam3). The objectives of the operating plan are:
to provide 1-percent (100-year) flood protection at Minot, North Dakota; to provide flood protection to urban and rural areas downstream from Rafferty Dam,
Alameda Dam and Lake Darling Dam; and to ensure, to the extent possible, that the existing benefits from the supply of water in the
Souris River basin and the supply of water to the Souris Basin Project are not compromised.
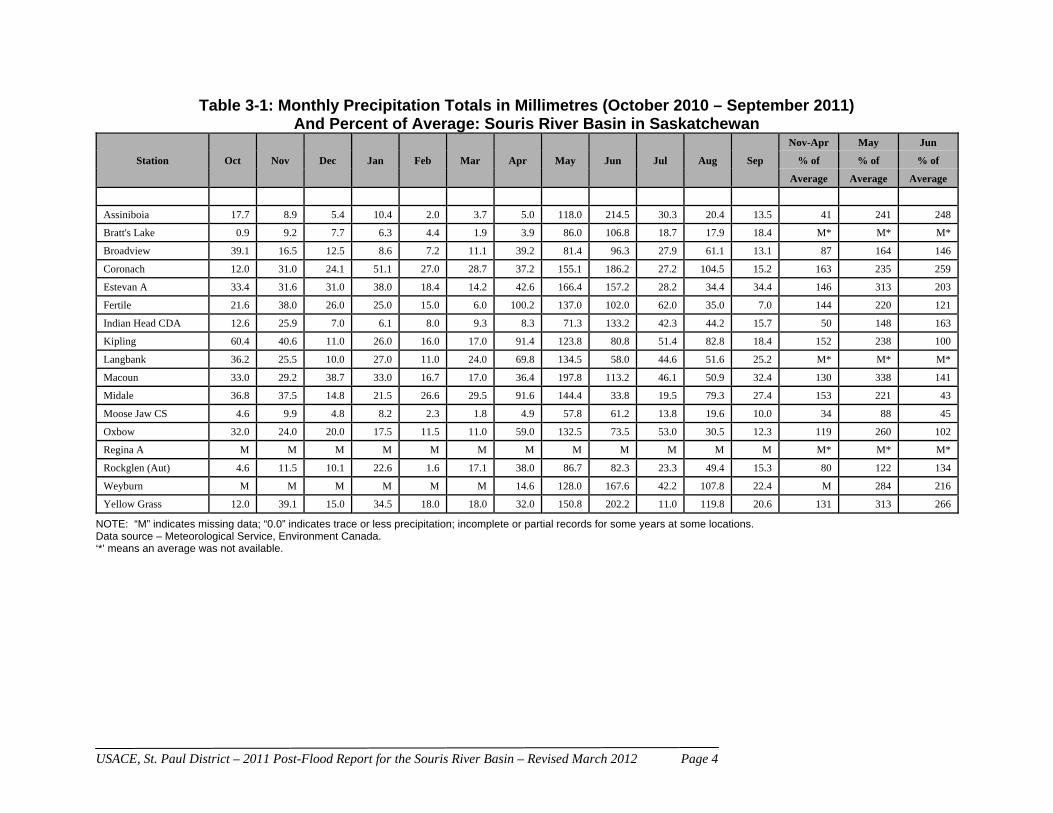
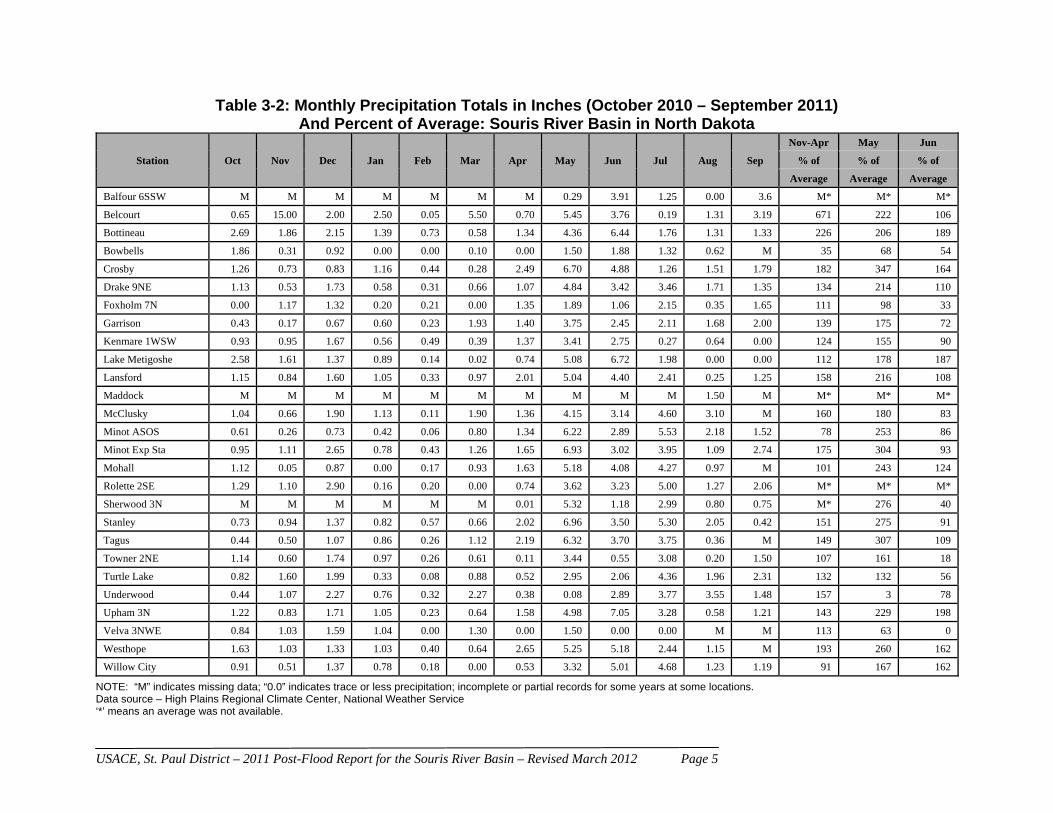
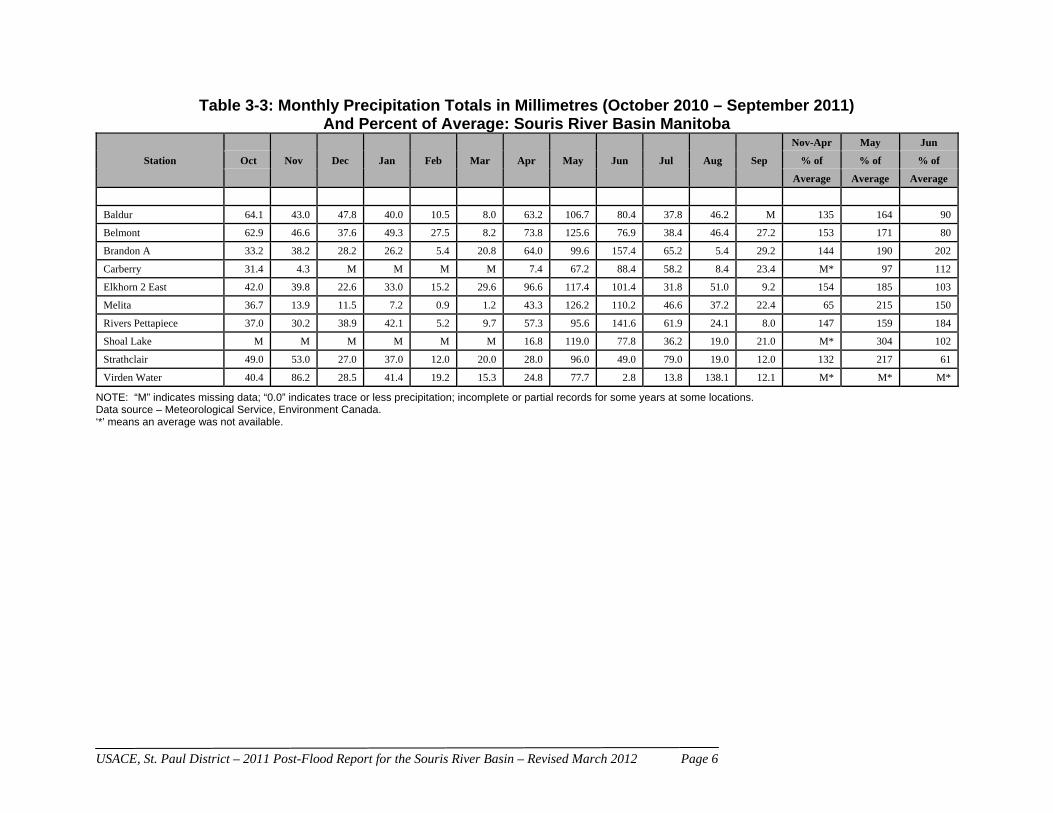
3.FloodMeteorologyandHydrology The meteorological gauge network for the U.S. National Weather Service (NWS) and the Meteorological Service of Canada within the Souris basin can be seen in Figure 3-1 in Appendix A. Additional information about gauge locations in these networks in Saskatchewan, North Dakota, and Manitoba, as of October 2011, may be found in table form in Appendix B. Tables 3-1, 3-2 and 3-3 show monthly precipitation totals and comparisons to long-term seasonal averages for several time periods for Saskatchewan, North Dakota and Manitoba. 3.1 Antecedent Conditions Due to high snow pack and soil moisture levels, the flood outlooks called for major flood potential along the Souris River.
USACE, St. Paul District – 2011 Post-Flood Report for the Souris River Basin – Revised March 2012 Page 4
Table 3-1: Monthly Precipitation Totals in Millimetres (October 2010 – September 2011) And Percent of Average: Souris River Basin in Saskatchewan
Station Oct Nov Dec Jan Feb Mar Apr May Jun Jul Aug Sep
Nov-Apr May Jun
% of % of % of
Average Average Average
Assiniboia 17.7 8.9 5.4 10.4 2.0 3.7 5.0 118.0 214.5 30.3 20.4 13.5 41 241 248
Bratt's Lake 0.9 9.2 7.7 6.3 4.4 1.9 3.9 86.0 106.8 18.7 17.9 18.4 M* M* M*
Broadview 39.1 16.5 12.5 8.6 7.2 11.1 39.2 81.4 96.3 27.9 61.1 13.1 87 164 146
Coronach 12.0 31.0 24.1 51.1 27.0 28.7 37.2 155.1 186.2 27.2 104.5 15.2 163 235 259
Estevan A 33.4 31.6 31.0 38.0 18.4 14.2 42.6 166.4 157.2 28.2 34.4 34.4 146 313 203
Fertile 21.6 38.0 26.0 25.0 15.0 6.0 100.2 137.0 102.0 62.0 35.0 7.0 144 220 121
Indian Head CDA 12.6 25.9 7.0 6.1 8.0 9.3 8.3 71.3 133.2 42.3 44.2 15.7 50 148 163
Kipling 60.4 40.6 11.0 26.0 16.0 17.0 91.4 123.8 80.8 51.4 82.8 18.4 152 238 100
Langbank 36.2 25.5 10.0 27.0 11.0 24.0 69.8 134.5 58.0 44.6 51.6 25.2 M* M* M*
Macoun 33.0 29.2 38.7 33.0 16.7 17.0 36.4 197.8 113.2 46.1 50.9 32.4 130 338 141
Midale 36.8 37.5 14.8 21.5 26.6 29.5 91.6 144.4 33.8 19.5 79.3 27.4 153 221 43
Moose Jaw CS 4.6 9.9 4.8 8.2 2.3 1.8 4.9 57.8 61.2 13.8 19.6 10.0 34 88 45
Oxbow 32.0 24.0 20.0 17.5 11.5 11.0 59.0 132.5 73.5 53.0 30.5 12.3 119 260 102
Regina A M M M M M M M M M M M M M* M* M*
Rockglen (Aut) 4.6 11.5 10.1 22.6 1.6 17.1 38.0 86.7 82.3 23.3 49.4 15.3 80 122 134
Weyburn M M M M M M 14.6 128.0 167.6 42.2 107.8 22.4 M 284 216
Yellow Grass 12.0 39.1 15.0 34.5 18.0 18.0 32.0 150.8 202.2 11.0 119.8 20.6 131 313 266
NOTE: “M” indicates missing data; “0.0” indicates trace or less precipitation; incomplete or partial records for some years at some locations. Data source – Meteorological Service, Environment Canada. ‘*’ means an average was not available.
USACE, St. Paul District – 2011 Post-Flood Report for the Souris River Basin – Revised March 2012 Page 5
Table 3-2: Monthly Precipitation Totals in Inches (October 2010 – September 2011) And Percent of Average: Souris River Basin in North Dakota
Station Oct Nov Dec Jan Feb Mar Apr May Jun Jul Aug Sep
Nov-Apr May Jun
% of % of % of
Average Average Average
Balfour 6SSW M M M M M M M 0.29 3.91 1.25 0.00 3.6 M* M* M*
Belcourt 0.65 15.00 2.00 2.50 0.05 5.50 0.70 5.45 3.76 0.19 1.31 3.19 671 222 106
Bottineau 2.69 1.86 2.15 1.39 0.73 0.58 1.34 4.36 6.44 1.76 1.31 1.33 226 206 189
Bowbells 1.86 0.31 0.92 0.00 0.00 0.10 0.00 1.50 1.88 1.32 0.62 M 35 68 54
Crosby 1.26 0.73 0.83 1.16 0.44 0.28 2.49 6.70 4.88 1.26 1.51 1.79 182 347 164
Drake 9NE 1.13 0.53 1.73 0.58 0.31 0.66 1.07 4.84 3.42 3.46 1.71 1.35 134 214 110
Foxholm 7N 0.00 1.17 1.32 0.20 0.21 0.00 1.35 1.89 1.06 2.15 0.35 1.65 111 98 33
Garrison 0.43 0.17 0.67 0.60 0.23 1.93 1.40 3.75 2.45 2.11 1.68 2.00 139 175 72
Kenmare 1WSW 0.93 0.95 1.67 0.56 0.49 0.39 1.37 3.41 2.75 0.27 0.64 0.00 124 155 90
Lake Metigoshe 2.58 1.61 1.37 0.89 0.14 0.02 0.74 5.08 6.72 1.98 0.00 0.00 112 178 187
Lansford 1.15 0.84 1.60 1.05 0.33 0.97 2.01 5.04 4.40 2.41 0.25 1.25 158 216 108
Maddock M M M M M M M M M M 1.50 M M* M* M*
McClusky 1.04 0.66 1.90 1.13 0.11 1.90 1.36 4.15 3.14 4.60 3.10 M 160 180 83
Minot ASOS 0.61 0.26 0.73 0.42 0.06 0.80 1.34 6.22 2.89 5.53 2.18 1.52 78 253 86
Minot Exp Sta 0.95 1.11 2.65 0.78 0.43 1.26 1.65 6.93 3.02 3.95 1.09 2.74 175 304 93
Mohall 1.12 0.05 0.87 0.00 0.17 0.93 1.63 5.18 4.08 4.27 0.97 M 101 243 124
Rolette 2SE 1.29 1.10 2.90 0.16 0.20 0.00 0.74 3.62 3.23 5.00 1.27 2.06 M* M* M*
Sherwood 3N M M M M M M 0.01 5.32 1.18 2.99 0.80 0.75 M* 276 40
Stanley 0.73 0.94 1.37 0.82 0.57 0.66 2.02 6.96 3.50 5.30 2.05 0.42 151 275 91
Tagus 0.44 0.50 1.07 0.86 0.26 1.12 2.19 6.32 3.70 3.75 0.36 M 149 307 109
Towner 2NE 1.14 0.60 1.74 0.97 0.26 0.61 0.11 3.44 0.55 3.08 0.20 1.50 107 161 18
Turtle Lake 0.82 1.60 1.99 0.33 0.08 0.88 0.52 2.95 2.06 4.36 1.96 2.31 132 132 56
Underwood 0.44 1.07 2.27 0.76 0.32 2.27 0.38 0.08 2.89 3.77 3.55 1.48 157 3 78
Upham 3N 1.22 0.83 1.71 1.05 0.23 0.64 1.58 4.98 7.05 3.28 0.58 1.21 143 229 198
Velva 3NWE 0.84 1.03 1.59 1.04 0.00 1.30 0.00 1.50 0.00 0.00 M M 113 63 0
Westhope 1.63 1.03 1.33 1.03 0.40 0.64 2.65 5.25 5.18 2.44 1.15 M 193 260 162
Willow City 0.91 0.51 1.37 0.78 0.18 0.00 0.53 3.32 5.01 4.68 1.23 1.19 91 167 162
NOTE: “M” indicates missing data; “0.0” indicates trace or less precipitation; incomplete or partial records for some years at some locations. Data source – High Plains Regional Climate Center, National Weather Service ‘*’ means an average was not available.
USACE, St. Paul District – 2011 Post-Flood Report for the Souris River Basin – Revised March 2012 Page 6
Table 3-3: Monthly Precipitation Totals in Millimetres (October 2010 – September 2011) And Percent of Average: Souris River Basin Manitoba
Station
Nov Dec Jan Feb Mar Apr May Jun Jul Aug Sep
Nov-Apr May Jun
Oct % of % of % of
Average Average Average
Baldur 64.1 43.0 47.8 40.0 10.5 8.0 63.2 106.7 80.4 37.8 46.2 M 135 164 90
Belmont 62.9 46.6 37.6 49.3 27.5 8.2 73.8 125.6 76.9 38.4 46.4 27.2 153 171 80
Brandon A 33.2 38.2 28.2 26.2 5.4 20.8 64.0 99.6 157.4 65.2 5.4 29.2 144 190 202
Carberry 31.4 4.3 M M M M 7.4 67.2 88.4 58.2 8.4 23.4 M* 97 112
Elkhorn 2 East 42.0 39.8 22.6 33.0 15.2 29.6 96.6 117.4 101.4 31.8 51.0 9.2 154 185 103
Melita 36.7 13.9 11.5 7.2 0.9 1.2 43.3 126.2 110.2 46.6 37.2 22.4 65 215 150
Rivers Pettapiece 37.0 30.2 38.9 42.1 5.2 9.7 57.3 95.6 141.6 61.9 24.1 8.0 147 159 184
Shoal Lake M M M M M M 16.8 119.0 77.8 36.2 19.0 21.0 M* 304 102
Strathclair 49.0 53.0 27.0 37.0 12.0 20.0 28.0 96.0 49.0 79.0 19.0 12.0 132 217 61
Virden Water 40.4 86.2 28.5 41.4 19.2 15.3 24.8 77.7 2.8 13.8 138.1 12.1 M* M* M*
NOTE: “M” indicates missing data; “0.0” indicates trace or less precipitation; incomplete or partial records for some years at some locations. Data source – Meteorological Service, Environment Canada. ‘*’ means an average was not available.
USACE, St. Paul District – 2011 Post-Flood Report for the Souris River Basin – Revised March 2012 Page 7
3.1.1 Fall The Northern Plains experienced a very wet fall in 2009 and 2010. Saskatchewan had record and near-record rainfalls in 2010 and surplus topsoil moisture in the upper Souris River and Moose Mountain Creek basins. In the fall of 2010, conditions in the Souris River watershed within Saskatchewan were far wetter than normal. The 90-day precipitation for August through October 2010 was 150-200 percent of average with an area centered on Weyburn just upstream of Rafferty reservoir being above 200 percent. Some areas in North Dakota have been in a very wet cycle for over 10 years. North Dakota experienced the 9th wettest fall since 1895. Minot, North Dakota set a new rainfall record on Sep 6th, 2010, recording 1.64 in (41.7 mm) of rain (previous record was 0.66 in (16.8 mm) in 2000). North Dakota soils were saturated going into the 2010/11 winter. The lower Souris River basin in Manitoba had well above normal (150-200 percent of normal) soil moisture at the time of freeze-up. Figures 3-2 and 3-3 in Appendix A show the soil moisture graphically. 3.1.2 Winter The development of La Nina during the summer of 2010 set the stage for a potentially active winter storm season, colder and wetter. La Nina conditions persisted through the winter into spring, resulting in a storm track that brought near to record snowfall across parts of the Northern Plains and Rockies. Precipitation continued throughout the winter, but there were discrepancies within and between data sources. As winter progressed in Saskatchewan it became increasingly more apparent that a significant spring snowmelt event was developing. By April 1st runoff for the Souris was estimated to be varying from between “well above normal” to “very high”; as can be seen in Figure 3-4 in Appendix A. North Dakota’s winter was colder and wetter than historical norms. It was the 11th wettest winter since 1895. Even though February was dry, overall winter precipitation was above normal. A major storm in December broke records at Dickinson, Bismarck, Minot and Williston. As of March 31st Minot recorded its 4th snowiest winter since 1905. The winter of 2010-2011 brought a higher-than-normal snowfall accumulation of up to 4.7 in (120 mm) of snow water equivalent over the Souris River Watershed in Manitoba. Precipitation during the winter (November-April) generally ranged from about 100 to 150 percent of the long-term seasonal average in North Dakota, 50 to 150 percent of the long-term seasonal average in Saskatchewan and between 130 to 150 percent of the long-term seasonal average in Manitoba. 3.1.3 Snow Surveys
Snow surveys were obtained by different sources throughout the winter to determine the snow water equivalent (SWE) of the snowpack. These surveys were timely and very helpful to forecasters and emergency response preparations.
USACE, St. Paul District – 2011 Post-Flood Report for the Souris River Basin – Revised March 2012 Page 8
National Weather Service (NWS) Airborne Gamma surveys of SWE were obtained from January through early April. Graphical displays of the SWE data can be seen at http://www.nohrsc.noaa.gov/snowsurvey/historical.html?season=2010-2011.
o Saskatchewan portions of the Souris basin: February 18th and 20th: 4 in (105 mm)
o North Dakota portions of the Souris basin: January 12th: 3-3.5 in (75-90 mm) February 1st and 3rd: 3.5-4 in (90-105 mm) April 4th and 6th: 3-4.5 in (75-105 mm)
o Manitoba portions of the Souris basin: February 18th and 20th: 4 in (105 mm)
Saskatchewan Watershed Authority snow surveys of SWE in Saskatchewan for the end of February:
o Long Creek Basin: 2.75 in (70 mm) o Above Rafferty Dam: 3.25 in (80 mm) o Moose Mountain Basin: 3.5 in (90 mm) in the upper portion to 2 in (50 mm) in the
lower portion. Over the weekend of April 2nd-3rd, 12 in (305 mm) of wet snow was reported in Weyburn and
5 in (130 mm) in Estevan. U.S. Army Corps of Engineers snow surveys of SWE in North Dakota for the end of
February: o Des Lacs Basin: 2 in (50 mm) o Minot Area: 1.25 in (33 mm) o Towner to the International Border near Westhope, ND: 3.25 in (80 mm)
Environment Canada estimated SWE to be approximately 200 percent of normal in the southern portion of the basin and 150 percent normal in the northern portion of the basin on February 1st.
The NWS National Operational Hydrologic Remote Sensing Center (NOHRSC) site shows daily maps of modeled SWE. The below list shows the average SWE at the beginning of each month from January through April. See Figures 3-5 to 3-8 in Appendix A for graphical displays of this SWE data.
o Saskatchewan portions of the Souris basin: January 1st: 4 in (105 mm) February 1st: 5 in (130 mm) March 1st: 4 in (105 mm) April 1st: 5 in (130 mm)
o North Dakota portions of the Souris basin: January 1st: 3 in (75 mm) February 1st: 4-4.5 in (105-115 mm) March 1st: 3.5 in (90 mm) April 1st: 4 in (105 mm)
o Manitoba portions of the Souris basin: January 1st: 2.5 in (65 mm) February 1st: 3 in (75 mm) March 1st: 3.5 in (90 mm) April 1st: 4 in (105 mm)
USACE, St. Paul District – 2011 Post-Flood Report for the Souris River Basin – Revised March 2012 Page 9
3.2 Flood Conditions
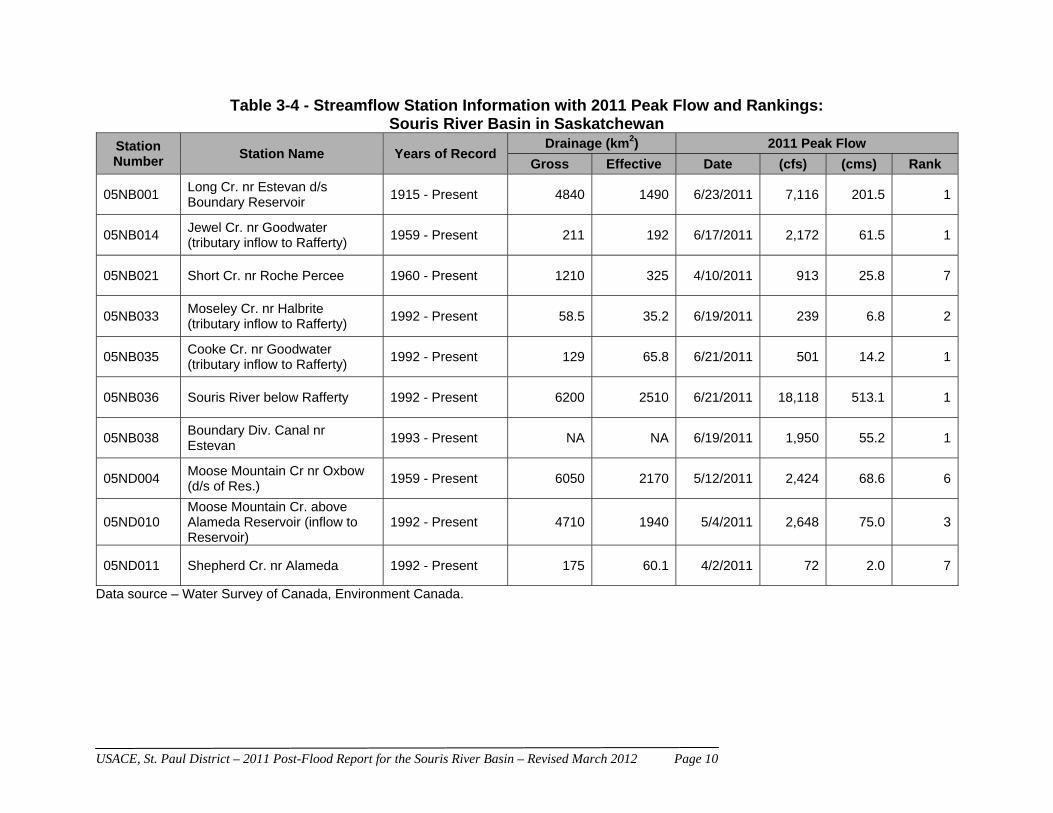
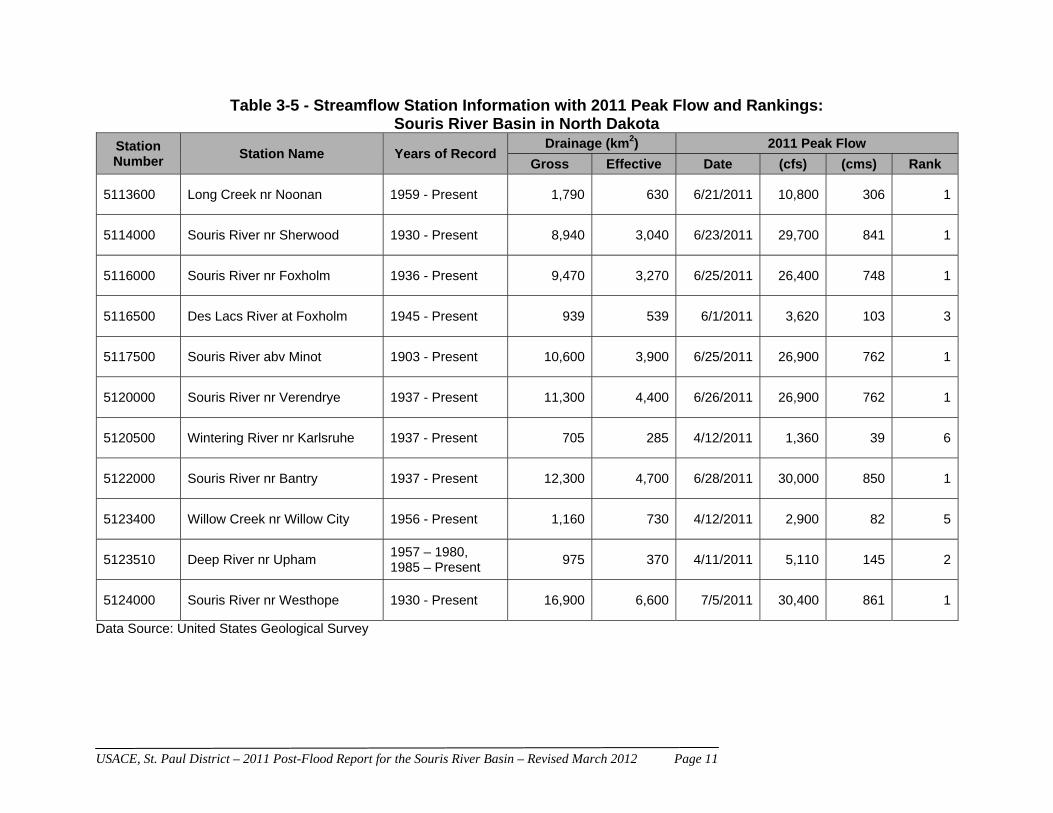
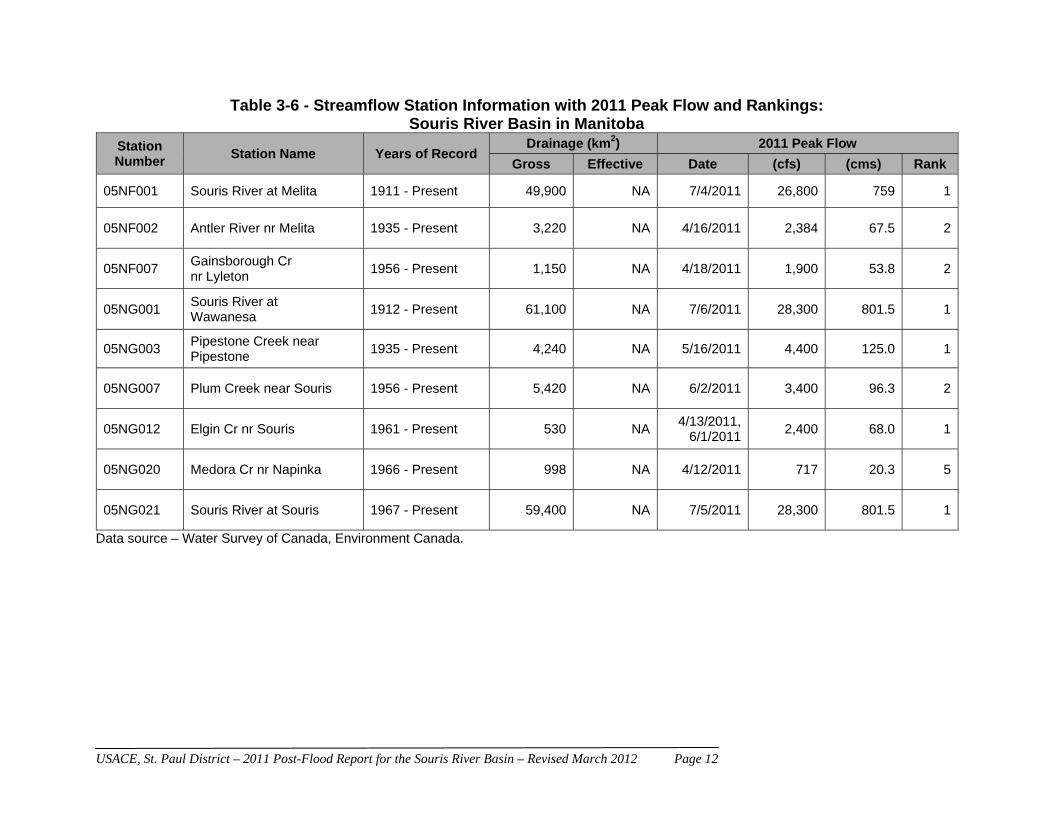
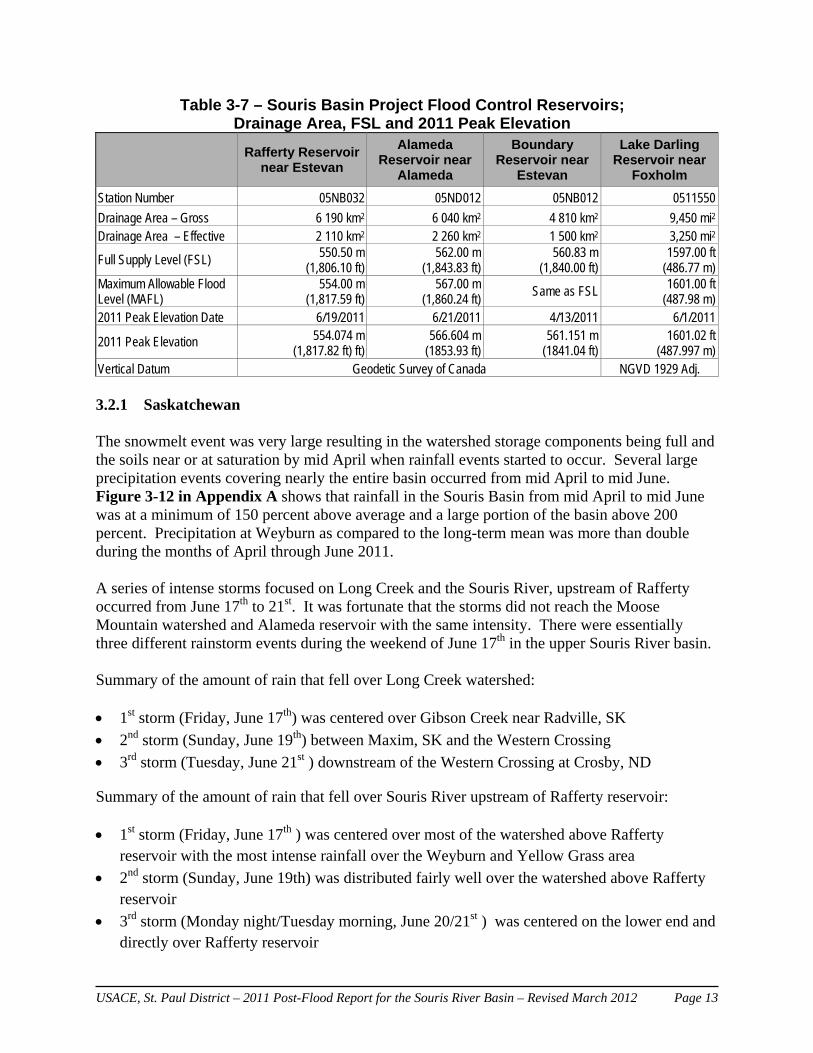
In addition to the heavy snowpack, the basin received substantial rainfall in the spring and summer. Storms frequented the region approximately every four to seven days, with each delivering around 2-4 in (50-100 mm) of rain over a large area. Graphical plots of precipitation data for several time periods between April 1 and June 25 are shown in Figures 3-9 to 3-15 in Appendix A. During the 2011 runoff event, water level and flow data were collected using the existing stream gauge network (Figure 3-16 in Appendix A) within the Souris basin established by Water Survey of Canada, Saskatchewan Water Corporation, the U.S. Geological Survey, and Manitoba Water Stewardship. The gauging network can be seen as an interactive map located at: http://nd.water.usgs.gov/floodinfo/souris.html. Additional information about the active hydrometric stations in Saskatchewan, North Dakota, and Manitoba, as of October 2011, may be found in table form in Appendix B. In addition to the active hydrometric network, temporary rapid deployment gauges were used for some key ungauged locations in North Dakota such as the Des Lacs River at Burlinton and the Souris River at Logan. Six of these gauges were funded by the North Dakota State Water Commission and installed and maintained by the USGS during the 2011 flood event. These gauges provided useful information for regulation decisions and emergency response. Hydrometric data from some of the key stations of interest are shown in Tables 3-4 to 3-6. These tables include flow rankings that show flows along the Souris River from Estevan, SK through North Dakota to Wawanesa, MB were the highest of record and that many tributaries to the Souris River throughout the basin also experienced levels that were the highest of record or within the top 10 highest of record. Table 3-7 shows the peak instantaneous elevations for the flood control reservoirs of the Souris Basin Project for 2011, along with their respective Full Supply Level (FSL). As for the mainstem Souris River streamflow stations, these reservoirs all reached record levels. Reservoir operations including levels and flows are discussed in Section 6 of this report. Hydrographs of river flows at key gauging stations on Long Creak near Noonan, Long Creek near Estevan, Souris River below Rafferty reservoir, Moose Mountain Creek at Oxbow, Des Lacs at Foxhom and the Souris mainstem at Sherwood, Foxholm, Minot, Verendrye, Bantry, Westhope, Melita, Souris and Wawanesa are shown in Figures 3-17 to 3-30 in Appendix A. Figure 3-31 in Appendix A is from USGS’s WaterWatch website. It shows the 7-day average flow for Sherwood and Westhope plotted against the historical 7-day average flow.
In 2011 there were three distinct runoff periods: the spring snowmelt in April and early May, a series of moderate rainfall events in May and early June and the large rainfall event of June 17th and 19th in Saskatchewan.
USACE, St. Paul District – 2011 Post-Flood Report for the Souris River Basin – Revised March 2012 Page 10
Table 3-4 - Streamflow Station Information with 2011 Peak Flow and Rankings: Souris River Basin in Saskatchewan
Station Number
Station Name Years of Record Drainage (km2) 2011 Peak Flow
Gross Effective Date (cfs) (cms) Rank
05NB001 Long Cr. nr Estevan d/s Boundary Reservoir
1915 - Present 4840 1490 6/23/2011 7,116 201.5 1
05NB014 Jewel Cr. nr Goodwater (tributary inflow to Rafferty)
1959 - Present 211 192 6/17/2011 2,172 61.5 1
05NB021 Short Cr. nr Roche Percee 1960 - Present 1210 325 4/10/2011 913 25.8 7
05NB033 Moseley Cr. nr Halbrite (tributary inflow to Rafferty)
1992 - Present 58.5 35.2 6/19/2011 239 6.8 2
05NB035 Cooke Cr. nr Goodwater (tributary inflow to Rafferty)
1992 - Present 129 65.8 6/21/2011 501 14.2 1
05NB036 Souris River below Rafferty 1992 - Present 6200 2510 6/21/2011 18,118 513.1 1
05NB038 Boundary Div. Canal nr Estevan
1993 - Present NA NA 6/19/2011 1,950 55.2 1
05ND004 Moose Mountain Cr nr Oxbow (d/s of Res.)
1959 - Present 6050 2170 5/12/2011 2,424 68.6 6
05ND010 Moose Mountain Cr. above Alameda Reservoir (inflow to Reservoir)
1992 - Present 4710 1940 5/4/2011 2,648 75.0 3
05ND011 Shepherd Cr. nr Alameda 1992 - Present 175 60.1 4/2/2011 72 2.0 7
Data source – Water Survey of Canada, Environment Canada.
USACE, St. Paul District – 2011 Post-Flood Report for the Souris River Basin – Revised March 2012 Page 11
Table 3-5 - Streamflow Station Information with 2011 Peak Flow and Rankings: Souris River Basin in North Dakota
Station Number
Station Name Years of Record Drainage (km2) 2011 Peak Flow
Gross Effective Date (cfs) (cms) Rank
5113600 Long Creek nr Noonan 1959 - Present 1,790 630 6/21/2011 10,800 306 1
5114000 Souris River nr Sherwood 1930 - Present 8,940 3,040 6/23/2011 29,700 841 1
5116000 Souris River nr Foxholm 1936 - Present 9,470 3,270 6/25/2011 26,400 748 1
5116500 Des Lacs River at Foxholm 1945 - Present 939 539 6/1/2011 3,620 103 3
5117500 Souris River abv Minot 1903 - Present 10,600 3,900 6/25/2011 26,900 762 1
5120000 Souris River nr Verendrye 1937 - Present 11,300 4,400 6/26/2011 26,900 762 1
5120500 Wintering River nr Karlsruhe 1937 - Present 705 285 4/12/2011 1,360 39 6
5122000 Souris River nr Bantry 1937 - Present 12,300 4,700 6/28/2011 30,000 850 1
5123400 Willow Creek nr Willow City 1956 - Present 1,160 730 4/12/2011 2,900 82 5
5123510 Deep River nr Upham 1957 – 1980, 1985 – Present
975 370 4/11/2011 5,110 145 2
5124000 Souris River nr Westhope 1930 - Present 16,900 6,600 7/5/2011 30,400 861 1
Data Source: United States Geological Survey
USACE, St. Paul District – 2011 Post-Flood Report for the Souris River Basin – Revised March 2012 Page 12
Table 3-6 - Streamflow Station Information with 2011 Peak Flow and Rankings: Souris River Basin in Manitoba
Station Number
Station Name Years of Record Drainage (km2) 2011 Peak Flow
Gross Effective Date (cfs) (cms) Rank
05NF001 Souris River at Melita 1911 - Present 49,900 NA 7/4/2011 26,800 759 1
05NF002 Antler River nr Melita 1935 - Present 3,220 NA 4/16/2011 2,384 67.5 2
05NF007 Gainsborough Cr nr Lyleton
1956 - Present 1,150 NA 4/18/2011 1,900 53.8 2
05NG001 Souris River at Wawanesa
1912 - Present 61,100 NA 7/6/2011 28,300 801.5 1
05NG003 Pipestone Creek near Pipestone
1935 - Present 4,240 NA 5/16/2011 4,400 125.0 1
05NG007 Plum Creek near Souris 1956 - Present 5,420 NA 6/2/2011 3,400 96.3 2
05NG012 Elgin Cr nr Souris 1961 - Present 530 NA 4/13/2011,
6/1/20112,400 68.0 1
05NG020 Medora Cr nr Napinka 1966 - Present 998 NA 4/12/2011 717 20.3 5
05NG021 Souris River at Souris 1967 - Present 59,400 NA 7/5/2011 28,300 801.5 1
Data source – Water Survey of Canada, Environment Canada.
USACE, St. Paul District – 2011 Post-Flood Report for the Souris River Basin – Revised March 2012 Page 13
Table 3-7 – Souris Basin Project Flood Control Reservoirs; Drainage Area, FSL and 2011 Peak Elevation
Rafferty Reservoir
near Estevan
Alameda Reservoir near
Alameda
Boundary Reservoir near
Estevan
Lake Darling Reservoir near
Foxholm
Station Number 05NB032 05ND012 05NB012 0511550
Drainage Area – Gross 6 190 km2 6 040 km2 4 810 km2 9,450 mi2 Drainage Area – Effective 2 110 km2 2 260 km2 1 500 km2 3,250 mi2
Full Supply Level (FSL) 550.50 m (1,806.10 ft)
562.00 m (1,843.83 ft)
560.83 m (1,840.00 ft)
1597.00 ft (486.77 m)
Maximum Allowable Flood Level (MAFL)
554.00 m (1,817.59 ft)
567.00 m (1,860.24 ft)
Same as FSL 1601.00 ft (487.98 m)
2011 Peak Elevation Date 6/19/2011 6/21/2011 4/13/2011 6/1/2011
2011 Peak Elevation 554.074 m (1,817.82 ft) ft)
566.604 m (1853.93 ft)
561.151 m (1841.04 ft)
1601.02 ft (487.997 m)
Vertical Datum Geodetic Survey of Canada NGVD 1929 Adj. 3.2.1 Saskatchewan The snowmelt event was very large resulting in the watershed storage components being full and the soils near or at saturation by mid April when rainfall events started to occur. Several large precipitation events covering nearly the entire basin occurred from mid April to mid June. Figure 3-12 in Appendix A shows that rainfall in the Souris Basin from mid April to mid June was at a minimum of 150 percent above average and a large portion of the basin above 200 percent. Precipitation at Weyburn as compared to the long-term mean was more than double during the months of April through June 2011. A series of intense storms focused on Long Creek and the Souris River, upstream of Rafferty occurred from June 17th to 21st. It was fortunate that the storms did not reach the Moose Mountain watershed and Alameda reservoir with the same intensity. There were essentially three different rainstorm events during the weekend of June 17th in the upper Souris River basin. Summary of the amount of rain that fell over Long Creek watershed: 1st storm (Friday, June 17th) was centered over Gibson Creek near Radville, SK
2nd storm (Sunday, June 19th) between Maxim, SK and the Western Crossing
3rd storm (Tuesday, June 21st ) downstream of the Western Crossing at Crosby, ND
Summary of the amount of rain that fell over Souris River upstream of Rafferty reservoir: 1st storm (Friday, June 17th ) was centered over most of the watershed above Rafferty
reservoir with the most intense rainfall over the Weyburn and Yellow Grass area
2nd storm (Sunday, June 19th) was distributed fairly well over the watershed above Rafferty reservoir
3rd storm (Monday night/Tuesday morning, June 20/21st ) was centered on the lower end and directly over Rafferty reservoir
USACE, St. Paul District – 2011 Post-Flood Report for the Souris River Basin – Revised March 2012 Page 14
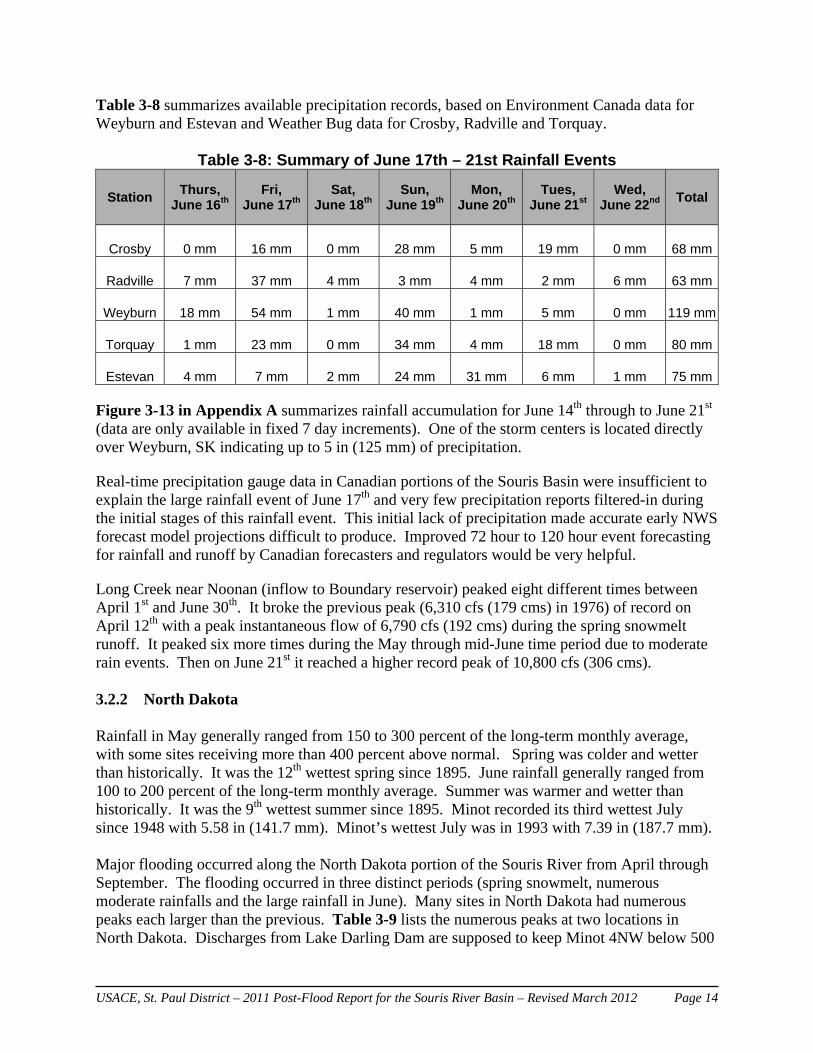
Table 3-8 summarizes available precipitation records, based on Environment Canada data for Weyburn and Estevan and Weather Bug data for Crosby, Radville and Torquay.
Table 3-8: Summary of June 17th – 21st Rainfall Events
Station Thurs,
June 16th Fri,
June 17th Sat,
June 18thSun,
June 19thMon,
June 20thTues,
June 21st Wed,
June 22nd Total
Crosby 0 mm 16 mm 0 mm 28 mm 5 mm 19 mm 0 mm 68 mm
Radville 7 mm 37 mm 4 mm 3 mm 4 mm 2 mm 6 mm 63 mm
Weyburn 18 mm 54 mm 1 mm 40 mm 1 mm 5 mm 0 mm 119 mm
Torquay 1 mm 23 mm 0 mm 34 mm 4 mm 18 mm 0 mm 80 mm
Estevan 4 mm 7 mm 2 mm 24 mm 31 mm 6 mm 1 mm 75 mm
Figure 3-13 in Appendix A summarizes rainfall accumulation for June 14th through to June 21st (data are only available in fixed 7 day increments). One of the storm centers is located directly over Weyburn, SK indicating up to 5 in (125 mm) of precipitation.
Real-time precipitation gauge data in Canadian portions of the Souris Basin were insufficient to explain the large rainfall event of June 17th and very few precipitation reports filtered-in during the initial stages of this rainfall event. This initial lack of precipitation made accurate early NWS forecast model projections difficult to produce. Improved 72 hour to 120 hour event forecasting for rainfall and runoff by Canadian forecasters and regulators would be very helpful.
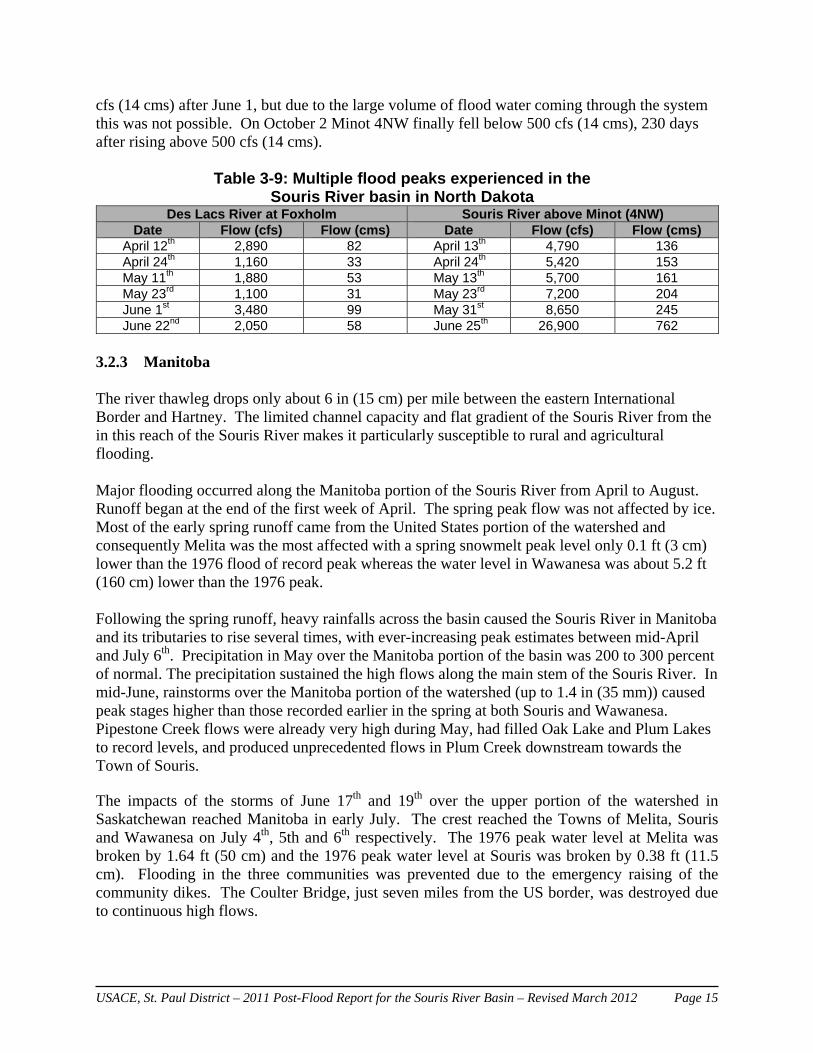
Long Creek near Noonan (inflow to Boundary reservoir) peaked eight different times between April 1st and June 30th. It broke the previous peak (6,310 cfs (179 cms) in 1976) of record on April 12th with a peak instantaneous flow of 6,790 cfs (192 cms) during the spring snowmelt runoff. It peaked six more times during the May through mid-June time period due to moderate rain events. Then on June 21st it reached a higher record peak of 10,800 cfs (306 cms). 3.2.2 North Dakota Rainfall in May generally ranged from 150 to 300 percent of the long-term monthly average, with some sites receiving more than 400 percent above normal. Spring was colder and wetter than historically. It was the 12th wettest spring since 1895. June rainfall generally ranged from 100 to 200 percent of the long-term monthly average. Summer was warmer and wetter than historically. It was the 9th wettest summer since 1895. Minot recorded its third wettest July since 1948 with 5.58 in (141.7 mm). Minot’s wettest July was in 1993 with 7.39 in (187.7 mm). Major flooding occurred along the North Dakota portion of the Souris River from April through September. The flooding occurred in three distinct periods (spring snowmelt, numerous moderate rainfalls and the large rainfall in June). Many sites in North Dakota had numerous peaks each larger than the previous. Table 3-9 lists the numerous peaks at two locations in North Dakota. Discharges from Lake Darling Dam are supposed to keep Minot 4NW below 500
USACE, St. Paul District – 2011 Post-Flood Report for the Souris River Basin – Revised March 2012 Page 15
cfs (14 cms) after June 1, but due to the large volume of flood water coming through the system this was not possible. On October 2 Minot 4NW finally fell below 500 cfs (14 cms), 230 days after rising above 500 cfs (14 cms).
Table 3-9: Multiple flood peaks experienced in the Souris River basin in North Dakota
Des Lacs River at Foxholm Souris River above Minot (4NW) Date Flow (cfs) Flow (cms) Date Flow (cfs) Flow (cms)
April 12th 2,890 82 April 13th 4,790 136 April 24th 1,160 33 April 24th 5,420 153 May 11th 1,880 53 May 13th 5,700 161 May 23rd 1,100 31 May 23rd 7,200 204 June 1st 3,480 99 May 31st 8,650 245 June 22nd 2,050 58 June 25th 26,900 762
3.2.3 Manitoba The river thawleg drops only about 6 in (15 cm) per mile between the eastern International Border and Hartney. The limited channel capacity and flat gradient of the Souris River from the in this reach of the Souris River makes it particularly susceptible to rural and agricultural flooding. Major flooding occurred along the Manitoba portion of the Souris River from April to August. Runoff began at the end of the first week of April. The spring peak flow was not affected by ice. Most of the early spring runoff came from the United States portion of the watershed and consequently Melita was the most affected with a spring snowmelt peak level only 0.1 ft (3 cm) lower than the 1976 flood of record peak whereas the water level in Wawanesa was about 5.2 ft (160 cm) lower than the 1976 peak.
Following the spring runoff, heavy rainfalls across the basin caused the Souris River in Manitoba and its tributaries to rise several times, with ever-increasing peak estimates between mid-April and July 6th. Precipitation in May over the Manitoba portion of the basin was 200 to 300 percent of normal. The precipitation sustained the high flows along the main stem of the Souris River. In mid-June, rainstorms over the Manitoba portion of the watershed (up to 1.4 in (35 mm)) caused peak stages higher than those recorded earlier in the spring at both Souris and Wawanesa. Pipestone Creek flows were already very high during May, had filled Oak Lake and Plum Lakes to record levels, and produced unprecedented flows in Plum Creek downstream towards the Town of Souris. The impacts of the storms of June 17th and 19th over the upper portion of the watershed in Saskatchewan reached Manitoba in early July. The crest reached the Towns of Melita, Souris and Wawanesa on July 4th, 5th and 6th respectively. The 1976 peak water level at Melita was broken by 1.64 ft (50 cm) and the 1976 peak water level at Souris was broken by 0.38 ft (11.5 cm). Flooding in the three communities was prevented due to the emergency raising of the community dikes. The Coulter Bridge, just seven miles from the US border, was destroyed due to continuous high flows.
USACE, St. Paul District – 2011 Post-Flood Report for the Souris River Basin – Revised March 2012 Page 16
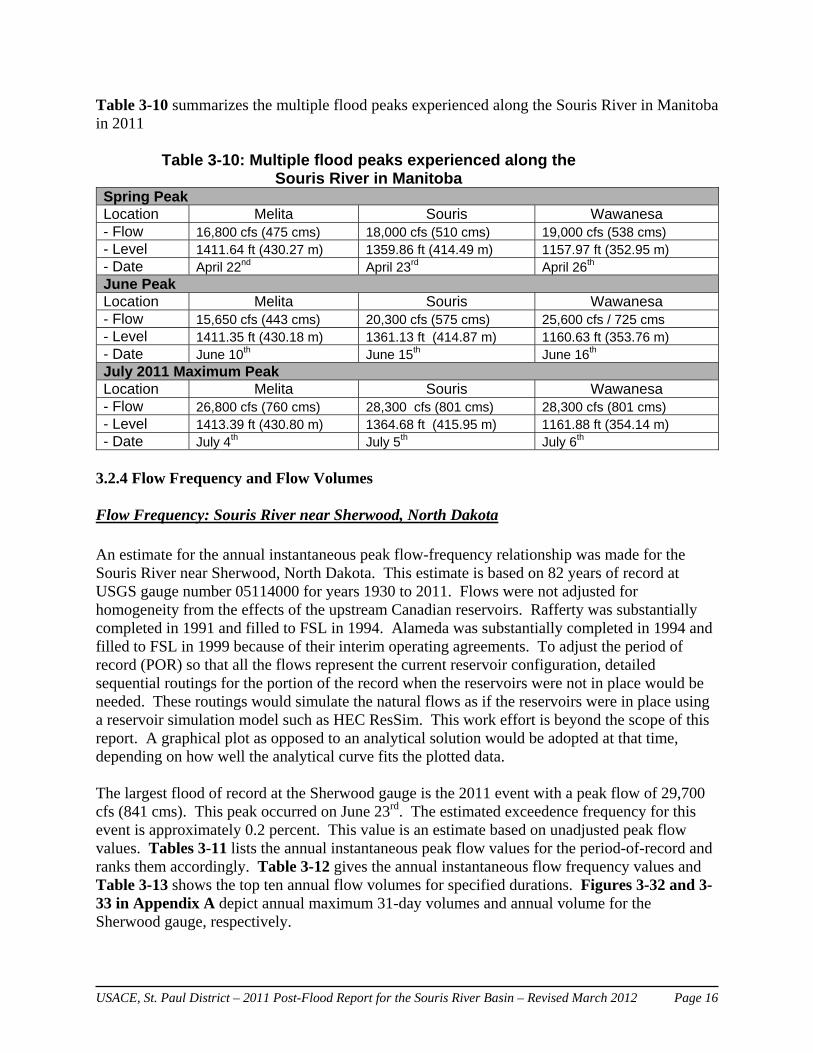
Table 3-10 summarizes the multiple flood peaks experienced along the Souris River in Manitoba in 2011
Table 3-10: Multiple flood peaks experienced along the Souris River in Manitoba
Spring Peak Location Melita Souris Wawanesa - Flow 16,800 cfs (475 cms) 18,000 cfs (510 cms) 19,000 cfs (538 cms) - Level 1411.64 ft (430.27 m) 1359.86 ft (414.49 m) 1157.97 ft (352.95 m) - Date April 22nd April 23rd April 26th June Peak Location Melita Souris Wawanesa - Flow 15,650 cfs (443 cms) 20,300 cfs (575 cms) 25,600 cfs / 725 cms - Level 1411.35 ft (430.18 m) 1361.13 ft (414.87 m) 1160.63 ft (353.76 m) - Date June 10th June 15th June 16th July 2011 Maximum Peak Location Melita Souris Wawanesa - Flow 26,800 cfs (760 cms) 28,300 cfs (801 cms) 28,300 cfs (801 cms) - Level 1413.39 ft (430.80 m) 1364.68 ft (415.95 m) 1161.88 ft (354.14 m) - Date July 4th July 5th July 6th
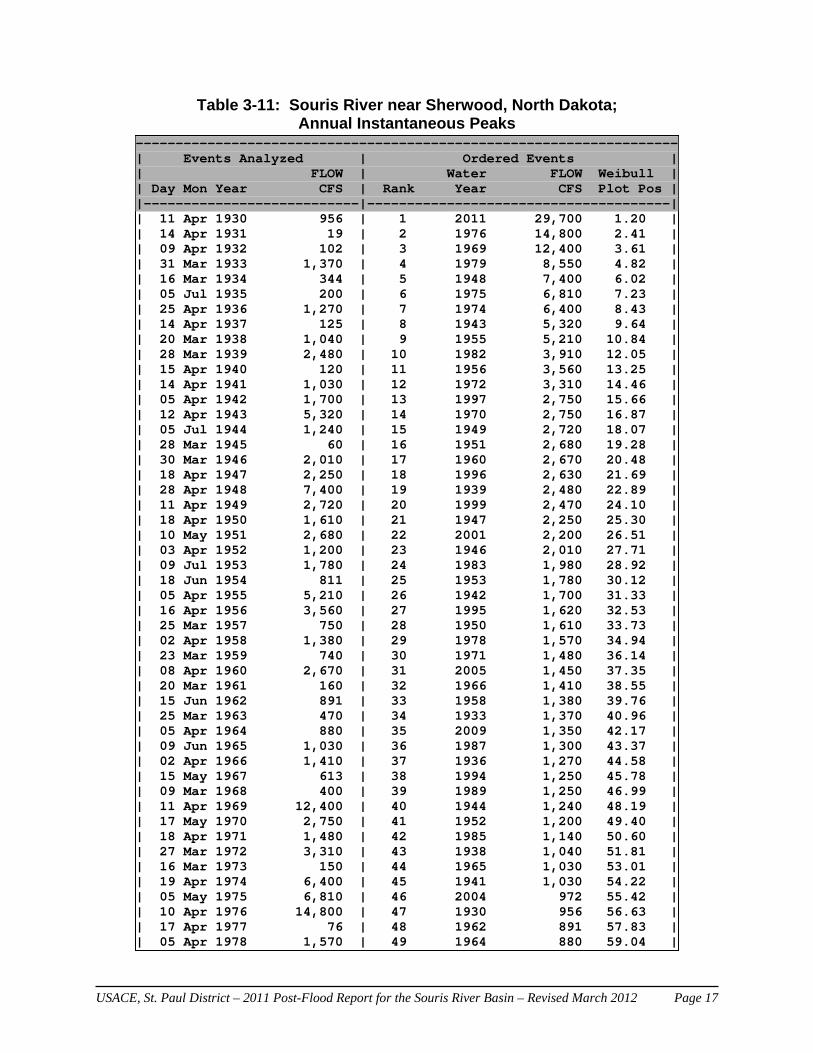
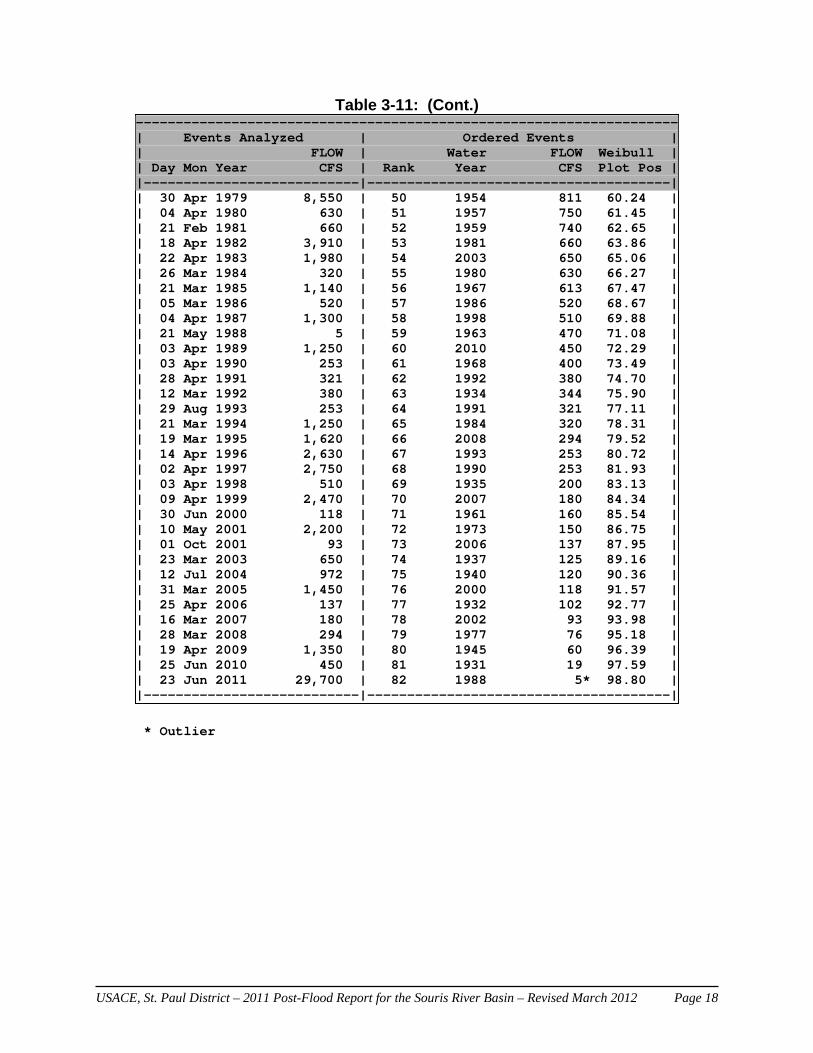
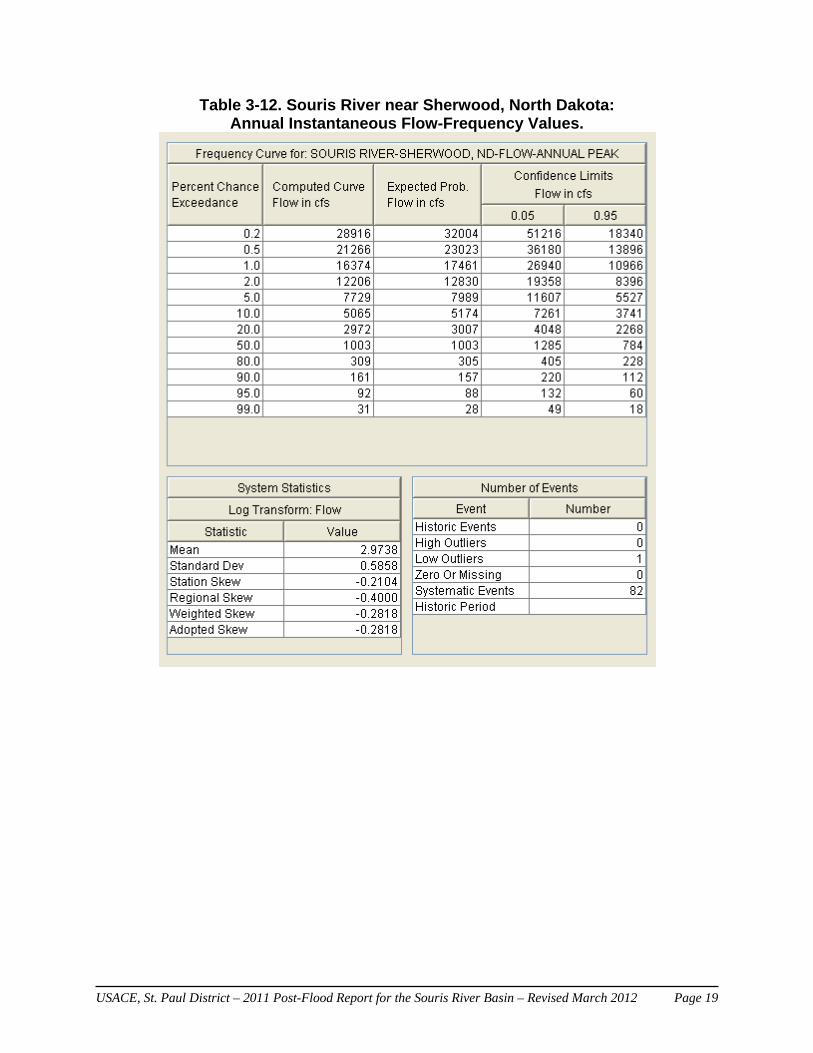
3.2.4 Flow Frequency and Flow Volumes Flow Frequency: Souris River near Sherwood, North Dakota An estimate for the annual instantaneous peak flow-frequency relationship was made for the Souris River near Sherwood, North Dakota. This estimate is based on 82 years of record at USGS gauge number 05114000 for years 1930 to 2011. Flows were not adjusted for homogeneity from the effects of the upstream Canadian reservoirs. Rafferty was substantially completed in 1991 and filled to FSL in 1994. Alameda was substantially completed in 1994 and filled to FSL in 1999 because of their interim operating agreements. To adjust the period of record (POR) so that all the flows represent the current reservoir configuration, detailed sequential routings for the portion of the record when the reservoirs were not in place would be needed. These routings would simulate the natural flows as if the reservoirs were in place using a reservoir simulation model such as HEC ResSim. This work effort is beyond the scope of this report. A graphical plot as opposed to an analytical solution would be adopted at that time, depending on how well the analytical curve fits the plotted data. The largest flood of record at the Sherwood gauge is the 2011 event with a peak flow of 29,700 cfs (841 cms). This peak occurred on June 23rd. The estimated exceedence frequency for this event is approximately 0.2 percent. This value is an estimate based on unadjusted peak flow values. Tables 3-11 lists the annual instantaneous peak flow values for the period-of-record and ranks them accordingly. Table 3-12 gives the annual instantaneous flow frequency values and Table 3-13 shows the top ten annual flow volumes for specified durations. Figures 3-32 and 3-33 in Appendix A depict annual maximum 31-day volumes and annual volume for the Sherwood gauge, respectively.
USACE, St. Paul District – 2011 Post-Flood Report for the Souris River Basin – Revised March 2012 Page 17
Table 3-11: Souris River near Sherwood, North Dakota; Annual Instantaneous Peaks
--------------------------------------------------------------------| Events Analyzed | Ordered Events || FLOW | Water FLOW Weibull || Day Mon Year CFS | Rank Year CFS Plot Pos ||---------------------------|--------------------------------------|| 11 Apr 1930 956 | 1 2011 29,700 1.20 || 14 Apr 1931 19 | 2 1976 14,800 2.41 || 09 Apr 1932 102 | 3 1969 12,400 3.61 || 31 Mar 1933 1,370 | 4 1979 8,550 4.82 || 16 Mar 1934 344 | 5 1948 7,400 6.02 || 05 Jul 1935 200 | 6 1975 6,810 7.23 || 25 Apr 1936 1,270 | 7 1974 6,400 8.43 || 14 Apr 1937 125 | 8 1943 5,320 9.64 || 20 Mar 1938 1,040 | 9 1955 5,210 10.84 || 28 Mar 1939 2,480 | 10 1982 3,910 12.05 || 15 Apr 1940 120 | 11 1956 3,560 13.25 || 14 Apr 1941 1,030 | 12 1972 3,310 14.46 || 05 Apr 1942 1,700 | 13 1997 2,750 15.66 || 12 Apr 1943 5,320 | 14 1970 2,750 16.87 || 05 Jul 1944 1,240 | 15 1949 2,720 18.07 || 28 Mar 1945 60 | 16 1951 2,680 19.28 || 30 Mar 1946 2,010 | 17 1960 2,670 20.48 || 18 Apr 1947 2,250 | 18 1996 2,630 21.69 || 28 Apr 1948 7,400 | 19 1939 2,480 22.89 || 11 Apr 1949 2,720 | 20 1999 2,470 24.10 || 18 Apr 1950 1,610 | 21 1947 2,250 25.30 || 10 May 1951 2,680 | 22 2001 2,200 26.51 || 03 Apr 1952 1,200 | 23 1946 2,010 27.71 || 09 Jul 1953 1,780 | 24 1983 1,980 28.92 || 18 Jun 1954 811 | 25 1953 1,780 30.12 || 05 Apr 1955 5,210 | 26 1942 1,700 31.33 || 16 Apr 1956 3,560 | 27 1995 1,620 32.53 || 25 Mar 1957 750 | 28 1950 1,610 33.73 || 02 Apr 1958 1,380 | 29 1978 1,570 34.94 || 23 Mar 1959 740 | 30 1971 1,480 36.14 || 08 Apr 1960 2,670 | 31 2005 1,450 37.35 || 20 Mar 1961 160 | 32 1966 1,410 38.55 || 15 Jun 1962 891 | 33 1958 1,380 39.76 || 25 Mar 1963 470 | 34 1933 1,370 40.96 || 05 Apr 1964 880 | 35 2009 1,350 42.17 || 09 Jun 1965 1,030 | 36 1987 1,300 43.37 || 02 Apr 1966 1,410 | 37 1936 1,270 44.58 || 15 May 1967 613 | 38 1994 1,250 45.78 || 09 Mar 1968 400 | 39 1989 1,250 46.99 || 11 Apr 1969 12,400 | 40 1944 1,240 48.19 || 17 May 1970 2,750 | 41 1952 1,200 49.40 || 18 Apr 1971 1,480 | 42 1985 1,140 50.60 || 27 Mar 1972 3,310 | 43 1938 1,040 51.81 || 16 Mar 1973 150 | 44 1965 1,030 53.01 || 19 Apr 1974 6,400 | 45 1941 1,030 54.22 || 05 May 1975 6,810 | 46 2004 972 55.42 || 10 Apr 1976 14,800 | 47 1930 956 56.63 || 17 Apr 1977 76 | 48 1962 891 57.83 || 05 Apr 1978 1,570 | 49 1964 880 59.04 |
USACE, St. Paul District – 2011 Post-Flood Report for the Souris River Basin – Revised March 2012 Page 18
--------------------------------------------------------------------| Events Analyzed | Ordered Events || FLOW | Water FLOW Weibull || Day Mon Year CFS | Rank Year CFS Plot Pos ||---------------------------|--------------------------------------|| 30 Apr 1979 8,550 | 50 1954 811 60.24 || 04 Apr 1980 630 | 51 1957 750 61.45 || 21 Feb 1981 660 | 52 1959 740 62.65 || 18 Apr 1982 3,910 | 53 1981 660 63.86 || 22 Apr 1983 1,980 | 54 2003 650 65.06 || 26 Mar 1984 320 | 55 1980 630 66.27 || 21 Mar 1985 1,140 | 56 1967 613 67.47 || 05 Mar 1986 520 | 57 1986 520 68.67 || 04 Apr 1987 1,300 | 58 1998 510 69.88 || 21 May 1988 5 | 59 1963 470 71.08 || 03 Apr 1989 1,250 | 60 2010 450 72.29 || 03 Apr 1990 253 | 61 1968 400 73.49 || 28 Apr 1991 321 | 62 1992 380 74.70 || 12 Mar 1992 380 | 63 1934 344 75.90 || 29 Aug 1993 253 | 64 1991 321 77.11 || 21 Mar 1994 1,250 | 65 1984 320 78.31 || 19 Mar 1995 1,620 | 66 2008 294 79.52 || 14 Apr 1996 2,630 | 67 1993 253 80.72 || 02 Apr 1997 2,750 | 68 1990 253 81.93 || 03 Apr 1998 510 | 69 1935 200 83.13 || 09 Apr 1999 2,470 | 70 2007 180 84.34 || 30 Jun 2000 118 | 71 1961 160 85.54 || 10 May 2001 2,200 | 72 1973 150 86.75 || 01 Oct 2001 93 | 73 2006 137 87.95 || 23 Mar 2003 650 | 74 1937 125 89.16 || 12 Jul 2004 972 | 75 1940 120 90.36 || 31 Mar 2005 1,450 | 76 2000 118 91.57 || 25 Apr 2006 137 | 77 1932 102 92.77 || 16 Mar 2007 180 | 78 2002 93 93.98 || 28 Mar 2008 294 | 79 1977 76 95.18 || 19 Apr 2009 1,350 | 80 1945 60 96.39 || 25 Jun 2010 450 | 81 1931 19 97.59 || 23 Jun 2011 29,700 | 82 1988 5* 98.80 ||---------------------------|--------------------------------------|
Table 3-11: (Cont.)
* Outlier
USACE, St. Paul District – 2011 Post-Flood Report for the Souris River Basin – Revised March 2012 Page 19
Table 3-12. Souris River near Sherwood, North Dakota: Annual Instantaneous Flow-Frequency Values.
USACE, St. Paul District – 2011 Post-Flood Report for the Souris River Basin – Revised March 2012 Page 20
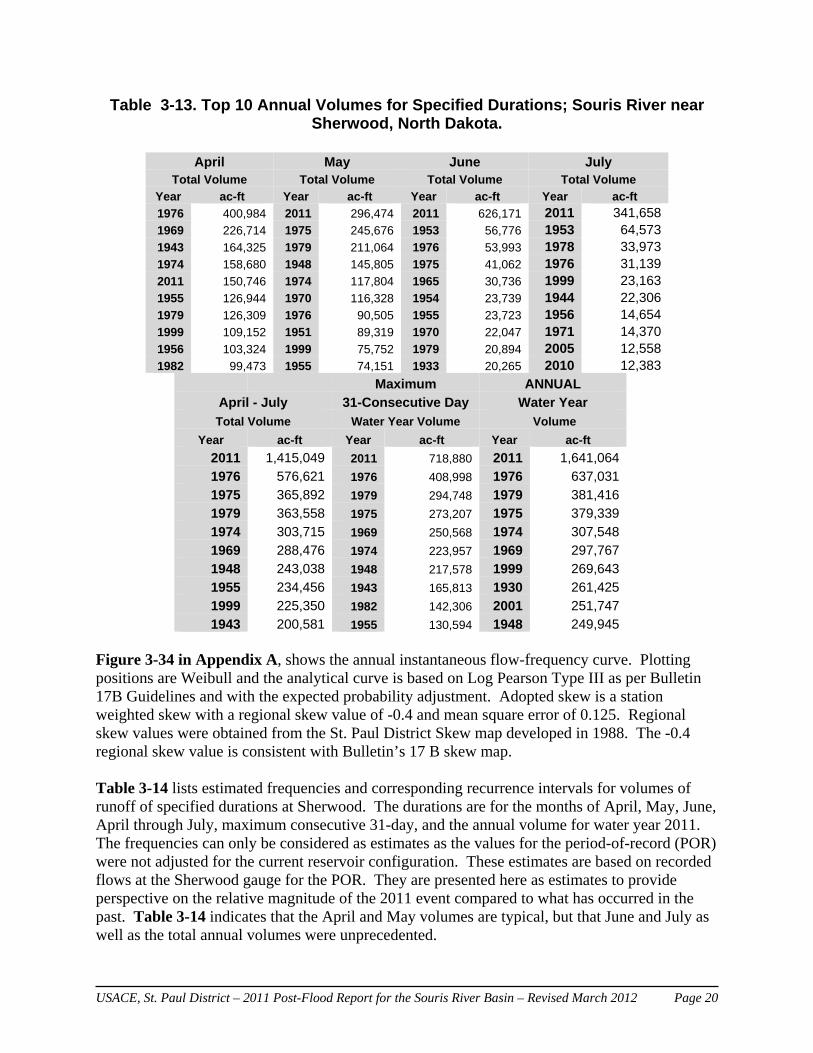
Table 3-13. Top 10 Annual Volumes for Specified Durations; Souris River near Sherwood, North Dakota.
Maximum ANNUAL April - July 31-Consecutive Day Water Year
Total Volume Water Year Volume Volume
Year ac-ft Year ac-ft Year ac-ft
2011 1,415,049 2011 718,880 2011 1,641,064
1976 576,621 1976 408,998 1976 637,031
1975 365,892 1979 294,748 1979 381,416 1979 363,558 1975 273,207 1975 379,339
1974 303,715 1969 250,568 1974 307,548
1969 288,476 1974 223,957 1969 297,767 1948 243,038 1948 217,578 1999 269,643
1955 234,456 1943 165,813 1930 261,425
1999 225,350 1982 142,306 2001 251,747 1943 200,581 1955 130,594 1948 249,945
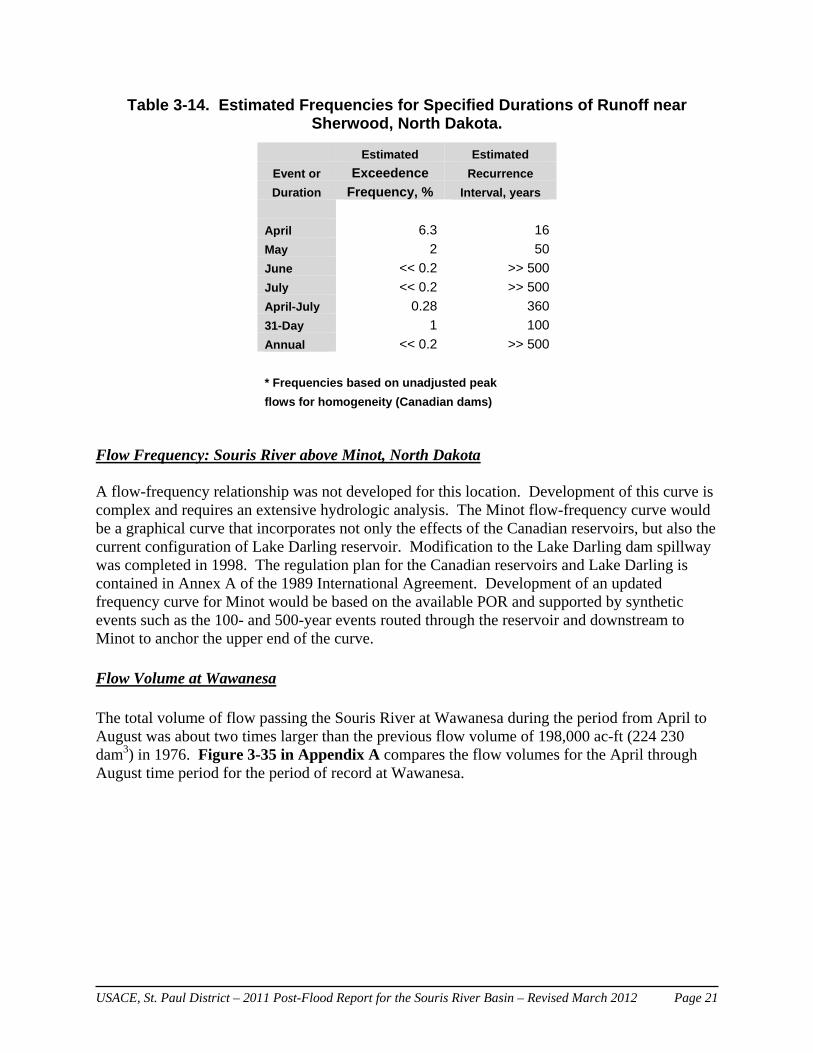
Figure 3-34 in Appendix A, shows the annual instantaneous flow-frequency curve. Plotting positions are Weibull and the analytical curve is based on Log Pearson Type III as per Bulletin 17B Guidelines and with the expected probability adjustment. Adopted skew is a station weighted skew with a regional skew value of -0.4 and mean square error of 0.125. Regional skew values were obtained from the St. Paul District Skew map developed in 1988. The -0.4 regional skew value is consistent with Bulletin’s 17 B skew map. Table 3-14 lists estimated frequencies and corresponding recurrence intervals for volumes of runoff of specified durations at Sherwood. The durations are for the months of April, May, June, April through July, maximum consecutive 31-day, and the annual volume for water year 2011. The frequencies can only be considered as estimates as the values for the period-of-record (POR) were not adjusted for the current reservoir configuration. These estimates are based on recorded flows at the Sherwood gauge for the POR. They are presented here as estimates to provide perspective on the relative magnitude of the 2011 event compared to what has occurred in the past. Table 3-14 indicates that the April and May volumes are typical, but that June and July as well as the total annual volumes were unprecedented.
April May June July Total Volume Total Volume Total Volume Total Volume
Year ac-ft Year ac-ft Year ac-ft Year ac-ft
1976 400,984 2011 296,474 2011 626,171 2011 341,6581969 226,714 1975 245,676 1953 56,776 1953 64,5731943 164,325 1979 211,064 1976 53,993 1978 33,9731974 158,680 1948 145,805 1975 41,062 1976 31,1392011 150,746 1974 117,804 1965 30,736 1999 23,1631955 126,944 1970 116,328 1954 23,739 1944 22,3061979 126,309 1976 90,505 1955 23,723 1956 14,6541999 109,152 1951 89,319 1970 22,047 1971 14,3701956 103,324 1999 75,752 1979 20,894 2005 12,5581982 99,473 1955 74,151 1933 20,265 2010 12,383
USACE, St. Paul District – 2011 Post-Flood Report for the Souris River Basin – Revised March 2012 Page 21
Table 3-14. Estimated Frequencies for Specified Durations of Runoff near Sherwood, North Dakota.
Flow Frequency: Souris River above Minot, North Dakota A flow-frequency relationship was not developed for this location. Development of this curve is complex and requires an extensive hydrologic analysis. The Minot flow-frequency curve would be a graphical curve that incorporates not only the effects of the Canadian reservoirs, but also the current configuration of Lake Darling reservoir. Modification to the Lake Darling dam spillway was completed in 1998. The regulation plan for the Canadian reservoirs and Lake Darling is contained in Annex A of the 1989 International Agreement. Development of an updated frequency curve for Minot would be based on the available POR and supported by synthetic events such as the 100- and 500-year events routed through the reservoir and downstream to Minot to anchor the upper end of the curve. Flow Volume at Wawanesa The total volume of flow passing the Souris River at Wawanesa during the period from April to August was about two times larger than the previous flow volume of 198,000 ac-ft (224 230 dam3) in 1976. Figure 3-35 in Appendix A compares the flow volumes for the April through August time period for the period of record at Wawanesa.
Estimated Estimated
Event or Exceedence Recurrence
Duration Frequency, % Interval, years
April 6.3 16
May 2 50
June << 0.2 >> 500
July << 0.2 >> 500
April-July 0.28 360
31-Day 1 100
Annual << 0.2 >> 500
* Frequencies based on unadjusted peak
flows for homogeneity (Canadian dams)
USACE, St. Paul District – 2011 Post-Flood Report for the Souris River Basin – Revised March 2012 Page 22
4.COORDINATIONOFFORECASTSANDRESERVOIROPERATIONS 4.1 Operational and Liaison Responsibilities under the 1989 International Agreement Under the provisions of Article X of the 1989 International Agreement for Water Supply and Flood Control in the Souris River Basin, the Governments of Canada and the United States have designated the Government of Saskatchewan and the U.S. Department of the Army, respectively, as the responsible entities for the management of the improvements covered by the Agreement during periods of flood. In Saskatchewan this authority rests with the Saskatchewan Watershed Authority (SWA), a Provincial Crown Corporation. In the United States this authority rests with the U.S Army Corps of Engineers (USACE) through its St. Paul District. During non-flood periods, SWA is also the responsible entity for operations in Canada, while the U.S. Fish and Wildlife Service is the responsible entity in the United States. Section 6.0 of Annex A of the 1989 Agreement provides that these responsible entities will accomplish liaison with interested states, provinces and agencies from time-to-time as to the operation of the project. Additionally, Section 6.0 provides that representatives of the U.S. Department of the Army, Saskatchewan Watershed Authority, U.S. Fish and Wildlife Service and North Dakota State Engineer have responsibility to monitor reservoir operations under the Agreement. Further responsibilities of the Governments of Canada and the United States are defined in Article V of the 1989 International Agreement. These responsibilities include consultation with interested states, provinces and agencies concerning preparation of reservoir regulation manuals and periodic review and revision of the operating plan contained in Annex A at 5-year intervals, or as mutually agreed, to maximize the provision of flood control and water supply benefits that can be provided consistent with the terms of the Agreement. Article VII of the 1989 Agreement required that paragraph 1 of the 1959 Interim Measures for the apportionment of waters of the Souris River be modified as shown in Annex B of the Agreement. Pursuant to a February 28th, 1992 request from the Governments of Canada and the United States, the International Joint Commission (IJC) directed the International Souris River Board of Control (ISRBC) to begin applying the “Interim Measurers as Modified.” In response the ISRBC directed its “Natural Flow Methods Committee” to study implementation of the measures contained in Annex B and to report findings and recommendations back to the Board. As a result of the Committee’s recommendations, SWA prepares forecasts each year of the maximum 30-day and 90-day runoff with assistance from the National Weather Service as appropriate. These runoff forecasts begin on February 1st and thereafter on the 15th and last day of the month until runoff occurs. In December 2000, the IJC directed the Board to implement the "Interim Measures as Modified in 2000" for the 2001 calendar year and each year thereafter. The 2000 Interim Measures were developed to provide greater clarification of the conditions that must prevail for the determination of the share of natural flow between Saskatchewan and North Dakota at the Sherwood Crossing. All of the various “Interim Measures” for the apportionment of flows in the Souris River basin between Canada and the United States may be viewed on the web site of the ISRB under the “Boards” tab at www.ijc.org.
USACE, St. Paul District – 2011 Post-Flood Report for the Souris River Basin – Revised March 2012 Page 23
In January 2007, the IJC issued an updated Directive to its International Souris River Board (ISRB), formerly the ISRBC. The updated Directive changed the Board’s mandate by assigning water quality functions and an oversight for flood forecasting and operations within the Souris River basin. With respect to the oversight function for flood forecasting and operations, the Board was empowered to perform an oversight function for flood operations in cooperation with the “Designated Entities” identified in the 1989 Canada-United States Agreement for Water Supply and Flood Control in the Souris River Basin by: Ensuring mechanisms are in place for coordination of data exchange, flood forecasts and
communications related to flood conditions and operations. Determining whether the operations under the 1989 Agreement should proceed based on the
Flood Operation or Non-Flood Operation of the Operating Plan, which is Annex A to the 1989 Agreement, using its criteria and informing designated agencies of this determination.
Reporting to the Commission on any issues related to flood operations and management. Providing the Commission and the “Designated Entities” under the 1989 Agreement
recommendations on how flood operations and coordination activities could be improved. 4.2 Forecasting and Flood Operations Coordination The terms of Annex A of the 1989 Agreement established reservoir target drawdown levels for Rafferty, Alameda and Boundary reservoirs in Canada and Lake Darling reservoir in North Dakota. It also provides for target flows in North Dakota for the Souris River at the United States Geological Survey (USGS) gauging station near Sherwood, North Dakota and the USGS gauging station at Minot 4NW above Minot, North Dakota. A year of flood operation is triggered under the Agreement when a 50 percent chance exists of the estimated 30-day unregulated flow volume at the Sherwood Crossing equaling or exceeding a 10-percent (10-year) flood event volume of 175,200 ac-ft (216 110 dam3) or when the local 30-day flow volume at the Sherwood Crossing is expected to equal or exceed 30,000 ac-ft (37 000 dam3). A flood forecasting and flood operations coordinating group was convened in February 2011 to discuss current conditions in the Souris River basin and the regulation of the flood control project under the 1989 Agreement. This group included representatives of the designated agencies for regulation, Saskatchewan Watershed Authority (SWA) and Corps of Engineers (USACE or Corps); forecasting and stream flow partners including the National Weather Service (NWS) and United States Geological Survey (USGS); and representatives of the United States Fish and Wildlife Service (USFWS), North Dakota State Water Commission (NDSWC), and Manitoba Water Stewardship (MWS). The planning of flood operations was a highly coordinated effort. Agency representatives met by conference call on a regular basis throughout the 2011 flood event to review flood forecasts and reservoir operations based on updated forecasts and the latest flow information. Utilizing daily conference calls (pre-meetings) among regulators and forecasters in advance of periodic conference calls with stakeholders and affected parties went well, as opposed to
USACE, St. Paul District – 2011 Post-Flood Report for the Souris River Basin – Revised March 2012 Page 24
combined calls between regulators, forecasters, stakeholders and affected parties that occurred in the early phases of the 2011 flood event. Deliberations between regulators and forecasters on daily forecasts should not be done in a public forum. This protocol should be observed for future flood events. Flow and water level information was exchanged between agencies by way of the internet and other electronic formats including e-mail and an online “Chat’ facility provide by the NWS called NWS “Chat” on a daily basis. The NWS “Chat” capability proved useful for daily communications between USACE regulators, USGS and NWS forecasters to share data and information. This capability is to be expanded to include Emergency Operations Centers (EOC’s) in the future, but is not well suited for communication with the public, which tends to be more web graphics oriented. The NWS wants to get away from dependence on email, which can be unreliable. Both the NWS and the USACE feel strongly that all regulating agencies should be on NWS “Chat”during flood situations. In addition to the “NWS Chat” facility, the NWS and the USACE utilized the Local Data Manager (LDM) file transfer protocol (already well established between the two agencies) to exchange data and forecast files. The LDM protocol worked well, but efficiency of passing data needs to be improved. The NWS and the USACE coordinated frequently on modeling and rating curves, with these efforts proving useful to both agencies and providing valuable information for managing the overall flood response. Regarding the access of flow and water level information, the web sites of the NWS, ND USGS, SWA and Water Survey of Canada (WSC) were vitally important. Access to real-time Canadian reservoir information was difficult at times due to delays in updating the SWA web site reservoir information and difficulty accessing the WSC web site at times during the 2011 flood event, due to slow connection speed or difficulty in establishing a connection. Regarding river flow and reservoir discharge rating curves, the ND-USGS did an excellent job of obtaining timely flow measurements (particularly the series of flow measurements at Lake Darling to verify the gate rating curves which were found to be in close agreement with the USGS flow measurements) and updating the curves. However, the NWS web site does not appear to have the capability to pick up and implement the USGS rating curve shift changes immediately. This led to some confusion at times in the use of the flows published on the NWS web site because they were not using the latest rating curve shift. Improvement is needed on computer connectivity between these two agencies. Another positive note was provided by the Souris basin map sponsored by the International Joint Commission (IJC) that was available on the ND USGS website. This proved to be a valuable and heavily used tool, providing convenient and useful one-stop access to all the key streamflow gauges within the Canadian and U.S. portions of the Souris basin. Availability of this tool should be continued and promoted to the public. In an effort to improve coordination of forecasts, the USACE sent a representative to the North Central River Forecast Center to act as a liaison between the USACE and NWS. This action was very helpful to both agencies.
USACE, St. Paul District – 2011 Post-Flood Report for the Souris River Basin – Revised March 2012 Page 25
Members of the ISRB’s Souris River Flow Forecasting Liaison Committee (SRFFLC) were kept informed of forecasts and planned reservoir operations through normal communication channels. Whenever precipitation events occurred and a change in flow conditions warranted, reservoir operation plans were updated and a conference call was held to discuss reservoir operations, target flows and possible impacts to downstream interests. In all cases every effort was made to minimize the impacts of high flows, while operating the system within the intent of the 1989 Agreement. Details of the flood forecasting and reservoir operations coordination can be found in Appendix C.
4.3 Coordination with Stakeholders Stakeholder conference calls were held as needed during the flood event. In the early phases of the 2011 flood event, these stakeholder conference calls were combined with the conference call of the regulators and forecasters with deliberations between regulators and forecasters on daily forecasts being aired in a public forum. This practice was stopped by having separate conference calls for stakeholders and regulators/forecasters and should be the example for future flood events. Subsequently, separate stakeholder conference calls (minus the regulator/forecaster deliberations) included the coordination group and were open to all communities along the river, emergency managers, and government officials and representatives at all levels. Stakeholder conference calls were initiated by the USACE and held approximately every two weeks leading up to the flood event. The calls became more frequent, beginning in April, once the snowmelt started. When there were rapidly changing conditions in the precipitation or river forecasts, the stakeholder calls occurred daily and more often as needed due to new information. Some of the calls with important information are summarized in Appendix D. In an effort to improve coordination of forecasts with the public, the NWS sent an on-the-scene representative to Minot. This action proved very helpful. Late-afternoon NWS forecasts (due to delays in obtaining needed data for forecast model runs) impeded Minot’s ability at times to get public notices out in a timely manner with sufficient time for emergency response officials and the public to react during daylight hours. Managing public expectations and timeliness of issuing forecasts to allow city officials to execute timely evacuation and manage the City flood response needs improvement. At other times, demands by the press for information or needed information for press conferences seemed to drive the agenda for release of information, rather than the need for obtaining accurate data and performing an appropriate analysis of the data. In the end, press conferences and media demands for information do not drive information releases, if analysis or missing hydrometeorologic information is required to produce an accurate forecast. We do however need to keep communicating the risk and to educate the public on the limitations of the science of runoff forecasting.
USACE, St. Paul District – 2011 Post-Flood Report for the Souris River Basin – Revised March 2012 Page 26
5.SPRINGRUNOFFFORECASTS 5.1 2011 Spring Forecasts Beginning on February 1st, the SWA issued runoff forecasts for the Souris River basin on approximately the 1st and 15th of each month through the last forecast on April 4th. In accordance with Annex A of the 1989 Agreement, if a February 1st or subsequent spring runoff estimate shows a reasonable chance (50 percent) of a runoff volume at Sherwood Crossing being equal to or greater than a 10 percent (1 in 10) flood, then operations will proceed on the basis of the flood operating plan. The 10 percent event at the Sherwood Crossing is defined as a best estimate unregulated 30-day runoff volume equaling or exceeding 216 110 dam3 (175,200 ac-ft) or a best estimate 30-day local runoff volume equaling or exceeding 37 000 dam3 (30,000 ac-ft). All of the SWA forecasts indicated an expected flood event that was greater than a 10-year flood. Beginning with the February 1st forecast of 300 000 dam3, increasing to 375 000 dam3 on February 15th the International Souris River Board declared 2011 to be a flood year under the terms of the 1989 Agreement at their February 23rd board meeting in Regina, SK. The final spring runoff forecast issued by the SWA on April 4th, 2011 for the Sherwood Crossing predicted a best estimate 30-day unregulated flow volume of 440 000 dam3 and a best estimate 30-day local runoff volume of 80 000 dam3. Both forecast estimates were more than double the 1 in 10 event trigger runoff volumes for flood operations. SWA runoff forecasts can be found in Tables 5-1a through 5-5b. The SWA runoff forecasts are use in conjunction with Plates A-1 through A-6 of the 1989 Agreement to determine pre-flood reservoir drawdown targets and target flows for Sherwood and Minot. Plates A-1 through A-3 are used to determine the pre-flood drawdowns of Boundary, Rafferty and Alameda reservoirs, respectively. Plate A-4 is used to determine the pre-flood drawdown of Lake Darling, while Plates A-5 and A-6 are used to determine target flows for Sherwood and Minot, respectively. Plates A-1 through A-6 of the 1989 Agreement are shown in this report as Figures 5-1 through 5-6 in Appendix A, respectively. In addition to the SWA forecasts, the NWS North Central River Forecast Center (NCRFC) in Chanhassen, Minnesota issued a spring 2011 flood outlook for the North Dakota portions of the Souris River basin on January 27th. This outlook forecast for the Souris River predicted minor to moderate flooding, as defined at each of the forecast locations above Minot, as a virtual certainty with moderate to major flooding reasonably expected in the areas downstream of Minot. Probabilistic hydrologic outlooks continued to be issued by the NCRFC approximately twice a month until the snowmelt began. The last spring snowmelt outlook was issued for the North Dakota portions of the basin by the NCRFC on March 25th. This outlook forecast moderate flooding for the Souris River at Velva. Moderate to major flooding was forecast at Sherwood and Logan. Major flooding was forecast for the Souris River from Foxholm to Minot, Sawyer, and Towner to Westhope. Moderate to major flooding was forecast for the Des Lacs River at Foxholm.
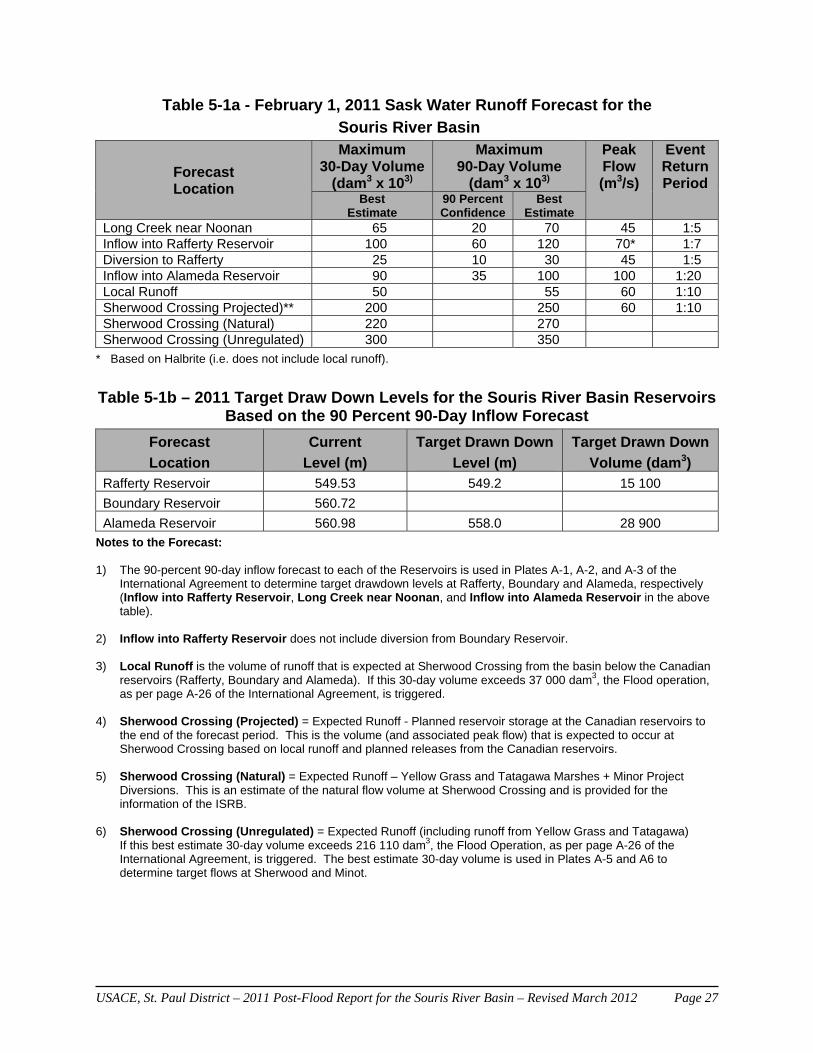
USACE, St. Paul District – 2011 Post-Flood Report for the Souris River Basin – Revised March 2012 Page 27
Table 5-1a - February 1, 2011 Sask Water Runoff Forecast for the
Souris River Basin
Forecast Location
Maximum30-Day Volume
(dam3 x 103)
Maximum90-Day Volume
(dam3 x 103)
Peak Flow (m3/s)
EventReturn Period
BestEstimate
90 PercentConfidence
BestEstimate
Long Creek near Noonan 65 20 70 45 1:5 Inflow into Rafferty Reservoir 100 60 120 70* 1:7 Diversion to Rafferty 25 10 30 45 1:5 Inflow into Alameda Reservoir 90 35 100 100 1:20 Local Runoff 50 55 60 1:10 Sherwood Crossing Projected)** 200 250 60 1:10 Sherwood Crossing (Natural) 220 270 Sherwood Crossing (Unregulated) 300 350
* Based on Halbrite (i.e. does not include local runoff).
Table 5-1b – 2011 Target Draw Down Levels for the Souris River Basin Reservoirs
Based on the 90 Percent 90-Day Inflow Forecast
Forecast
Location
Current
Level (m)
Target Drawn Down
Level (m)
Target Drawn Down
Volume (dam3) Rafferty Reservoir 549.53 549.2 15 100
Boundary Reservoir 560.72
Alameda Reservoir 560.98 558.0 28 900
Notes to the Forecast: 1) The 90-percent 90-day inflow forecast to each of the Reservoirs is used in Plates A-1, A-2, and A-3 of the
International Agreement to determine target drawdown levels at Rafferty, Boundary and Alameda, respectively (Inflow into Rafferty Reservoir, Long Creek near Noonan, and Inflow into Alameda Reservoir in the above table).
2) Inflow into Rafferty Reservoir does not include diversion from Boundary Reservoir. 3) Local Runoff is the volume of runoff that is expected at Sherwood Crossing from the basin below the Canadian
reservoirs (Rafferty, Boundary and Alameda). If this 30-day volume exceeds 37 000 dam3, the Flood operation, as per page A-26 of the International Agreement, is triggered.
4) Sherwood Crossing (Projected) = Expected Runoff - Planned reservoir storage at the Canadian reservoirs to the end of the forecast period. This is the volume (and associated peak flow) that is expected to occur at Sherwood Crossing based on local runoff and planned releases from the Canadian reservoirs.
5) Sherwood Crossing (Natural) = Expected Runoff – Yellow Grass and Tatagawa Marshes + Minor Project
Diversions. This is an estimate of the natural flow volume at Sherwood Crossing and is provided for the information of the ISRB.
6) Sherwood Crossing (Unregulated) = Expected Runoff (including runoff from Yellow Grass and Tatagawa) If this best estimate 30-day volume exceeds 216 110 dam3, the Flood Operation, as per page A-26 of the International Agreement, is triggered. The best estimate 30-day volume is used in Plates A-5 and A6 to determine target flows at Sherwood and Minot.

USACE, St. Paul District – 2011 Post-Flood Report for the Souris River Basin – Revised March 2012 Page 28
Table 5-2a - February 15, 2011 Sask Water Runoff Forecast for the
Souris River Basin
Forecast Location
Maximum30-Day Volume
(dam3 x 103)
Maximum90-Day Volume
(dam3 x 103)
Peak Flow (m3/s)
EventReturn Period
BestEstimate
90 PercentConfidence
BestEstimate
Long Creek near Noonan 65 20 70 45 1:5 Inflow into Rafferty Reservoir 160 90 180 70 1:10 Diversion to Rafferty 25 10 30 45 1:5 Inflow into Alameda Reservoir 90 45 100 100 1:20 Local Runoff 60 75 70 1:10 Sherwood Crossing Projected)** 200 250 70 1:10 Sherwood Crossing (Natural) 315 360 Sherwood Crossing (Unregulated) 375 425
* Based on Halbrite (i.e. does not include local runoff).
** Assuming reservoirs drawn down prior to spring runoff and then maintained at their FSL’s after the 30 day time period.
Table 5-2b – 2011 Target Draw Down Levels for the Souris River Basin Reservoirs
Based on the 90 Percent 90-Day Inflow Forecast
Forecast
Location
Current
Level (m)
Target Drawn Down
Level (m)
Target Drawn Down
Volume (dam3) Rafferty Reservoir 549.44 548.2 55 000
Boundary Reservoir 560.72
Alameda Reservoir 560.58 556.5 34 000
Notes to the Forecast:
1) The 90-percent 90-day inflow forecast to each of the reservoirs is used in Plates A-1, A-2, and A-3 of the International Agreement to determine target drawdown levels at Rafferty, Boundary and Alameda, respectively (Inflow into Rafferty Reservoir, Long Creek near Noonan, and Inflow into Alameda Reservoir in the above table).
2) Inflow into Rafferty Reservoir does not include diversion from Boundary Reservoir.
3) Local Runoff is the volume of runoff that is expected at Sherwood Crossing from the basin below the Canadian reservoirs (Rafferty, Boundary and Alameda). If this 30-day volume exceeds 37 000 dam3, the Flood operation, as per page A-26 of the International Agreement, is triggered.
4) Sherwood Crossing (Projected) = Expected Runoff - Planned reservoir storage at the Canadian reservoirs
to the end of the forecast period. This is the volume (and associated peak flow) that is expected to occur at Sherwood Crossing based on local runoff and planned releases from the Canadian reservoirs.
5) Sherwood Crossing (Natural) = Expected Runoff – Yellow Grass and Tatagawa Marshes + Minor Project Diversions. This is an estimate of the natural flow volume at Sherwood Crossing and is provided for the information of the ISRB.
6) Sherwood Crossing (Unregulated) = Expected Runoff (including runoff from Yellow Grass and Tatagawa) If this best estimate 30-day volume exceeds 216 110 dam3, the Flood Operation, as per page A-26 of the International Agreement, is triggered. The best estimate 30-day volume is used in Plates A-5 and A6 to determine target flows at Sherwood and Minot.
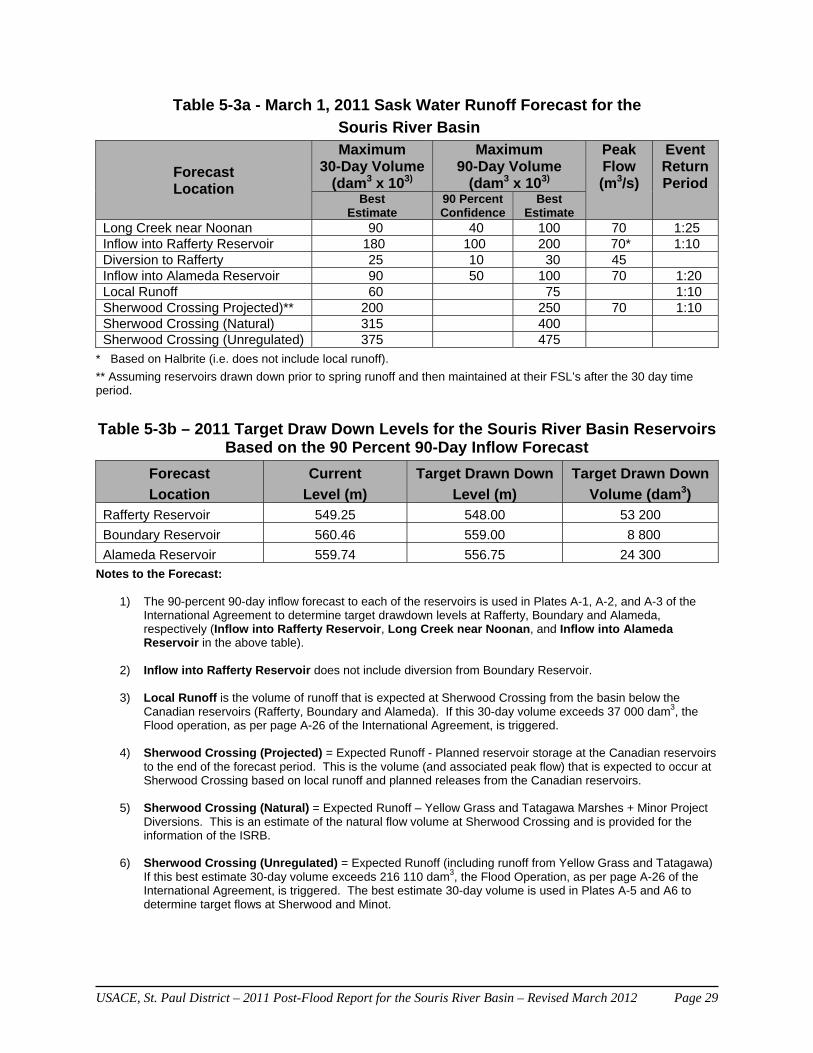
USACE, St. Paul District – 2011 Post-Flood Report for the Souris River Basin – Revised March 2012 Page 29
Table 5-3a - March 1, 2011 Sask Water Runoff Forecast for the
Souris River Basin
Forecast Location
Maximum30-Day Volume
(dam3 x 103)
Maximum90-Day Volume
(dam3 x 103)
Peak Flow (m3/s)
EventReturn Period
BestEstimate
90 PercentConfidence
BestEstimate
Long Creek near Noonan 90 40 100 70 1:25 Inflow into Rafferty Reservoir 180 100 200 70* 1:10 Diversion to Rafferty 25 10 30 45 Inflow into Alameda Reservoir 90 50 100 70 1:20 Local Runoff 60 75 1:10 Sherwood Crossing Projected)** 200 250 70 1:10 Sherwood Crossing (Natural) 315 400 Sherwood Crossing (Unregulated) 375 475
* Based on Halbrite (i.e. does not include local runoff).
** Assuming reservoirs drawn down prior to spring runoff and then maintained at their FSL’s after the 30 day time period.
Table 5-3b – 2011 Target Draw Down Levels for the Souris River Basin Reservoirs
Based on the 90 Percent 90-Day Inflow Forecast
Forecast
Location
Current
Level (m)
Target Drawn Down
Level (m)
Target Drawn Down
Volume (dam3) Rafferty Reservoir 549.25 548.00 53 200
Boundary Reservoir 560.46 559.00 8 800
Alameda Reservoir 559.74 556.75 24 300
Notes to the Forecast:
1) The 90-percent 90-day inflow forecast to each of the reservoirs is used in Plates A-1, A-2, and A-3 of the International Agreement to determine target drawdown levels at Rafferty, Boundary and Alameda, respectively (Inflow into Rafferty Reservoir, Long Creek near Noonan, and Inflow into Alameda Reservoir in the above table).
2) Inflow into Rafferty Reservoir does not include diversion from Boundary Reservoir.
3) Local Runoff is the volume of runoff that is expected at Sherwood Crossing from the basin below the Canadian reservoirs (Rafferty, Boundary and Alameda). If this 30-day volume exceeds 37 000 dam3, the Flood operation, as per page A-26 of the International Agreement, is triggered.
4) Sherwood Crossing (Projected) = Expected Runoff - Planned reservoir storage at the Canadian reservoirs
to the end of the forecast period. This is the volume (and associated peak flow) that is expected to occur at Sherwood Crossing based on local runoff and planned releases from the Canadian reservoirs.
5) Sherwood Crossing (Natural) = Expected Runoff – Yellow Grass and Tatagawa Marshes + Minor Project Diversions. This is an estimate of the natural flow volume at Sherwood Crossing and is provided for the information of the ISRB.
6) Sherwood Crossing (Unregulated) = Expected Runoff (including runoff from Yellow Grass and Tatagawa) If this best estimate 30-day volume exceeds 216 110 dam3, the Flood Operation, as per page A-26 of the International Agreement, is triggered. The best estimate 30-day volume is used in Plates A-5 and A6 to determine target flows at Sherwood and Minot.
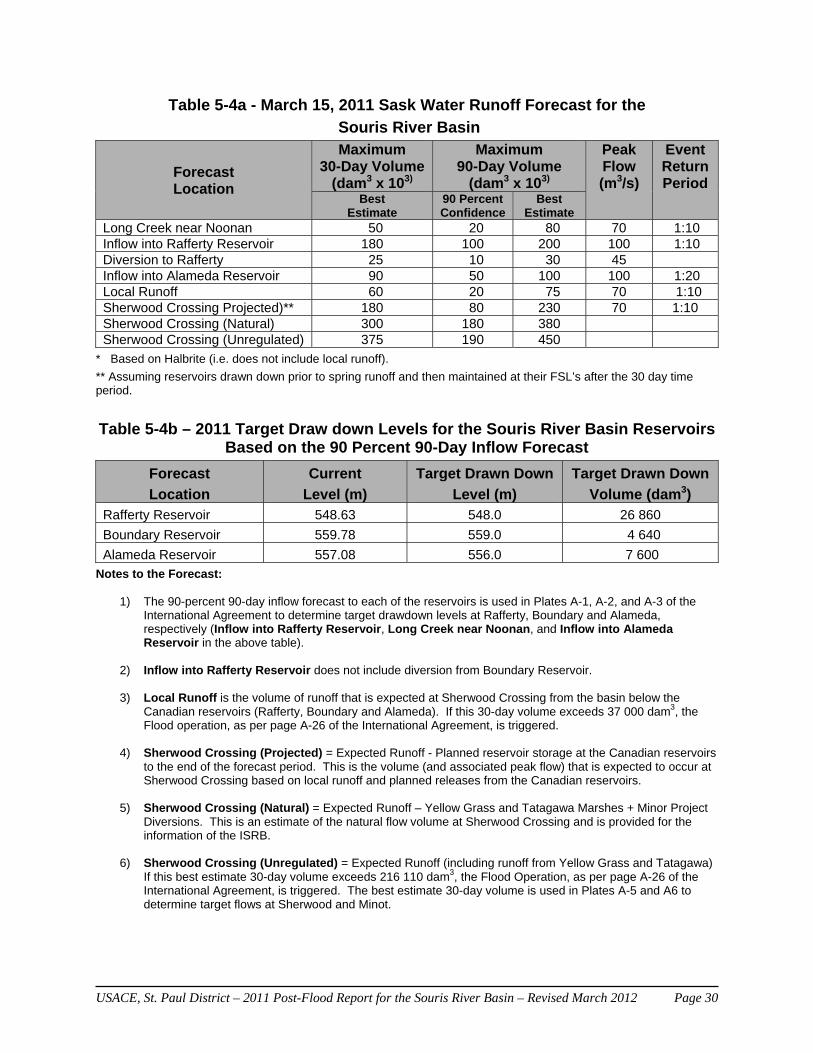
USACE, St. Paul District – 2011 Post-Flood Report for the Souris River Basin – Revised March 2012 Page 30
Table 5-4a - March 15, 2011 Sask Water Runoff Forecast for the
Souris River Basin
Forecast Location
Maximum30-Day Volume
(dam3 x 103)
Maximum90-Day Volume
(dam3 x 103)
Peak Flow (m3/s)
EventReturn Period
BestEstimate
90 PercentConfidence
BestEstimate
Long Creek near Noonan 50 20 80 70 1:10 Inflow into Rafferty Reservoir 180 100 200 100 1:10 Diversion to Rafferty 25 10 30 45 Inflow into Alameda Reservoir 90 50 100 100 1:20 Local Runoff 60 20 75 70 1:10 Sherwood Crossing Projected)** 180 80 230 70 1:10 Sherwood Crossing (Natural) 300 180 380 Sherwood Crossing (Unregulated) 375 190 450
* Based on Halbrite (i.e. does not include local runoff).
** Assuming reservoirs drawn down prior to spring runoff and then maintained at their FSL’s after the 30 day time period.
Table 5-4b – 2011 Target Draw down Levels for the Souris River Basin Reservoirs
Based on the 90 Percent 90-Day Inflow Forecast
Forecast
Location
Current
Level (m)
Target Drawn Down
Level (m)
Target Drawn Down
Volume (dam3) Rafferty Reservoir 548.63 548.0 26 860
Boundary Reservoir 559.78 559.0 4 640
Alameda Reservoir 557.08 556.0 7 600
Notes to the Forecast:
1) The 90-percent 90-day inflow forecast to each of the reservoirs is used in Plates A-1, A-2, and A-3 of the International Agreement to determine target drawdown levels at Rafferty, Boundary and Alameda, respectively (Inflow into Rafferty Reservoir, Long Creek near Noonan, and Inflow into Alameda Reservoir in the above table).
2) Inflow into Rafferty Reservoir does not include diversion from Boundary Reservoir.
3) Local Runoff is the volume of runoff that is expected at Sherwood Crossing from the basin below the Canadian reservoirs (Rafferty, Boundary and Alameda). If this 30-day volume exceeds 37 000 dam3, the Flood operation, as per page A-26 of the International Agreement, is triggered.
4) Sherwood Crossing (Projected) = Expected Runoff - Planned reservoir storage at the Canadian reservoirs
to the end of the forecast period. This is the volume (and associated peak flow) that is expected to occur at Sherwood Crossing based on local runoff and planned releases from the Canadian reservoirs.
5) Sherwood Crossing (Natural) = Expected Runoff – Yellow Grass and Tatagawa Marshes + Minor Project Diversions. This is an estimate of the natural flow volume at Sherwood Crossing and is provided for the information of the ISRB.
6) Sherwood Crossing (Unregulated) = Expected Runoff (including runoff from Yellow Grass and Tatagawa) If this best estimate 30-day volume exceeds 216 110 dam3, the Flood Operation, as per page A-26 of the International Agreement, is triggered. The best estimate 30-day volume is used in Plates A-5 and A6 to determine target flows at Sherwood and Minot.
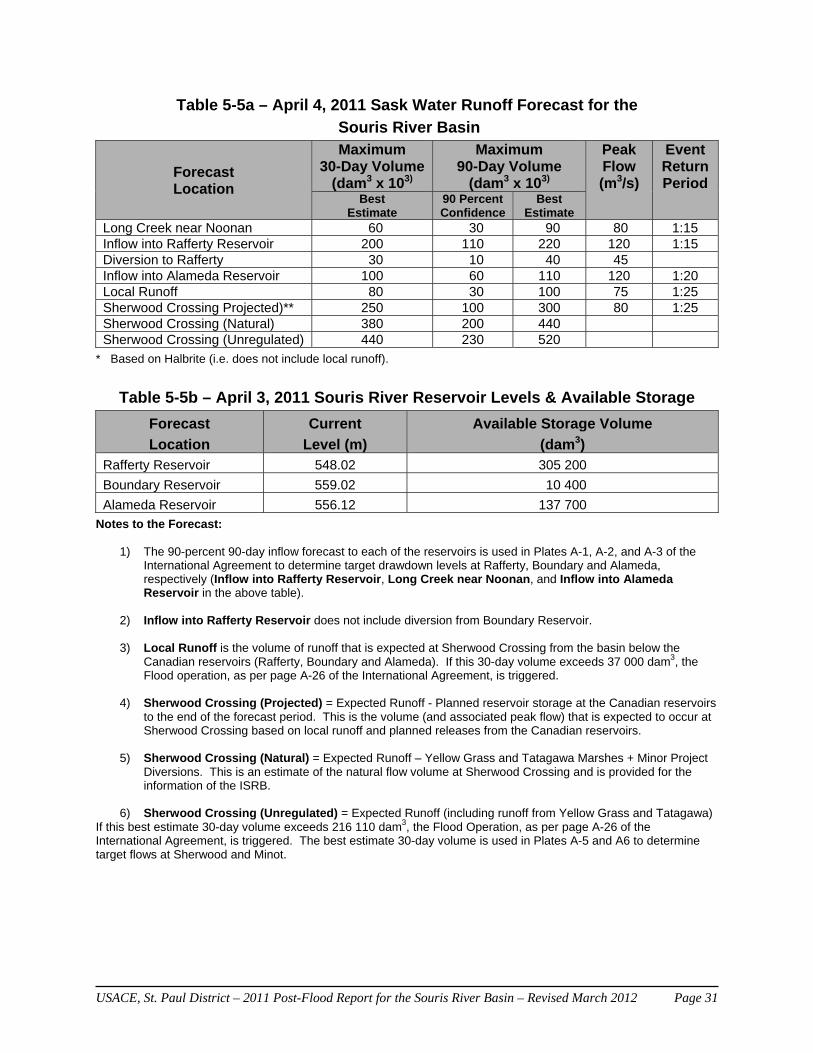
USACE, St. Paul District – 2011 Post-Flood Report for the Souris River Basin – Revised March 2012 Page 31
Table 5-5a – April 4, 2011 Sask Water Runoff Forecast for the
Souris River Basin
Forecast Location
Maximum30-Day Volume
(dam3 x 103)
Maximum90-Day Volume
(dam3 x 103)
Peak Flow (m3/s)
EventReturn Period
BestEstimate
90 PercentConfidence
BestEstimate
Long Creek near Noonan 60 30 90 80 1:15 Inflow into Rafferty Reservoir 200 110 220 120 1:15 Diversion to Rafferty 30 10 40 45 Inflow into Alameda Reservoir 100 60 110 120 1:20 Local Runoff 80 30 100 75 1:25 Sherwood Crossing Projected)** 250 100 300 80 1:25 Sherwood Crossing (Natural) 380 200 440 Sherwood Crossing (Unregulated) 440 230 520
* Based on Halbrite (i.e. does not include local runoff).
Table 5-5b – April 3, 2011 Souris River Reservoir Levels & Available Storage
Forecast
Location
Current
Level (m)
Available Storage Volume
(dam3) Rafferty Reservoir 548.02 305 200
Boundary Reservoir 559.02 10 400
Alameda Reservoir 556.12 137 700
Notes to the Forecast:
1) The 90-percent 90-day inflow forecast to each of the reservoirs is used in Plates A-1, A-2, and A-3 of the International Agreement to determine target drawdown levels at Rafferty, Boundary and Alameda, respectively (Inflow into Rafferty Reservoir, Long Creek near Noonan, and Inflow into Alameda Reservoir in the above table).
2) Inflow into Rafferty Reservoir does not include diversion from Boundary Reservoir.
3) Local Runoff is the volume of runoff that is expected at Sherwood Crossing from the basin below the Canadian reservoirs (Rafferty, Boundary and Alameda). If this 30-day volume exceeds 37 000 dam3, the Flood operation, as per page A-26 of the International Agreement, is triggered.
4) Sherwood Crossing (Projected) = Expected Runoff - Planned reservoir storage at the Canadian reservoirs
to the end of the forecast period. This is the volume (and associated peak flow) that is expected to occur at Sherwood Crossing based on local runoff and planned releases from the Canadian reservoirs.
5) Sherwood Crossing (Natural) = Expected Runoff – Yellow Grass and Tatagawa Marshes + Minor Project Diversions. This is an estimate of the natural flow volume at Sherwood Crossing and is provided for the information of the ISRB.
6) Sherwood Crossing (Unregulated) = Expected Runoff (including runoff from Yellow Grass and Tatagawa) If this best estimate 30-day volume exceeds 216 110 dam3, the Flood Operation, as per page A-26 of the International Agreement, is triggered. The best estimate 30-day volume is used in Plates A-5 and A6 to determine target flows at Sherwood and Minot.
USACE, St. Paul District – 2011 Post-Flood Report for the Souris River Basin – Revised March 2012 Page 32
5.2 Future Runoff Forecast Modeling Enhancements The NWS will be moving in the near future to the Delft-FEWS (by Dutch Corporation Deltares) open shell system for managing forecasting processes and/or handling time series data. Delft-FEWS incorporates a wide range of general data handling utilities, while providing an open interface to any external forecasting model. The modular and highly configurable nature of Delft-FEWS allows it to be used effectively for data storage and retrieval tasks, simple forecasting systems and in highly complex systems utilizing a full range of modeling techniques. Delft-FEWS can either be deployed in a stand-alone, manually driven environment, or in a fully automated distributed client-server environment. The USACE can be a client to this system, which is compatible with the USACE Hydrologic Engineering Center (HEC) software. Better interoperability to import data between models is needed under current agency model configurations (for example transfer of data from the USACE CWMS model into the NWS FEWS model and vice-versa). The FEWS model is like the CWMS model, having a database, process gridded data and plug in models. The USACE has pursued development of a CWMS model for the Souris basin in recent years, but the effort is not complete, mostly due to funding limitations. An independent USACE CWMS model would be an important step in providing an additional forecasting tool (in addition to the current SWA and NWS forecasts) for use by the ISRB in making determinations of flood year or non-flood year. The availability of independent SWA, NWS and USACE forecasts would serve to check the accuracy of the independent forecasts and aid in any needed forecast refinements.
USACE, St. Paul District – 2011 Post-Flood Report for the Souris River Basin – Revised March 2012 Page 33
6.RESERVOIROPERATIONS On February 1st Saskatchewan Watershed Authority (SWA) issued its first spring forecast. The National Weather Service’s forecast was similar. The Souris River Board discussed SWA’s February 15th forecast at its semi-annual meeting on February 23rd and a “one in ten” event was declared thereby transferring regulation of Lake Darling reservoir from the US Fish and Wildlife Service to the US Army Corps of Engineers. Rafferty, Boundary, Alameda and Lake Darling reservoirs were all drawn down according to the 1989 International Agreement in advance of spring snowmelt. The target flows for the Souris River gauges at Sherwood and Minot 4NW were set at 3,200 cfs (90 cms) and 5,000 cfs (140 cms), respectively. On April 21st, 2011 due to higher flow volume at the Sherwood gauge than forecasted, the target flow here was increased from 3,200 cfs (90 cms) to 4,000 cfs (114 cms). The SWA had a difficult time in attaining the Sherwood Crossing target flows. This served to unnecessarily use up valuable flood control storage in Rafferty reservoir to a greater extent and to a lesser extent in Alameda reservoir. In fairness to the SWA, the difficulty in reaching these target flows at Sherwood were in large part due to uncertainties in the extreme attenuation and delay in timing of large magnitude peak flow caused by the filling of overbank storage between Rafferty Dam and the Sherwood Crossing. Attenuation (storage lag) between Lake Darling and Minot caused a similar problem on the U.S. side with Lake Darling releases taking longer than expected to increase Minot 4NW flow to reach the target flow of 5,000 cfs. It is believed that USFWS Dam 96 contributed to this storage lag, at least in part. Although the 1989 Agreement defines “Target Flow” as the “Instantaneous flow at a given location that should not be exceeded during a given flood event as a result of releases from a reservoir or reservoirs”, it is clear that timely evacuation of stored flood waters depends upon attaining these targets. Reservoir operations were in compliance with the 1989 International Agreement until inflows became too high and the reservoirs essentially full due to a series of precipitation events, culminating with the very heavy rainfall of June 17th to 21st . Once the events overwhelmed the flood control system, the reservoirs were releasing flows in excess of the 1989 International Agreement to avoid dam safety concerns. The last event was much larger than the one percent project design. 6.1 Canadian Reservoirs Rafferty reservoir, Boundary reservoir, and Alameda reservoir are regulated by SWA to help manage water flow on the Souris River. As winter progressed it became increasingly more apparent that a significant spring snowmelt event was developing. Spring runoff for the Souris River basin began on or about April 6th with snowmelt peaking in mid April. Flooding was widespread across the Province. The reservoir system worked exactly as planned and was completely successful for the spring snowmelt event. Some flooding occurred through Estevan, but less than the previous historical high.
USACE, St. Paul District – 2011 Post-Flood Report for the Souris River Basin – Revised March 2012 Page 34
The reservoirs were at or near maximum allowable water levels by early May. There was pressure on SWA being applied by the City of Estevan and SaskPower to decrease the discharges from Rafferty reservoir. The technical representatives for North Dakota were also asking for reductions. All rainfall events leading up to the June 17th weekend were managed successfully and peaks at Sherwood were attenuated by the reservoir operations. Souris River flows at Sherwood, North Dakota were successfully kept below the target flow of 114 cms (4,000 cfs) until May 14th, 2011. The snowmelt peak was reduced from an estimated value at Sherwood, under unregulated conditions, of 600 cms (21,200 cfs) to 100 cms (3,500 cfs). The next five peaks were estimated to be between 240 cms (8,500 cfs) to 340 cms (12,000 cfs) were reduced to between 60 cms (2,100 cfs) to 220 cms (7,800 cfs). The final instantaneous peak at Sherwood was 841 cms (29,700 cfs) on June 23rd and the reservoirs were unable to attenuate it. The Souris River basin reservoir system and its operating simulations were designed as single event occurrence. In 2011 the Souris River basin experienced a large snowmelt event followed by a series of large rainfall events ending with a significant rainfall event starting June 17th. The system was overwhelmed. 6.1.1 Boundary Reservoir Boundary reservoir has no flood control storage and is not drawn down prior to Feb 1st. By early February the consensus within SWA was that additional draw downs were necessary, based on the 90th percentile inflow estimates. As a result of their analysis and consultation with technical staff in North Dakota, prior to spring runoff, Boundary reservoir was drawn down to elevation 559.0 m (1,824.1 ft) or 1.2 m (3.9 ft) above the “maximum required drawdown” level outlined in Annex ‘A’ (i.e. lowest elevation allowed). Boundary reservoir’s snowmelt inflow peaked in the middle of April at 150 cms (5,300 cfs). 100 cms (3,500 cfs) was spilled downstream and 50 cms (1,750 cfs) was diverted to Rafferty reservoir. The estimated return period (based on frequency analysis conducted previous to 2011) of the spring runoff volume to Boundary reservoir approached a one percent event. In May and June there were at least eight rainfall events along Long Creek. Boundary reservoir has minimal peak attenuation capacity and the high inflows on Long Creek could not be reduced. Boundary reservoir was spilling 30 cms (1,060 cfs) from the June 17th storm. There was more rain overnight on Tuesday June 21st. Long Creek outflow at Boundary reservoir peaked at 260 cms (9,200 cfs), matching inflows. The maximum flow at the Souris River near Estevan gage was estimated at 770 cms (27,200 cfs). Inflow volume for this event matched total spring inflow volume for Boundary reservoir. The June 17th event approached the volume of a one percent event. Figure 6-1 in Appendix A is a plot of reservoir operations. Operational log data are located in Appendix B.
USACE, St. Paul District – 2011 Post-Flood Report for the Souris River Basin – Revised March 2012 Page 35
6.1.2 Rafferty Reservoir Initially, Rafferty reservoir was drawn down to achieve the normal February 1st objective of 549.5 m (1,802.8 ft). By early February the consensus within SWA was that additional draw downs were necessary, based on the 90th percentile inflow estimates. As a result of their analysis and consultation with technical staff in North Dakota, prior to spring runoff Rafferty reservoir was drawn down to 548.0 m (1,797.9 ft) or 0.5 m (1.6 ft) above the maximum required drawdown. Rafferty reservoir’s snowmelt runoff event was completely stored. Peak spring inflow of 250 cms (8,800 cfs) was fully attenuated. No releases were made until April 22nd. The estimated return period (based on frequency analysis conducted previous to 2011) of the spring runoff volume to Rafferty reservoir was between a one percent and two percent event. Rainfall events during early May resulted in inflow peaks of 150 cms (5,300 cfs) and 200 cms (7,100 cfs). Both were attenuated at 80 cms (2,800 cfs). On May 11th, Rafferty reservoir reached maximum allowable flood level (MAFL). Efforts were made to create reservoir storage but an additional four major rainfall events during May and early June resulted in high reservoir levels with minimal available storage. The inflow volume at Rafferty for the weekend of June 17th was estimated to be 300 000 dams3 (370,000 ac-ft) which is approximately 1.2 times the previously estimated summer PMF volume of 250 000 dams3 (308,000 ac-ft). The June 17th volume occurred over a longer duration than the summer PMF. The spring PMF was previously estimated at 700 000 dams3 (863,000 ac-ft). The spring and summer PMF analysis is currently being updated. The June 17th event volume (300 000 dams3 (370,000 ac-ft)) was approximately 0.85 times the estimated spring inflow volume (350 000 dams3 (432,000 ac-ft)) and was about 0.8 times the one percent event volume (365 000 dams3 (450,000 ac-ft) as determined in the original Rafferty design hydrology). Frequency analysis is to be updated based on the 2011 data. On June 19th the Rafferty reservoir was only 0.3 m (1 foot) below MAFL and unable to attenuate the estimated 500 cms (17,700 cfs) inflow to Rafferty reservoir resulting from continuing large rainfall events. The spillway gates at Rafferty reservoir were fully opened on Monday, June 20th at 8 AM due to concerns over spillway capacity and dam safety. Rafferty reservoir was near MAFL. Reservoir storage was essentially fully occupied and more rains were in the forecast. Dam safety for Rafferty reservoir was essential as there is no additional outlet capacity at Rafferty reservoir. On June 20th the flow at Estevan was estimated at 640 cms (22,600 cfs) with the Rafferty dam discharge at of 510 cms (19,400 cfs) and Boundary dam’s outflow was at 130 cms (4,600 cfs). On June 21st flows at Estevan peaked at approximately 770 cms (27,200 cfs) with outflow estimated at Rafferty at 510 cms (18,000 cfs) and at Boundary at 260 cms (9,200 cfs) Figure 6-2 in Appendix A is a plot of reservoir operations. Operational log is located in Appendix B.
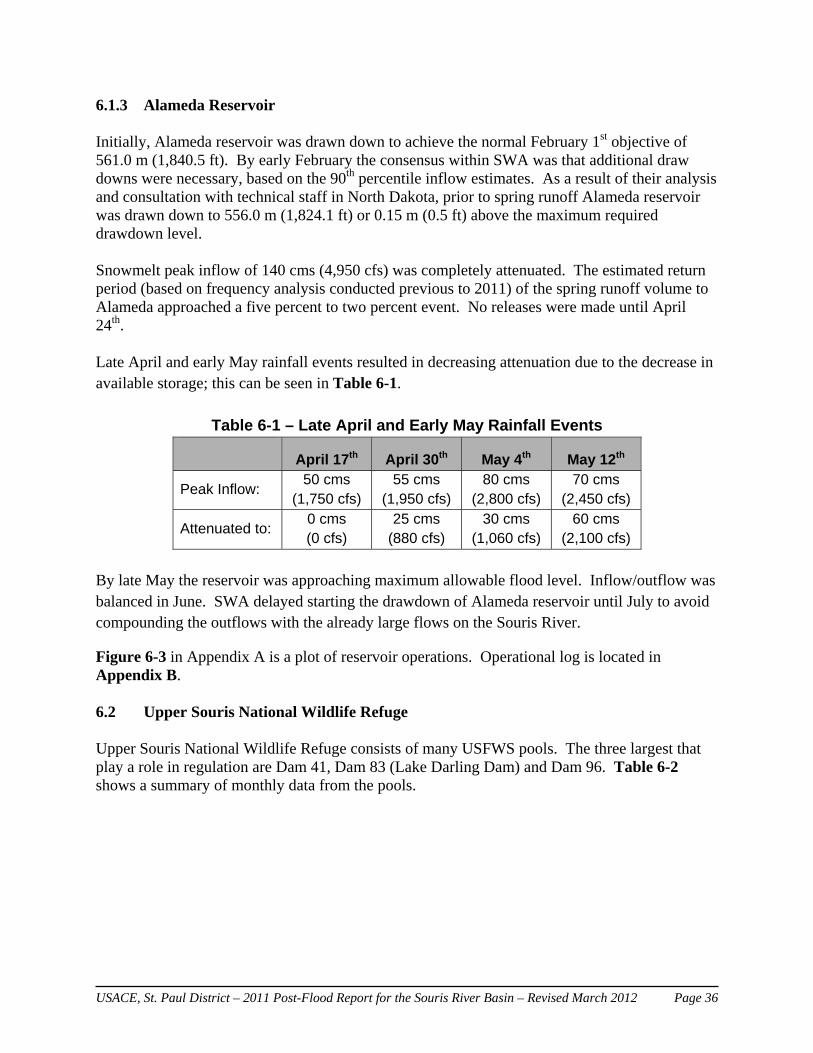
USACE, St. Paul District – 2011 Post-Flood Report for the Souris River Basin – Revised March 2012 Page 36
6.1.3 Alameda Reservoir Initially, Alameda reservoir was drawn down to achieve the normal February 1st objective of 561.0 m (1,840.5 ft). By early February the consensus within SWA was that additional draw downs were necessary, based on the 90th percentile inflow estimates. As a result of their analysis and consultation with technical staff in North Dakota, prior to spring runoff Alameda reservoir was drawn down to 556.0 m (1,824.1 ft) or 0.15 m (0.5 ft) above the maximum required drawdown level. Snowmelt peak inflow of 140 cms (4,950 cfs) was completely attenuated. The estimated return period (based on frequency analysis conducted previous to 2011) of the spring runoff volume to Alameda approached a five percent to two percent event. No releases were made until April 24th.
Late April and early May rainfall events resulted in decreasing attenuation due to the decrease in available storage; this can be seen in Table 6-1.
Table 6-1 – Late April and Early May Rainfall Events
April 17th April 30th May 4th May 12th
Peak Inflow: 50 cms
(1,750 cfs) 55 cms
(1,950 cfs) 80 cms
(2,800 cfs) 70 cms
(2,450 cfs)
Attenuated to: 0 cms (0 cfs)
25 cms (880 cfs)
30 cms (1,060 cfs)
60 cms (2,100 cfs)
By late May the reservoir was approaching maximum allowable flood level. Inflow/outflow was balanced in June. SWA delayed starting the drawdown of Alameda reservoir until July to avoid compounding the outflows with the already large flows on the Souris River.
Figure 6-3 in Appendix A is a plot of reservoir operations. Operational log is located in Appendix B. 6.2 Upper Souris National Wildlife Refuge Upper Souris National Wildlife Refuge consists of many USFWS pools. The three largest that play a role in regulation are Dam 41, Dam 83 (Lake Darling Dam) and Dam 96. Table 6-2 shows a summary of monthly data from the pools.
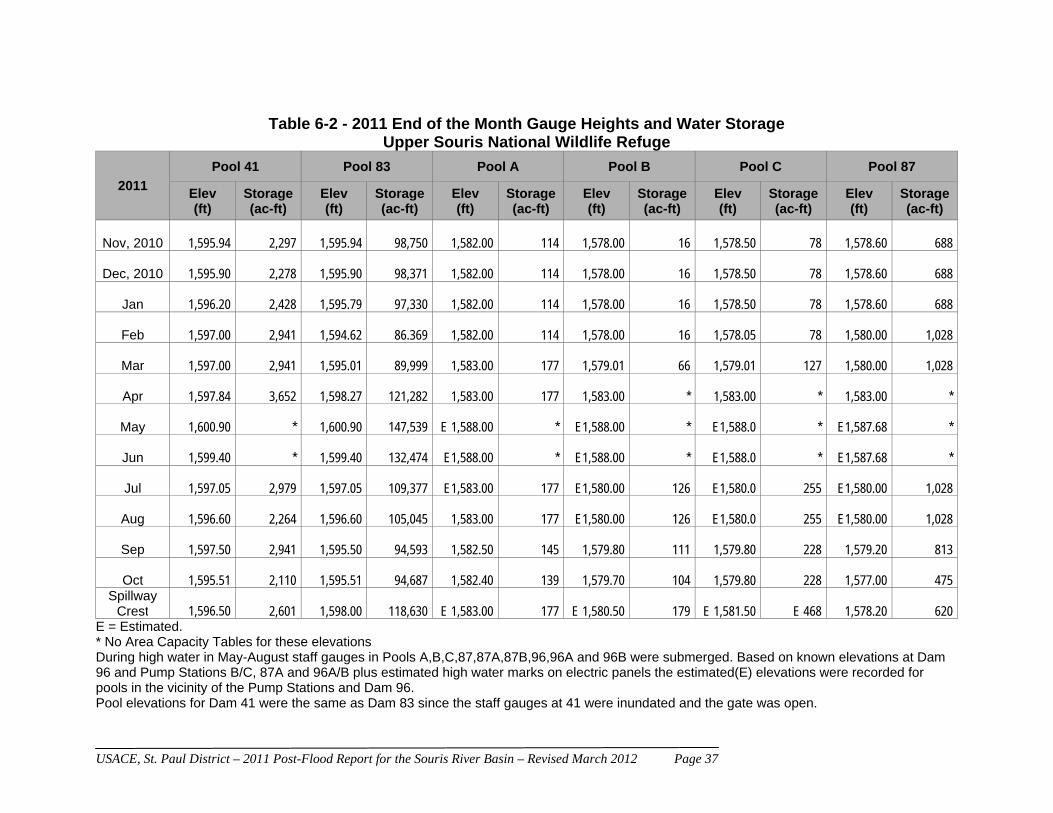
USACE, St. Paul District – 2011 Post-Flood Report for the Souris River Basin – Revised March 2012 Page 37
Table 6-2 - 2011 End of the Month Gauge Heights and Water Storage
Upper Souris National Wildlife Refuge
2011
Pool 41 Pool 83 Pool A Pool B Pool C Pool 87
Elev (ft)
Storage (ac-ft)
Elev (ft)
Storage (ac-ft)
Elev (ft)
Storage (ac-ft)
Elev (ft)
Storage (ac-ft)
Elev (ft)
Storage (ac-ft)
Elev (ft)
Storage (ac-ft)
Nov, 2010 1,595.94 2,297 1,595.94 98,750 1,582.00 114 1,578.00 16 1,578.50 78 1,578.60 688
Dec, 2010 1,595.90 2,278 1,595.90 98,371 1,582.00 114 1,578.00 16 1,578.50 78 1,578.60 688
Jan 1,596.20 2,428 1,595.79 97,330 1,582.00 114 1,578.00 16 1,578.50 78 1,578.60 688
Feb 1,597.00 2,941 1,594.62 86.369 1,582.00 114 1,578.00 16 1,578.05 78 1,580.00 1,028
Mar 1,597.00 2,941 1,595.01 89,999 1,583.00 177 1,579.01 66 1,579.01 127 1,580.00 1,028
Apr 1,597.84 3,652 1,598.27 121,282 1,583.00 177 1,583.00 * 1,583.00 * 1,583.00 *
May 1,600.90 * 1,600.90 147,539 E 1,588.00 * E1,588.00 * E1,588.0 * E1,587.68 *
Jun 1,599.40 * 1,599.40 132,474 E1,588.00 * E1,588.00 * E1,588.0 * E1,587.68 *
Jul 1,597.05 2,979 1,597.05 109,377 E1,583.00 177 E1,580.00 126 E1,580.0 255 E1,580.00 1,028
Aug 1,596.60 2,264 1,596.60 105,045 1,583.00 177 E1,580.00 126 E1,580.0 255 E1,580.00 1,028
Sep 1,597.50 2,941 1,595.50 94,593 1,582.50 145 1,579.80 111 1,579.80 228 1,579.20 813
Oct 1,595.51 2,110 1,595.51 94,687 1,582.40 139 1,579.70 104
1,579.80 228 1,577.00 475 Spillway
Crest 1,596.50
2,601
1,598.00
118,630
E 1,583.00
177
E 1,580.50
179
E 1,581.50
E 468
1,578.20
620 E = Estimated. * No Area Capacity Tables for these elevations During high water in May-August staff gauges in Pools A,B,C,87,87A,87B,96,96A and 96B were submerged. Based on known elevations at Dam 96 and Pump Stations B/C, 87A and 96A/B plus estimated high water marks on electric panels the estimated(E) elevations were recorded for pools in the vicinity of the Pump Stations and Dam 96. Pool elevations for Dam 41 were the same as Dam 83 since the staff gauges at 41 were inundated and the gate was open.
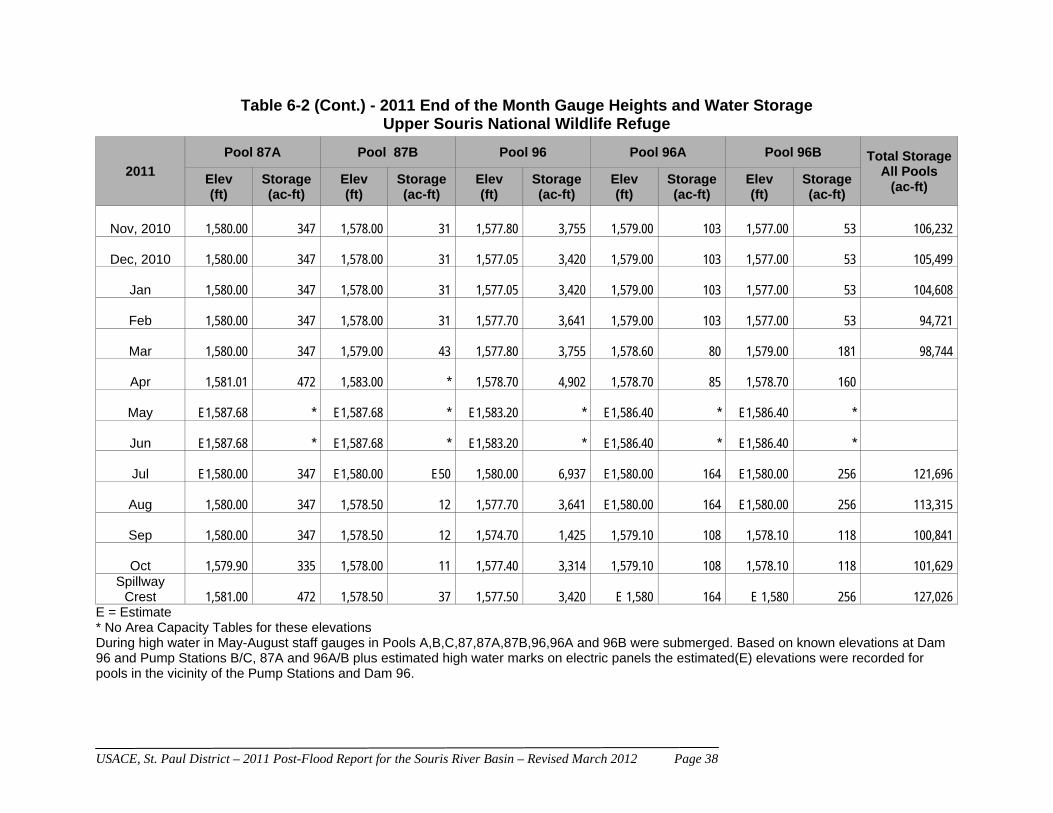
USACE, St. Paul District – 2011 Post-Flood Report for the Souris River Basin – Revised March 2012 Page 38
Table 6-2 (Cont.) - 2011 End of the Month Gauge Heights and Water Storage Upper Souris National Wildlife Refuge
2011
Pool 87A Pool 87B Pool 96 Pool 96A Pool 96B Total StorageAll Pools
(ac-ft) Elev (ft)
Storage
(ac-ft) Elev (ft)
Storage (ac-ft)
Elev (ft)
Storage
(ac-ft) Elev (ft)
Storage
(ac-ft) Elev (ft)
Storage
(ac-ft)
Nov, 2010 1,580.00 347 1,578.00 31 1,577.80 3,755 1,579.00 103 1,577.00 53 106,232
Dec, 2010 1,580.00 347 1,578.00 31 1,577.05 3,420 1,579.00 103 1,577.00 53 105,499
Jan 1,580.00 347 1,578.00 31 1,577.05 3,420 1,579.00 103 1,577.00 53 104,608
Feb 1,580.00 347 1,578.00 31 1,577.70 3,641 1,579.00 103 1,577.00 53 94,721
Mar 1,580.00 347 1,579.00 43 1,577.80 3,755 1,578.60 80 1,579.00 181 98,744
Apr 1,581.01 472 1,583.00 * 1,578.70 4,902 1,578.70 85 1,578.70 160
May E1,587.68 * E1,587.68 * E1,583.20 * E1,586.40 * E1,586.40 *
Jun E1,587.68 * E1,587.68 * E1,583.20 * E1,586.40 * E1,586.40 *
Jul E1,580.00 347 E1,580.00 E50 1,580.00 6,937 E1,580.00 164 E1,580.00 256 121,696
Aug 1,580.00 347 1,578.50 12 1,577.70 3,641 E1,580.00 164 E1,580.00 256 113,315
Sep 1,580.00 347 1,578.50 12 1,574.70 1,425 1,579.10 108 1,578.10 118 100,841
Oct 1,579.90 335 1,578.00 11 1,577.40 3,314 1,579.10 108 1,578.10 118 101,629 Spillway
Crest
1,581.00
472
1,578.50
37
1,577.50
3,420
E 1,580
164
E 1,580
256
127,026 E = Estimate * No Area Capacity Tables for these elevations During high water in May-August staff gauges in Pools A,B,C,87,87A,87B,96,96A and 96B were submerged. Based on known elevations at Dam 96 and Pump Stations B/C, 87A and 96A/B plus estimated high water marks on electric panels the estimated(E) elevations were recorded for pools in the vicinity of the Pump Stations and Dam 96.
USACE, St. Paul District – 2011 Post-Flood Report for the Souris River Basin – Revised March 2012 Page 39
6.2.1 Dam 41 The water surface elevation at Dam 41 on January 1st was 1,596.2 ft (486.5 m) with its single gate wide open. The pool rose to 1,597.0 ft (486.8 m) by February 28th and remained there until April when flows increased substantially. By mid-April the dam, spillway and staff gauges were all inundated when Lake Darling rose to approximately 1,600.0 ft (487.7 m). The dam and spillway remained flooded until mid-July when Lake Darling started to recede. 6.2.2 Dam 83/Lake Darling The drawdown target in 2011 for Lake Darling reservoir was elevation 1,594.7 ft (486.1 m) prior to spring runoff. The target drawdown for Lake Darling reservoir was met on March 1st, 2011. Lake Darling’s full supply level (FSL) is elevation 1,597.0 ft (486.8 m). Maximum Allowable Flood Level (MAFL) is elevation 1,601 ft (488 m). During the event USACE requested and received permission from first the USFWS and then the International Souris River Board to take the pool to elevation 1,601.5 ft (488.1 m) if necessary to keep flows at a manageable level for downstream communities. Lake Darling is regulated to keep the gauge at Minot 4NW below the target flow during a one percent or smaller flood. The Des Lacs River is unregulated and enters the Souris River downstream of Lake Darling Dam, but upstream of the Minot 4NW gauge. During times of peak runoff from the Des Lacs River storage in Lake Darling was utilized to allow peak flows from the Des Lacs River to pass through Minot without increasing the overall level of flow through Minot at the time, then the stored water from Lake Darling was released to keep the Souris River flows at the same level while the Des Lacs River flows receded. Snowmelt began at the beginning of April and Lake Darling Dam’s outflow was reduced to 0 cfs (0 cms) on April 7th to allow local runoff to pass Minot and gates were reopened on April 10th. Snowmelt peak inflow of 5,000 cfs (140 cms) occurred on April 10th. Lake Darling reservoir peaked at an elevation of 1,600.0 ft (487.7 m). Outflow peaked at 4,300 cfs (122 cms) from April 20th to 25th. Lake Darling reservoir was back down to FSL on May 8th. Moderate rainfall events of 2 - 3 in (50-75 mm) during May and early June occurred approximately every seven to ten days. Outflow was cut when possible to reduce flow through Minot 4NW when local runoff from rain occurred. The USACE was able to maintain the target flow of 5,000 cfs (140 cms) at Minot 4NW through mid-May. Reservoir levels did not have a chance to recede in between events and outflow continued to climb throughout these events. The goal then became to raise outflows gradually without running out of storage in Lake Darling. Large rain events from June 17th to 21st above Rafferty and Boundary reservoirs resulted in inflows passing through the dams since they were at maximum capacity and dam safety became a concern at Rafferty Dam. Forecasters had a difficult time modeling this large event partly due to the limited number of precipitation gauges in Saskatchewan. The earlier events had attenuation of the flows occurring between Rafferty reservoir and Sherwood gauge and between Lake Darling reservoir and Minot as the valley storage filled in. The NWS forecast of the timing of the peak flow at Sherwood was calibrated to the multiple events observed to that point. In
USACE, St. Paul District – 2011 Post-Flood Report for the Souris River Basin – Revised March 2012 Page 40
reality, the water reached Sherwood faster than expected (half the time) and the flow attenuation observed in the earlier events did not occur. The peak outflow from Lake Darling Dam was 26,000 cfs (735 cms) on June 25th. Wind set-up on Lake Darling of up to 0.2-0.5 ft (0.01-0.15 m) was also an issue at these high levels. This year’s event included four distinct periods: snow melt, moderate rain events every seven to ten days, the large rain events of June 17th to 21st, and the return to below 500 cfs (14 cms) at Minot 4NW. Figure 6-4 in Appendix A is a plot of reservoir operations. Operational log is located in Appendix B. 6.2.2.1 January through March On January 1st, 2011 the water level of Lake Darling was 1,595.90 ft (468.5 m) with 98,371 ac-ft (120,996 dam3) in storage. Releases at that time were 200 cfs (5.6 cms). Releases during January fluctuated between 100-200 cfs (2.8-5.6 cms). With the first spring runoff forecasts in February releases were increased on February 6th to 230 cfs (6.5 cms) and steadily increased to 1,100 cfs (31 cms) by February 25th. The release of 1,100 cfs (31 cms) was maintained through early April to match inflows from Saskatchewan and also try to increase storage capacity of Lake Darling. Lake Darling met its target drawdown elevation of 1,594.7 ft (486.1 m) on March 1st, 2011. 6.2.2.2 April: Spring Runoff Lake Darling’s outflow was reduced from 1,100 cfs (31 cms) to 0 cfs (0 cms) on April 6th and 7th in order to keep Minot 4NW below 5,000 cfs (140 cms) during snowmelt and in compliance with the international agreement. On April 10th, inflow peaked at 5,000 cfs (140 cms), the pool was at elevation 1,597.9 ft (487.0 m), and outflow was increased to 1,000 cfs (28 cms). As local runoff receded outflow was increased to try to keep Minot 4NW at 5,000 cfs (140 cms) while gaining storage in Lake Darling. Outflow was cut on April 12th due to a rainfall event. The pool peaked at an elevation of 1,600.0 ft (487.7 m) on April 16th with an outflow of 3,900 cfs (110 cms). Outflow peaked at 4,300 cfs (122 cms) on April 20th to 25th. The pool was back down to FSL on May 8th. During snow melt if the Lake Darling reservoir had been completely dry and no outflow was released the reservoir would have filled to the MAFL. Figure 6-5 in Appendix A is a plot of the spring reservoir operations. 6.2.2.3 May to early June: Rain Events every 1-1.5 weeks All or some portions of the Souris basin received moderate rainfall events (about 2-3 in (50-75 mm)) every 1-1.5 weeks in May and June. The USACE was able to maintain the target flow of 5,000 cfs (140 cms) at Minot 4NW through mid-May. At this point, the Canadian reservoirs were full from snow melt and the repeated rainfall events and the 5,000 cfs (140 cms) target could no longer be held. By the fourth week of May the goal was to keep Minot 4NW below

USACE, St. Paul District – 2011 Post-Flood Report for the Souris River Basin – Revised March 2012 Page 41
7,000 cfs (200 cms) while using the maximum available storage in Lake Darling. USACE received permission from USFWS to take the pool half a foot above MAFL if needed. Outflow was cut when possible to reduce flow through Minot 4NW when local runoff from rain occurred. At the beginning of June the maximum allowable Lake Darling elevation was reached and Minot 4NW peaked above 8,200 cfs (230 cms). The pool was at or above 1,601.0 ft (488.0 m) for three days. As Minot 4NW flows receded, outflow was increased to 6,000 cfs (170 cms) in order to try to gain storage before the next wave of inflows hit. By June 8th more flow than expected was on its way from Canada and the minimum outflow was now targeted for 6,600 cfs (185 cms). The USGS measured Sherwood on June 8th and found that the actual flow at the Sherwood gauge was higher than the current rating curve was indicating. Minimum outflow from Lake Darling Dam was now 8,000 cfs (225 cms). Discussions with the Canadians occurred and they were able to make cuts in order to help Lake Darling keep Minot 4NW below 9-10,000 cfs (255-280 cms). Lake Darling reservoir on May 8th was at FSL. The pool peaked three times during these events on May 28th, June 2nd and June 15th. Two of which peaked at the MAFL. Inflow into Lake Darling was greater from each of these events than from spring snow melt. Two inflow peaks occurred during these events the first peaked at 8,000 cfs (225 cms) and the second at 8,800 cfs (250 cms). Outflow continued to climb throughout these events, beginning with less than 4,000 cfs (114 cms) and ending with 8,000 cfs (225 cms). During these rain events from May to mid-June if Lake Darling reservoir had been completely dry and released no outflow it would have filled to the MAFL four times. Figure 6-6 in Appendix A is a plot of the moderate rainfall reservoir operations. 6.2.2.4 The Large Rain in Saskatchewan on June 17th – 21st The NWS informed everyone by June 15th of the potential for a large rain event on June 17/18th. As the rainfall event was realized on June 17th and additional rainfall events occurred on June 19th and June 20th-21st conditions were rapidly changing. The table below summarizes the date and time of the update to known conditions and the plan in response to the updated conditions. Needless to say, as the conditions rapidly changed, so did the Lake Darling Dam operating plan.
Date Time of Day
Conditions Update - SWA Operating Plan, Precipitation, Gauge Response
Lake Darling Reservoir Operation Plan Update
Friday, June 17th
Morning Rainfall above Rafferty, Boundary and Alameda reservoirs of 1+ in (25 mm), rainfall from Sherwood to Minot 0.75+ in (19 mm).
Holding outflows at 7,800 cfs (221 cms).
Friday, June 17th
Night Increasing releases from Rafferty Dam to 6,000 cfs (170 cms), highly probable to increase releases from Rafferty and Boundary Dams on Saturday.
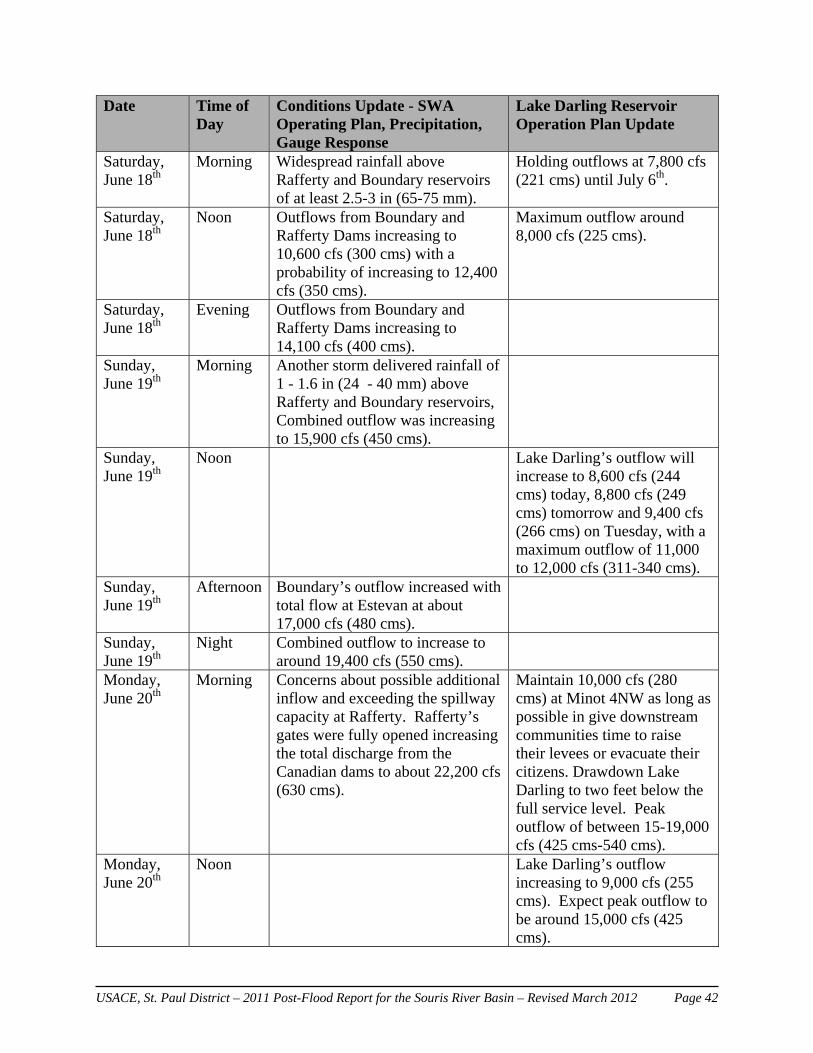
USACE, St. Paul District – 2011 Post-Flood Report for the Souris River Basin – Revised March 2012 Page 42
Date Time of Day
Conditions Update - SWA Operating Plan, Precipitation, Gauge Response
Lake Darling Reservoir Operation Plan Update
Saturday, June 18th
Morning Widespread rainfall above Rafferty and Boundary reservoirs of at least 2.5-3 in (65-75 mm).
Holding outflows at 7,800 cfs (221 cms) until July 6th.
Saturday, June 18th
Noon Outflows from Boundary and Rafferty Dams increasing to 10,600 cfs (300 cms) with a probability of increasing to 12,400 cfs (350 cms).
Maximum outflow around 8,000 cfs (225 cms).
Saturday, June 18th
Evening Outflows from Boundary and Rafferty Dams increasing to 14,100 cfs (400 cms).
Sunday, June 19th
Morning Another storm delivered rainfall of 1 - 1.6 in (24 - 40 mm) above Rafferty and Boundary reservoirs, Combined outflow was increasing to 15,900 cfs (450 cms).
Sunday, June 19th
Noon Lake Darling’s outflow will increase to 8,600 cfs (244 cms) today, 8,800 cfs (249 cms) tomorrow and 9,400 cfs (266 cms) on Tuesday, with a maximum outflow of 11,000 to 12,000 cfs (311-340 cms).
Sunday, June 19th
Afternoon Boundary’s outflow increased with total flow at Estevan at about 17,000 cfs (480 cms).
Sunday, June 19th
Night Combined outflow to increase to around 19,400 cfs (550 cms).
Monday, June 20th
Morning Concerns about possible additional inflow and exceeding the spillway capacity at Rafferty. Rafferty’s gates were fully opened increasing the total discharge from the Canadian dams to about 22,200 cfs (630 cms).
Maintain 10,000 cfs (280 cms) at Minot 4NW as long as possible in give downstream communities time to raise their levees or evacuate their citizens. Drawdown Lake Darling to two feet below the full service level. Peak outflow of between 15-19,000 cfs (425 cms-540 cms).
Monday, June 20th
Noon Lake Darling’s outflow increasing to 9,000 cfs (255 cms). Expect peak outflow to be around 15,000 cfs (425 cms).
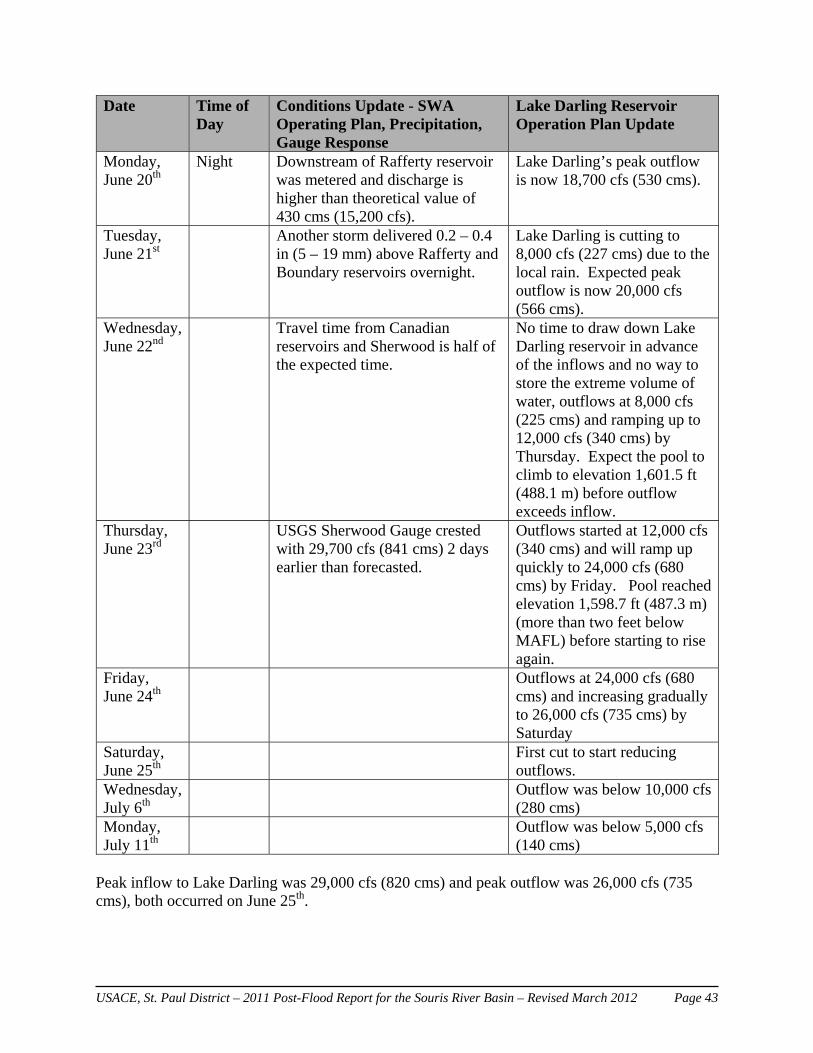
USACE, St. Paul District – 2011 Post-Flood Report for the Souris River Basin – Revised March 2012 Page 43
Date Time of Day
Conditions Update - SWA Operating Plan, Precipitation, Gauge Response
Lake Darling Reservoir Operation Plan Update
Monday, June 20th
Night Downstream of Rafferty reservoir was metered and discharge is higher than theoretical value of 430 cms (15,200 cfs).
Lake Darling’s peak outflow is now 18,700 cfs (530 cms).
Tuesday, June 21st
Another storm delivered 0.2 – 0.4 in (5 – 19 mm) above Rafferty and Boundary reservoirs overnight.
Lake Darling is cutting to 8,000 cfs (227 cms) due to the local rain. Expected peak outflow is now 20,000 cfs (566 cms).
Wednesday, June 22nd
Travel time from Canadian reservoirs and Sherwood is half of the expected time.
No time to draw down Lake Darling reservoir in advance of the inflows and no way to store the extreme volume of water, outflows at 8,000 cfs (225 cms) and ramping up to 12,000 cfs (340 cms) by Thursday. Expect the pool to climb to elevation 1,601.5 ft (488.1 m) before outflow exceeds inflow.
Thursday, June 23rd
USGS Sherwood Gauge crested with 29,700 cfs (841 cms) 2 days earlier than forecasted.
Outflows started at 12,000 cfs (340 cms) and will ramp up quickly to 24,000 cfs (680 cms) by Friday. Pool reached elevation 1,598.7 ft (487.3 m) (more than two feet below MAFL) before starting to rise again.
Friday, June 24th
Outflows at 24,000 cfs (680 cms) and increasing gradually to 26,000 cfs (735 cms) by Saturday
Saturday, June 25th
First cut to start reducing outflows.
Wednesday, July 6th
Outflow was below 10,000 cfs (280 cms)
Monday, July 11th
Outflow was below 5,000 cfs (140 cms)
Peak inflow to Lake Darling was 29,000 cfs (820 cms) and peak outflow was 26,000 cfs (735 cms), both occurred on June 25th.
USACE, St. Paul District – 2011 Post-Flood Report for the Souris River Basin – Revised March 2012 Page 44
During the large rain event in June if Lake Darling reservoir had been completely dry and no outflow was released it would have filled to the MAFL four times. During the inflow peak it would have filled every 3.5 days. Figure 6-7 in Appendix A is a plot of reservoir operations during the large rainfall event. 6.2.2.5 July – Early October: Return to 500 cfs Lake Darling pool was back at FSL on July 5th. It was determined that the pool could be raised one foot (normal elevation increase allowed during summer rain events per the international agreement) in order to get flows at Minot 4NW back down to 5,000 cfs (140 cms) sooner so recovery could start. With inflow still above 5,000 cfs (140 cms) on July 11th outflow was reduced to around 4,500 cfs (127 cms). The international agreement states all flood waters need to be discharged and flow at Minot 4NW needs to be at 500 cfs (14 cms) in order for the flood event to be over. Flood water was discharged from all reservoirs by early August but flows through Minot 4NW were still above 500 cfs (14 cms). Minot 4NW fell below 500 cfs (14 cms) on October 2nd and on October 5th regulation of Lake Darling was transferred back to the U.S. Fish and Wildlife Service from the Corps of Engineers. During July releases were eventually decreased to 2,460 cfs (70 cms) and an elevation of 1,597.05 ft (486.78 m) was reached. From July 29th-August 1st the lake level increased to elevation 1,597.32 ft (486.86 m) and releases were increased to 2,950 cfs (84 cms). Through the remainder of August, September and October releases were decreased slowly to 100 cfs (3 cms) on October 17th and the lake was 1,595.35 ft (486.26 m). Plans through the balance of the year were to match inflow from Canada with lake releases and maintain the lake at 1,595.5 ft (486.3 m). These releases would be in the range of 150-200 cfs (4-6 cms). 6.2.3 Dam 96 On January 1st the USFWS Dam 96 pool was at the spillway elevation of 1,577.5 ft (480.8 m) (with an estimated flow release of 75 cfs (2 cms)). By February 8th, increased flow releases of 225 cfs (6.5 cms) were made to help condition the river ice. By February 28th, the pool had risen above the spillway level and releases were further increased to 1,100 cfs (31 cms). On April 10th, the pool had risen to elevation 1,578.0 ft (481.0 m) from local runoff and further increased to elevation 1,579.9 ft (481.6 m) by April 19th, at which time the dam’s tainter gates were wide open with little control. The pool was still flooded to elevation 1,580.0 ft (481.6 m) by August 1st and slowly decreased to 1,577.7 ft (480.9 m) by August 31st with a release of 420 cfs (12 cms). In preparation for the fall waterfowl migration, an increase in flow release was made to 1,035 cfs (29.3 cms) and the pool was allowed to recede to 1,574.3 ft (479.8 m) by September 20th. A decrease in flow release to 451 cfs (12.8 cms) was made at that time. The lower pool elevation was also needed to facilitate repairs on an upstream dam (Dam 87). Once repairs on Dam 87 were completed the pool was filled to the spillway elevation (1577.5 ft (480.8 m)) and will remain there into freeze-up. Flow releases of approximately 150-200 cfs (4-6 cms) were maintained to reflect releases from Lake Darling.
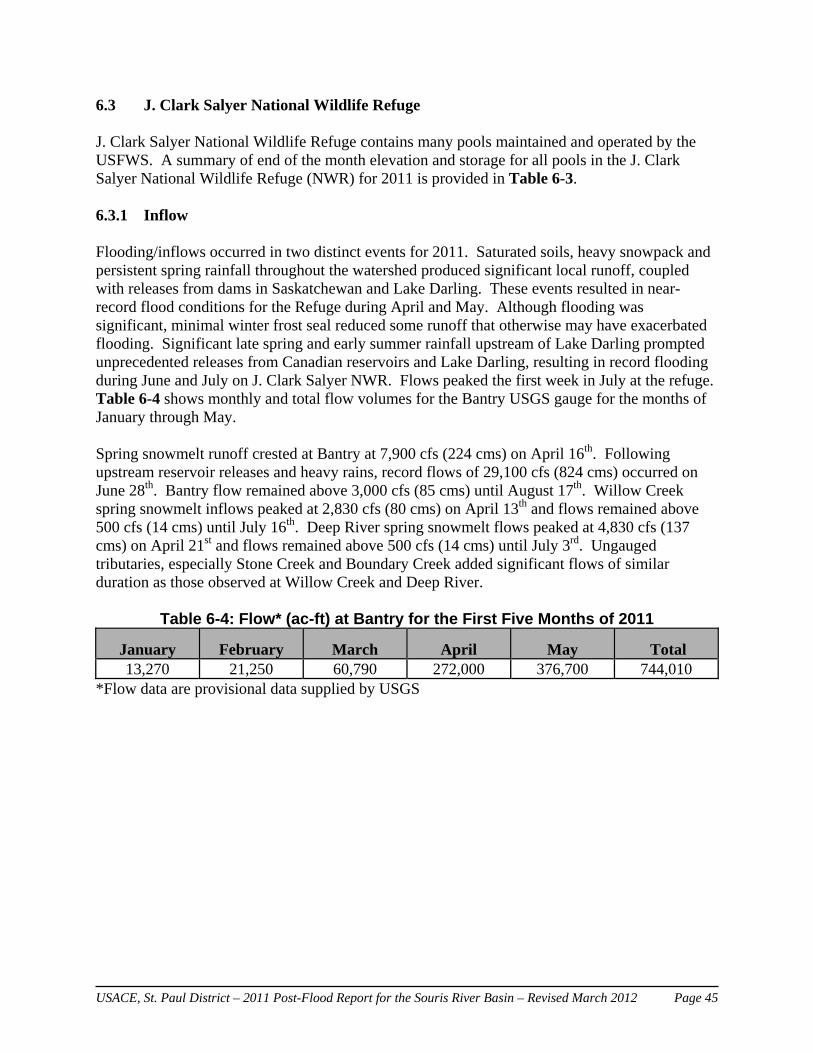
USACE, St. Paul District – 2011 Post-Flood Report for the Souris River Basin – Revised March 2012 Page 45
6.3 J. Clark Salyer National Wildlife Refuge J. Clark Salyer National Wildlife Refuge contains many pools maintained and operated by the USFWS. A summary of end of the month elevation and storage for all pools in the J. Clark Salyer National Wildlife Refuge (NWR) for 2011 is provided in Table 6-3. 6.3.1 Inflow Flooding/inflows occurred in two distinct events for 2011. Saturated soils, heavy snowpack and persistent spring rainfall throughout the watershed produced significant local runoff, coupled with releases from dams in Saskatchewan and Lake Darling. These events resulted in near-record flood conditions for the Refuge during April and May. Although flooding was significant, minimal winter frost seal reduced some runoff that otherwise may have exacerbated flooding. Significant late spring and early summer rainfall upstream of Lake Darling prompted unprecedented releases from Canadian reservoirs and Lake Darling, resulting in record flooding during June and July on J. Clark Salyer NWR. Flows peaked the first week in July at the refuge. Table 6-4 shows monthly and total flow volumes for the Bantry USGS gauge for the months of January through May. Spring snowmelt runoff crested at Bantry at 7,900 cfs (224 cms) on April 16th. Following upstream reservoir releases and heavy rains, record flows of 29,100 cfs (824 cms) occurred on June 28th. Bantry flow remained above 3,000 cfs (85 cms) until August 17th. Willow Creek spring snowmelt inflows peaked at 2,830 cfs (80 cms) on April 13th and flows remained above 500 cfs (14 cms) until July 16th. Deep River spring snowmelt flows peaked at 4,830 cfs (137 cms) on April 21st and flows remained above 500 cfs (14 cms) until July 3rd. Ungauged tributaries, especially Stone Creek and Boundary Creek added significant flows of similar duration as those observed at Willow Creek and Deep River.
Table 6-4: Flow* (ac-ft) at Bantry for the First Five Months of 2011
January
February
March April May
Total 13,270 21,250 60,790 272,000 376,700 744,010
*Flow data are provisional data supplied by USGS
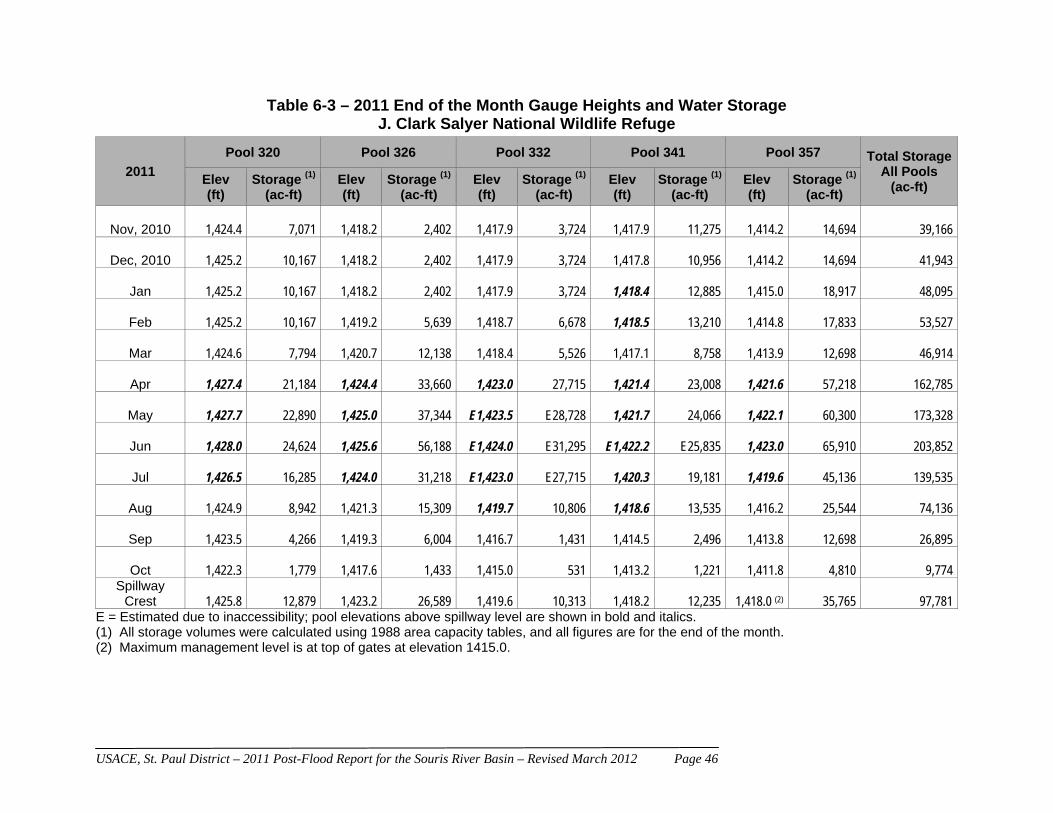
USACE, St. Paul District – 2011 Post-Flood Report for the Souris River Basin – Revised March 2012 Page 46
Table 6-3 – 2011 End of the Month Gauge Heights and Water Storage J. Clark Salyer National Wildlife Refuge
2011
Pool 320 Pool 326 Pool 332 Pool 341 Pool 357 Total StorageAll Pools
(ac-ft) Elev (ft)
Storage (1)
(ac-ft) Elev (ft)
Storage (1)
(ac-ft) Elev (ft)
Storage (1)
(ac-ft) Elev (ft)
Storage (1)
(ac-ft) Elev (ft)
Storage (1)
(ac-ft)
Nov, 2010 1,424.4 7,071 1,418.2 2,402 1,417.9 3,724 1,417.9 11,275 1,414.2 14,694 39,166
Dec, 2010 1,425.2 10,167 1,418.2 2,402 1,417.9 3,724 1,417.8 10,956 1,414.2 14,694 41,943
Jan 1,425.2 10,167 1,418.2 2,402 1,417.9 3,724 1,418.4 12,885 1,415.0 18,917 48,095
Feb 1,425.2 10,167 1,419.2 5,639 1,418.7 6,678 1,418.5 13,210 1,414.8 17,833 53,527
Mar 1,424.6 7,794 1,420.7 12,138 1,418.4 5,526 1,417.1 8,758 1,413.9 12,698 46,914
Apr 1,427.4 21,184 1,424.4 33,660 1,423.0 27,715 1,421.4 23,008 1,421.6 57,218 162,785
May 1,427.7 22,890 1,425.0 37,344 E1,423.5 E28,728 1,421.7 24,066 1,422.1 60,300 173,328
Jun 1,428.0 24,624 1,425.6 56,188 E1,424.0 E31,295 E1,422.2 E25,835 1,423.0 65,910 203,852
Jul 1,426.5 16,285 1,424.0 31,218 E1,423.0 E27,715 1,420.3 19,181 1,419.6 45,136 139,535
Aug 1,424.9 8,942 1,421.3 15,309 1,419.7 10,806 1,418.6 13,535 1,416.2 25,544 74,136
Sep 1,423.5 4,266 1,419.3 6,004 1,416.7 1,431 1,414.5 2,496 1,413.8 12,698 26,895
Oct 1,422.3 1,779 1,417.6 1,433 1,415.0 531 1,413.2 1,221 1,411.8 4,810 9,774 Spillway
Crest 1,425.8 12,879 1,423.2 26,589 1,419.6 10,313 1,418.2 12,235 1,418.0 (2) 35,765 97,781 E = Estimated due to inaccessibility; pool elevations above spillway level are shown in bold and italics. (1) All storage volumes were calculated using 1988 area capacity tables, and all figures are for the end of the month. (2) Maximum management level is at top of gates at elevation 1415.0.
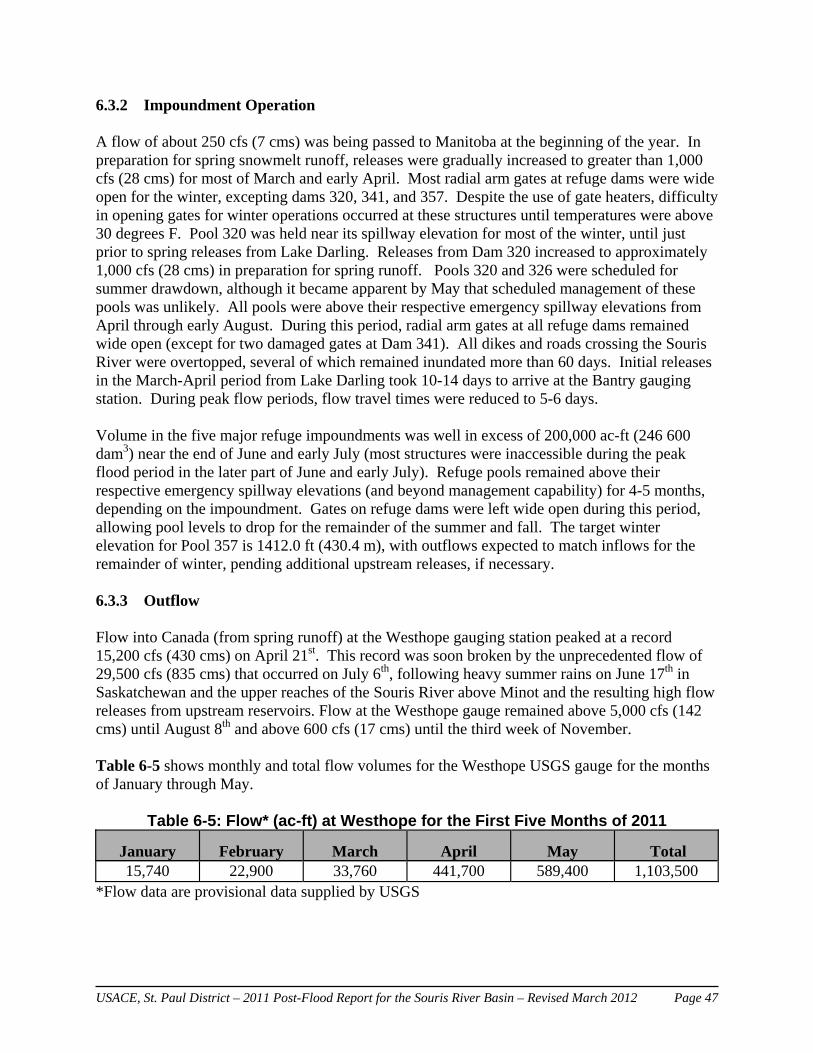
USACE, St. Paul District – 2011 Post-Flood Report for the Souris River Basin – Revised March 2012 Page 47
6.3.2 Impoundment Operation A flow of about 250 cfs (7 cms) was being passed to Manitoba at the beginning of the year. In preparation for spring snowmelt runoff, releases were gradually increased to greater than 1,000 cfs (28 cms) for most of March and early April. Most radial arm gates at refuge dams were wide open for the winter, excepting dams 320, 341, and 357. Despite the use of gate heaters, difficulty in opening gates for winter operations occurred at these structures until temperatures were above 30 degrees F. Pool 320 was held near its spillway elevation for most of the winter, until just prior to spring releases from Lake Darling. Releases from Dam 320 increased to approximately 1,000 cfs (28 cms) in preparation for spring runoff. Pools 320 and 326 were scheduled for summer drawdown, although it became apparent by May that scheduled management of these pools was unlikely. All pools were above their respective emergency spillway elevations from April through early August. During this period, radial arm gates at all refuge dams remained wide open (except for two damaged gates at Dam 341). All dikes and roads crossing the Souris River were overtopped, several of which remained inundated more than 60 days. Initial releases in the March-April period from Lake Darling took 10-14 days to arrive at the Bantry gauging station. During peak flow periods, flow travel times were reduced to 5-6 days. Volume in the five major refuge impoundments was well in excess of 200,000 ac-ft (246 600 dam3) near the end of June and early July (most structures were inaccessible during the peak flood period in the later part of June and early July). Refuge pools remained above their respective emergency spillway elevations (and beyond management capability) for 4-5 months, depending on the impoundment. Gates on refuge dams were left wide open during this period, allowing pool levels to drop for the remainder of the summer and fall. The target winter elevation for Pool 357 is 1412.0 ft (430.4 m), with outflows expected to match inflows for the remainder of winter, pending additional upstream releases, if necessary.
6.3.3 Outflow Flow into Canada (from spring runoff) at the Westhope gauging station peaked at a record 15,200 cfs (430 cms) on April 21st. This record was soon broken by the unprecedented flow of 29,500 cfs (835 cms) that occurred on July 6th, following heavy summer rains on June 17th in Saskatchewan and the upper reaches of the Souris River above Minot and the resulting high flow releases from upstream reservoirs. Flow at the Westhope gauge remained above 5,000 cfs (142 cms) until August 8th and above 600 cfs (17 cms) until the third week of November. Table 6-5 shows monthly and total flow volumes for the Westhope USGS gauge for the months of January through May.
Table 6-5: Flow* (ac-ft) at Westhope for the First Five Months of 2011
January
February
March April May
Total 15,740 22,900 33,760 441,700 589,400 1,103,500
*Flow data are provisional data supplied by USGS
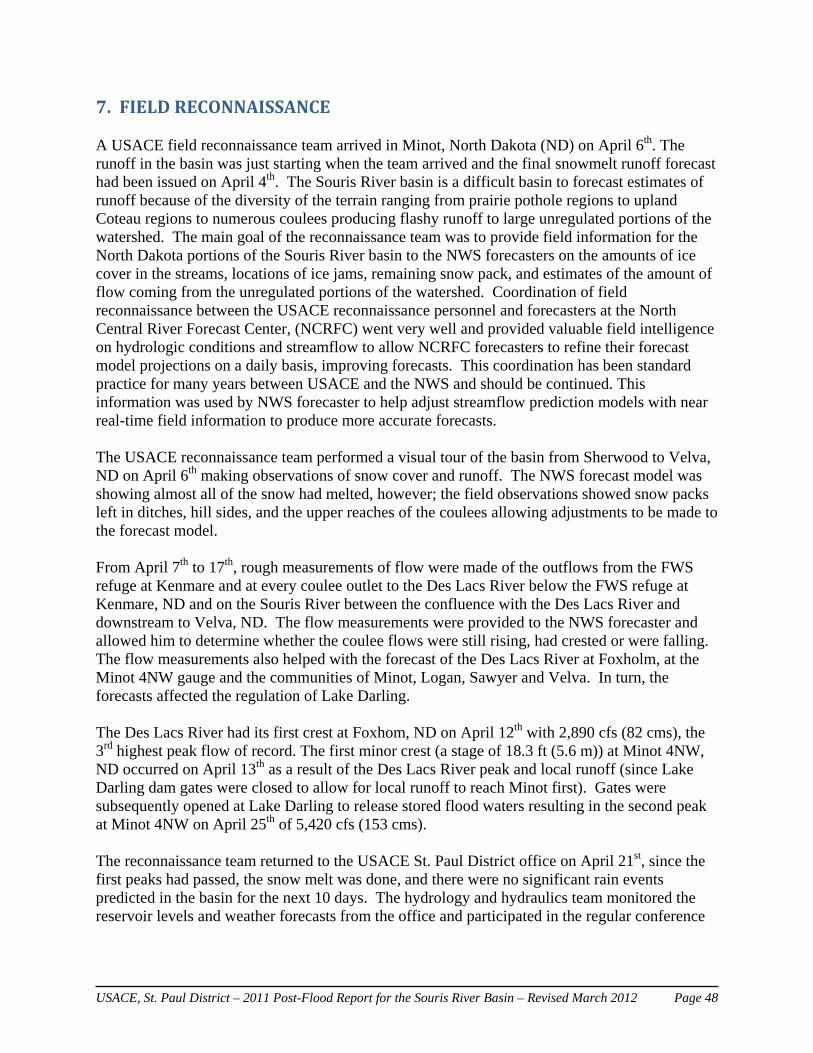
USACE, St. Paul District – 2011 Post-Flood Report for the Souris River Basin – Revised March 2012 Page 48
7.FIELDRECONNAISSANCE A USACE field reconnaissance team arrived in Minot, North Dakota (ND) on April 6th. The runoff in the basin was just starting when the team arrived and the final snowmelt runoff forecast had been issued on April 4th. The Souris River basin is a difficult basin to forecast estimates of runoff because of the diversity of the terrain ranging from prairie pothole regions to upland Coteau regions to numerous coulees producing flashy runoff to large unregulated portions of the watershed. The main goal of the reconnaissance team was to provide field information for the North Dakota portions of the Souris River basin to the NWS forecasters on the amounts of ice cover in the streams, locations of ice jams, remaining snow pack, and estimates of the amount of flow coming from the unregulated portions of the watershed. Coordination of field reconnaissance between the USACE reconnaissance personnel and forecasters at the North Central River Forecast Center, (NCRFC) went very well and provided valuable field intelligence on hydrologic conditions and streamflow to allow NCRFC forecasters to refine their forecast model projections on a daily basis, improving forecasts. This coordination has been standard practice for many years between USACE and the NWS and should be continued. This information was used by NWS forecaster to help adjust streamflow prediction models with near real-time field information to produce more accurate forecasts. The USACE reconnaissance team performed a visual tour of the basin from Sherwood to Velva, ND on April 6th making observations of snow cover and runoff. The NWS forecast model was showing almost all of the snow had melted, however; the field observations showed snow packs left in ditches, hill sides, and the upper reaches of the coulees allowing adjustments to be made to the forecast model. From April 7th to 17th, rough measurements of flow were made of the outflows from the FWS refuge at Kenmare and at every coulee outlet to the Des Lacs River below the FWS refuge at Kenmare, ND and on the Souris River between the confluence with the Des Lacs River and downstream to Velva, ND. The flow measurements were provided to the NWS forecaster and allowed him to determine whether the coulee flows were still rising, had crested or were falling. The flow measurements also helped with the forecast of the Des Lacs River at Foxholm, at the Minot 4NW gauge and the communities of Minot, Logan, Sawyer and Velva. In turn, the forecasts affected the regulation of Lake Darling. The Des Lacs River had its first crest at Foxhom, ND on April 12th with 2,890 cfs (82 cms), the 3rd highest peak flow of record. The first minor crest (a stage of 18.3 ft (5.6 m)) at Minot 4NW, ND occurred on April 13th as a result of the Des Lacs River peak and local runoff (since Lake Darling dam gates were closed to allow for local runoff to reach Minot first). Gates were subsequently opened at Lake Darling to release stored flood waters resulting in the second peak at Minot 4NW on April 25th of 5,420 cfs (153 cms). The reconnaissance team returned to the USACE St. Paul District office on April 21st, since the first peaks had passed, the snow melt was done, and there were no significant rain events predicted in the basin for the next 10 days. The hydrology and hydraulics team monitored the reservoir levels and weather forecasts from the office and participated in the regular conference

USACE, St. Paul District – 2011 Post-Flood Report for the Souris River Basin – Revised March 2012 Page 49
calls with reservoir regulators, forecasters and stakeholders in the basin to determine if and when a reconnaissance team would need to return to the basin. The 3-day QPF on April 26th showed 2.65 in (67 mm) of rain over Alameda reservoir, plus lower amounts of rainfall throughout the Souris Basin. Flows at Minot were 5,300 cfs (150 cms), with the target flow being 5,000 cfs (140 cms). Arrangements were made for reconnaissance personnel to return to Minot on April 29th. The forecast for the Minot area on April 29th was rain turning to snow for a total water content of 1 to 2.75 in (25-70 mm) over a 2 day period. Visual reconnaissance was performed on all 32 coulees on the Des Lacs River between Kenmare and Minot, along with a visual reconnaissance of the coulee inflows to the Souris River from the Canadian border to Velva. While there was slightly more runoff occurring in the coulees and Des Lacs River on May 1st compared to the previous 2 days, the overall basin response in the United States portion of the basin was not significant. The major concern was the response of the Canadian portions of the basin. Reconnaissance personnel returned to the office on May 2nd and continued monitoring the flooding. The City of Minot obtained water surface profiles through the City through the month of May, which allowed more accurate calibration of USACE hydraulic models used to determine emergency levee profiles. Also, the temporary gauge on the Des Lacs River at Burlington was reacting as expected based on the Des Lacs River gauge at Foxholm. The field engineers assisting the local communities provided observations to hydrology and hydraulics team members in the office. Locally higher rainfall amounts than forecast in the Minot area caused immediate high local runoff around Minot resulting in a crest at Minot 4NW on May 23rd of 7,200 cfs (204 cms). Emergency levees were built in Minot after the crest on May 23rd in preparation for more significant rainfall events in the forecast. Heavy rainfall in the upper reaches of the Des Lacs River on May 30th resulted in a crest of 3,480 cfs (99 cms) on the Des Lacs River at Foxholm on June 1st; this crest is the 3rd highest of record. The same rain event caused another crest at Minot 4NW from the local runoff combined with Lake Darling outflows of 8,650 cfs (245 cms). Field reconnaissance personnel were sent to the Minot area to collect high water data from the new Des Lacs crest and monitor the coulee flows and Des Lacs River reactions to the next large rain event on June 6th and 7th. There was little response from the coulees or the Des Lacs River to that rain event and the reconnaissance team returned to the office on June 9th. On the weekend of June 17th very heavy rains fell in the Souris Basin in Saskatchewan with up to 5.25 in (133 mm) above Rafferty reservoir. The reservoir was already near capacity before the rain. Over the next 2 to 3 days the runoff from that rainfall was materializing in the rivers and the total outflow from Boundary, Rafferty and Alameda reservoirs in Canada continued to increase until a total outflow estimate of about 24,000 cfs (680 cms) was determined on June 20th. Reconnaissance engineers and regulators were in the basin on June 20th. They performed visual reconnaissance of the Sherwood Crossing and the Souris River between Sherwood and Lake Darling verifying the progression of flood flows. The crest at Sherwood occurred on June 23rd with a peak flow of 29,700 cfs (840 cms). The crest at the Broadway Bridge in Minot occurred on June 25th with a peak flow of 26,900 cfs (760 cms).
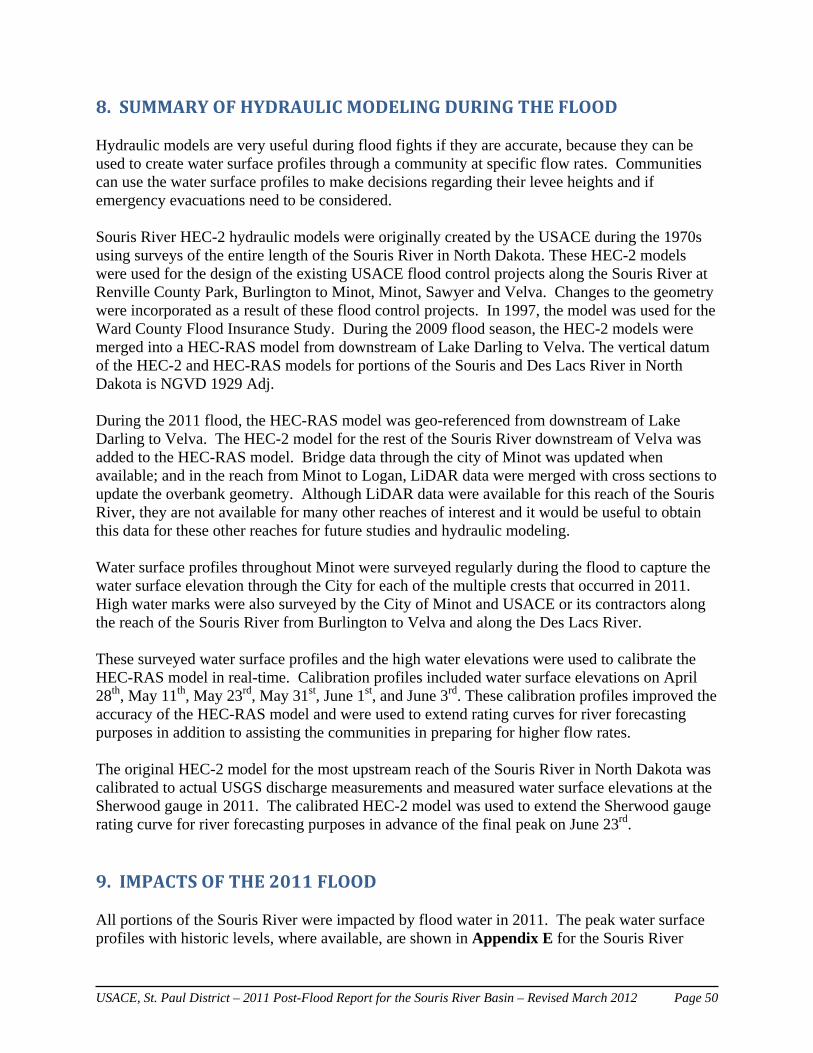
USACE, St. Paul District – 2011 Post-Flood Report for the Souris River Basin – Revised March 2012 Page 50
8.SUMMARYOFHYDRAULICMODELINGDURINGTHEFLOOD Hydraulic models are very useful during flood fights if they are accurate, because they can be used to create water surface profiles through a community at specific flow rates. Communities can use the water surface profiles to make decisions regarding their levee heights and if emergency evacuations need to be considered. Souris River HEC-2 hydraulic models were originally created by the USACE during the 1970s using surveys of the entire length of the Souris River in North Dakota. These HEC-2 models were used for the design of the existing USACE flood control projects along the Souris River at Renville County Park, Burlington to Minot, Minot, Sawyer and Velva. Changes to the geometry were incorporated as a result of these flood control projects. In 1997, the model was used for the Ward County Flood Insurance Study. During the 2009 flood season, the HEC-2 models were merged into a HEC-RAS model from downstream of Lake Darling to Velva. The vertical datum of the HEC-2 and HEC-RAS models for portions of the Souris and Des Lacs River in North Dakota is NGVD 1929 Adj. During the 2011 flood, the HEC-RAS model was geo-referenced from downstream of Lake Darling to Velva. The HEC-2 model for the rest of the Souris River downstream of Velva was added to the HEC-RAS model. Bridge data through the city of Minot was updated when available; and in the reach from Minot to Logan, LiDAR data were merged with cross sections to update the overbank geometry. Although LiDAR data were available for this reach of the Souris River, they are not available for many other reaches of interest and it would be useful to obtain this data for these other reaches for future studies and hydraulic modeling. Water surface profiles throughout Minot were surveyed regularly during the flood to capture the water surface elevation through the City for each of the multiple crests that occurred in 2011. High water marks were also surveyed by the City of Minot and USACE or its contractors along the reach of the Souris River from Burlington to Velva and along the Des Lacs River. These surveyed water surface profiles and the high water elevations were used to calibrate the HEC-RAS model in real-time. Calibration profiles included water surface elevations on April 28th, May 11th, May 23rd, May 31st, June 1st, and June 3rd. These calibration profiles improved the accuracy of the HEC-RAS model and were used to extend rating curves for river forecasting purposes in addition to assisting the communities in preparing for higher flow rates. The original HEC-2 model for the most upstream reach of the Souris River in North Dakota was calibrated to actual USGS discharge measurements and measured water surface elevations at the Sherwood gauge in 2011. The calibrated HEC-2 model was used to extend the Sherwood gauge rating curve for river forecasting purposes in advance of the final peak on June 23rd. 9.IMPACTSOFTHE2011FLOOD All portions of the Souris River were impacted by flood water in 2011. The peak water surface profiles with historic levels, where available, are shown in Appendix E for the Souris River
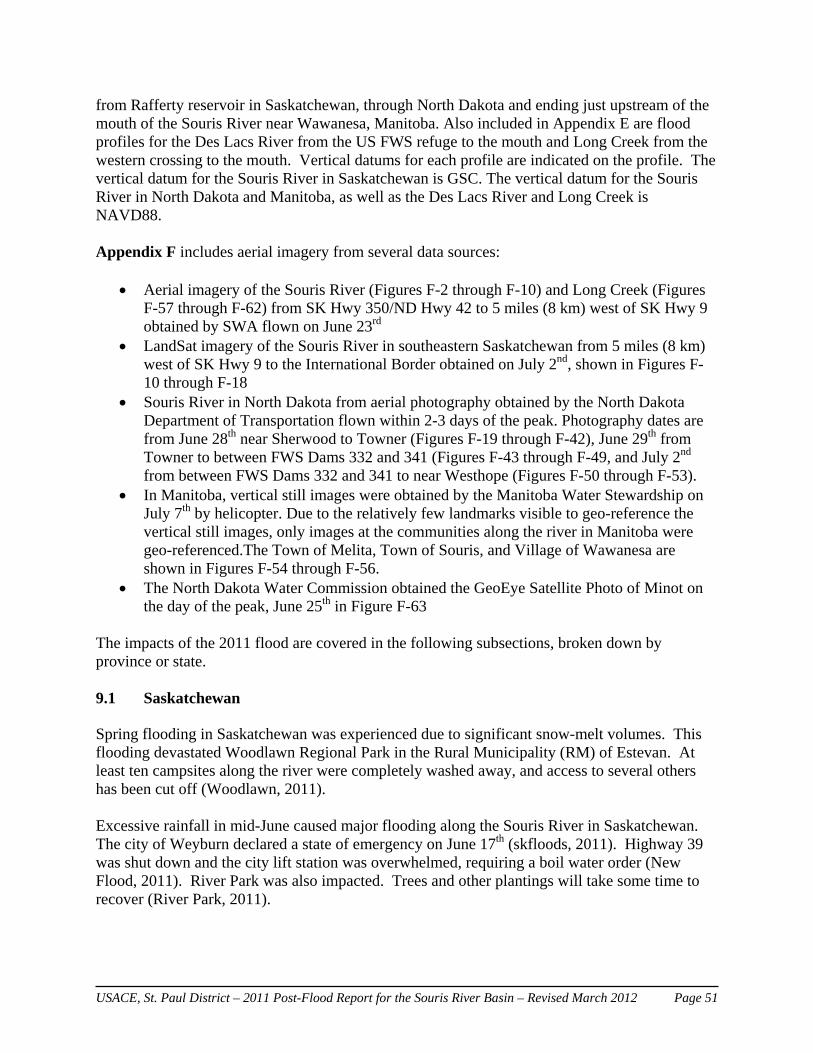
USACE, St. Paul District – 2011 Post-Flood Report for the Souris River Basin – Revised March 2012 Page 51
from Rafferty reservoir in Saskatchewan, through North Dakota and ending just upstream of the mouth of the Souris River near Wawanesa, Manitoba. Also included in Appendix E are flood profiles for the Des Lacs River from the US FWS refuge to the mouth and Long Creek from the western crossing to the mouth. Vertical datums for each profile are indicated on the profile. The vertical datum for the Souris River in Saskatchewan is GSC. The vertical datum for the Souris River in North Dakota and Manitoba, as well as the Des Lacs River and Long Creek is NAVD88. Appendix F includes aerial imagery from several data sources:
Aerial imagery of the Souris River (Figures F-2 through F-10) and Long Creek (Figures F-57 through F-62) from SK Hwy 350/ND Hwy 42 to 5 miles (8 km) west of SK Hwy 9 obtained by SWA flown on June 23rd
LandSat imagery of the Souris River in southeastern Saskatchewan from 5 miles (8 km) west of SK Hwy 9 to the International Border obtained on July 2nd, shown in Figures F-10 through F-18
Souris River in North Dakota from aerial photography obtained by the North Dakota Department of Transportation flown within 2-3 days of the peak. Photography dates are from June 28th near Sherwood to Towner (Figures F-19 through F-42), June 29th from Towner to between FWS Dams 332 and 341 (Figures F-43 through F-49, and July 2nd from between FWS Dams 332 and 341 to near Westhope (Figures F-50 through F-53).
In Manitoba, vertical still images were obtained by the Manitoba Water Stewardship on July 7th by helicopter. Due to the relatively few landmarks visible to geo-reference the vertical still images, only images at the communities along the river in Manitoba were geo-referenced.The Town of Melita, Town of Souris, and Village of Wawanesa are shown in Figures F-54 through F-56.
The North Dakota Water Commission obtained the GeoEye Satellite Photo of Minot on the day of the peak, June 25th in Figure F-63
The impacts of the 2011 flood are covered in the following subsections, broken down by province or state. 9.1 Saskatchewan Spring flooding in Saskatchewan was experienced due to significant snow-melt volumes. This flooding devastated Woodlawn Regional Park in the Rural Municipality (RM) of Estevan. At least ten campsites along the river were completely washed away, and access to several others has been cut off (Woodlawn, 2011). Excessive rainfall in mid-June caused major flooding along the Souris River in Saskatchewan. The city of Weyburn declared a state of emergency on June 17th (skfloods, 2011). Highway 39 was shut down and the city lift station was overwhelmed, requiring a boil water order (New Flood, 2011). River Park was also impacted. Trees and other plantings will take some time to recover (River Park, 2011).
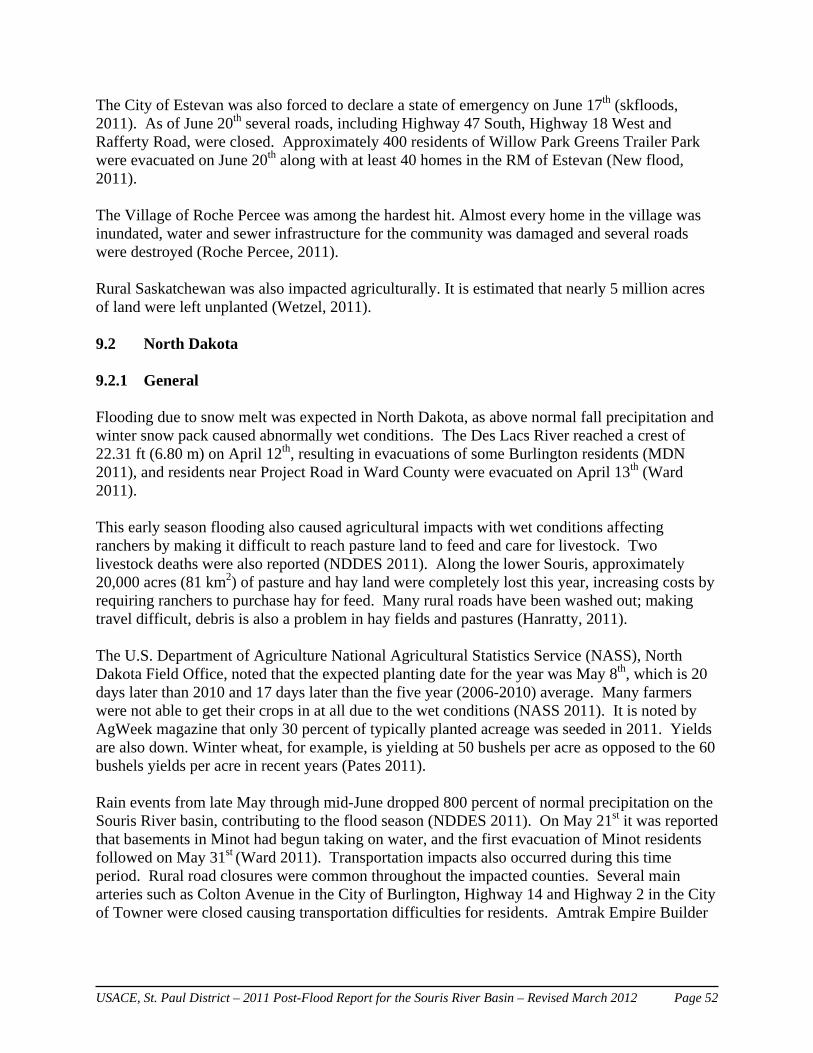
USACE, St. Paul District – 2011 Post-Flood Report for the Souris River Basin – Revised March 2012 Page 52
The City of Estevan was also forced to declare a state of emergency on June 17th (skfloods, 2011). As of June 20th several roads, including Highway 47 South, Highway 18 West and Rafferty Road, were closed. Approximately 400 residents of Willow Park Greens Trailer Park were evacuated on June 20th along with at least 40 homes in the RM of Estevan (New flood, 2011). The Village of Roche Percee was among the hardest hit. Almost every home in the village was inundated, water and sewer infrastructure for the community was damaged and several roads were destroyed (Roche Percee, 2011). Rural Saskatchewan was also impacted agriculturally. It is estimated that nearly 5 million acres of land were left unplanted (Wetzel, 2011). 9.2 North Dakota 9.2.1 General Flooding due to snow melt was expected in North Dakota, as above normal fall precipitation and winter snow pack caused abnormally wet conditions. The Des Lacs River reached a crest of 22.31 ft (6.80 m) on April 12th, resulting in evacuations of some Burlington residents (MDN 2011), and residents near Project Road in Ward County were evacuated on April 13th (Ward 2011). This early season flooding also caused agricultural impacts with wet conditions affecting ranchers by making it difficult to reach pasture land to feed and care for livestock. Two livestock deaths were also reported (NDDES 2011). Along the lower Souris, approximately 20,000 acres (81 km2) of pasture and hay land were completely lost this year, increasing costs by requiring ranchers to purchase hay for feed. Many rural roads have been washed out; making travel difficult, debris is also a problem in hay fields and pastures (Hanratty, 2011). The U.S. Department of Agriculture National Agricultural Statistics Service (NASS), North Dakota Field Office, noted that the expected planting date for the year was May 8th, which is 20 days later than 2010 and 17 days later than the five year (2006-2010) average. Many farmers were not able to get their crops in at all due to the wet conditions (NASS 2011). It is noted by AgWeek magazine that only 30 percent of typically planted acreage was seeded in 2011. Yields are also down. Winter wheat, for example, is yielding at 50 bushels per acre as opposed to the 60 bushels yields per acre in recent years (Pates 2011). Rain events from late May through mid-June dropped 800 percent of normal precipitation on the Souris River basin, contributing to the flood season (NDDES 2011). On May 21st it was reported that basements in Minot had begun taking on water, and the first evacuation of Minot residents followed on May 31st (Ward 2011). Transportation impacts also occurred during this time period. Rural road closures were common throughout the impacted counties. Several main arteries such as Colton Avenue in the City of Burlington, Highway 14 and Highway 2 in the City of Towner were closed causing transportation difficulties for residents. Amtrak Empire Builder

USACE, St. Paul District – 2011 Post-Flood Report for the Souris River Basin – Revised March 2012 Page 53
Line service was suspended between St. Paul, Minnesota and Havre, Montana due to impacts to the depot and rail lines (NDDES 2011). At the request of Governor Dalrymple, President Obama issued a major disaster declaration for the State of North Dakota in FEMA-1981-DR on May 10th, 2011. This declaration ordered the release of federal funds to aid flooded North Dakota communities. Impacts from a large rain event occurred in mid to late June. This rain event caused the river to crest in Minot at 1,561.72 ft (476.01 m) and 27,400 cfs (775 cms) on June 26th, 2011. In response, the Governor of North Dakota issued Executive Order 2011-16 requiring evacuations on June 22nd, 2011. The evacuation of the residents of Velva and Minot on June 24th soon followed the order. The Highway 41 Bridge was closed in Velva on June 25th (Velva 2011) and was not reopened until June 30th. The only North-South route that remained open through Minot was the United States Highway 83 bypass leading to travel times in excess of two hours. Mr. Alan Walter, Public Works Director for the City of Minot, noted that the 2011 flood necessitated the evacuation of approximately 4,000 homes and 12,000 residents, which is roughly one-third of the City population. Of the 4,000 homes evacuated approximately 3,200 were filled with at least six feet of water. In addition, damage occurred to approximately 200 businesses. Mr. Walter estimated property damage totals at $600 million with infrastructure damages, including the loss of all lift stations within the city (NDDES 2011) and a compromised water system, at $100-150 million (NDLM 2011). Also, 61,000 tons of debris along with household chemicals, paint, batteries and other possibly hazardous materials were also removed from the City of Minot (NDDES 2011). The Mouse River Park, near Kenmare, ND, also suffered significant impacts. The park is bounded by the Souris River on three sides during high river levels and by a hillside on the remaining side, so when it became inundated there was no outlet for the water and the structures within the park were damaged beyond repair. The bar and café located in the campground are both being demolished and rebuilt. The park took a hit economically, due to lost income combined with the money spent on flood protection (Wisinewski, 2011). Impacts to the City of Burlington included the loss of a lift station, a city sports complex, a civil defense siren and damage to several streets. Homes and trees were lost, and two elderly deaths occurred as a result of the flooding. Former residents have chosen to move out of the city, decreasing the tax base and the ability of the community to rebuild (Burlington 2011) The city of Velva was able to keep the Souris within its levees, but had damage to roadways, a local cemetery, and a water main break due to flooding requiring a boil water order. (Velva 2011) Five bridges were washed out in Bottineau County, and damages to agricultural land from inundation were also experienced. (Hummel 2011). The USACE contributed to the flood fight by deploying several expert teams, providing technical assistance regarding levee strategy and care, engaging several contractors to complete levee construction to handle 9,000 cfs (255 cms) and maintenance of the structures, issuing sandbags and pumps to local communities and conducting levee surveillance (NDDES, 2011).
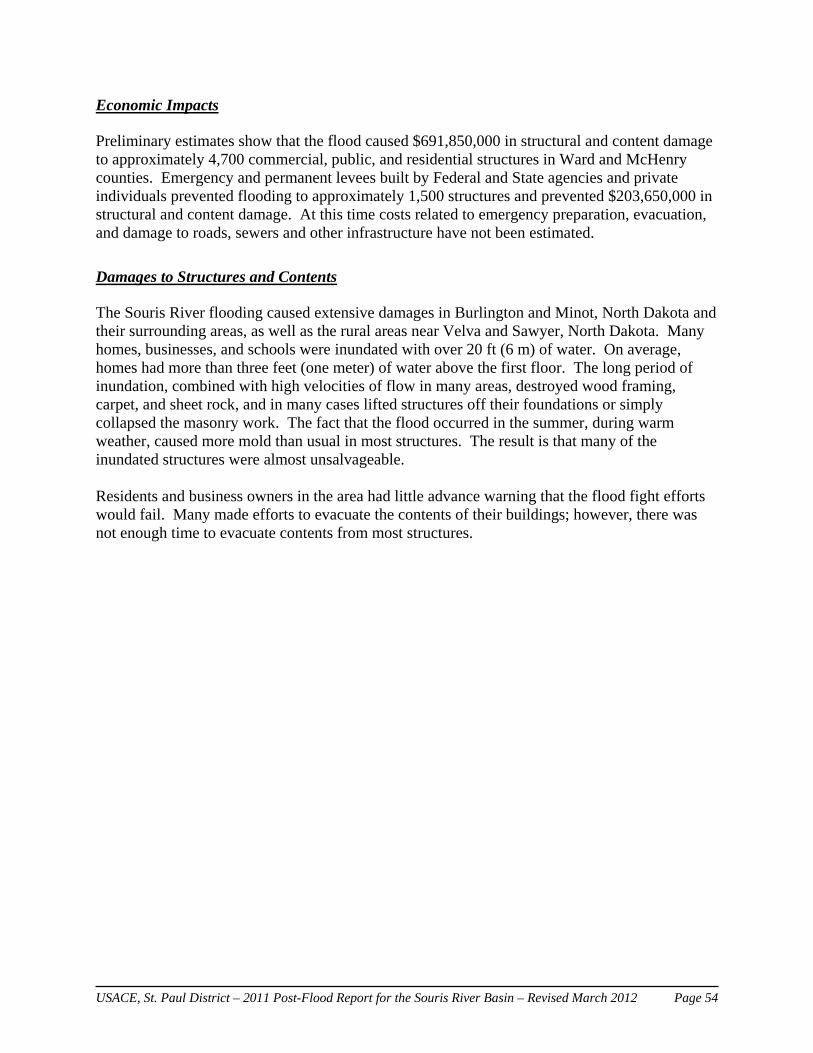
USACE, St. Paul District – 2011 Post-Flood Report for the Souris River Basin – Revised March 2012 Page 54
Economic Impacts Preliminary estimates show that the flood caused $691,850,000 in structural and content damage to approximately 4,700 commercial, public, and residential structures in Ward and McHenry counties. Emergency and permanent levees built by Federal and State agencies and private individuals prevented flooding to approximately 1,500 structures and prevented $203,650,000 in structural and content damage. At this time costs related to emergency preparation, evacuation, and damage to roads, sewers and other infrastructure have not been estimated.
Damages to Structures and Contents The Souris River flooding caused extensive damages in Burlington and Minot, North Dakota and their surrounding areas, as well as the rural areas near Velva and Sawyer, North Dakota. Many homes, businesses, and schools were inundated with over 20 ft (6 m) of water. On average, homes had more than three feet (one meter) of water above the first floor. The long period of inundation, combined with high velocities of flow in many areas, destroyed wood framing, carpet, and sheet rock, and in many cases lifted structures off their foundations or simply collapsed the masonry work. The fact that the flood occurred in the summer, during warm weather, caused more mold than usual in most structures. The result is that many of the inundated structures were almost unsalvageable. Residents and business owners in the area had little advance warning that the flood fight efforts would fail. Many made efforts to evacuate the contents of their buildings; however, there was not enough time to evacuate contents from most structures.

USACE, St. Paul District – 2011 Post-Flood Report for the Souris River Basin – Revised March 2012 Page 55
Residential Commercial Farm Public Total
Burlington $27,412 $3,609 $1,216 $148 $32,386
Minot $398,693 $131,923 $5,515 $41,089 $577,220
Sawyer $0 $144 $0 $0 $144
Velva $197 $694 $107 $0 $998
Rural $54,172 $21,929 $4,579 $422 $81,102
Total $480,473 $158,299 $11,418 $41,659 $691,850
*Damages to Buildings and Contents
Above - left to right: basement damage; contents of home awaiting debris removal; home being demolished; inundated trailer home after gas fire.
The best preliminary data shows that in Ward and McHenry counties, a total of 4,127 homes and apartments were flooded, and 480 commercial structures, 86 farm structures, and 41 Public structures were flooded. Damage to residential structures alone was $480,473,000; and damages to commercial, public and farm structures amounted to $211,376,000. The total structure and content damage amounted to $691,850,000, with structural damage totaling $507,981,000 (59 percent) and content damage totaling $358,091,000 (41 percent). Table 9-1 shows the damages sustained by category for each area in Ward and McHenry counties and Table 9-2 shows the number of structures flooded in each area.
Table 9-1: Damages Sustained ($1,000's)
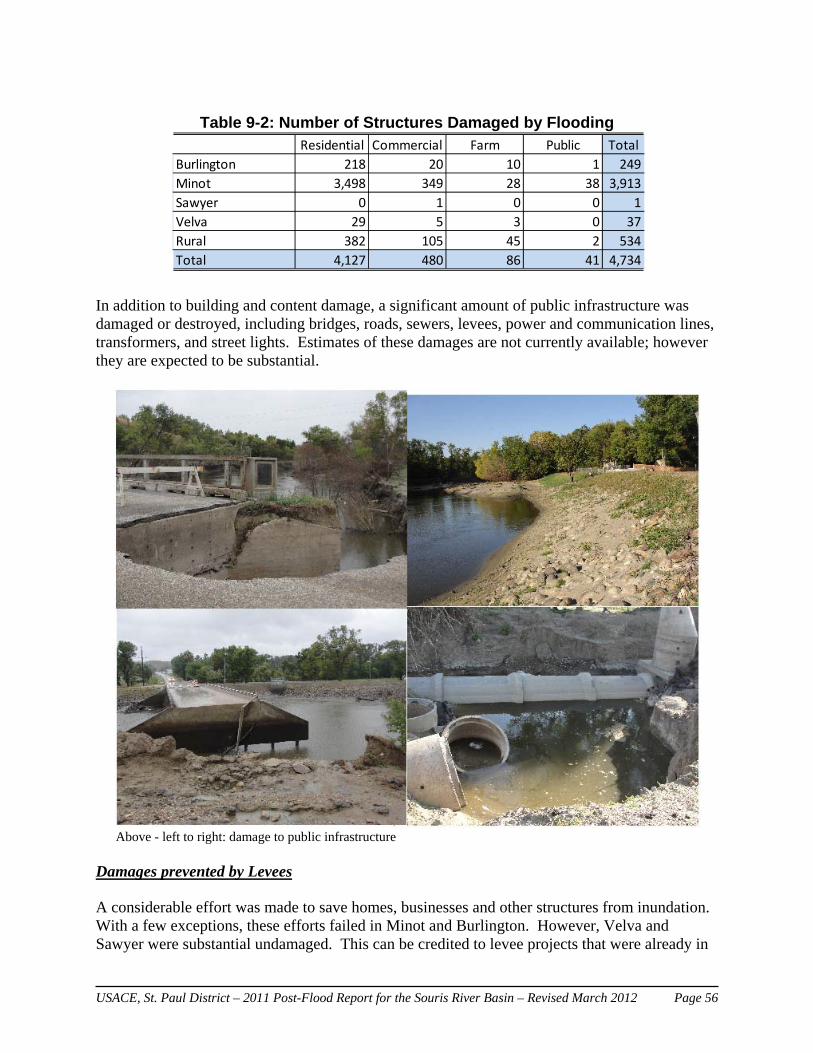
USACE, St. Paul District – 2011 Post-Flood Report for the Souris River Basin – Revised March 2012 Page 56
Residential Commercial Farm Public Total
Burlington 218 20 10 1 249
Minot 3,498 349 28 38 3,913
Sawyer 0 1 0 0 1
Velva 29 5 3 0 37
Rural 382 105 45 2 534
Total 4,127 480 86 41 4,734
Table 9-2: Number of Structures Damaged by Flooding
In addition to building and content damage, a significant amount of public infrastructure was damaged or destroyed, including bridges, roads, sewers, levees, power and communication lines, transformers, and street lights. Estimates of these damages are not currently available; however they are expected to be substantial.
Above - left to right: damage to public infrastructure Damages prevented by Levees A considerable effort was made to save homes, businesses and other structures from inundation. With a few exceptions, these efforts failed in Minot and Burlington. However, Velva and Sawyer were substantial undamaged. This can be credited to levee projects that were already in
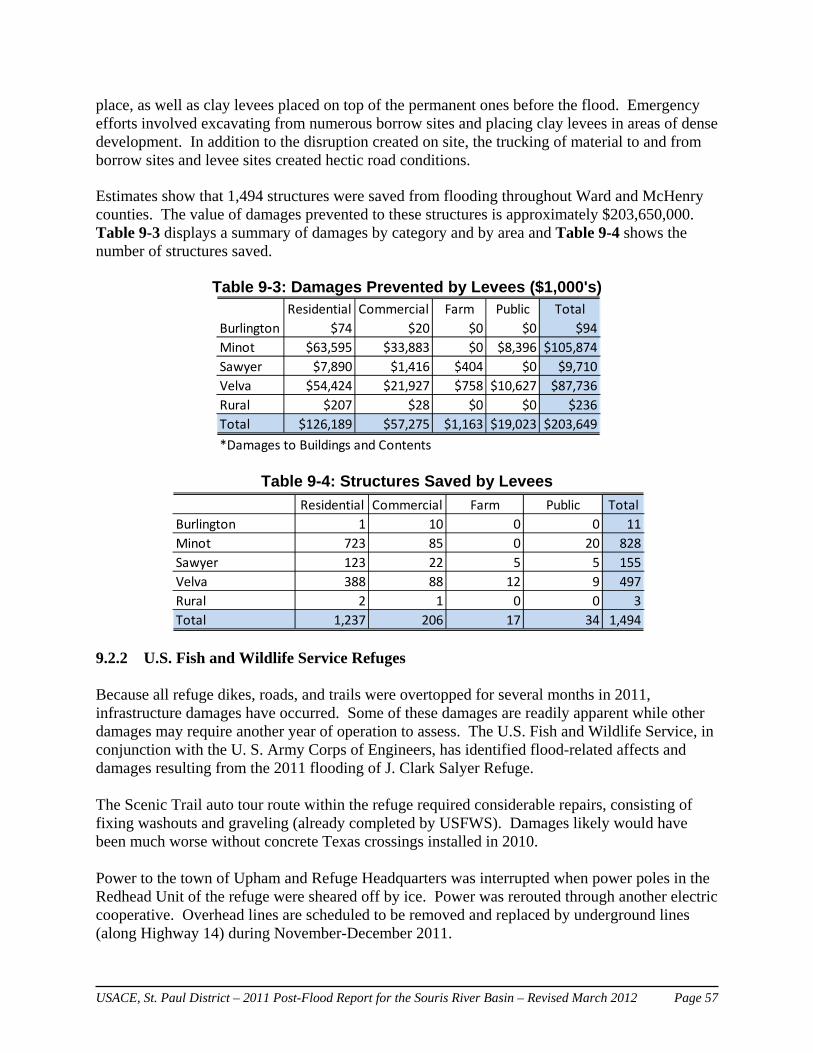
USACE, St. Paul District – 2011 Post-Flood Report for the Souris River Basin – Revised March 2012 Page 57
Residential Commercial Farm Public Total
Burlington $74 $20 $0 $0 $94
Minot $63,595 $33,883 $0 $8,396 $105,874
Sawyer $7,890 $1,416 $404 $0 $9,710
Velva $54,424 $21,927 $758 $10,627 $87,736
Rural $207 $28 $0 $0 $236
Total $126,189 $57,275 $1,163 $19,023 $203,649
*Damages to Buildings and Contents
Residential Commercial Farm Public Total
Burlington 1 10 0 0 11
Minot 723 85 0 20 828
Sawyer 123 22 5 5 155
Velva 388 88 12 9 497
Rural 2 1 0 0 3
Total 1,237 206 17 34 1,494
place, as well as clay levees placed on top of the permanent ones before the flood. Emergency efforts involved excavating from numerous borrow sites and placing clay levees in areas of dense development. In addition to the disruption created on site, the trucking of material to and from borrow sites and levee sites created hectic road conditions. Estimates show that 1,494 structures were saved from flooding throughout Ward and McHenry counties. The value of damages prevented to these structures is approximately $203,650,000. Table 9-3 displays a summary of damages by category and by area and Table 9-4 shows the number of structures saved.
Table 9-3: Damages Prevented by Levees ($1,000's)
Table 9-4: Structures Saved by Levees
9.2.2 U.S. Fish and Wildlife Service Refuges Because all refuge dikes, roads, and trails were overtopped for several months in 2011, infrastructure damages have occurred. Some of these damages are readily apparent while other damages may require another year of operation to assess. The U.S. Fish and Wildlife Service, in conjunction with the U. S. Army Corps of Engineers, has identified flood-related affects and damages resulting from the 2011 flooding of J. Clark Salyer Refuge. The Scenic Trail auto tour route within the refuge required considerable repairs, consisting of fixing washouts and graveling (already completed by USFWS). Damages likely would have been much worse without concrete Texas crossings installed in 2010. Power to the town of Upham and Refuge Headquarters was interrupted when power poles in the Redhead Unit of the refuge were sheared off by ice. Power was rerouted through another electric cooperative. Overhead lines are scheduled to be removed and replaced by underground lines (along Highway 14) during November-December 2011.
USACE, St. Paul District – 2011 Post-Flood Report for the Souris River Basin – Revised March 2012 Page 58
Newberg and Sheflo Bridge crossings were lost during the flood. Both structures are scheduled for removal and replacement by Bottineau County. All county and State Highway crossings (roads and bridges) required extensive repairs, some of which were completed this fall, while others are expected to be completed next year. Gravel and soil were displaced on all refuge water control structure access roads and dikes, requiring contouring, gravel, and riprap in some circumstances. Some repairs were completed this fall by the USFWS, but most will be completed in 2012. All wood stop logs on smaller water control structures were lost during the flood and require replacement in 2012 (USFWS). Abutments required replacement/repair for screw gates structures in the Benson and Redhead subimpoundments (completed this fall by USFWS). Damages occurred at the Dam 320, 326, 332, 341, and 357 water control structures. All electrical transformers were inspected and replaced as necessary by the North Central Electric Cooperative. Security fences at all structures were damaged, mainly by wind driven ice and water born debris (repairs needed). Gate heaters, some electrical lines, and grease lines were damaged at most structures (repairs needed). Gate heaters in particular will require inspection and replacement (where needed) at all structures. At the Dam 341 structure, the east gate is inoperable. The west gate can only be opened partially (load limit switches are tripped). At the Dam 320 structure, the center gate cannot be closed (currently open) and/or the load limit switch is tripped when gate opening is attempted. Radial-arm gate seals are the suspected cause and adjustments may be attempted during the winter of 2011-2012. The Dam 341 structure may have further gate alignment issues. The spare gate actuator was swapped out at the east Dam 341 gate. The original actuator has been sent to the manufacturer for refurbishment. Rubber side seals on all 15 radial-arm gates are more than 25 years old and may need adjustment or replacement. All five emergency spillways require minor concrete repairs and replacement of Sika-flex joint seals. The low flow structure at Dam 357 cannot be opened; a bent main gate stem is suspected. The sensor that switches voltage for the carp barrier between 120 and 240 volts within the channel is faulty. Deflection/wall movement is apparent in the west wing wall at the Dam 357 structure. The southern bank of pool 326 eroded significantly. Waterfowl nesting islands (more than 30 islands) in pools 320, 326, and 332 have significant bank and topsoil erosion. It is too early to assess ecological damage resulting from the prolonged flooding that occurred outside of the normal hydroperiod. Wetland and meadow plant communities are not adapted to flooding in excess of 4-5 months. Extensive tree mortality is already apparent in Ash-elm riparian woodlands. Increases in leafy spurge and Canada thistle in meadows is apparent and an increase in coverage of reed canary grass is expected. The flood of 2011 was a major sediment accretion event, potentially reducing functional pool elevations within refuge impoundments.
USACE, St. Paul District – 2011 Post-Flood Report for the Souris River Basin – Revised March 2012 Page 59
9.3 Manitoba 9.3.1 Agriculture The effects of the 2011 flood on agriculture in the Souris River basin in Manitoba were huge, and with the high water table, concerns will persist into the 2012 season. Effects on winter survival and de-watering effectiveness of fall-seeded cereals will not be known until the spring of 2012. The high runoff combined with spring rainfall resulted in a prolonged period of extensive flooding with saturated field conditions that caused a loss of agricultural productivity throughout the basin in Manitoba in 2011. The loss was primarily due to the inability to plant seed in the wet ground, resulting in the lack of a crop for the year. The amount of land usually devoted to the production of annual crops in the Southwest region (which encompasses most of the Manitoba portion of the Souris River basin, but also some of the Assiniboine River watershed) that went unseeded due to excess moisture was 1.209 million acres. This is equivalent to approximately 40 percent of all the unseeded cropland in Manitoba in 2011. Within the twelve rural municipalities in the Souris River basin, the proportion of unseeded annual cropland ranged from 50 percent to more than 90 percent with the western rural municipalities most seriously affected. Snow melt impacts in Manitoba were primarily experienced in rural areas due to inundated crop and pasture land. Flash flooding and heavy overland flow in rural areas led to late planting (Manitoba 2011). Agriculture Minister Stan Struthers states that as much as $194 million may flow to agricultural producers such as grain farmers, cattle producers and beekeepers to aid in lost income caused by flood impacts. Minister Struthers also states that as many as three-million acres of Manitoba farmland went unseeded this year due to wet conditions (Turenne, 2011).
Additional impacts felt by the agricultural sector include: Crop that was lost after establishment, due to drowning from prolonged spring rainfall, Compromised longevity of hayland that had to be grazed because pasture was inaccessible, Damage to infrastructure – particularly roads – either by washouts or intentional cuts to allow
land to drain, and Costs of clean-up (chemicals, fallow, tillage, etc.) required to prepare fields for fall-seeded
crops or seeding in the spring of 2012. 9.3.2 Communities Manitoba Emergency Measures Organization and other provincial departments worked with Melita, Souris, Wawanesa and all other municipalities along the Souris River to maintain and enhance existing flood protection works in the area as required, particularly during the critical period following the inundation of Minot ND. About 140 people living in the Manitoba portion of the Souris River basin were evacuated, either by mandatory order or by voluntary request. The resilience and community spirit of the small communities and farmers in the area meant that only about one quarter registered seeking shelter.
USACE, St. Paul District – 2011 Post-Flood Report for the Souris River Basin – Revised March 2012 Page 60
Town of Melita/Rural Municipality (RM) of Arthur The Town of Melita and Manitoba Infrastructure and Transportation repaired and replaced aqua dams on the existing municipal dike. The priority of the flood protection work in the community was to place Hesco Barriers and super sandbags behind the aqua dams on Highway No.3 and 83 to provide freeboard. The Town’s water supply was also diked using super-sandbags as a last line of defense. This flood protection work was completed successfully. Flood-fighting efforts were focused on monitoring and maintaining all existing dikes and flood protection. Melita issued mandatory evacuations on June 27th for all properties and businesses in the Machinery Row area, as well as for a motel located along the Souris River. Town of Souris The Town of Souris worked with Manitoba Infrastructure and Transportation to shore up all existing dikes and flood protection in the community. The Town, with assistance from Manitoba Infrastructure and Transportation, constructed approximately three miles of earth dikes very quickly. The dikes were constructed against residences/houses in many cases and were built just prior to the summer flood in late June / early July to protect property along the Souris River and Plum Creek. Local material used was very sandy and needed to be protected by poly and sandbags on the water side. The main water treatment plant and wastewater plant were protected. The Town of Souris historic swinging bridge, a key tourism draw for the town, was destroyed.
On June 9th the Town declared a mandatory evacuation for 22 homes along the Souris River and a further voluntary evacuation for 17 homes one street back from the mandatory evacuation zone. The Town issued mandatory evacuations on June 25th to an additional 65 homes on the Souris River and Plum Creek due to loss of access to the bridge over the Souris River, as well as the possible loss of essential services. The Town contracted security to ensure the safety of homes and properties and the Royal Canadian Mounted police (RCMP) were also monitoring the area. With the increased flow expected to crest within days, on July 1 approximately 375 Canadian Forces personnel were dispatched to the Town of Souris to assist with reinforcing the main dikes and protecting other isolated properties with a combination of clay dikes, super sandbags and small sandbags. On Sunday, July 10th, the Town lifted the mandatory evacuation for 24 properties previously considered at risk, allowing evacuated residents of these properties to return home. Village of Wawanesa The Village of Wawanesa used 2,500 super sandbags to re-enforce the existing community dike and placed smaller bags for freeboard on top of the dike. Earth dikes were constructed where possible along the majority of the town. The community of Wawanesa is almost an island with the Souris River flowing on three sides of the town. On June 27th the Assiniboine Regional Health Authority undertook a precautionary evacuation of 24 long-term care residents from the Wawanesa Health Centre due to flooding on the Souris
USACE, St. Paul District – 2011 Post-Flood Report for the Souris River Basin – Revised March 2012 Page 61
River. Residents were evacuated to other facilities within the Assiniboine health region until the flood risk along the Souris River had passed. The Village of Wawanesa issued mandatory evacuations on June 27th for 35 properties located along the Souris River. On July 12th, the Village began allowing evacuated residents back into their homes. Property inspections and emergency social assistance re-issuances were conducted on a property-by-property basis.
Town of Hartney/RM of Cameron
The Town of Hartney and the RM of Cameron assisted the Maple Grove Colony to fill and position 2,400 super sandbags and to haul fill to build an earthen dike around the colony. A few isolated properties adjacent to the Souris Rive were also protected. On July 2nd the RM of Cameron issued mandatory evacuations to four properties at risk along the Souris River. 9.3.3 Infrastructure Manitoba Hydro is the primary utility in the province, supplying both electricity and natural gas for industrial and residential use. As a result of the varying forecasts along the Souris River, the Melita electric substation was closed and reopened several times between April 15th and August 23rd. In each case, service was maintained by installing a mobile substation and transferring a managed line load. Numerous hydro poles, anchor wires, control devices and overhead lines had to be removed in all the communities to facilitate emergency dike construction. A regional six inch natural gas pipeline crossing the Souris River at the Bunclody Bridge was threatened when riverbank erosion exposed it. Manitoba Hydro installed a temporary supply line across the bridge to ensure uninterrupted service to the region. The original line was destroyed less than a week after the bypass was constructed. The July flood event had a significant impact on transportation in the Manitoba portion of the basin. The following bridges sustained damages or were closed due to the July flood: Provincial Road 251 Bridge near Coulter collapsed and was closed on June 30th and
remained closed as of the end of November. Provincial Trunk Highway 3 was closed on June 30th, when the east approach washed out
and reopened on July 12th.. Provincial Road 345 near Lauder was closed on April 15th and reopened on August 12th. Provincial Trunk Highway 21 Bridge near Hartney sustained damage to the north abutment
wall which resulted in the bridge being closed to all traffic during the flood. Provincial Road 344 and Provincial Road 530 bridges over the Souris River sustained major
structural damage from the flood, were closed on June 27th and remained closed as of the end of November.
Provincial Road 340 Bridge was closed in July due to concerns the bridge would wash out. Wawanesa Dam is a fixed crest dam on the Souris River in the Village of Wawanesa. Significant scouring of the banks immediately adjacent to the structure occurred that impacted the stability of the structure. This led to emergency repairs during and after the flood. Two
USACE, St. Paul District – 2011 Post-Flood Report for the Souris River Basin – Revised March 2012 Page 62
helicopters worked to drop hundreds of boulder-filled super sandbags into the Souris River just west of the dam.
Oak Lake Dam is a concrete weir used to stabilize water levels on Oak Lake. It received significant flows from the Pipestone Creek system. Strong winds resulted in wave action with the existing dikes overtopping at several locations. The dykes were damaged (eroded) significantly, with flood fighting and restoration efforts required on an emergency basis. 10.INTERPRETATIONOF1989CANADA‐UNITEDSTATESAGREEMENT The regulation plan for the Souris Basin Flood Control Project is delineated in Annex A of the 1989 International Agreement between the United States and Canada for Flood Control and Water supply in the Souris River basin. The wording of Annex A is poor and the provisions of the plan only provide a general framework for regulation with limits on flows and reservoir levels, but lack specific details on how flow and level transitions are to be made, leaving it up to regulators to interpret the regulation plan as best they can. In a similar regard, the ISRB’s Hydrology Committee has worked in cooperation with the SWA to improve forecast terminology in the SWA spring forecasts.
The interpretation of certain key terminology within Annex A needs to be commonly understood by the “entities” defined in the Treaty as having responsibility for operation and maintenance of the Souris Basin Flood Control Project (i.e. the Saskatchewan Watershed Authority (SWA), the U.S. Army Corps of Engineers (USACE), and the U.S. Fish and Wildlife Service (USFWS)) and consistent with the intent of Annex A. Several of these key terms and the differing views as to their interpretation are as follows:
Target Flow – Annex A defines target flow as “The instantaneous flow at a given location that should not be exceeded during a given flood event as a result of releases from a reservoir or reservoirs”. This definition carries no requirement that the target flow be attained and held until stored flood waters have been fully released, only that it not be exceeded. Some view this interpretation as being in conflict with the orderly and timely evacuation of floodwaters stored in the flood control reservoirs of the Souris Basin Project. Those who hold this view feel that, in addition to being treated as upper bounds not to be exceeded, target flows should also be viewed as desirable objectives and that every effort should be made to attain and hold them with due consideration of other factors. In this way, evacuation of stored floodwaters could be accomplished in a timelier manner to help reduce the duration of late spring and summer reservoir releases for this purpose. Those holding this view also feel that it is inconsistent that the target flows defined in Annex A for Sherwood Crossing and Minot would not also be viewed and treated as objectives in the same manner as the reservoir target drawdown levels in Annex A. These drawdown targets are defined as “A pool level to which a reservoir should be lowered in response to estimated spring runoff so that the desired level of flood protection will be provided”. Alternately, others view that making every effort to attain a target flow makes no sense if it results in deliberate flooding.
Maximum Controlled Flow – These flows are given in Section 4.3 of “Annex A” for Sherwood Crossing as “not to exceed limits” to be taken into account for drawdown of the Canadian reservoirs over the fall winter and summer months. No other definition is provided
USACE, St. Paul District – 2011 Post-Flood Report for the Souris River Basin – Revised March 2012 Page 63
in “Annex A”. There are differing views among regulators as to what this term means. The differences center on whether “maximum controlled flow” at Sherwood Crossing, means as controlled at the Canadian reservoirs or as determined at the International Boundary. The former view assumes that upstream reservoir releases would be in conformity with the maximum controlled flow limitations as long as the routed reservoir releases did not of themselves exceed the limit, without regard to any local flow contributions at Sherwood Crossing. The latter view assumes that the routed reservoir releases combined with any local flow do not exceed the limit.
11.LESSONSLEARNEDThe following lessons learned were all recorded from an after action review (AAR) meeting between USACE, USGS and NWS, which speaks well of the agency coordination that occurs. The AAR captured things that went well, things that went wrong, and areas where improvements would be beneficial. Data Collection: Snow water equivalent (SWE) surveys by the National Weather Service (NWS) Airborne
Gamma surveys and point source data from the NWS, USACE, Saskatchewan Watershed Authority (SWA) and North Dakota State Water Commission (NDSWC) were timely and very helpful to forecasters and emergency response preparations.
Collection of real-time water surface profiles for the 2011 series of peaks by City of Minot and the USACE or its contractors was excellent and very helpful in improving the accuracy of water surface modeling for use in emergency response decisions and should be widely used in other floods in key affected areas for use during the flood event and later study and design.
Use of rapid deployment gauges by the USGS for key ungauged locations such as Burlington and Logan worked well, providing useful information for regulation and emergency response. Six of these gauges were funded by the NDSWC during 2011 and use of these gauges will provide valuable information during future flood events and their use should be continued, if not constrained by agency funding limitations.
Real-time precipitation gauge data in Canadian portions of the Souris Basin were insufficient to explain the large rainfall event of June 17th and very few precipitation reports filtered-in during the initial stages of this rainfall event. This initial lack of precipitation made accurate early NWS forecast model projections difficult to produce.
LiDAR is needed for the entire basin. Data Sharing: Adjustments of USGS rating curves due to shifts during flood events need to be
accomplished more timely on non-USGS public websites and in particular the NWS web site. Use of the “LDM” capability for file transfer between USACE and NWS worked well, but
efficiency of passing data needs to be improved. NWS wants to get away from email, which can be unreliable.

USACE, St. Paul District – 2011 Post-Flood Report for the Souris River Basin – Revised March 2012 Page 64
NWS “Chat” capability proved useful for daily communications over the Internet between USACE regulators and NWS forecasters to share data and information. This capability is to be expanded to include EOC’s, but is not well suited for communication with the public, which tends to be more web graphics oriented.
All regulating agencies should be on NWS “Chat”. Need better and more consistent access to real-time data from Canadian reservoirs. Modeling/Data Processing: NWS will be moving in the near future to the Delft-FEWS (by Dutch Corporation Deltares)
open shell system for managing forecasting processes and/or handling time series data. Delft-FEWS incorporates a wide range of general data handling utilities, while providing an open interface to any external (forecasting model). The modular and highly configurable nature of Delft-FEWS allows it to be used effectively for data storage and retrieval tasks, simple forecasting systems and in highly complex systems utilizing a full range of modeling techniques. Delft-FEWS can either be deployed in a stand-alone, manually driven environment, or in a fully automated distributed client-server environment. The USACE can be a client to this system, which is compatible with HEC software.
Late-afternoon NWS forecasts, due to delays in obtaining needed data for forecast model runs, impeded Minot’s ability at times to get public notices out in a timely manner with sufficient time for emergency response officials and the public to react during daylight hours. Managing public expectations and timeliness of issuing forecasts to allow city officials to execute timely evacuation and manage the City flood response needs improvement.
Improved 72 hour to 120 hour event forecasting for rainfall and runoff by Canadian forecasters and regulators would be very helpful.
Better interoperability to import models is needed (for example incorporating CWMS in the NWS FEWS model) – FEWS is like CWMS – has a database, process gridded data, plug in models.
Corps needs to develop an HEC CWMS model environment. An independent USACE CWMS model would be an important step in providing an additional forecasting tool (in addition to the current SWA and NWS forecasts) for use by the ISRB in making determinations of flood year or non-flood year. The availability of independent SWA, NWS and USACE forecasts would serve to check the accuracy of the independent forecasts and aid in any needed forecast refinements.
Don’t let press conferences drive our release of info – if the need exists to wait for a flow measurement, and then wait for the measurement.
Communication/Coordination: Communication between NWS and USACE went well regarding modeling and rating curves. The Souris basin map sponsored by the International Joint Commission (IJC) that was
available on the ND USGS website proved to be a valuable and heavily used tool, providing convenient and useful one-stop access to all the key streamflow gauges within the Canadian and U.S. portions of the Souris basin and should be continued.
Need to get the word out to the public about the Souris basin map.

USACE, St. Paul District – 2011 Post-Flood Report for the Souris River Basin – Revised March 2012 Page 65
The Water Survey of Canada (WSC) website at times during the 2011 flood event was slow and establishing a connection was difficult.
Utilizing daily conference calls (pre-meetings) among regulators and forecasters in advance of periodic conference calls with stakeholders and affected parties went well, as opposed to combined calls between regulators, forecasters, stakeholders and affected parties that occurred in the early phases of the 2011 flood event. Deliberations between regulators and forecasters on daily forecasts should not be done in a public forum. This protocol should be observed for future flood events.
NWS sent a representative to Minot which was very helpful and should be continued in the future.
Corps representative sent to NCRFC was helpful and should be continued in the future. Coordination of field reconnaissance between USACE reconnaissance personnel and
forecasters at the North Central River Forecast Center, (NCRFC) went very well and provided valuable field intelligence on hydrologic conditions and streamflow to allow NCRFC forecasters to refine their forecast model projections on a daily basis, improving forecasts. This coordination has been standard practice for many years between USACE and the NWS and should be continued.
We need to keep communicating the risk, just because snow is gone, it doesn’t mean risk is over.
Need to educate the public on the limitations on the science of runoff forecasting. 1989 International Agreement: SWA had a difficult time in attaining the Sherwood Crossing target flows of 3,200 cfs early
in the 2011 event and 4,000 cfs later into the event. This served to unnecessarily use up valuable flood control storage in Rafferty reservoir to a greater extent and to a lesser extent in Alameda reservoir. In fairness to the SWA, The difficulty in reaching these target flows at Sherwood were in large part due to the extreme attenuation and delay in timing of large magnitude peak flow caused by the filling of overbank storage between Rafferty Dam and the Sherwood Crossing.
Attenuation (storage lag) between Lake Darling and Minot caused a similar problem on the U.S. side. It took longer than expected to reach the target flow at Minot 4NW.
Dam 96 contributed to the storage lag. There is a lot of ambiguity in the 1989 Agreement and the Souris Basin Project was not
designed to accommodate summer rainfall flooding. The wording of Annex A needs to be clearer and the operating plan needs to be revised to take into account flooding from summer rainfall events.
12.RECOMMENDATIONS
Recommendation 1: Implement Recommendation 2 from the 2001 Souris River Post Flood Report – “The “Designated Entities” should establish a continuing review process to discuss runoff forecasting techniques and deficiencies, striving to ensure availability of the best possible forecasts for operational decision-making.”
USACE, St. Paul District – 2011 Post-Flood Report for the Souris River Basin – Revised March 2012 Page 66
Recommendation 2: Implement Recommendation 3 from the 2001 Souris River Post Flood Report – The “Designated Entities” should resolve outstanding issues and be prepared to resolve any new issues that might arise with respect to the interpretation of Annex A of the 1989 International Agreement. These issues include, but are not limited to, “Target Flow” and “Maximum Controlled Flow”.
Recommendation 3: Implement Recommendation 4 from the 2001 Souris River Post Flood Report – “The “Designated Entities” should undertake a thorough review of the operating plan in Annex A and establish policies to ensure periodic future reviews consistent with the provisions of Article V of the 1989 International Agreement.” Annex A needs to be updated and re-written, so that the wording is easy to understand and its meaning is clear. In addition, a revised Annex A needs to incorporate provisions for control of flooding from summer rainfall events.
Recommendation 4: In developing an updated operating plan, testing should be done for the period of record (POR). The use of a systematic reservoir regulation approach using index levels and reservoir balancing is certainly desirable for use in the Souris River basin.
Recommendation 5: In considering any changes to the Souris Basin Project flood control regulation plan contained in Annex A, it must be taken into account that Annex A is part of a treaty between the United States and Canada. As such, any changes to Annex A (or to the regulation of the flood control portion of the Souris Basin Project) would need to be developed by a bilateral effort of U.S. and Canadian regulators or “Designated Entities” as defined in the 1989 Agreement. Also, implementing any change to Annex A would require the approval of governments through the U.S. State Department and Canadian Department of External Affairs. The ISRB and its expertise and the International Joint Commission (IJC) would also need to be involved in this effort.
Recommendation 6: In any effort to revise Annex A, it must be recognized that the Souris Basin Project primarily provides water supply benefits to Canada, while flood control is the primary benefit to the United States. It must also be recognized that within the bounds of the regulation plan contained in Annex A, that Canadian regulators have wide latitude to make flow release decisions from the Canadian dams to meet their objectives, but that do not always align with desired U.S. objectives. The regulation plan contained in Annex A relies heavily on the concept of “target flows” at Sherwood Crossing and Minot as a key feature of project regulation. Certainly, more rigorous regulation schemes using index levels and system reservoir level balancing would likely produce better results for overall project flood control regulation, but there would need to be binational agreement to this concept.
Recommendation 7: Update Souris River basin hydrology (Past, Current and Forecast). The overall hydrology used to develop “Annex A” is outdated and inadequate. A probabilistic approach using stochastic analysis looking at a wide range of areal distributions of runoff of possible snowmelt and storm rainfall runoff needs to be done. Statistical analysis of the updated hydrology should be undertaken to update frequency curves, duration curves, etc.
Recommendation 8: Investigate additional flood control storage possibilities within the basin at existing flood control reservoirs and on the Des Lacs River and Long Creek. The 2011 flood event in the Souris basin revealed the critical role that Long Creek and the Des Lacs River play in producing large flood events, particularly from summer rainfall events. The contributions of both of these watersheds to an extreme flood event in the Souris basin are underestimated in “Annex A”. A basic HMS model has been developed for the Des Lacs basin, but needs additional work.
USACE, St. Paul District – 2011 Post-Flood Report for the Souris River Basin – Revised March 2012 Page 67
Recommendation 9: Install additional streamflow and rainfall gauging stations for the Souris River, Long Creek and Des Lacs River as dictated by modeling requirements and regulation needs.
Recommendation 10: Update Hydraulic Modeling for the Souris River basin. The majority of the Souris River hydraulic modeling to date was accomplished as part of the original design studies for the Souris River Flood Control Project including Lake Darling Dam and other USFWS refuge improvements. Minimal updates to the models were made as part of FIS updates for McHenry and Ward Counties in 2000, and 2002, respectively as well as during the 2011 flood event.
13.SUMMARY In 2011, high soil moisture content, above average snow pack, and persistent spring and summer rainfall combined to produce multiple flood peaks and record flooding throughout the Souris River Basin. At the Sherwood Crossing in North Dakota, a peak flow of 29,700 cfs (841 cms) was observed on June 23rd. This corresponds to an approximate annual exceedance frequency of 0.2 percent (Return Interval - 500 year). At Wawanesa, Manitoba, in the lower reaches of the basin, a total flow volume of 1.4 million ac-ft (1.73 million dam3) was observed between April 1st and July 31st. The 2011 volume is more than 2.5 times larger than the previous record event in 1976 and far exceeded the 100-year design capacity of the Souris Basin Flood Control Project. Initial flood forecasts by the Saskatchewan Watershed Authority and the National Weather Service indicated the potential for major flooding throughout the basin. Target drawdowns for the flood control reservoirs were adjusted based on the forecast data and the reservoirs were operated in accordance with the 1989 International Agreement. The spring snowmelt peak flow and water levels occurred during April, under open water conditions. After the snowmelt, several rain events kept river stages and soil moisture contents high. Throughout the Souris Basin, precipitation in May ranged from 200 percent to 400 percent above normal. The prevailing wet conditions, in conjunction with the target flows specified by the 1989 International Agreement, kept the main flood control reservoirs in Canada and North Dakota near the top of their respective flood control bands. As a result, the flood control dams were required to pass the majority of the runoff generated from the June 17th and 19th rainfall event. The heaviest runoff from this event, centered over the upper portion of the basin in Saskatchewan, resulted in record peaks throughout the Souris basin. The Souris River crested on June 25th at 1561.72 ft (476.01 m) at Minot, North Dakota, surpassing the previous record of 1558 ft (474.88 m) in 1881. Impacts of the 2011 flood were felt throughout the basin. In Saskatchewan, states of emergency were declared in Weyburn and Estevan. Over 400 residents were evacuated from their homes, and almost every home in the Village of Roche Percee was inundated. Road closures, loss of roads and lift stations were noted among the damage to the infrastructure. In addition, approximately five million acres of land in rural Saskatchewan were left unplanted. On May 10th, 2011 President Obama issued a major disaster declaration for the State of North Dakota. The flood necessitated the evacuation of approximately 12,000 residents from Minot.
USACE, St. Paul District – 2011 Post-Flood Report for the Souris River Basin – Revised March 2012 Page 68
Despite extensive emergency measures, infrastructure and property damages in Ward and McHenry counties are estimated in excess of $690 million dollars. Damage to the infrastructure included the loss of roads, bridges, and lift stations. Along the lower Souris, approximately 20,000 acres (81 km2) of pasture and hay land were lost. The J. Clark Salyer Refuge also sustained infrastructure damage. Newberg and Sheflo bridge crossings were lost, and all of the county and State Highway crossings required extensive repairs. Damages to gates and electrical equipment occurred at dams 320, 326, 332, 341, and 357, and significant bank and topsoil erosion were observed at waterfowl nesting islands in the pools 320, 326, and 332. The full extent of ecological damage, resulting from the prolonged inundation, will not be known for some time. In Manitoba, approximately 140 people were evacuated, either by mandatory order or voluntary request. Although flood fighting efforts throughout the province were generally successful, some infrastructure damages were sustained. Temporary bypasses were required to maintain electrical and natural gas service. Wawanesa and Oak Lake dams required emergency repairs and several bridges sustained damage or were closed due to the flood. In addition, over 1.2 million acres (4 860 km2) of land were left unplanted. With regard to lessons learned, the magnitude of the 2011 flood event highlighted the need for more precipitation and streamflow gauges in the upper portion of the basin, a calibrated basin wide hydrologic model, and improved rainfall runoff forecasting. Despite a coordinated effort between the forecasting and regulating agencies in Canada and the United States, forecasting runoff and hydrograph arrival times proved difficult. This information is critical to emergency response planning. Improved availability of data and a calibrated hydrologic model would allow forecasting and regulating agencies to better assess conditions throughout the basin. Finally, differing interpretations of the 1989 International Agreement added to the complexity of operating the Souris Basin project. At times, the inability to attain and hold target flows for Sherwood Crossing and Minot seemed in conflict with the requirement to evacuate the floodwaters in an "orderly and timely" manner. The "Designated Entities" should complete a review of the operating plan outlined in Annex A. The Annex needs to be updated and rewritten so its intent is clear. As part of the review, a more rigorous regulation scheme should also be investigated. The use of index levels and system reservoir level balancing may improve flood control regulation throughout the Souris River Basin. Recommendations resulting from the review should then be provided to the International Souris River Board for consideration. 14.ACKNOWLEDGEMENTS The preparation of this report was greatly facilitated by the contribution and use of various reports written by representatives of the agencies represented on the ISRB and associated with it. These agencies also supported the preparation of this report through their provision of the various data sets needed. This report is more a compilation of the work of these agency staff than an original work. Full acknowledgement is hereby given to the following agencies and groups and their staff, which include, but are not limited to, the U.S. Fish and Wildlife Service, Upper Souris and J. Clark Salyer National Wildlife Refuges; the U.S. Fish and Wildlife Service,
USACE, St. Paul District – 2011 Post-Flood Report for the Souris River Basin – Revised March 2012 Page 69
Denver Regional Office; Saskatchewan Watershed Authority, Regina, Saskatchewan; the U.S. Geological Survey, Water Resources Division, Bismarck, North Dakota; the North Dakota State Water Commission; the U.S. National Weather Service, Bismarck, North Dakota; the Water Survey of Canada, Regina, Saskatchewan; Manitoba Water Stewardship, Winnipeg, Manitoba; the International Souris River Board; the International Souris River Board Hydrology Committee and Flow Forecasting Liaison Committee; the U.S. National Weather Service North Central River Forecast Center, Chanhassen, Minnesota; the North Dakota Division of Emergency Services and various stakeholders in the Souris River basin such as the cities of Burlington, Minot, Sawyer, Velva, the Eaton Irrigation District and others too numerous to mention. 15.REFERENCES Saskatchewan Impact References River Park reopens earlier than expected after flood. Weyburn Review. August 10, 2011. Online.
http://www.weyburnreview.com/article/20110810/WEYBURN0501/110809875/river-park-reopens-earlier-than-expected-after-flood
New flood threat in southern Saskatchewan. CBC News. June 18, 2011. Online. http://www.cbc.ca/news/canada/saskatchewan/story/2011/06/18/sk-heavy-rain-flood.html
Roche Percee recovery moving slowly. Estevan Mercury. July 20, 2011. Online. http://www.estevanmercury.ca/article/20110720/ESTMERCURY0101/110719853/roche-percee-recovery-moving-slowly
Saskatchewan Floods. Online. http://skfloods.ca/reports/view/256
Wetzel, Dale. (2011). Minot flooding in Canadian hands, but few complaints. Associated Press. June 27, 2011. Online. http://m.bismarcktribune.com/mobile/article_46582b7e-a0d0-11e0-a6d1-001cc4c03286.html
Woodlawn Park devastated by flood. Estevan Mercury. July 24, 2011. Online. http://www.estevanmercury.ca/article/20110724/ESTMERCURY0101/110719862/woodlawn-park-devastated-by-flood
North Dakota Impact References
City of Burlington Staff. Telephone Conversation. October, 2011
Hanratty, Mr. Clifford. Telephone Conversation. November, 2011.
Hummel, Richard. (Bottineau County). Telephone Conversation. November 18, 2011.
Minot Daily News (MDN). (2011). Timeline of Minot’s 2011 flood. Online. Updated August 7, 2011. http://www.minotdailynews.com/page/content.detail/id/557475/Timeline-of-Minot-s-2011-flood.html
National Agricultural Statistics Service (NASS) North Dakota Field Office. (2011). North Dakota Crop, Livestock & Weather Report. May 9, 2011. Online. http://www.nass.usda.gov/Statistics_by_State/North_Dakota/Publications/Crop_Progress_&_Condition/2011/cw-0509.pdf
North Dakota Department of Emergency Services (NDDES). (2011). 2011 Flood Report: Response and Recovery. November, 2011.
North Dakota Executive Order 2011-16
USACE, St. Paul District – 2011 Post-Flood Report for the Souris River Basin – Revised March 2012 Page 70
North Dakota Legislative Management (NDLM). (2011). Minutes of the Water-Related Topics Review Committee. Tuesday, July 12, 2011. http://www.legis.nd.gov/assembly/62-2011/interim-info/minutes/wr071211minutes.pdf.
Pates, Mikkel. (2011) SunPrairie rising from flood. AgWeek Magazine. August 22, 2011. Online. http://www.agweek.com/event/article/id/18943/.
Velva, City of (2011). Flood Info. Online. http://velvand.com/?page_id=603
Ward County. (2011). Flood Detail. Online. Updated July 25th, 2011. http://www.co.ward.nd.us/UserFiles/File/Flood_Detail.pdf
Wisinewski, Rich (2011). Mouse River Park recovering from flooding. KUMV TV. October 13, 2011. Online. http://www.kumv.com/News_Stories.asp?news=52789