solvency ii european lessons - polska izba ubezpieczeń seminarium... · key themes to emerge (1)...
TRANSCRIPT

Solvency II – European Lessons
Brian Heale November 2013
Agenda
1. EIOPA update & Current Status of Solvency II
Programs in Europe
2. Moody's SII Survey – Key Findings
3. Technical Platform for Solvency II
4. Potential Business Benefits generated by Solvency II
1. EIOPA Update
EIOPA Update
On the 27th September 2013 EIOPA published its final guidelines for the
preparation of Solvency II comprising :
System of governance
Forward looking assessment of own risks (based on the ORSA principles)
Pre-application for internal models
Submission of information to National Competent Authorities (NCAs)
The guidelines apply from 1 January 2014 even if gradual application over
2014 and 2015
EIOPA plans to issue the guidelines in all official EU languages on 31st
October 2013
NCAs then have 2 month to report to EIOPA about their intention to comply
EIOPA is pushing to 2016 Implementation
1. Approach to the Solvency II programs varies considerably by size of insurer & country –
Netherlands and UK quite advanced !! Southern and Eastern Europe not as advanced.
Tier 1 insurers more advanced in programs than smaller insurers
2. The delay announced by EIOPA last year hit Solvency II projects with many frozen and
budgets re-allocated - particularly Pillar III reporting projects – but now being re-energised
due to latest EIOPA update!!
3. ORSA remains a key focus though and in many countries (such as the Netherlands and
UK ) dry-run ORSA process continues apace for 2013. ORSA being adopted around the
world
4. Some insurers have spent vast amounts of money on their Solvency II program - with very
little return thus far!
5. Many Insurers are looking more closely at the analytical data they require for SII, IFRS and
decision making purposes
6. Larger insurers are switching their capital focus from regulatory capital (SCR) to strategic
capital planning (economic capital and risk adjusted return measures) – how to run the
business better
What’s happening in Europe?
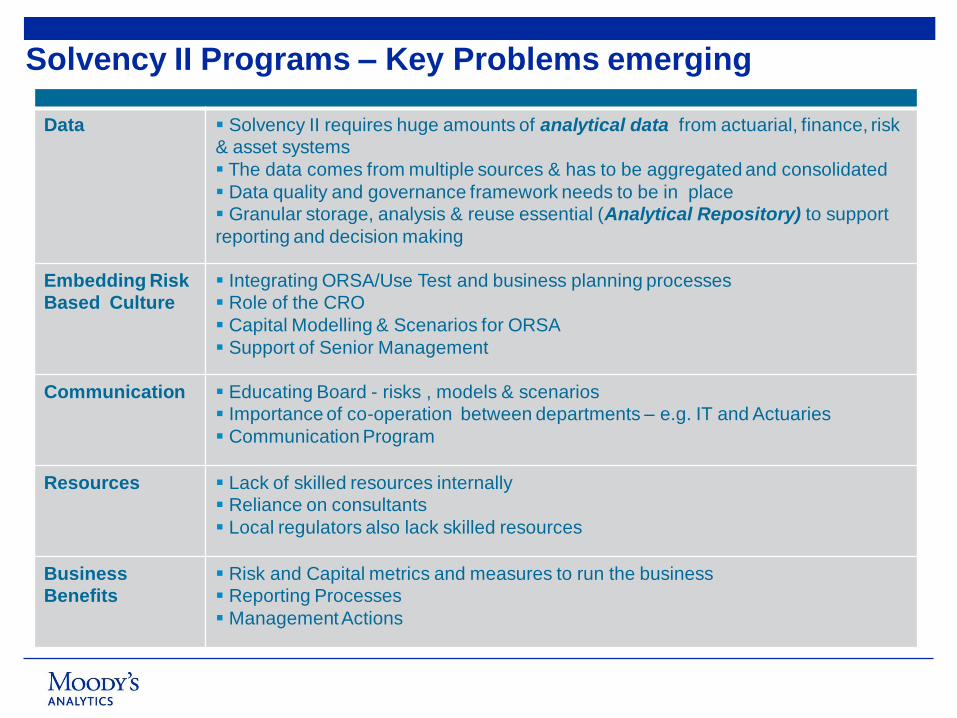
Data Solvency II requires huge amounts of analytical data from actuarial, finance, risk
& asset systems
The data comes from multiple sources & has to be aggregated and consolidated
Data quality and governance framework needs to be in place
Granular storage, analysis & reuse essential (Analytical Repository) to support
reporting and decision making
Embedding Risk
Based Culture
Integrating ORSA/Use Test and business planning processes
Role of the CRO
Capital Modelling & Scenarios for ORSA
Support of Senior Management
Communication Educating Board - risks , models & scenarios
Importance of co-operation between departments – e.g. IT and Actuaries
Communication Program
Resources Lack of skilled resources internally
Reliance on consultants
Local regulators also lack skilled resources
Business
Benefits
Risk and Capital metrics and measures to run the business
Reporting Processes
Management Actions
Solvency II Programs – Key Problems emerging

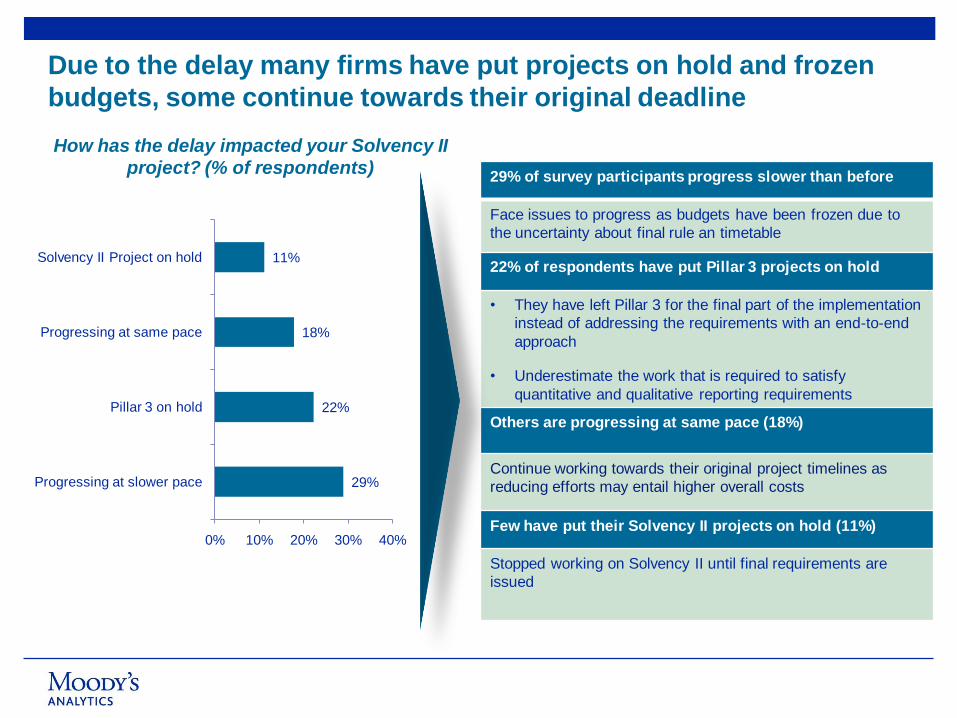
Due to the delay many firms have put projects on hold and frozen
budgets, some continue towards their original deadline
How has the delay impacted your Solvency II
project? (% of respondents)
29%
22%
18%
11%
0% 10% 20% 30% 40%
Progressing at slower pace
Pillar 3 on hold
Progressing at same pace
Solvency II Project on hold
29% of survey participants progress slower than before
Face issues to progress as budgets have been frozen due to
the uncertainty about final rule an timetable
22% of respondents have put Pillar 3 projects on hold
• They have left Pillar 3 for the final part of the implementation
instead of addressing the requirements with an end-to-end
approach
• Underestimate the work that is required to satisfy
quantitative and qualitative reporting requirements
Others are progressing at same pace (18%)
Continue working towards their original project timelines as
reducing efforts may entail higher overall costs
Few have put their Solvency II projects on hold (11%)
Stopped working on Solvency II until final requirements are
issued
Moody’s Solvency II Survey
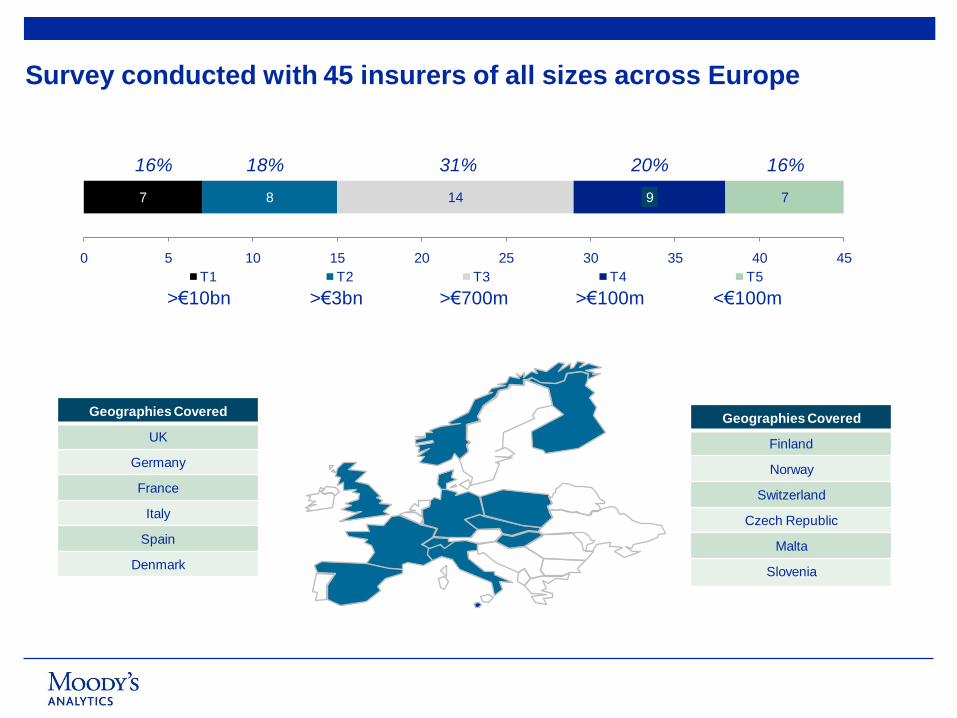
Survey conducted with 45 insurers of all sizes across Europe
7 8 14 9 7
0 5 10 15 20 25 30 35 40 45
T1 T2 T3 T4 T5
16% 18% 31% 20% 16%
>€10bn >€3bn >€700m >€100m <€100m
Geographies Covered
Finland
Norway
Switzerland
Czech Republic
Malta
Slovenia
Geographies Covered
UK
Germany
France
Italy
Spain
Denmark
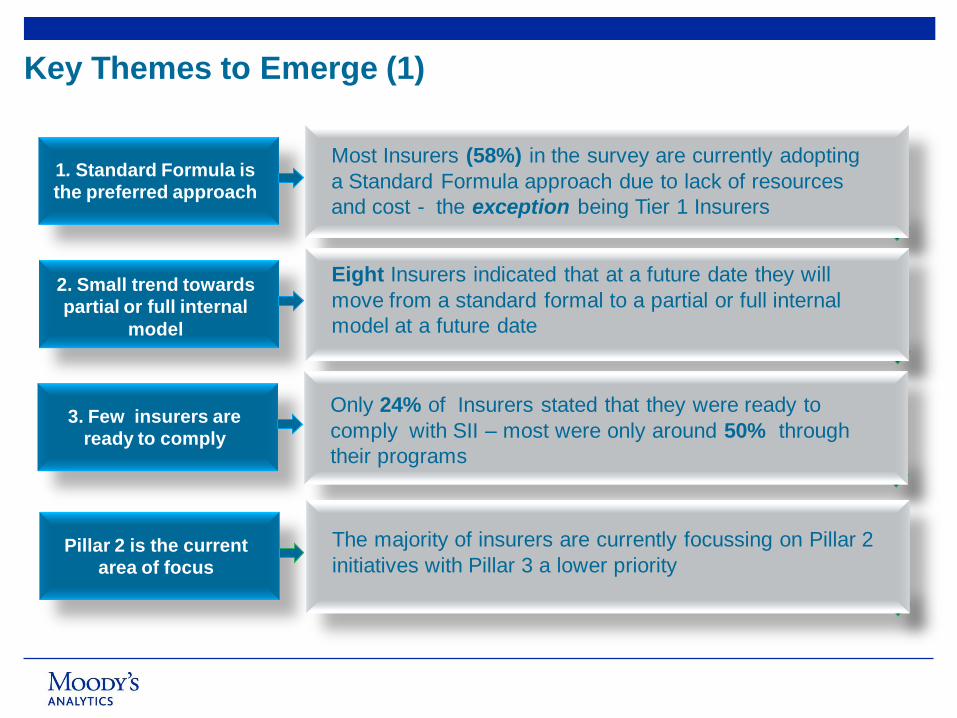
Key Themes to Emerge (1)
1. Standard Formula is
the preferred approach
Most Insurers (58%) in the survey are currently adopting
a Standard Formula approach due to lack of resources
and cost - the exception being Tier 1 Insurers
2. Small trend towards
partial or full internal
model
Eight Insurers indicated that at a future date they will
move from a standard formal to a partial or full internal
model at a future date
3. Few insurers are
ready to comply
Only 24% of Insurers stated that they were ready to
comply with SII – most were only around 50% through
their programs
Pillar 2 is the current
area of focus
The majority of insurers are currently focussing on Pillar 2
initiatives with Pillar 3 a lower priority
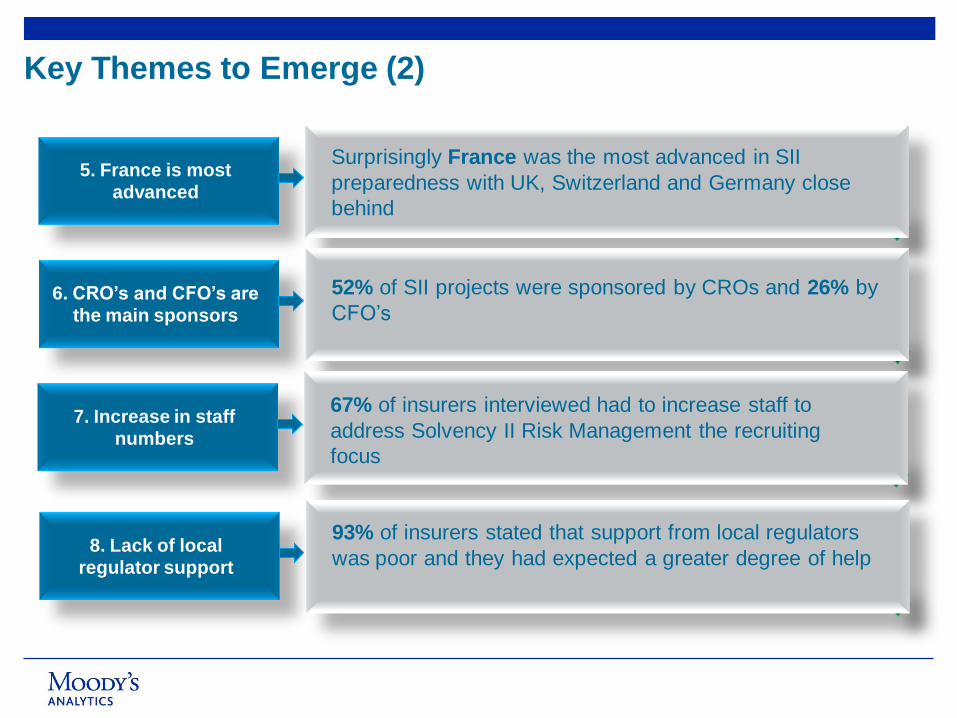
Key Themes to Emerge (2)
5. France is most
advanced
Surprisingly France was the most advanced in SII
preparedness with UK, Switzerland and Germany close
behind
6. CRO’s and CFO’s are
the main sponsors
52% of SII projects were sponsored by CROs and 26% by
CFO’s
7. Increase in staff
numbers
67% of insurers interviewed had to increase staff to
address Solvency II Risk Management the recruiting
focus
8. Lack of local
regulator support
93% of insurers stated that support from local regulators
was poor and they had expected a greater degree of help
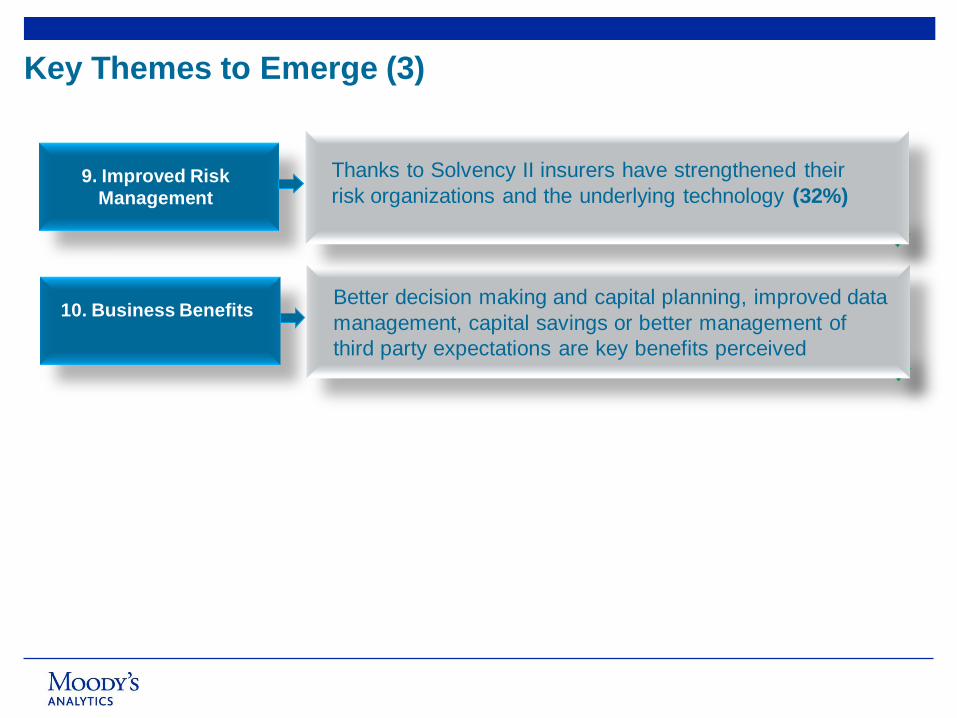
Key Themes to Emerge (3)
10. Business Benefits Better decision making and capital planning, improved data
management, capital savings or better management of
third party expectations are key benefits perceived
9. Improved Risk
Management
Thanks to Solvency II insurers have strengthened their
risk organizations and the underlying technology (32%)
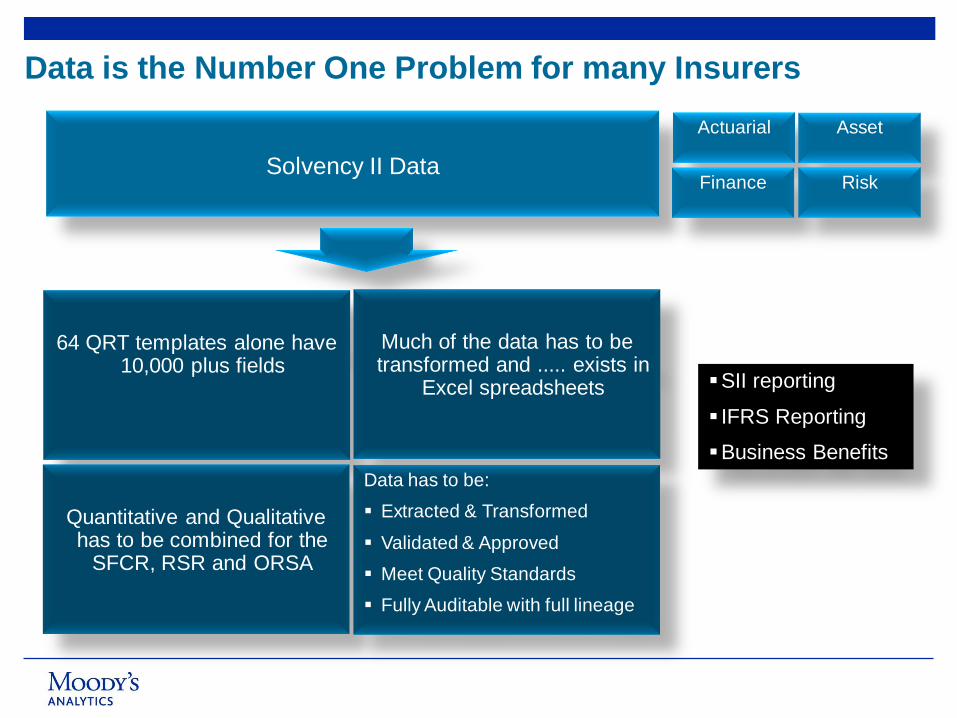
Data is the Number One Problem for many Insurers
SII reporting
IFRS Reporting
Business Benefits
Solvency II Data
64 QRT templates alone have 10,000 plus fields
Much of the data has to be transformed and ..... exists in
Excel spreadsheets
Quantitative and Qualitative has to be combined for the
SFCR, RSR and ORSA
Data has to be:
Extracted & Transformed
Validated & Approved
Meet Quality Standards
Fully Auditable with full lineage
Actuarial Asset
Finance Risk
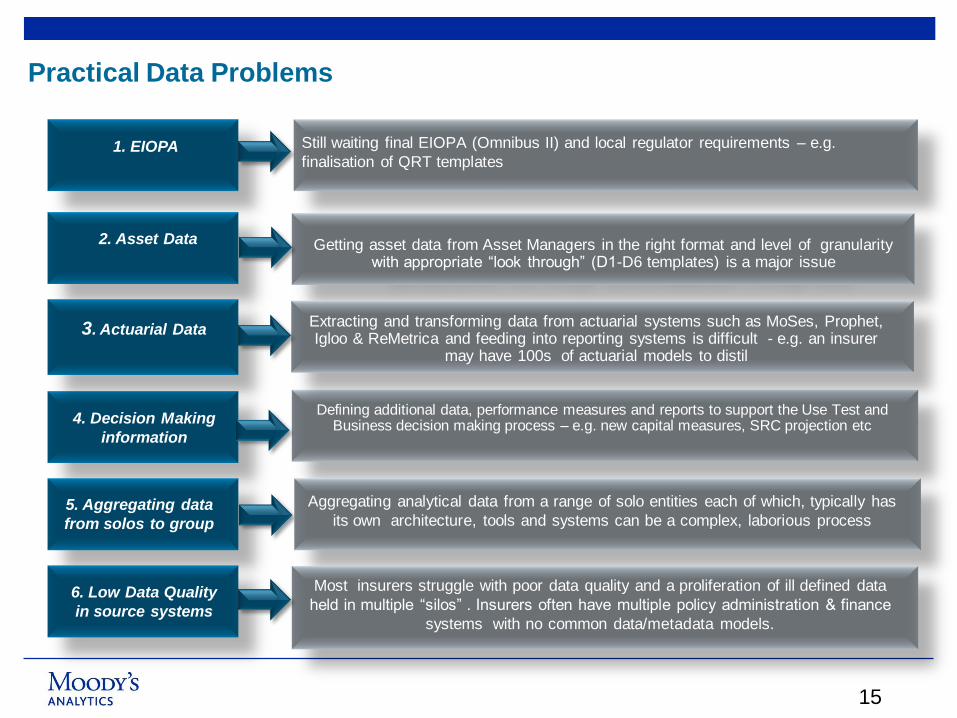
Practical Data Problems
15
Defining additional data, performance measures and reports to support the ORSA/ Use Test and Business decision making process – e.g. new capital measures, SRC
projection etc
Still waiting final EIOPA (Omnibus II) and local regulator requirements – e.g.
finalisation of QRT templates 1. EIOPA
Getting asset data from Asset Managers in the right format and level of granularity with appropriate “look through” (D1-D6 templates) is a major issue
2. Asset Data
4. Decision Making
information
Extracting and transforming data from actuarial systems such as MoSes, Prophet, Igloo & ReMetrica and feeding into reporting systems is difficult - e.g. an insurer
may have 100s of actuarial models to distil
3. Actuarial Data
Most insurers struggle with poor data quality and a proliferation of ill defined data
sources. Insurers often have multiple policy administration & finance systems 5. Aggregating data
from solos to group
Aggregating analytical data from a range of solo entities each of which, typically has
its own architecture, tools and systems can be a complex, laborious process
Defining additional data, performance measures and reports to support the Use Test and Business decision making process – e.g. new capital measures, SRC projection etc
Most insurers struggle with poor data quality and a proliferation of ill defined data
held in multiple “silos” . Insurers often have multiple policy administration & finance
systems with no common data/metadata models.
6. Low Data Quality
in source systems
Solvency II Technology Platform
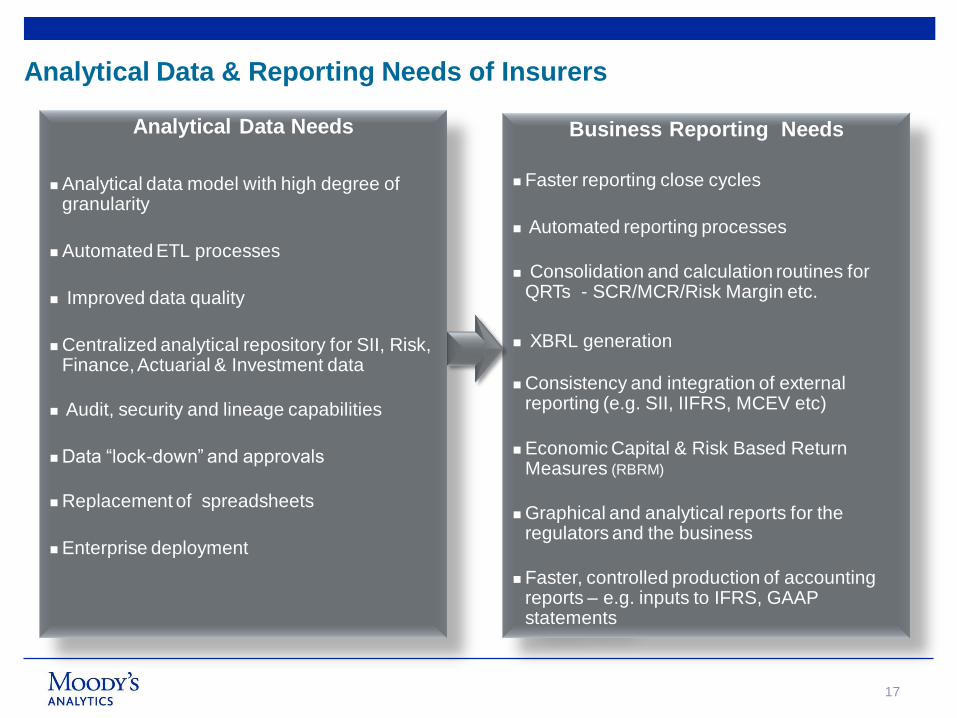
Analytical Data & Reporting Needs of Insurers
17
Business Reporting Needs
Faster reporting close cycles
Automated reporting processes
Consolidation and calculation routines for QRTs - SCR/MCR/Risk Margin etc.
XBRL generation
Consistency and integration of external reporting (e.g. SII, IIFRS, MCEV etc)
Economic Capital & Risk Based Return Measures (RBRM)
Graphical and analytical reports for the regulators and the business
Faster, controlled production of accounting reports – e.g. inputs to IFRS, GAAP statements
Analytical Data Needs
Analytical data model with high degree of granularity
Automated ETL processes
Improved data quality
Centralized analytical repository for SII, Risk, Finance, Actuarial & Investment data
Audit, security and lineage capabilities
Data “lock-down” and approvals
Replacement of spreadsheets
Enterprise deployment
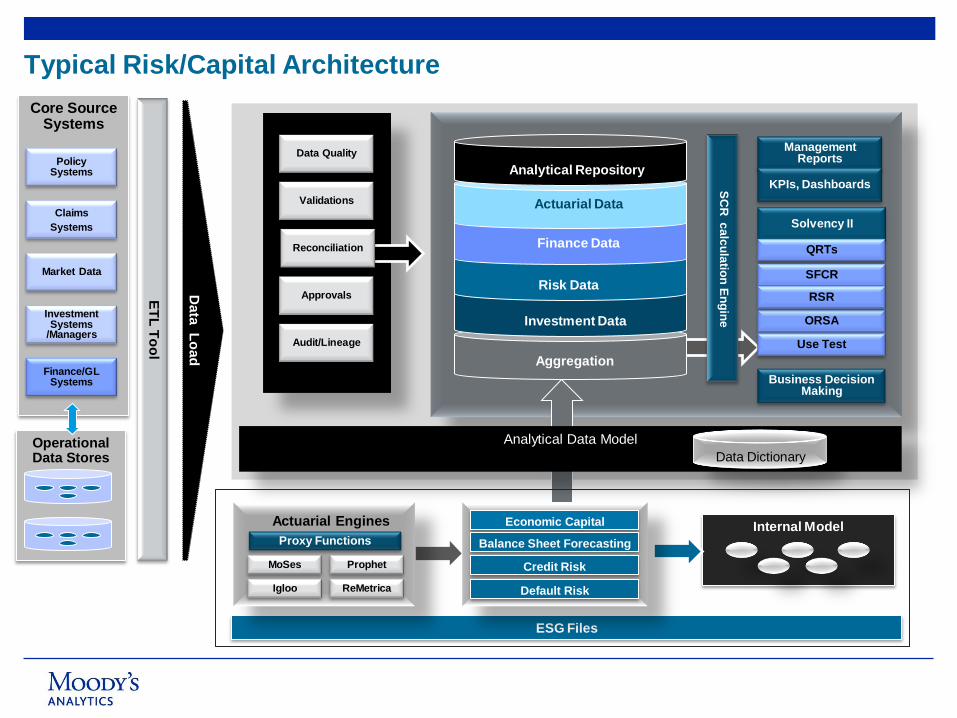
Core Source Systems
Policy Systems
Market Data
Claims
Systems
Investment Systems
/Managers
Finance/GL Systems
Data
Lo
ad
Validations
Reconciliation
Data Quality
Approvals
Audit/Lineage
Management Reports
Solvency II
KPIs, Dashboards
Analytical Data Model
QRTs
SFCR
ORSA
RSR
Operational Data Stores
Analytical Repository
Aggregation
Analytical Repository
Investment Data
Finance Data
Actuarial Data
Risk Data
Internal Model
Use Test
Business Decision Making
SC
R c
alc
ula
tion
En
gin
e
ESG Files
ET
L T
oo
l
Typical Risk/Capital Architecture
Data Dictionary
MoSes Prophet
Igloo ReMetrica
Proxy Functions
Actuarial Engines Economic Capital
Balance Sheet Forecasting
Credit Risk
Default Risk
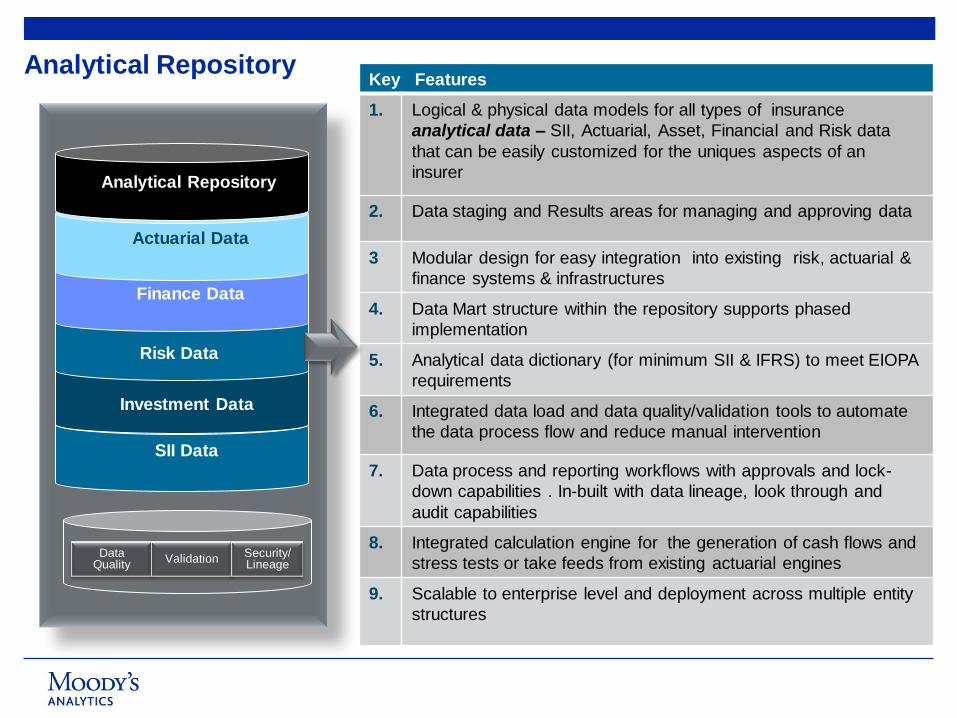
Analytical Repository Key Features
1. Logical & physical data models for all types of insurance
analytical data – SII, Actuarial, Asset, Financial and Risk data
that can be easily customized for the uniques aspects of an
insurer
2. Data staging and Results areas for managing and approving data
3 Modular design for easy integration into existing risk, actuarial &
finance systems & infrastructures
4. Data Mart structure within the repository supports phased
implementation
5. Analytical data dictionary (for minimum SII & IFRS) to meet EIOPA
requirements
6. Integrated data load and data quality/validation tools to automate
the data process flow and reduce manual intervention
7. Data process and reporting workflows with approvals and lock-
down capabilities . In-built with data lineage, look through and
audit capabilities
8. Integrated calculation engine for the generation of cash flows and
stress tests or take feeds from existing actuarial engines
9. Scalable to enterprise level and deployment across multiple entity
structures
SII Data
Analytical
Repository
Analytical Repository
Investment Data
Finance Data
Actuarial Data
Risk Data
Data Quality
ValidationSecurity/Lineage
Solvency II – Possible Business Benefits
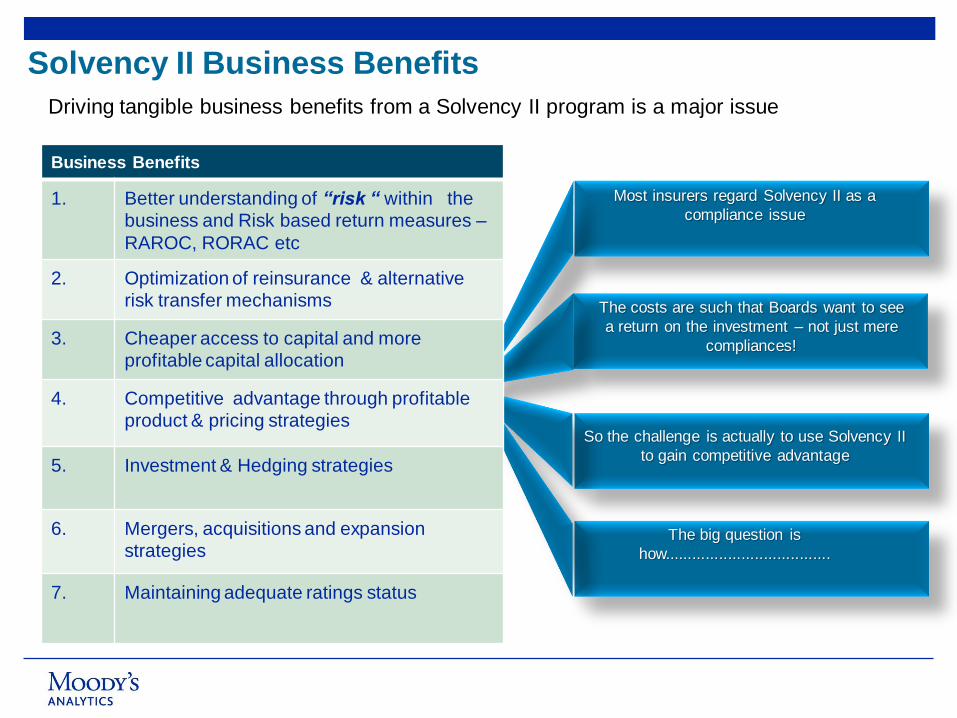
Solvency II Business Benefits
Driving tangible business benefits from a Solvency II program is a major issue
Feed actuarial and reporting engines
Most insurers regard Solvency II as a
compliance issue
So the challenge is actually to use Solvency II
to gain competitive advantage
The big question is
how.....................................
The costs are such that Boards want to see
a return on the investment – not just mere
compliances!
Business Benefits
1. Better understanding of “risk “ within the
business and Risk based return measures –
RAROC, RORAC etc
2. Optimization of reinsurance & alternative
risk transfer mechanisms
3. Cheaper access to capital and more
profitable capital allocation
4. Competitive advantage through profitable
product & pricing strategies
5. Investment & Hedging strategies
6. Mergers, acquisitions and expansion
strategies
7. Maintaining adequate ratings status
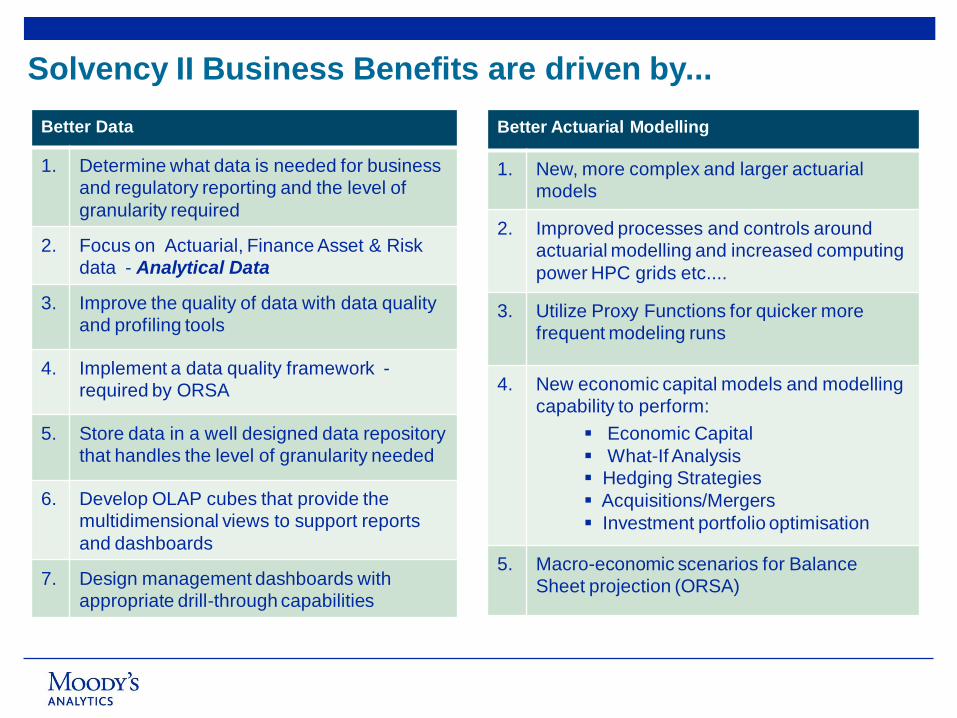
Solvency II Business Benefits are driven by...
Better Data
1. Determine what data is needed for business
and regulatory reporting and the level of
granularity required
2. Focus on Actuarial, Finance Asset & Risk
data - Analytical Data
3. Improve the quality of data with data quality
and profiling tools
4. Implement a data quality framework -
required by ORSA
5. Store data in a well designed data repository
that handles the level of granularity needed
6. Develop OLAP cubes that provide the
multidimensional views to support reports
and dashboards
7. Design management dashboards with
appropriate drill-through capabilities
Better Actuarial Modelling
1. New, more complex and larger actuarial
models
2. Improved processes and controls around
actuarial modelling and increased computing
power HPC grids etc....
3. Utilize Proxy Functions for quicker more
frequent modeling runs
4. New economic capital models and modelling
capability to perform:
Economic Capital
What-If Analysis
Hedging Strategies
Acquisitions/Mergers
Investment portfolio optimisation
5. Macro-economic scenarios for Balance
Sheet projection (ORSA)

1. Data cubes required for granular reporting
2. Underlying Data Model
3. Centralised Analytical Data Repository
4. Actuarial and capital modelling tools to generate results
Reporting Engine
Data & Capital Modelling Process
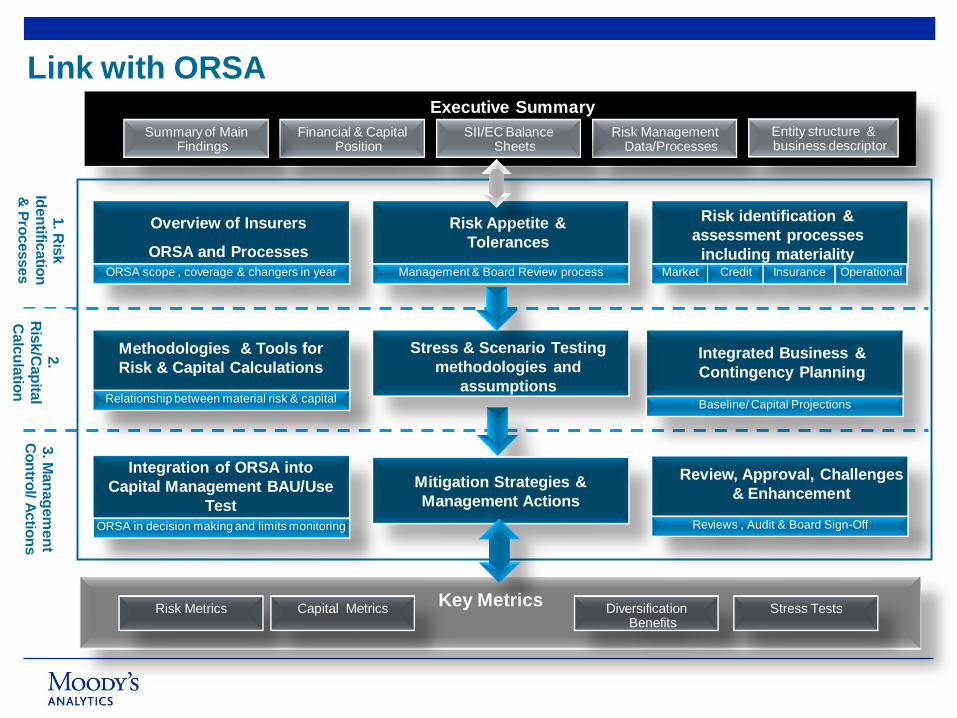
Executive Summary
Risk Management Data/Processes
Financial & Capital Position
SII/EC Balance Sheets
Entity structure & business descriptor
Summary of Main Findings
Key Metrics Risk Metrics Capital Metrics Diversification
Benefits Stress Tests
Methodologies & Tools for
Risk & Capital CalculationsIntegrated Business &
Contingency Planning
Stress & Scenario Testing
methodologies and
assumptions Baseline/ Capital Projections
Relationship between material risk & capital
Overview of Insurers
ORSA and Processes
Risk Appetite &
Tolerances
Risk identification &
assessment processes
including materiality Market Credit Insurance OperationalORSA scope , coverage & changers in year Management & Board Review process
Integration of ORSA into
Capital Management BAU/Use
Test
Review, Approval, Challenges
& Enhancement
ORSA in decision making and limits monitoring Reviews , Audit & Board Sign-Off
Mitigation &
Management Actions
1. R
isk
Iden
tificatio
n
& P
rocesses
2.
Ris
k/C
ap
ital
Calc
ula
tion
3. M
an
ag
em
en
t C
on
trol/ A
ctio
ns
Mitigation Strategies &
Management Actions
Link with ORSA

Questions
25