solar radiation performance evaluation for high … · solar radiation performance evaluation for...
TRANSCRIPT
SOLAR RADIATION PERFORMANCE EVALUATION FOR HIGH DENSITY
URBAN FORMS IN THE TROPICAL CONTEXT
Hii, Daniel Jun Chung1, Heng, Chye Kiang
1, Malone-Lee, Lai Choo
1, Zhang, Ji
1, Ibrahim,
Nazim1, Huang, Yi Chun
2 and Janssen, Patrick
2
1Centre of Sustainable Asian Cities, School of Design and Environment, National University
of Singapore, Singapore 2Department of Architecture, School of Design and Environment, National University of
Singapore, Singapore
ABSTRACT
High density development in cities is a planning
strategy responding to fast population growth and
limited land resources. However, the agglomeration
of building mass increases the solar radiation heat
gain, especially in the tropics. In order to understand
how various high density residential urban forms
perform in terms of overall surface solar insolation,
we propose a performance indicator to quantify the
solar radiation performance and a methodology to
evaluate and compare the theoretical insolation
performance across various urban forms. The impacts
of selected morphological and geometric parameters
on insolation performance are analysed to identify
key design attributes contributing to insolation
minimization.
INTRODUCTION
The contribution from buildings towards global
energy consumption in both the residential and
commercial sectors has been steadily increasing, and
in developed countries, such contribution has reached
figures of between 20% and 40%. This has exceeded
the contribution from other major sectors such as
industries and transportation. For buildings, the
growth in energy use in HVAC systems is
particularly significant, averaging 50% of building
consumption and 20% of total consumption in the
USA (Pérez-Lombard et al. 2008).
High density development is implemented in many
cities around the world as a planning strategy to
address issues such as fast urban population growth,
efficient energy consumption and dwindling supply
of urban land resources. In high density cities the
urban fabric consists mostly of closely positioned
buildings which may affect the thermal comfort of
inhabitants as the solar exposure and wind flow
profile are very much altered by the building forms.
In hot and humid regions, the sun belt will
predominantly fall on the east and west facades of
buildings throughout the year. Our solar simulations
show that the facades facing east-west get at least 4
times the value of insolation than the north-south
facades. Therefore, it is crucial to minimize facades
facing the east-west directions as much as possible,
in particular, the west side where the hottest hours of
the day are concentrated. This is to minimize solar
heat gain and the thermal load which will cause
thermal discomfort to inhabitants. This will also
reduce energy consumption due to increased
mechanical ventilation and cooling load necessary to
neutralize the heat.
Objective
The research objective is to examine different high-
density precincts in terms of their forms and compare
their solar insolation performance across the board.
Solar insolation is part of a larger research
framework, which looks at sky exposure, daylighting,
wind flow and noise. The research will focus on
urban built forms and will not look at architectural
design solutions towards reducing solar heat gain
such as external shading devices and insulation
materials. The scale of study is on the precinct and
typology level and not the building level. As part of
the research, we have also examined daylighting
implications with reference to the minimum vertical
daylight factor of 8% on the facade for indication of
indoor daylight sufficiency without reliance on
artificial lighting (Ng 2005). However, given that
energy consumption for air conditioning is generally
much higher than artificial lighting, we have, in this
paper, focussed on solar heat gain.
Firstly, we would introduce a methodology to
perform façade insolation simulation for relatively
complex urban forms efficiently and for evaluation,
we would propose a performance indicator to
compare across different cases. Secondly, we would
explore the relationship between various geometric
variables and façade solar insolation to examine if
certain geometric variables can be used as effective
indicators to predict solar insolation performance
without performing the time-consuming simulation
for given built forms. The final goal is to identify
appropriate built forms in terms of minimizing solar
insolation so that they can be recommended for
further designs explorations in new context.
Proceedings of Building Simulation 2011: 12th Conference of International Building Performance Simulation Association, Sydney, 14-16 November.
- 2595 -
Urban Morphological and Environmental
Performance
Research on the morphology of building forms in
terms of their implications towards urban
sustainability has been done by various researchers.
Studies have highlighted that building morphology
plays an important role in terms of mitigating the
Urban Heat Island effect (Wong et al. 2011). In this
paper, the focus is on solar heat gain in relation to
human comfort and energy consumption. The quest
is for the most efficient urban forms in terms solar
insolation will help cut down energy costs in dense
environments.
In high-density environments, high-rise buildings are
actually considered “good” in terms of providing
shade to the neighbouring areas. However, more
reflected radiation will occur as a result of the
compact and high density setting. Studies have
shown that the closer the building blocks are, the
higher the energy consumption will be, and this is
caused by the reflectivity of building facades which
carries both light and heat with it (Strømann-
Andersen and Sattrup 2011).
Maïzia et al. (2009) also explores the energy
requirements for heating and cooling typical urban
blocks in the Region Ile de France. They categorized
the urban blocks into 4 categories (discontinuous
collective housing, continuous collective housing,
dense individual housing and dispersed individual
housing), and looked at the incidence of compactness
and urban organization upon energy requirements
and potential solar gains. They found out that urban
blocks that receive most solar gains are dispersed,
individual housing types.
Other related parameters that have implications on
the research in this paper include the surrounding
building density, the wall surface areas and albedo.
Studies have shown that urban greenery, height and
density has the most impact on the temperature,
which may go up to as much as 1.2°C (Wong et al.
2011). Okeil (2010) found the “Residential Solar
Block” (RSB) to be the best form for temperate
climates with maximum solar energy on facades,
minimum solar energy on roofs and the ground
surrounding the building in winter, while mitigating
the heat gain through increased airflow during
summer.
Adolphe (2001) proposed a number of
morphological indicators of environmental
performance which include density, rugosity,
porosity, sinuosity, occlusivity, compacity,
contiguity, solar admittance and mineralization.
Among them, the most direct geometric variable that
deals with solar insolation is compacity. This is the
ratio of the surface area of a building to its volume or
the ratio between a building‟s outer skin and the
heated volume it embraces, and is also known as the
surface-to-volume ratio or shape factor.
Ratti et al. (2005) took the studies further by finding
the relationship between surface-to-volume ratio and
passive to non-passive zones on energy consumption
using DEMs (Digital Elevation Model), but the tests
were limited to three case studies in London,
Toulouse and Berlin. DEMs have always be a
favoured tool for complex urban solar envelope
calculations. Morello and Ratti (2009) used the sky
model from Meteonorm with DEMs to introduce the
concept of „iso-solar surfaces‟ which extend the
concept of solar envelope through energy
considerations. It is a fast method to quantify urban
irradiation and illumination, which would be helpful
for planners and architects for site studies before the
design process.
Yao et al. (2011) integrated DEMs within the
coupled thermal and airflow model using the
MATLAB toolbox. It is a urban microclimate model
which takes into account direct solar radiation,
diffuse radiation, reflected radiation, long-wave
radiation, heat convection in the air, heat transfer in
the exterior wall and the ground. The model however
still requires improvement as it is not accurate when
simulating high-rise building blocks. These models
and methods based on DEMs are fast ways to
simulate the urban solar insolation condition when
designing new typologies on site. They are suitable to
be used at the initial stage of design exploration as
well as during the parametric exploration studies of
the selected typologies based on their environment
performance.
METHODOLOGY
This study is part of a larger research project aims to
examine the implications of high density urban forms
on facade solar insolation, thermal comfort and
energy consumption. The thermal comfort segment
is investigated through surveys to find out the
satisfaction level of residential occupants in various
locations, in combination with on-site measurements
of key environmental variables such as mean radiant
temperature, relative humidity, light level and wind
speed. Energy consumption is investigated through
EnergyPlus simulation taking into account of users‟
behavioural patterns as obtained from surveys.
Essentially, both of the processes are aimed at
understanding the satisfaction thresholds of
occupants and linking solar insolation with potential
energy costs. This paper focuses on the solar
insolation of the external facades of high-density
typologies.
Proceedings of Building Simulation 2011: 12th Conference of International Building Performance Simulation Association, Sydney, 14-16 November.
- 2596 -
Case Study Approach
This research will select for study high-density
residential and mixed-use typologies in precincts (of
at least 0.4 hectares) with Floor Area Ratio (FAR)
higher than 3.0. The intention is to capture as wide a
variation in urban typologies as possible at relatively
high-density levels. Therefore, the collection has
various forms, ranging from point, slab, perimeter
blocks and hybrids of point and slab, open blocks and
clusters. This paper will look at the 60 case studies s
from different geographic locations around the world.
The site area ranges from 1,449 m2 to 68,216 m
2. The
site coverage ranges from 10.26% to 85.35%. The
FAR ranges from 2.72 to 9.02. The floor amount
ranges from 6 to 46 stories.
Geometric Variables
Various geometric variables are calculated for every
typology that is to be simulated. Some of them are
known to be related to environmental performance
like daylighting and solar insolation while others are
purely geometric measurements for the built
environment. They include
Floor Area Ratio (FAR): Gross floor area / site
area
Site Coverage: Building footprint area / site area
Open Space Ratio: Non-built ground area / gross
floor area (Pont and Haupt 2010)
Area-to-Perimeter Ratio: Floor area / floor
perimeter
Compacity: Envelope area / (building volume)2/3
(Adolphe 2001)
Convolution Index: (Perimeter of the building
footprint – Perimeter of the smallest convex
shape of the building footprint) / Perimeter of the
smallest convex shape of the building footprint
(Leung 2009)
Building Height: Average building height
Performance Indicator
Solar insolation is a measurement of the solar
radiation energy received on a given surface area in a
given time. It is commonly known as average
irradiance in watts per square metre (W/m2). For the
comparison of the typologies collected, we proposed
to use the measurement “annual total solar insolation
per unit floor area” as the insolation performance
indicator to compare across various case studies.
Simulation Software
Ecotect, EnergyPlus and Radiance are used initially
to explore the solar insolation on external building
facades. However, Ecotect, as a 32-bit software,
requires a long time to simulate façade solar
insolation as well as the difficult task to map grids on
facades. EnergyPlus can be problematic as users
need to specify internal zones and cannot take very
complex shapes with vertices limitations on plan. It is
also takes a long time to simulate if we apply an
entire precinct for simulation. Radiance, from our
evaluation, is better than Ecotect and EnergyPlus in
terms of the pre-processing stage of getting the
complex 3D model and sensor points ready for
simulation. The time spent for basic simulation is
also much faster than Ecotect and EnergyPlus.
Solar Insolation Simulation Methods
The hour-by-hour simulation (Gendaylit by Jean-
Jacques Delaunay) and cumulative sky
(Gencumulativesky by Darren Robinson) methods
were explored initially using Radiance. The
Gendaylit method (Delaunay 1994) is most accurate
but it requires far more computing time for
simulation, especially for the diffused component.
The Gencumulativesky method (Robinson and Stone
2004) can work well for diffused radiation but not for
direct radiation. It has an average error of up to 32%
against the Gendaylit method for the direct
component and only 3% for the diffused component.
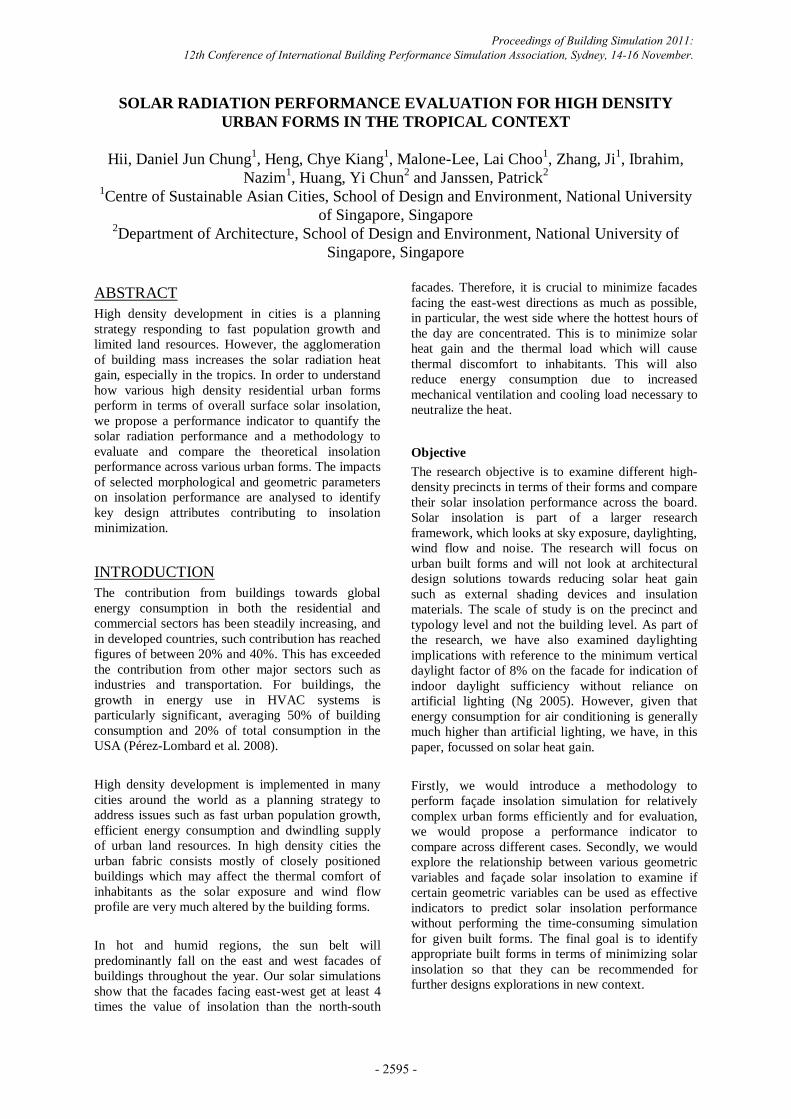
Since the direct component of the Gencumulativesky
is yielding such a large error, we decided to use the
gendaylit program to only simulate the direct
component for 24 representative days. This brings
down the direct component‟s error to just 1.7% and
therefore is good enough for the solar insolation
simulation. Figure 1 shows the graphical resolution
difference between the hour-by-hour simulation and
the 24-day binned suns approach for the direct
component.
Figure 1: Hourly sun position (left) and the sun
positions for the 24 representative days (right)
Workflow
Houdini, a procedural 3D modeling software with
innovative data flow working pipeline is chosen as an
integreated platform to build the 3D model, perform
simulation and visualizing the results. The Python
programming language embedded in Houdini is
Proceedings of Building Simulation 2011: 12th Conference of International Building Performance Simulation Association, Sydney, 14-16 November.
- 2597 -
utilized to “glue” the 3D modeling platform and
simulation software which is Radiance in this case
(Figure 2).
Figure 2: Houdini-Python-Radiance workflow
Houdini is used to build the 3D models for the
various built forms under test, based on which
various geometric parameters are calculated in order
to examine their relationships with solar insolation
performance. Houdini was used to extract the 3D
model information and write it into files in the
formats as required by Radiance via the embedded
Python. Key Parameters for Radiance simulation
were also built into a customized interface in Houdini
to allow quick adjustment of simulation setting.
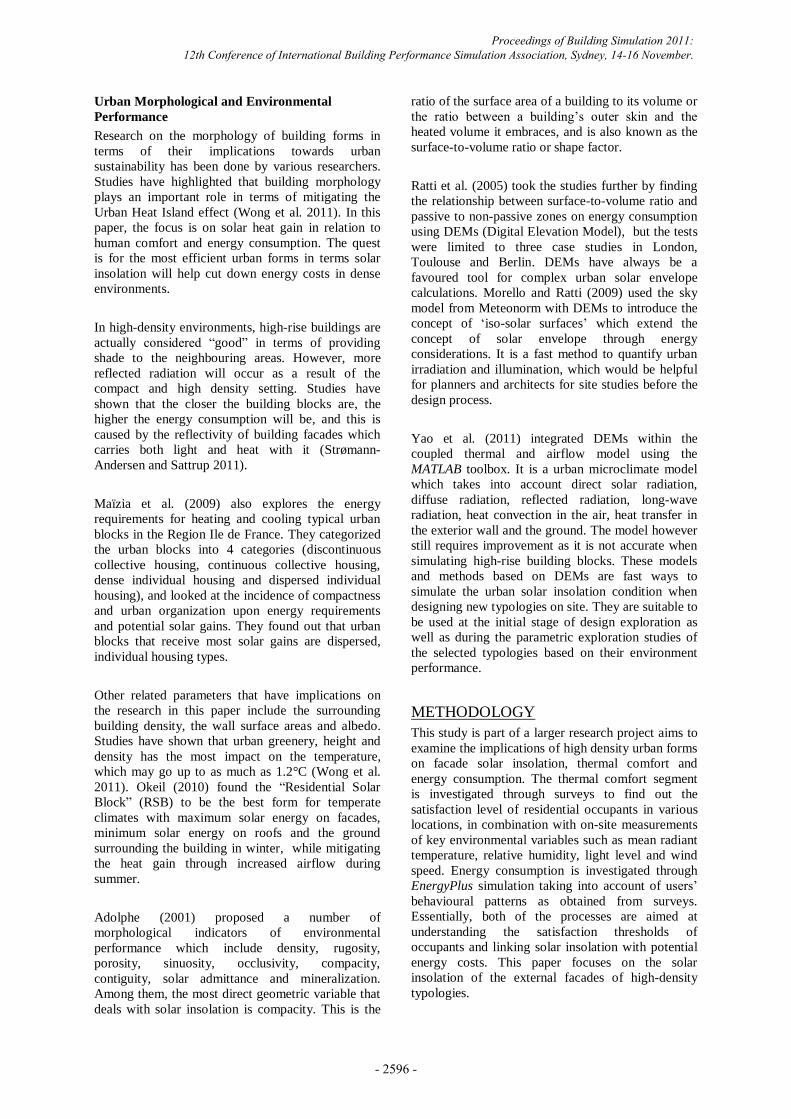
The façade surfaces for the built form under test were
divided into sections of 1m (width) by 3m (height)
and the centroids of the subdivided surfaces were
defined as the sensors for annual total insolation
simulation (Figure 3). The total insolation includes
the direct, diffused and reflected components.
Figure 3: Subdivision of the façades with the
centroids used as the sensor points for Radiance
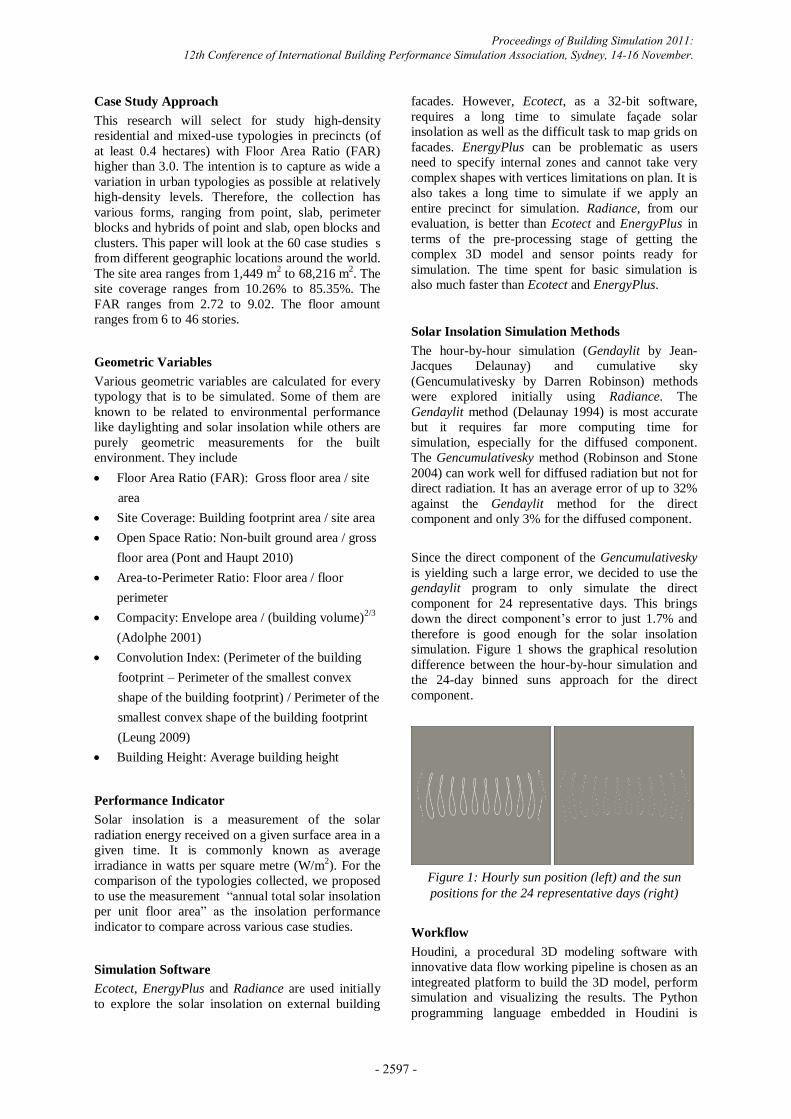
Once the simulation is done, the results file can be
retrived back in Houdini for visualization in various
color legend schemes (Figure 4).
Figure 4: Houdini interface with the visualization of
the results shown on the left and the parameters,
results on every sensor point and the network
Normalization and Orientation
In this research, we consider that it is only fair to
compare different built forms if they are simulated in
a neutral environment. It is not possible to compare
them if we take into context their actual site
conditions with the variation of type, distance and
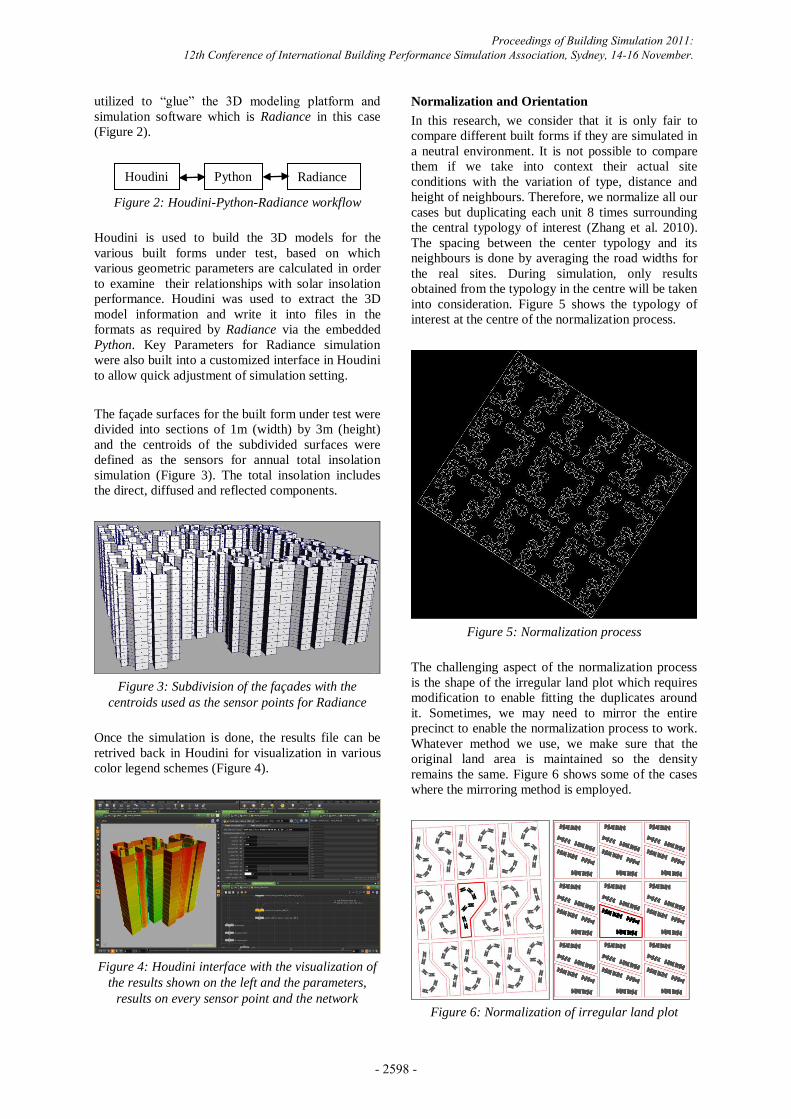
height of neighbours. Therefore, we normalize all our
cases but duplicating each unit 8 times surrounding
the central typology of interest (Zhang et al. 2010).
The spacing between the center typology and its
neighbours is done by averaging the road widths for
the real sites. During simulation, only results
obtained from the typology in the centre will be taken
into consideration. Figure 5 shows the typology of
interest at the centre of the normalization process.
Figure 5: Normalization process
The challenging aspect of the normalization process
is the shape of the irregular land plot which requires
modification to enable fitting the duplicates around
it. Sometimes, we may need to mirror the entire
precinct to enable the normalization process to work.
Whatever method we use, we make sure that the
original land area is maintained so the density
remains the same. Figure 6 shows some of the cases
where the mirroring method is employed.
Figure 6: Normalization of irregular land plot
Radiance Python Houdini
Proceedings of Building Simulation 2011: 12th Conference of International Building Performance Simulation Association, Sydney, 14-16 November.
- 2598 -
In addition to the normalization process, it is also not
fair to compare typologies from various climate
conditions around the world. We acknowledge that
different typologies taken from different locations are
designed to the specific predominant wind directions
and sun paths. Therefore, to neutralize them under
the tropical context, we have to simulate them 4
times at the original position, 90, 180 and 270
degrees and then averaging the results (ASHRAE
2004). This will give a more conclusive overall
performance of every typology.
RESULTS
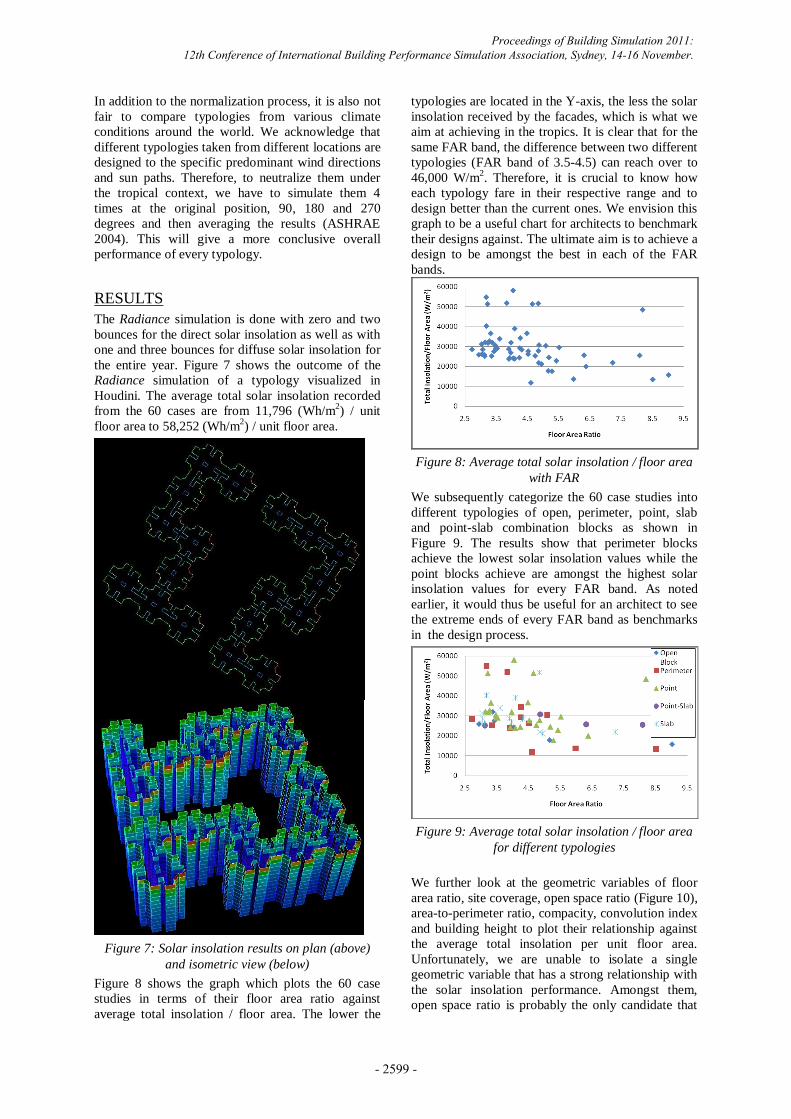
The Radiance simulation is done with zero and two
bounces for the direct solar insolation as well as with
one and three bounces for diffuse solar insolation for
the entire year. Figure 7 shows the outcome of the
Radiance simulation of a typology visualized in
Houdini. The average total solar insolation recorded
from the 60 cases are from 11,796 (Wh/m2) / unit
floor area to 58,252 (Wh/m2) / unit floor area.
Figure 7: Solar insolation results on plan (above)
and isometric view (below)
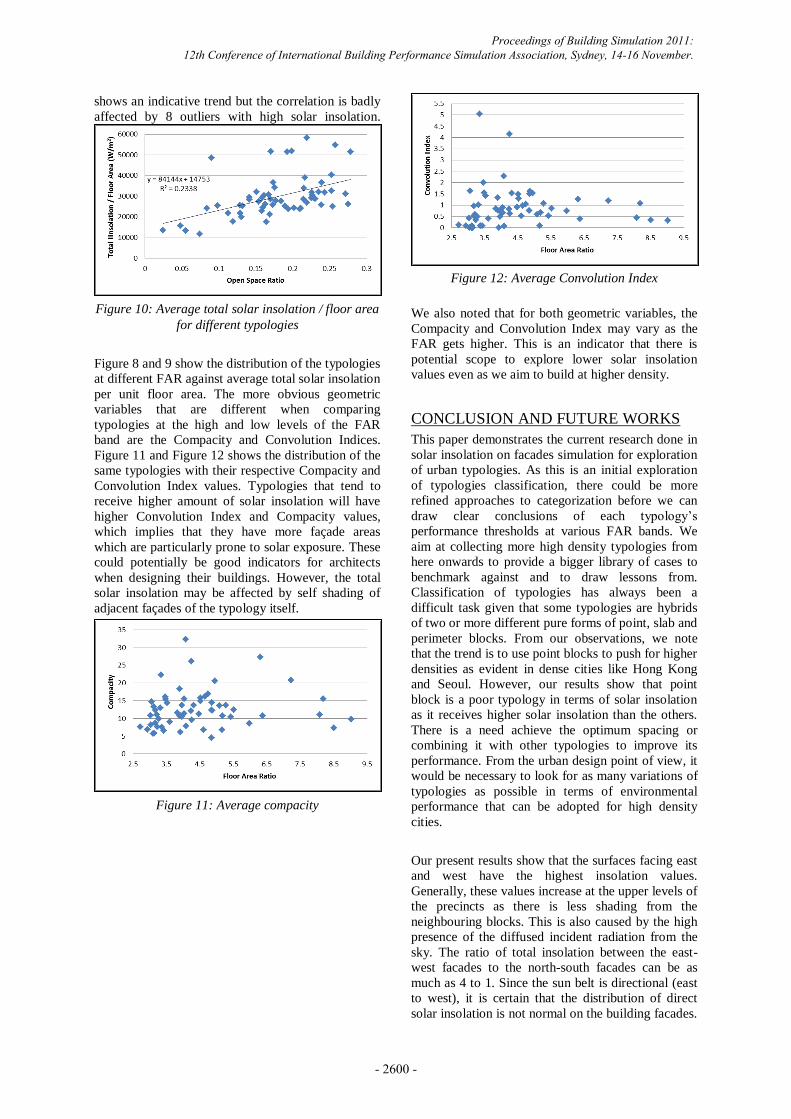
Figure 8 shows the graph which plots the 60 case
studies in terms of their floor area ratio against
average total insolation / floor area. The lower the
typologies are located in the Y-axis, the less the solar
insolation received by the facades, which is what we
aim at achieving in the tropics. It is clear that for the
same FAR band, the difference between two different
typologies (FAR band of 3.5-4.5) can reach over to
46,000 W/m2. Therefore, it is crucial to know how
each typology fare in their respective range and to
design better than the current ones. We envision this
graph to be a useful chart for architects to benchmark
their designs against. The ultimate aim is to achieve a
design to be amongst the best in each of the FAR
bands.
Figure 8: Average total solar insolation / floor area
with FAR
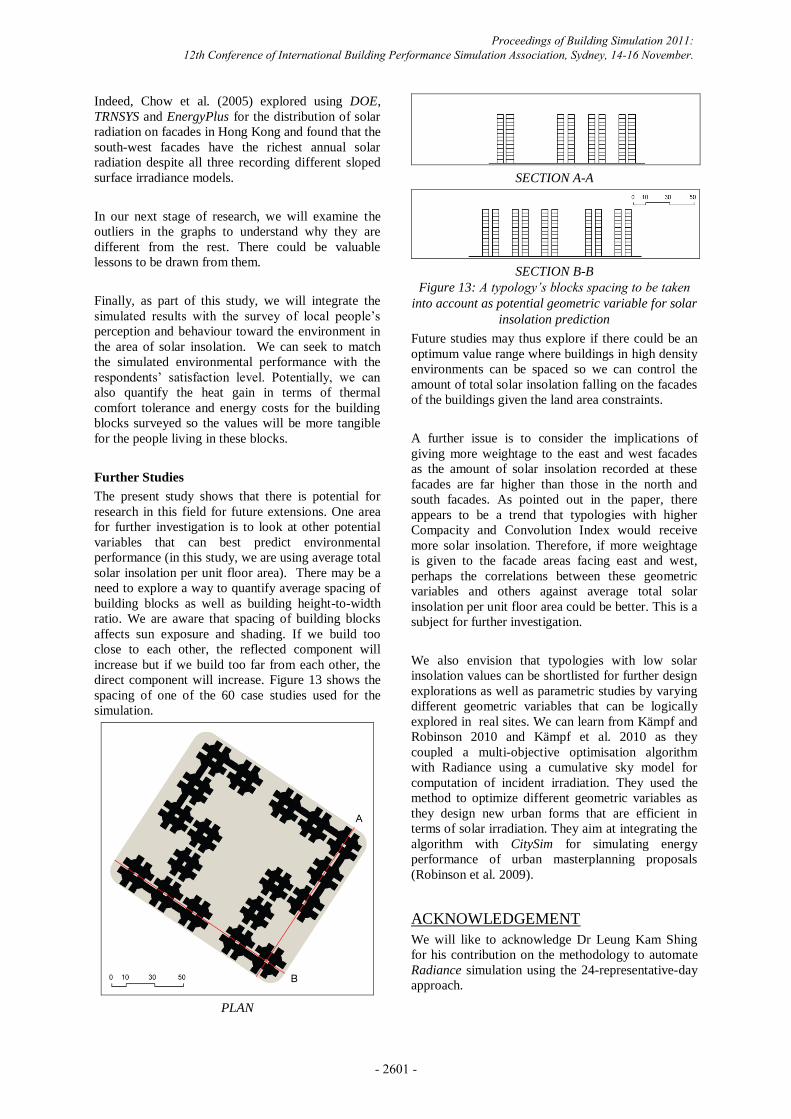
We subsequently categorize the 60 case studies into
different typologies of open, perimeter, point, slab
and point-slab combination blocks as shown in
Figure 9. The results show that perimeter blocks
achieve the lowest solar insolation values while the
point blocks achieve are amongst the highest solar
insolation values for every FAR band. As noted
earlier, it would thus be useful for an architect to see
the extreme ends of every FAR band as benchmarks
in the design process.
Figure 9: Average total solar insolation / floor area
for different typologies
We further look at the geometric variables of floor
area ratio, site coverage, open space ratio (Figure 10),
area-to-perimeter ratio, compacity, convolution index
and building height to plot their relationship against
the average total insolation per unit floor area.
Unfortunately, we are unable to isolate a single
geometric variable that has a strong relationship with
the solar insolation performance. Amongst them,
open space ratio is probably the only candidate that
Proceedings of Building Simulation 2011: 12th Conference of International Building Performance Simulation Association, Sydney, 14-16 November.
- 2599 -
shows an indicative trend but the correlation is badly
affected by 8 outliers with high solar insolation.
Figure 10: Average total solar insolation / floor area
for different typologies
Figure 8 and 9 show the distribution of the typologies
at different FAR against average total solar insolation
per unit floor area. The more obvious geometric
variables that are different when comparing
typologies at the high and low levels of the FAR
band are the Compacity and Convolution Indices.
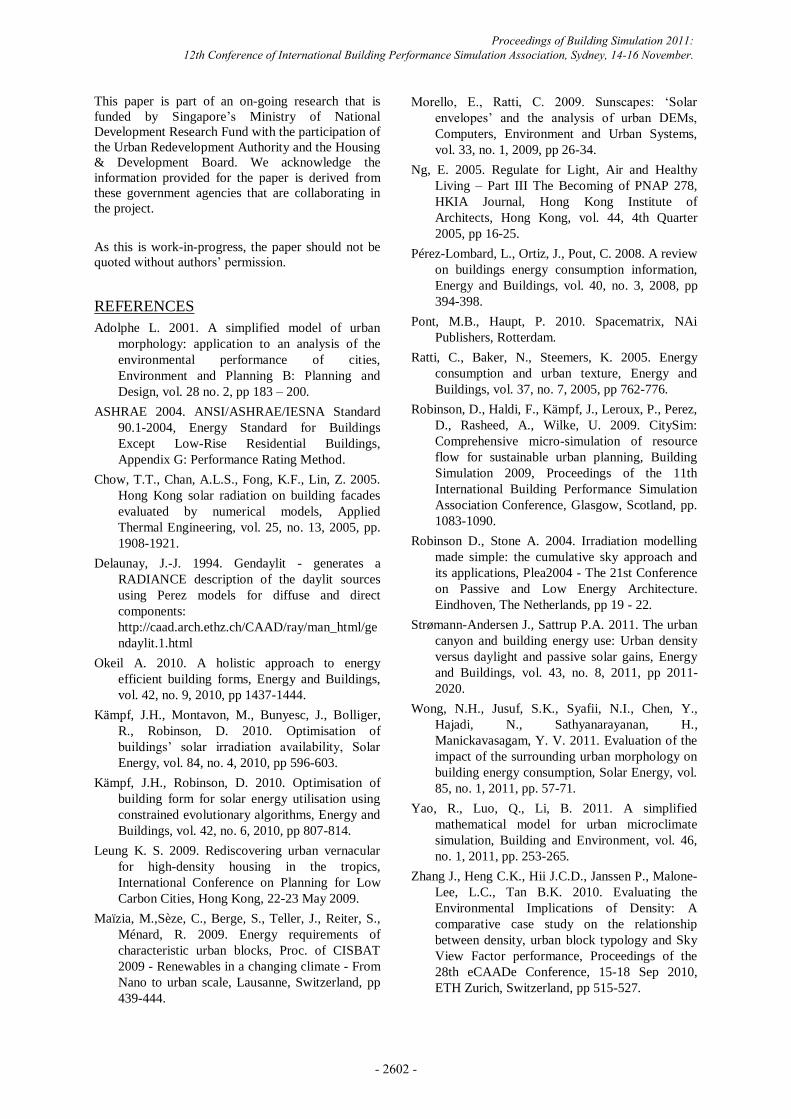
Figure 11 and Figure 12 shows the distribution of the
same typologies with their respective Compacity and
Convolution Index values. Typologies that tend to
receive higher amount of solar insolation will have
higher Convolution Index and Compacity values,
which implies that they have more façade areas
which are particularly prone to solar exposure. These
could potentially be good indicators for architects
when designing their buildings. However, the total
solar insolation may be affected by self shading of
adjacent façades of the typology itself.
Figure 11: Average compacity
Figure 12: Average Convolution Index
We also noted that for both geometric variables, the
Compacity and Convolution Index may vary as the
FAR gets higher. This is an indicator that there is
potential scope to explore lower solar insolation
values even as we aim to build at higher density.
CONCLUSION AND FUTURE WORKS
This paper demonstrates the current research done in
solar insolation on facades simulation for exploration
of urban typologies. As this is an initial exploration
of typologies classification, there could be more
refined approaches to categorization before we can
draw clear conclusions of each typology‟s
performance thresholds at various FAR bands. We
aim at collecting more high density typologies from
here onwards to provide a bigger library of cases to
benchmark against and to draw lessons from.
Classification of typologies has always been a
difficult task given that some typologies are hybrids
of two or more different pure forms of point, slab and
perimeter blocks. From our observations, we note
that the trend is to use point blocks to push for higher
densities as evident in dense cities like Hong Kong
and Seoul. However, our results show that point
block is a poor typology in terms of solar insolation
as it receives higher solar insolation than the others.
There is a need achieve the optimum spacing or
combining it with other typologies to improve its
performance. From the urban design point of view, it
would be necessary to look for as many variations of
typologies as possible in terms of environmental
performance that can be adopted for high density
cities.
Our present results show that the surfaces facing east
and west have the highest insolation values.
Generally, these values increase at the upper levels of
the precincts as there is less shading from the
neighbouring blocks. This is also caused by the high
presence of the diffused incident radiation from the
sky. The ratio of total insolation between the east-
west facades to the north-south facades can be as
much as 4 to 1. Since the sun belt is directional (east
to west), it is certain that the distribution of direct
solar insolation is not normal on the building facades.
Proceedings of Building Simulation 2011: 12th Conference of International Building Performance Simulation Association, Sydney, 14-16 November.
- 2600 -
Indeed, Chow et al. (2005) explored using DOE,
TRNSYS and EnergyPlus for the distribution of solar
radiation on facades in Hong Kong and found that the
south-west facades have the richest annual solar
radiation despite all three recording different sloped
surface irradiance models.
In our next stage of research, we will examine the
outliers in the graphs to understand why they are
different from the rest. There could be valuable
lessons to be drawn from them.
Finally, as part of this study, we will integrate the
simulated results with the survey of local people‟s
perception and behaviour toward the environment in
the area of solar insolation. We can seek to match
the simulated environmental performance with the
respondents‟ satisfaction level. Potentially, we can
also quantify the heat gain in terms of thermal
comfort tolerance and energy costs for the building
blocks surveyed so the values will be more tangible
for the people living in these blocks.
Further Studies
The present study shows that there is potential for
research in this field for future extensions. One area
for further investigation is to look at other potential
variables that can best predict environmental
performance (in this study, we are using average total
solar insolation per unit floor area). There may be a
need to explore a way to quantify average spacing of
building blocks as well as building height-to-width
ratio. We are aware that spacing of building blocks
affects sun exposure and shading. If we build too
close to each other, the reflected component will
increase but if we build too far from each other, the
direct component will increase. Figure 13 shows the
spacing of one of the 60 case studies used for the
simulation.
PLAN
SECTION A-A
SECTION B-B
Figure 13: A typology’s blocks spacing to be taken
into account as potential geometric variable for solar
insolation prediction
Future studies may thus explore if there could be an
optimum value range where buildings in high density
environments can be spaced so we can control the
amount of total solar insolation falling on the facades
of the buildings given the land area constraints.
A further issue is to consider the implications of
giving more weightage to the east and west facades
as the amount of solar insolation recorded at these
facades are far higher than those in the north and
south facades. As pointed out in the paper, there
appears to be a trend that typologies with higher
Compacity and Convolution Index would receive
more solar insolation. Therefore, if more weightage
is given to the facade areas facing east and west,
perhaps the correlations between these geometric
variables and others against average total solar
insolation per unit floor area could be better. This is a
subject for further investigation.
We also envision that typologies with low solar
insolation values can be shortlisted for further design
explorations as well as parametric studies by varying
different geometric variables that can be logically
explored in real sites. We can learn from Kämpf and
Robinson 2010 and Kämpf et al. 2010 as they
coupled a multi-objective optimisation algorithm
with Radiance using a cumulative sky model for
computation of incident irradiation. They used the
method to optimize different geometric variables as
they design new urban forms that are efficient in
terms of solar irradiation. They aim at integrating the
algorithm with CitySim for simulating energy
performance of urban masterplanning proposals
(Robinson et al. 2009).
ACKNOWLEDGEMENT
We will like to acknowledge Dr Leung Kam Shing
for his contribution on the methodology to automate
Radiance simulation using the 24-representative-day
approach.
Proceedings of Building Simulation 2011: 12th Conference of International Building Performance Simulation Association, Sydney, 14-16 November.
- 2601 -
This paper is part of an on-going research that is
funded by Singapore‟s Ministry of National
Development Research Fund with the participation of
the Urban Redevelopment Authority and the Housing
& Development Board. We acknowledge the
information provided for the paper is derived from
these government agencies that are collaborating in
the project.
As this is work-in-progress, the paper should not be
quoted without authors‟ permission.
REFERENCES
Adolphe L. 2001. A simplified model of urban
morphology: application to an analysis of the
environmental performance of cities,
Environment and Planning B: Planning and
Design, vol. 28 no. 2, pp 183 – 200.
ASHRAE 2004. ANSI/ASHRAE/IESNA Standard
90.1-2004, Energy Standard for Buildings
Except Low-Rise Residential Buildings,
Appendix G: Performance Rating Method.
Chow, T.T., Chan, A.L.S., Fong, K.F., Lin, Z. 2005.
Hong Kong solar radiation on building facades
evaluated by numerical models, Applied
Thermal Engineering, vol. 25, no. 13, 2005, pp.
1908-1921.
Delaunay, J.-J. 1994. Gendaylit - generates a
RADIANCE description of the daylit sources
using Perez models for diffuse and direct
components:
http://caad.arch.ethz.ch/CAAD/ray/man_html/ge
ndaylit.1.html
Okeil A. 2010. A holistic approach to energy
efficient building forms, Energy and Buildings,
vol. 42, no. 9, 2010, pp 1437-1444.
Kämpf, J.H., Montavon, M., Bunyesc, J., Bolliger,
R., Robinson, D. 2010. Optimisation of
buildings‟ solar irradiation availability, Solar
Energy, vol. 84, no. 4, 2010, pp 596-603.
Kämpf, J.H., Robinson, D. 2010. Optimisation of
building form for solar energy utilisation using
constrained evolutionary algorithms, Energy and
Buildings, vol. 42, no. 6, 2010, pp 807-814.
Leung K. S. 2009. Rediscovering urban vernacular
for high-density housing in the tropics,
International Conference on Planning for Low
Carbon Cities, Hong Kong, 22-23 May 2009.
Maïzia, M.,Sèze, C., Berge, S., Teller, J., Reiter, S.,
Ménard, R. 2009. Energy requirements of
characteristic urban blocks, Proc. of CISBAT
2009 - Renewables in a changing climate - From
Nano to urban scale, Lausanne, Switzerland, pp
439-444.
Morello, E., Ratti, C. 2009. Sunscapes: „Solar
envelopes‟ and the analysis of urban DEMs,
Computers, Environment and Urban Systems,
vol. 33, no. 1, 2009, pp 26-34.
Ng, E. 2005. Regulate for Light, Air and Healthy
Living – Part III The Becoming of PNAP 278,
HKIA Journal, Hong Kong Institute of
Architects, Hong Kong, vol. 44, 4th Quarter
2005, pp 16-25.
Pérez-Lombard, L., Ortiz, J., Pout, C. 2008. A review
on buildings energy consumption information,
Energy and Buildings, vol. 40, no. 3, 2008, pp
394-398.
Pont, M.B., Haupt, P. 2010. Spacematrix, NAi
Publishers, Rotterdam.
Ratti, C., Baker, N., Steemers, K. 2005. Energy
consumption and urban texture, Energy and
Buildings, vol. 37, no. 7, 2005, pp 762-776.
Robinson, D., Haldi, F., Kämpf, J., Leroux, P., Perez,
D., Rasheed, A., Wilke, U. 2009. CitySim:
Comprehensive micro-simulation of resource
flow for sustainable urban planning, Building
Simulation 2009, Proceedings of the 11th
International Building Performance Simulation
Association Conference, Glasgow, Scotland, pp.
1083-1090.
Robinson D., Stone A. 2004. Irradiation modelling
made simple: the cumulative sky approach and
its applications, Plea2004 - The 21st Conference
on Passive and Low Energy Architecture.
Eindhoven, The Netherlands, pp 19 - 22.
Strømann-Andersen J., Sattrup P.A. 2011. The urban
canyon and building energy use: Urban density
versus daylight and passive solar gains, Energy
and Buildings, vol. 43, no. 8, 2011, pp 2011-
2020.
Wong, N.H., Jusuf, S.K., Syafii, N.I., Chen, Y.,
Hajadi, N., Sathyanarayanan, H.,
Manickavasagam, Y. V. 2011. Evaluation of the
impact of the surrounding urban morphology on
building energy consumption, Solar Energy, vol.
85, no. 1, 2011, pp. 57-71.
Yao, R., Luo, Q., Li, B. 2011. A simplified
mathematical model for urban microclimate
simulation, Building and Environment, vol. 46,
no. 1, 2011, pp. 253-265.
Zhang J., Heng C.K., Hii J.C.D., Janssen P., Malone-
Lee, L.C., Tan B.K. 2010. Evaluating the
Environmental Implications of Density: A
comparative case study on the relationship
between density, urban block typology and Sky
View Factor performance, Proceedings of the
28th eCAADe Conference, 15-18 Sep 2010,
ETH Zurich, Switzerland, pp 515-527.
Proceedings of Building Simulation 2011: 12th Conference of International Building Performance Simulation Association, Sydney, 14-16 November.
- 2602 -