solar flux and spectrum measurements in the euv spectral region on board the koronas-i satellite
TRANSCRIPT
lladiophyJiej and Qttnnlmm s Vol. 3g, No~. 11-1~, 1996
S O L A R F L U X A N D S P E C T R U M M E A S U R E M E N T S I N T H E E U V
S P E C T R A L R E G I O N ON B O A R D T H E K O R O N A S - I S A T E L L I T E
T. V. K a z a c h e v s k a y a , S. I. A v d y u s h l n , D. f t . G o n y u k h , f t . I. L o m o v s k y , A. A. N u s i n o v , P. M. Sv idsky , Yu. N . T-~ygelni tsky, V. N . Oraevsky , I . M. Kopaev~ S. I. B o l d y r e v , a n d E. D. M i s h c h e n k o UDC 523.94:523.9-739
Data on the equipment mortared on board the KORONAS-t satellite and solar fluz measurements in the ez.treme ultraviolet range ()~ < 130 nm} are presented. A thermoluminescent teel~aique was used for solar ultraviolet radiomet~ (SUR). Vacuum ultrauivlet zolar spectrometry (VUS..r equipment based on the gas-photoelectron spectrometry method was emlJloyed to measure the tie H 30.~ nm line in the solar spectram. The solar fluz it, the region ~ < 130 r~m was 7.5 ery.cm~2s -1 ~tnd the Lyraan all~ha line intensity was (3.3-3.7). 1D 11 qv.anbcm-2s -1 in the low solar activity period from March to June 1994. The intensity of the He H (30.4 nmfl line was varied in the l~mits of (6.0-?.5) . 10 s qu~nt.cm-2s -1 from ?he 4 th to the 7 th of Marck, 1994. No intensive solar flares were registered in the observation period. An increase in the solar flux by ~,,15~ was observed at ,h < 130 am d~,rin a the B4.5 X-ray flare (J~ne 30, I99L Olh08 ' ' fYT}.
It is well knowxt that the Sun is a variable star observable in the ultraviolet and X-ray ranges. Knowl- edge of variability characteristics (amphtucie variations with different temporal scales) is importa.at both for tmderstartdixtg the solar chromosphere and corona pr<)r and for calculating the ionosphere and upper atmosphere as well as f'oz solving middle atmosphere problems, primarily, the ozorte problem. Despite the long prehistory in the s~udy of ~traviolet and X-ray variations, the ideas of their temporal scale~ and chax- acteristics axe controvertial. First of all, this is due to difficulties in equipment design and the lozt accu_rac~, and irregularity of measuremeat~ in this spectral region.
The KORONAS-I satellite was placed in orbit from the Plesetsk space-launch complex or- March 2, 1994. The main researda problems of the project included the study of nonst&tionary phenomena, dyaaanical processes, and heliosei.~rnology. The satel].ite was equipped with an apparatus for recording the radiation in the range from radio to X-ray and gamma-ray radiation. The high accuracy of o~ieatation of KOI~Ob/AS-I (3-10 minutes of arc) allowe4 h2gh-precision measurements to be performed for both the entire Sun and indivJdttal solar structures.
I. MEASUREMENT OF THE IONIZING SOLAR *FLUX
For regular measurements of the ionizing solar radiation intensity in the extreme ultraviolet spec- tral region, KORONAS-I was equipped with a solar ultraviolet radiometer (SUVR), which measured at wavelength~ A < 130 nm as well as in the hydrogen line L= (121.6 am) [1].
The thermoluminescent method was used to record the solar ultraviolet radiation by the SUVK. Aer to this method~ the short-wave energy is accumulated in the detector made of thermoluminescent phosphor CaSOa(M-n) applied oxt a ceramic plate. After a 19.5 s exposure to the Sun, the detector plate is
Fedorov Institute of Applied Geophysics of the Roskomgidromet, Moscow; Central Design Bureau of the HMI of the Roskomgidromet, Moscow; Institute of "Terrestrial Magnetism, the onosphere, and Radio Wave Propagation, Russian Academy of Sciences, Troitsk, Moscow Region; Research Institute of Physics of :Saint Petersburg State University. Translated from Izvestiya Vysshikh Uchebnykh Zavedenlij Radiofizika, Vol. 39, Nos. 11-12, pp. 1514-1520, November-December, 1995. Original art;cle submitted May 14, 1996.
0033-8443/96/3911-1(211515.00 @1997 Plenum Pub/i~lfing Corporation 1011
80 70
1 6O 50
3 0
1@ @
0
"�9 - '~ '~-- ",,,,,, u,, ? I I I I
20 4 0 60 80 I N Days from March 3, 1994
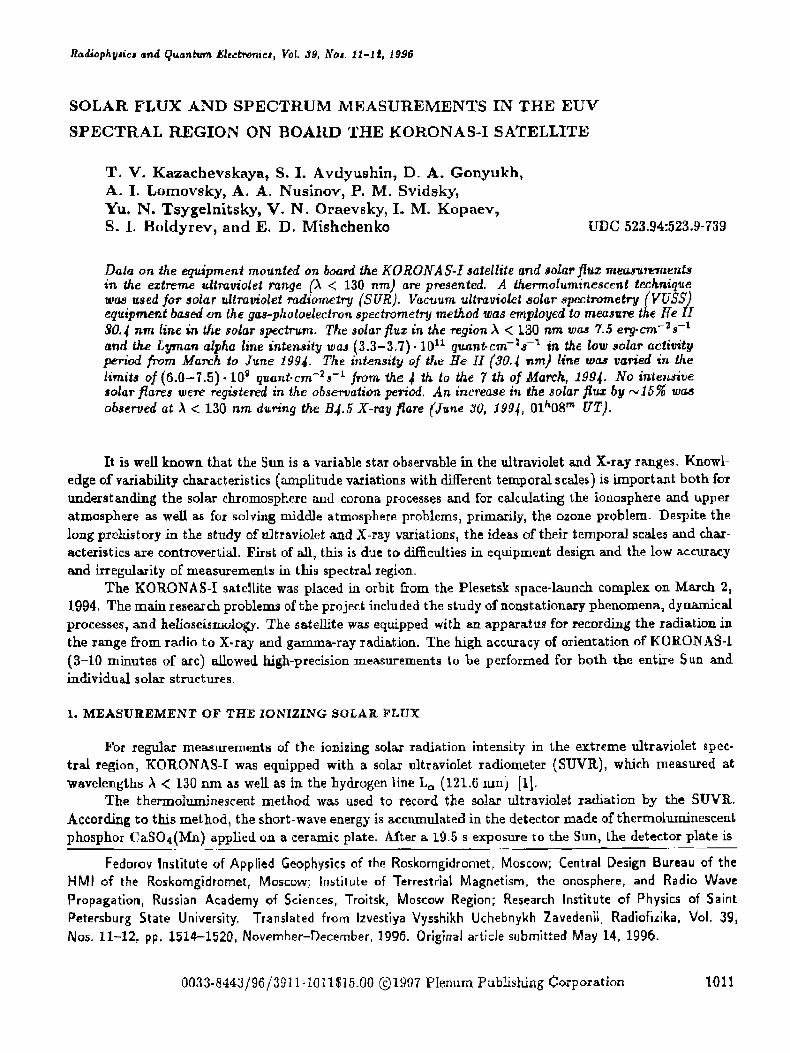
Fig. 1. The total solar flux with A < 130 nm.
moved and set in f~ont of the photomultiplier tube (PMT). As the plate is subject to further heating, the phosphor re-emits the stored energy in the green spectral region CA = 500 nm).
The thermolnrninescent flux of light is converted by the PMT and the electronic circuit to a telemetric
signal. Filters are set in front of the detector to extract individual areas in the spectrnrn when the UV
radiation is measured. The internal operating cycle of the instrument consists in scanning 24 detectors, including detectors
with and without filters. Four detectors are exposed and then scanned simultaneously: a no-filter detector, which measures the total UV flux with A < 130 nm, and three filter detectors, including MgF2, which extracts the radiation in the hydrogen line La (121.6 nm), and a thin alnrninurn foil and a thin Mylar film, which extract the spectral areas with A < 10 nm and A < 12 urn, respectively. A special ZnS-based, C14-activated standard of constant luminescence is used to calibrate the measuring circuit in flight.
The registered quantities depend on both the solar intensity and the orientation of the instrument. The angular dependence is taken into account by an electron-optical spectrometer (EOS) as a special sensor whose signal is proportional to the solar illumination of the entrance window in the visible light.
The telemetric information from the UVStt encompasses the period from March 4 to June 30, 1994. According to the data for that period, the solar intensity in the La line amounted to 5.5-6.1 erg.cm-2s -1
and the average solar flux was ,,~ 7.5 erg.cm-2s -1 for A < 130 urn. No strong intensity variations were recorded.
A decrease in sensitivity of the apparatus was observed in the initial period of work in the orbit. The measured quantities were corrected using signals from the built-in standards. Figure 1 shows the solar fluxes which were measured by the instr~ment and corrected due to changes in the sensitivity for A < 130 n m (the lower and the middle curves, respectively) and the radio flux variations at wavelength 10.7 cm (F10.T, the upper curve) for the period from March to June, 1994.
The period of observation was quiet enough and no strong flares were recorded at that time. The UVSR registered a sole B4.5 X-ray flare (June 30, 1994, 01h08 '~ UT). Unfortunately, we did not succeed in observing tho complete phase of the flare because of the departure of the satellite into the shadow, but the principal phase occurred exactly in the observation period. According to the measurements, the flux of the entire Sun at A < 130 nrn increased by ,,~ 1 erg-cm-2s -1, i.e., by 15% of the total flux.
2. ABSOLUTE MEASUREMENTS OF THE He II LINE RADIATION USING A NONOPTICAL VUS SPECTROMETER
The use of optical spectrometry methods in the ionizing radiation observations showed a number of shortcomings of the conventional optical spectrometers which include, as functional components, a light flux collector, a monochromatizer, and a receiver.
1012
VUSS spectrometer
| Ionization volume Gas inlet
M
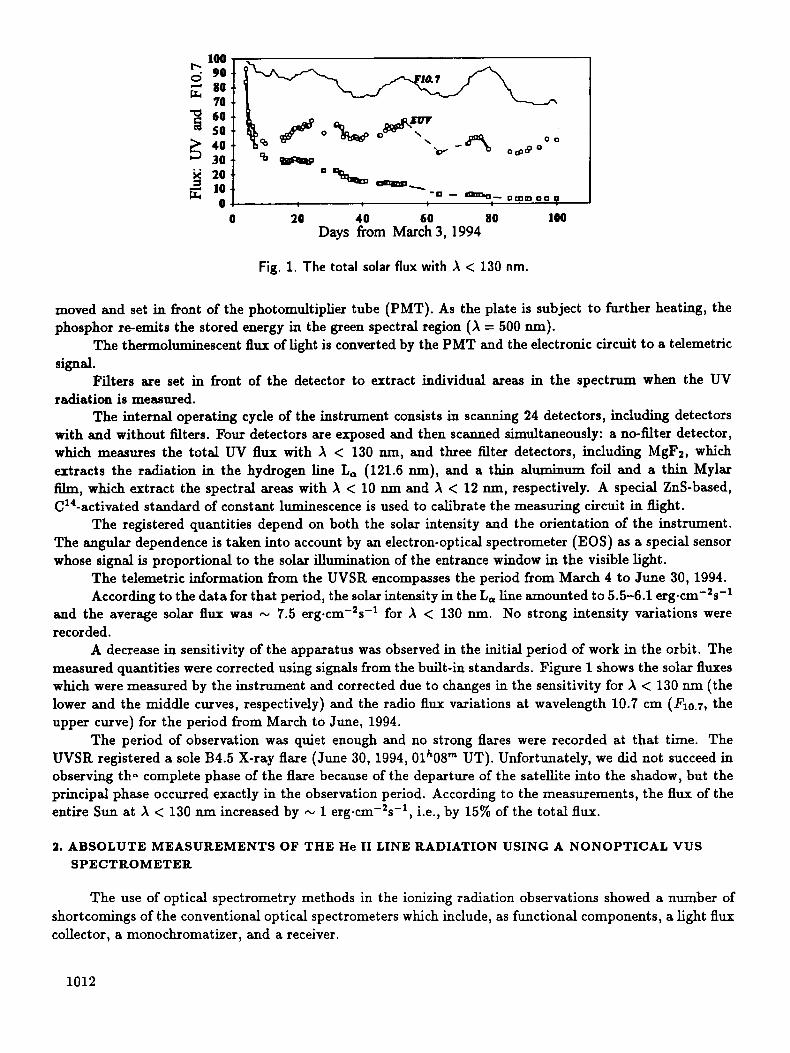
Fig. 2. Schematic of the VUSS.
To measure in absolute energy units, all these components must be calibrated with respect to reflec- �9 tivity, transmissivity, sensitivity, and many other parameters. The temporal stability of these parameters to the environment must also be studied. In many cases the sustaining of this stability, and the determination of its temporal variation are very complicated problems.
The VUSS mounted on board the KORONAS-I satellite is based on the method of collisional pho- toionization spectroscopy [2] and is free of some drawbacks inherent in the classical spectrometers. The radiation is recorded by photoionization of noble gases. The energy spectrum of photoelectrons is employed to analyze the spectral composition of the radiation.
A simplified schematic of the VUSS is shown in Fig. 2. The spectrometer represents a bounded space filled with a flowing one-atom working gas and containing
two electron mirrors. Each mirror consists of decelerating and shielding electrodes designed as louvers. The system is placed into a homogeneous magnetic field perpendicular to the electron mirrors, and electron collectors are set behind those mirrors. The radiation comes to the space between the electron mirrors in the ionization chamber through a microchannel plate, which also controls the gas flow. The energy of the electrons released in the photoionization of the working gas atoms is related unambiguously to the energy of the radiated quanta, and the rate of quantum formation is proportional to the number of quanta and photoionization cross-section. The electrons generated in the ionization chamber wander along the magnetic field lines in the space between the electron mirrors. The spectral composition of the radiation is analyzed by scanning the decelerating potential U fed to the electrodes. Only electrons having kinetic energies sufficient to overcome the potential barrier can reach the collector plate. The shielding electrode with zero potent ial prevents the electrostatic field of the electrode from entering the ionization area.
Besides the detector unit described above, the VUSS also contains an electronics unit and a gas feeding system composed of a balloon with neon under a pressure of 150 a tm and a "leak."
The spectrometer was calibrated at the vacuum test bed of the Research Inst i tute of Physics of the Leningrad State University, using a special ionization chamber. The absolute quantum sensitivity of the spectrometer amounted to 5 �9 10 -s electron.cm-2quant -z for a measurement error within 10%.
The main characteristics of the VUSS are as follows: spectral region /k 28-50 urn, resolving power A/AA = 400, t ime resolution 10 min, power consumption 20 W, and weight 15 kg.
The first days after placing the satellite in orbit, we observed an abrupt decrease of the spectrometer sensitivity, which could be due to insufficient filling of the chamber space with working gas. One reason for this effect was the nons tandard operation of the gas-fi|ling system owing to the decrease in tempera ture on board the satellite. The reduced sensitivity of the instrument allowed only the He H 30.4 n m line to be extracted.
Over the period from March 4 to 7, 1994, which was characterized by low solar activity (F10.7 '~ 89-80) , the flux in that line measured with accuracy not worse than 15% was varied within the limits 6.0 �9 109 to
I,i, t , Bould~
l Moscow
blarch 5, 1994 March 6, 1994 March 7, 1994
F Is7
90
80
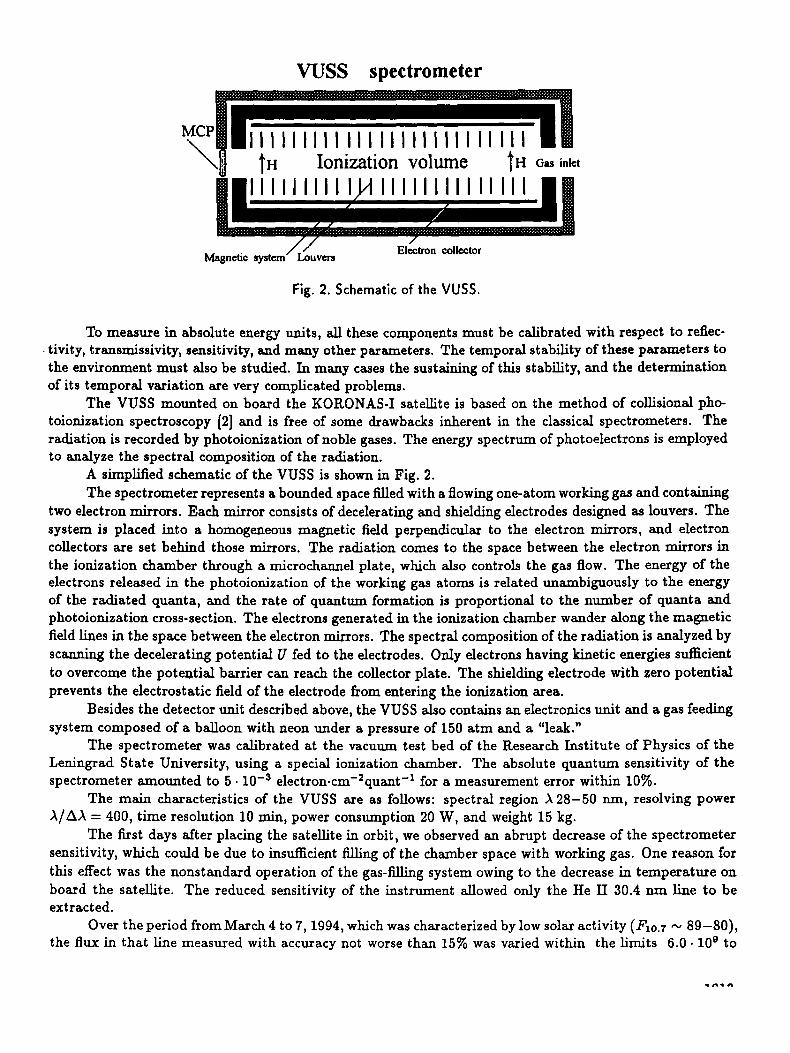
Fig. 3. Solar flux in the 30.4 nm helium line.
7.5.109 quant-cm-2s -I. The results of the observations are presented in Fig. 3, which shows the flux values in the He IT 30.4 nrn line flattened over three points and the average diurnal fluxes.
Correlation of these quantities with the solar radio emission indices F10.z measured at the stations in Boulder and in Moscow shows the same tendency with variations in that index.
S. D I S C U S S I O N O F R E S U L T S
Let us compare the results of the measurements with present-day UV models. Calculations by models [3-4] give energy flux estimates from 6.7 to 7.9 erg.cm-~s -1 for wavelengths
shorter than 130 nrn. According to the UVSR measurements, the average flux in that period amounted to about
7.5 erg.cm-2s -1, in agreement with the model calculations generalizing measurements in the previous solar cycles.
The results of the VUSS measurements in the 30.4 nm line appeared somewhat lower than the values obtained from model [3]. The model calculations give 9.109 quant.cm-2s -1, while the measured quantities do not'exceed 7.5.10 ~ quant.cm-2s -I. This difference will be the object of further study, since it shows, if the reason is not the inaccuracy of measurements, that either the radiation models must be corrected or we are dealing with the anomalous behavior of UV fluxes in the vicinity of the 22 nd sunspot cycle.
This work was supported in part by the Russian Foundation for Pundamental Research under Grant No. 96-02-18320.
REFERENCES
1. T. V. Kazachevskaya, G. M. Ivanov-Kholodny, and D. A. Gonyuk, Geomagn. Adron., 25,995 (1985). 2. E. D. Mishchenko, A. M. Abdullaev, and G. S. Kvatter, Opt. Spectrose., 44, No. 6, 1076 (1978). 3. E. A. Bruevich and A. A. Nusinov, Geomagn. Adron., 24, No. 4, 581 (1984). 4. V. V. Katyushlua, M. V. Krasinets, A. A. Nusinov, Ch. A. Bart, and G. Zh. Rottman, Geomagn. Adron.,
31, No. 1, 40 (1991).
1014