solar energy grid integration systems · photovoltaic (pv) and smart-grid technologies. the fsec...
TRANSCRIPT
SANDIA REPORT SAND2012-1395
Unlimited Release
Printed March 2012
Solar Energy Grid Integration Systems: Final Report of the Florida Solar Energy Center Team
Ward Bower, Sigifredo Gonzalez, Abbas Akhil, Scott Kuszmaul, Lisa Sena-Henderson, Carolyn
David, Robert Reedy, Kristopher Davis, David Click, Houtan Moaveni, Leo Casey, Mark
Prestero, Jim Perkinson, Stanley Katz, Michael Ropp, Alan Schaffer
Prepared by Sandia National Laboratories
Albuquerque, New Mexico 87185 and Livermore, California 94550
Sandia National Laboratories is a multi-program laboratory managed and operated by Sandia Corporation, a wholly owned subsidiary of Lockheed Martin Corporation, for the U.S. Department of Energy's
National Nuclear Security Administration under contract DE-AC04-94AL85000.
Approved for public release; further dissemination unlimited.
2
Issued by Sandia National Laboratories, operated for the United States Department of Energy by Sandia
Corporation.
NOTICE: This report was prepared as an account of work sponsored by an agency of the United States
Government. Neither the United States Government, nor any agency thereof, nor any of their
employees, nor any of their contractors, subcontractors, or their employees, make any warranty, express
or implied, or assume any legal liability or responsibility for the accuracy, completeness, or usefulness
of any information, apparatus, product, or process disclosed, or represent that its use would not infringe
privately owned rights. Reference herein to any specific commercial product, process, or service by
trade name, trademark, manufacturer, or otherwise, does not necessarily constitute or imply its
endorsement, recommendation, or favoring by the United States Government, any agency thereof, or
any of their contractors or subcontractors. The views and opinions expressed herein do not necessarily
state or reflect those of the United States Government, any agency thereof, or any of their contractors.
Printed in the United States of America. This report has been reproduced directly from the best available
copy.
Available to DOE and DOE contractors from
U.S. Department of Energy
Office of Scientific and Technical Information
P.O. Box 62
Oak Ridge, TN 37831
Telephone: (865) 576-8401
Facsimile: (865) 576-5728
E-Mail: [email protected]
Online ordering: http://www.osti.gov/bridge
Available to the public from
U.S. Department of Commerce
National Technical Information Service
5285 Port Royal Rd.
Springfield, VA 22161
Telephone: (800) 553-6847
Facsimile: (703) 605-6900
E-Mail: [email protected]
Online order: http://www.ntis.gov/help/ordermethods.asp?loc=7-4-0#online
3
SAND2012-1395
Unlimited Release
Printed March 2012
Solar Energy Grid Integration Systems: Final Report of the Florida Solar Energy Center Team
Ward Bower, Sigifredo Gonzalez, Abbas Akhil, Scott Kuszmaul
Lisa Sena-Henderson, Carolyn David
Sandia National Laboratories
P.O. Box 5800
Albuquerque, New Mexico 87185
Robert Reedy, Kristopher Davis, David Click, Houtan Moaveni
Florida Solar Energy Center of the University of Central Florida
1679 Clear Lake Road
Cocoa, FL 32922
Leo Casey, Mark Prestero, Jim Perkinson, Stanley Katz
Satcon Technology Corporation
25 Drydock Avenue 7th Floor
Boston, MA 02210
Michael Ropp
Northern Plains Power Technologies
807 32nd avenue
Brookings, SD 57006-4716
Alan Schaffer
Lakeland Electric Utilities
502 E Lemon St,
Lakeland, FL 33801
Abstract
Initiated in 2008, the Solar Energy Grid Integration Systems (SEGIS) program is a
partnership involving the U.S. DOE, Sandia National Laboratories, private sector
companies, electric utilities, and universities. Projects supported under the program
have focused on the complete-system development of solar technologies, with the
dual goal of expanding utility-scale penetration and addressing new challenges of
connecting large-scale solar installations in higher penetrations to the electric grid.
4
The Florida Solar Energy Center (FSEC), its partners, and Sandia National
Laboratories have successfully collaborated to complete the work under the third and
final stage of the SEGIS initiative. The SEGIS program was a three-year, three-stage
project that include conceptual design and market analysis in Stage 1, prototype
development and testing in Stage 2, and moving toward commercialization in Stage 3.
Under this program, the FSEC SEGIS team developed a comprehensive vision that
has guided technology development that sets one methodology for merging
photovoltaic (PV) and smart-grid technologies. The FSEC team‘s objective in the
SEGIS project is to remove barriers to large-scale general integration of PV and to
enhance the value proposition of photovoltaic energy by enabling PV to act as much
as possible as if it were at the very least equivalent to a conventional utility power
plant. It was immediately apparent that the advanced power electronics of these
advanced inverters will go far beyond conventional power plants, making high
penetrations of PV not just acceptable, but desirable.
This report summarizes a three-year effort to develop, validate and commercialize
Grid-Smart Inverters for wider photovoltaic utilization, particularly in the utility
sector. This project was a team collaboration between the Florida Solar Energy
Center, Satcon Technology Corporation, Northern Plains Power Technologies,
Lakeland Electric Utilities, SunEdison, Sentech, Inc., Cooper Power Systems EAS,
DX3 Enterprises Ltd., and Sandia National Laboratories.
5
ACKNOWLEDGMENTS
This research was supported by the United States Department of Energy in collaboration with
Sandia National Laboratories under the Solar Energy Grid Integration Systems (SEGIS) contract.
The Florida Solar Energy Center, Satcon and Sandia National Laboratories would like to also
acknowledge the support and collaboration of Northern Plains Power Technologies, Lakeland
Electric Utilities, SunEdison, Sentech, Inc., Cooper Power Systems EAS, and DX3 Enterprises
Ltd..

6
7
CONTENTS
Executive Summary ...................................................................................................................... 11
1 Introduction ............................................................................................................................. 13 1.1 Team Members ............................................................................................................. 14 1.2 Key Results of the Project............................................................................................. 14
2 SEGIS Project Overview ........................................................................................................ 17 2.1 Objectives ..................................................................................................................... 17 2.2 Scope ............................................................................................................................. 17 2.3 SEGIS Concept Paper Comparisons ............................................................................. 20 2.4 Market Update .............................................................................................................. 21
3 SEGIS Tasks: Descriptions and Results ................................................................................. 23 3.1 Stage 1: Evaluate Feasibility ......................................................................................... 23
3.1.1 Task 1: Conduct Feasibility Studies and Preliminary Design ........................ 23 3.1.2 Task 2: Estimated Product Performance and Cost .......................................... 24
3.1.3 Task 3: Identify Perceived and Actual Barriers and Mitigation Plans ............ 24 3.1.4 Task 4: Market Analysis ................................................................................. 27
3.1.5 Task 5: Revise Stage 2 and 3 Plans Based on Stage 1 Investigation .............. 28 3.1.6 Task 6: Stage 1 Program Management and Reporting ................................... 29
3.2 Stage 2: Prototype Development .................................................................................. 30
3.2.1 Task 7: Comprehensive Design Development ................................................ 30 3.2.2 Task 8: Prototype Construction ...................................................................... 35
3.2.3 Task 9: Prototype Testing and Evaluation ...................................................... 36 3.2.4 Task 10: Product Cost Estimation and Impact on PV System Costs .............. 37
3.2.5 Task 11: Value-Added Features and Strategies to Mitigate Negative
Impacts of High Penetration ........................................................... 38
3.2.6 Task 12: Refinements to Technology Development Road Map ..................... 38 3.2.7 Task 13: Stage 2 Program Management and Reporting ................................. 38
3.3 Stage 3: Towards Commercialization ........................................................................... 38
3.3.1 Task 14: Final Design Preparation .................................................................. 38
3.3.2 Task 15: Final Test Plan Preparation .............................................................. 39 3.3.3 Task 16: Test Site Hardware and Software Installation/Integration ............... 39 3.3.4 Task 17: Validation Testing ............................................................................ 39 3.3.5 Task 18: Commercialize the Grid-Smart Inverter Systems and Engender
Industry Acceptance of SEGIS Concepts ....................................... 40
3.3.6 Task 19: Stage 3 Program Management and Reporting ................................. 40
4 Perceived Impacts for the Utility, Customer and PV Applications Future ............................. 41
4.1 Applications .................................................................................................................. 41 4.2 Value Added and Costs ................................................................................................. 41 4.3 U.S. Jobs ....................................................................................................................... 42 4.4 Long Term Standardizations ......................................................................................... 43
5 Conclusions ............................................................................................................................. 45
6 References ............................................................................................................................... 47
8
Appendix A: Modeling/Simulation............................................................................................... 49
Appendix B: Witness Test Results (condensed) ........................................................................... 71
Appendix C: Satcon Advertisement Featuring GSI Functionality ............................................... 83
FIGURES
Figure 1: One-line diagram of a power system incorporating the concepts of the FSEC team‘s
preliminary design of the Grid-Smart Inverter Architecture (GSIA) ..................................... 19 Figure 2: Jim Perkinson of Satcon describing the Lakeland SCADA interface, shown on the
screen to the left, at the FSEC team‘s Demonstration Site Conference. Also shown are the
real-time current-voltage vectors on the screen to the right. .................................................. 20
Figure 3: Lakeland Center test site ............................................................................................... 29
Figure 4: Fourier amplitude spectrum of the signal received at the PV site, (a) with 20%
loading, (b) with 80% loading on the feeder. .......................................................................... 32
Figure 5: Model block diagram for Grid-Smart Inverter and Architecture. ................................. 33 Figure 6: Simulation results for the Grid-Smart Inverter (non-shared) deploying the Power
Factor Command. .................................................................................................................... 34 Figure 7: One-line diagram of the Grid-Smart Inverter. ............................................................... 35 Figure 8: One-line diagram of the Grid-Smart Shared Inverter. ................................................... 35
Figure 9: Testing the first-generation Satcon Subcombiner (Left) and the 100 kW Grid-Smart
Shared Inverter (Right). .......................................................................................................... 36
Figure 10: 50 kW Grid-Smart Inverter (left) and the 100 kW Grid-Smart Shared Inverter
(right) at the DETL facility. .................................................................................................... 37
TABLES
Table 1: SEGIS Concept Paper comparisons with FSEC team‘s project ..................................... 21
Table 2: List of UDAC member organizations ............................................................................. 27 Table 3: Overview of tests performed during the Prototype Witness Testing exercise ................ 36
9
NOMENCLATURE
AI-algorithm Anti-islanding algorithm
AMI Advanced Metering Infrastructure
BIPV Building Integrated Photovoltaic
D-STATCOMS Distribution Static VAr Compensators
DER Digital Event Recorder
DETL Distributed Energy Technologies Laboratory
DG Distributed Generation
DOE U.S. Department of Energy
EAS Energy Automation Solutions
EIA Energy Information Administration
EPRI Electric Power Research Institute
FSEC Florida Solar Energy Center
GSI Grid Smart Inverter
GSIA Grid Smart Inverter Architecture
HECO Hawaiian Electric Company
HMI Human Machine Interface
IEEE Institute of Electrical and Electronics Engineers
Islanding Separation of a portion of the larger grid with a near balance of load and
generation, such that the frequency of the island remains stable near 60Hz.
Note: a microgrid is such an island, which is intentional, while islands are
generally not intended.
LCOE Levelized Cost Of Energy
Legacy Existing systems of an older design
LFRT Low frequency ride-through
LVRT Low voltage ride-through
MECO Maui Electric Company
Microgrid A small subset of the utility grid disconnected from the larger grid and
operating with a balance between load and generation, such as a commercial
building or residential subdivision.
MPPT Maximum Power Point Tracking
NIST National Institute of Standards and Technology
NPPT Northern Power Plains Technologies
OF/UF Over Frequency/Under Frequency
OV/UV Over Voltage/Under Voltage
PPA Power Purchase Agreement
PSAI Permissive Signal Anti-Islanding, a method of protection against unintended
islands based on interrogation of feeder continuity by a continuous signal
superimposed on each phase of the feeder circuit.
PV Photovoltaic, Photovoltaics
RPS Renewable Portfolio Standard
RTU Remote Terminal Unit
SCADA Supervisory Control and Data Acquisition
SEGIS Solar Energy Grid Integration Systems
SEGIS-AC SEGIS-Advanced Concepts

10
SNL Sandia National Laboratories
T&D Transmission and Distribution
UDAC Utility Design Advisory Committee
U-I Utility Interactive
VAr Volt Ampere Reactive
11
Executive Summary
The Florida Solar Energy Center (FSEC) and its SEGIS team, consisting of Satcon Technology
Corporation, Northern Plains Power Technologies, Lakeland Electric Utilities, SunEdison,
Sentech, Inc., Cooper Power Systems EAS, DX3 Enterprises Ltd., and Sandia National
Laboratories, have successfully collaborated to complete the work under the third and final stage
of the SEGIS initiative. Initiated in 2008, the SEGIS initiative is a partnership that includes
DOE, Sandia National Laboratories, industry, utilities, and universities. Its focus is on the
development of technologies required to facilitate the integration of large-scale solar power
generation into the nation‘s grid. The SEGIS initiative was a three-year, three-stage project that
encompassed conceptual designs and market analysis in Stage 1, prototype development and
testing in Stage 2, and moving toward commercialization in Stage 3.
Many experts believe high penetration and large-scale utility adoption of photovoltaics (PV),
coupled with decreasing costs and increasing reliability and performance, is a critical element of
the future of renewable energy. The Florida Solar Energy Center (FSEC) team‘s objective in the
SEGIS initiative was to remove barriers to large-scale general integration of PV and to enhance
the value proposition of photovoltaic energy by enabling PV to act as much as possible as if it
were at the very least equivalent to a conventional utility power plant. It was immediately
apparent that the advanced power electronics of these advanced inverters will go far beyond
conventional power plants, making high penetrations of PV not just acceptable, but desirable. PV
power generating plants will not achieve their full potential until they cease to be regarded by
utilities as a problem or potential hazard, but instead as a resource that can be monitored and
dispatched to contribute to the efficiency and stability of the grid.
The Grid-Smart Inverter and Architecture (GSIA) developed by Satcon (with input from the
entire FSEC team) features both advanced components (e.g., Grid-Smart inverter, Grid-Smart
shared inverter, and Site Controller) and innovative integration of conventional technologies that
address these barriers and market needs. Satcon Technology Corporation‘s Grid-Smart inverter
(GSI) has the necessary power electronics controls, communications interfaces, and control
system architecture to interface with utility energy management systems, provide adaptive anti-
islanding, manage real and reactive power output, and offer cost-reducing aggregated control of
multiple PV units. Further, these inverters are readily controlled via utility Supervisory Control
and Data Acquisition (SCADA) systems, can provide the type of diagnostic and prognostic
information that utilities require, and can incorporate a variety of solutions to weather induced
intermittency.
The design focus of this project was commercial and utility-scale PV systems, which typically
deliver the output power directly into a substation or a dedicated distribution feeder. Therefore,
these systems can be viewed as a form of Central Station power plants. It is critical that future
PV systems perform not just at a level approaching that of conventional generation, but that
future PV systems outperform older technologies and meet critical utility needs, such as control
of generation status, ride-through of disturbances, Volt Amp Reactive (VAr) generation and
voltage support, and shared inverter designs for utility-owned complex sites. While several of
these needs are met with conventional generation, the introduction of large-scale PV systems and
integrated power electronics offers utilities new and enhanced features from an energy source

12
that is too often considered overly variable. Such features include stabilization of mini/micro
grids (in island mode), harmonic cancellation, deliberate phase unbalance and rebalance,
prognostics and diagnostics, real-time phase balance of feeder circuits, enhanced transient
response, oscillation damping, and spinning and ready reserve.
13
1 Introduction
With exponential growth in the terrestrial photovoltaic (PV) market [1], many issues arise
regarding the integration of these systems into utility networks at high levels of penetration. One
such issue is ensuring these systems are seen as valuable resources, rather than liabilities, to
utility system operators. PV systems are composed of PV array(s) that convert incident solar
energy into DC electricity, and an inverter which, as the power electronics interface between the
array and utility network, performs many functions to ensure the system operates effectively and
safely. These functions include performing maximum power point tracking of the array,
providing DC to AC inversion, and synchronizing the AC current and voltage to that of the
utility network [1]. Inverters also act as the human-machine interface (HMI) for most PV
systems, and often perform data collection duties to track and communicate the performance of
the system to the owners and operators.
Significant efforts from private industry, academia, and governmental agencies have led to
continued massive reduction in the levelized cost of energy (LCOE) from PV systems. From the
point of view of the utility system operator, conventional PV systems still have many
disadvantages when compared to traditional fossil-fuel generators regardless of the LCOE. Some
of the key disadvantages include:
A PV system is an intermittent power source, dependent on the fluctuating sunlight local
to the area in which it is installed.
Conventional PV systems operate at unity power factor, regardless of the reactive power
needs of the utility network.
Due to concerns regarding unintentional islanding, current interconnection standards
require distributed PV systems to cease to export power during voltage and frequency
disturbances, thereby reducing generation at times when it is needed most.
Thanks to relatively recent improvements in power electronics, including advances in fast
semiconductor switching devices and real-time, computer-based control systems [2], PV inverter
technology actually has the potential to overcome these barriers and provide significant added
value beyond the simple kilowatt hour (kWh) production of energy [3]-[4]. For this Solar Energy
Grid Integration Systems (SEGIS) project [3], the Florida Solar Energy Center (FSEC) and its
team partners proposed an objective-driven method to design, develop, and demonstrate an
advanced inverter with monitoring, control, and management of solar electrical energy
generation. The integration of advanced power management functions provides beneficial grid
support such as enhanced grid stability and reliability, voltage regulation, and reactive power
(VAr) support. This approach is applicable not only to PV, but also to other renewable
distributed energy resources (DER), and will help accelerate utilization of renewable energy
technologies. Ultimately, it is the FSEC team‘s hope that this project will contribute to altering
the electricity delivery from central power plants to a modern system with a combination of
central and distributed energy resource, and also contribute to changing the emphasis of
investment in electricity generation away from limited supply fossil fuels with polluting and
climate changing impacts, in favor of harvesting inexhaustible solar energy with environmentally
benign and, therefore, climate-friendly effects.
14
1.1 Team Members
The team for this SEGIS project is led by the Florida Solar Energy Center, a research institute of
the University of Central Florida. In addition, a strong group of core subcontractors was created
to bring complementary skills to complete the project team, including expertise in renewable and
distributed energy resources, power electronics, energy efficiency, demand side management,
facilities energy management systems, integration of DER into the utility system, and
communications technologies. Equipment and technology suppliers all contributed to the project
with the intention and understanding that a full-scale demonstration of the innovative approach
would validate the value and enhance the viability of their products in the modernization of the
electric power system. The FSEC team included the following subcontractors:
SatCon, one of the world‘s top inverter manufacturers
Sentech, Inc., a clean energy technology analysis and market transformation consulting
firm that supports public and private organizations with interests in renewable energy and
smart grid applications
SunEdison, the number one American purchaser of inverters in its role as a renewable
energy developer, marketer, and financier
Lakeland Electric Utilities (―Lakeland‖), a Florida-based municipally-owned utility
Northern Plains Power Technologies (NPPT), a South Dakota based power systems
consulting firm specializing in grid-integration of renewable, microgrid, and computer
simulation of power systems
Additionally, the team benefited from the cooperation, flexibility, and favorable pricing of its
vendor-partner for the demonstration Permissive Signal Anti-Island equipment:
DX3 Enterprises, a leading engineering consulting and equipment manufacturing
company with unique expertise in quick-turnaround manufacturing of designed-for-client
electrical equipment
1.2 Key Results of the Project
The key results of this project include the demonstration of three major innovations. First is the
design and implementation of grid-smart features for utility control and optimization through the
commercially available Satcon Equinox™ inverter and Satcon Site Controller. In order for PV to
effectively replace fossil fuel generation, it must integrate into the existing generation mix and, at
a minimum, meet the standards imposed on conventional generation. These grid-smart features
are enabled via fully bidirectional SCADA communication. They include remote ability to
control (on/off) or curtail generation, power factor control, and remote diagnostics and
prognostics. While these features were certainly innovative, a utility operator with thousands of
PV systems in the service area would not be able to take full advantage of them unless the
systems could be modified as an aggregate—a feature provided by the Satcon Site Controller.
The second major innovation is the design and implementation of a shared inverter through the
commercially available Satcon Solstice™ inverter. The shared inverter allows for PV arrays of
different orientations, technologies, and age to share a single inverter through string-level
maximum power point tracking (MPPT). This allows for a modular approach to PV system
15
construction, and it is ideally suited for multi-plane rooftops, building-integrated PV (BIPV), and
perhaps a scenario where a utility-owned central inverter is the power conditioner for a number
of customer-owned rooftop PV systems on neighboring buildings.
The third major innovation is the design and implementation of inverter ride-through with a
permissive signal, demonstrated by the team using some off-the-shelf and prototype hardware.
Many utilities continue to have concerns about localized anti-islanding solutions in a high-
penetration scenario when many inverters on a feeder are running identical anti-islanding
algorithms [5]. While synchrophasors have been proposed as a potential solution, they do not
address the common downed-wire hazard, when a single distribution conductor falls from a
power line to an accessible location. This permissive signal architecture provides reliable anti-
islanding protection with the benefit of allowing utility-enabled ride-through.

16
17
2 SEGIS Project Overview
2.1 Objectives
The primary objective of the FSEC team in the SEGIS project was to develop and demonstrate at
least three innovations of great interest to utilities and the renewable energy industry:
1. A novel approach to protection from islanding during utility feeder outages, which allows
the operation of the PV generation during all other grid disturbances without risk to
personnel or public safety
2. Utility control of inverters in distributed systems to produce leading VArs as needed to
replace or supplement dedicated power factor correction capacitors or distribution static
VAr compensators (D-STATCOMs)
3. A novel ―shared‖ inverter architecture featuring a Smart Subcombiner to improve safety,
provide diagnostics/prognostics of individual module strings, and enhance energy yield
for large roof-top arrays, central-station PV farms, and linear PV farms along rights-of-
way
But why are these innovations important? These advances can transform the way PV is utilized
in today‘s energy generation, transmission, and distribution (T&D), and transform the use
paradigm in America and elsewhere. Typical modern grid-connected inverters that tie clean
energy systems such as PV to utility grids are essentially high-bandwidth amplifiers connected to
the grid, so there is no requirement that they mimic the functionality and response time of
thermal or hydropower plants with large synchronous generators. These inverters are typically
configured and controlled as current sources to put energy onto the grid, synchronized with the
grid‘s voltage waveform. They do not, typically, supply reactive power to the grid and, in the
few cases where reactive power is supplied to correct the power factor of adjacent loads on the
same low voltage bus, the inverter typically only follows a fixed preset VAr supply reference.
They are also capable, if additionally powered from an energy storage device and fast grid
connect device, of acting in a voltage source mode and powering local loads in a load-following
manner.
In addition to the development and demonstration of these three technical innovations, other
indirect goals for this this project included:
Provide pathway to significant cost reduction in utility scale PV
Promote interest in PV for utilities by making them aware of the added value potential of
many DERs on their network with a power electronics interface that can be controlled
remotely
Develop new interconnection standards that allow safe ride-through operation of grid-tied
inverters and permit the supply of ancillary services
2.2 Scope
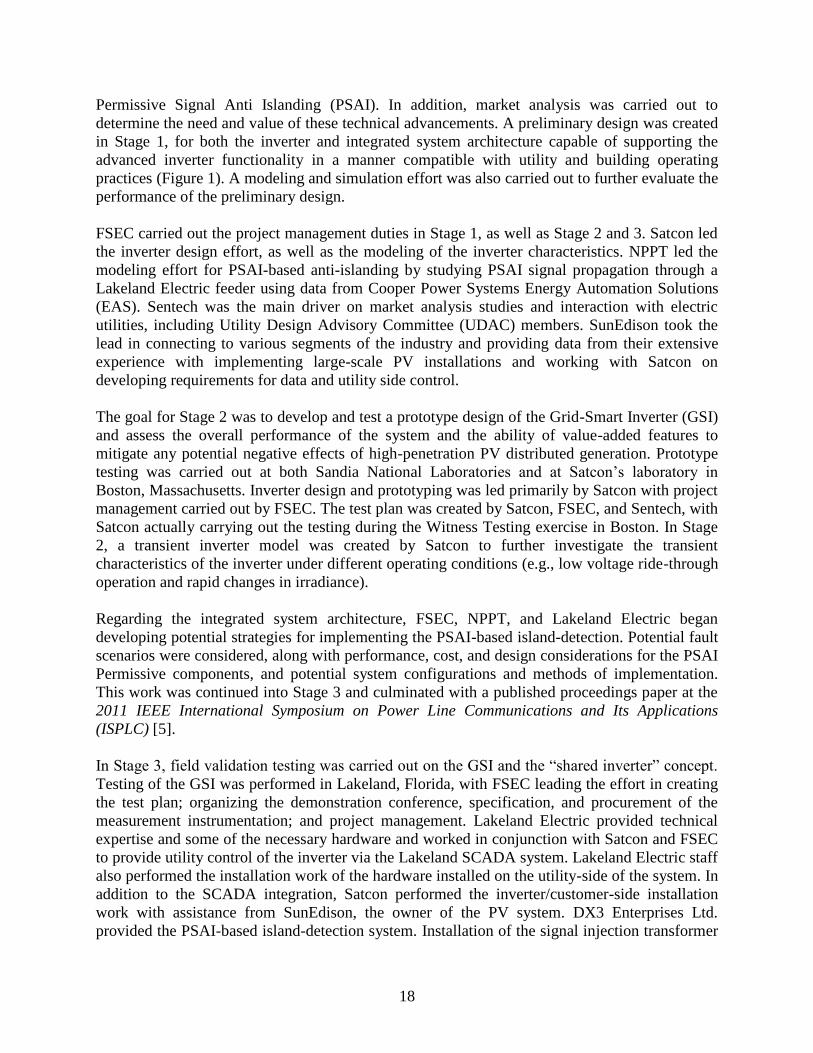
The focus of Stage 1 for this SEGIS project was to evaluate the feasibility of utility controlled
inverters with advanced power management functionality and improved island detection via
18
Permissive Signal Anti Islanding (PSAI). In addition, market analysis was carried out to
determine the need and value of these technical advancements. A preliminary design was created
in Stage 1, for both the inverter and integrated system architecture capable of supporting the
advanced inverter functionality in a manner compatible with utility and building operating
practices (Figure 1). A modeling and simulation effort was also carried out to further evaluate the
performance of the preliminary design.
FSEC carried out the project management duties in Stage 1, as well as Stage 2 and 3. Satcon led
the inverter design effort, as well as the modeling of the inverter characteristics. NPPT led the
modeling effort for PSAI-based anti-islanding by studying PSAI signal propagation through a
Lakeland Electric feeder using data from Cooper Power Systems Energy Automation Solutions
(EAS). Sentech was the main driver on market analysis studies and interaction with electric
utilities, including Utility Design Advisory Committee (UDAC) members. SunEdison took the
lead in connecting to various segments of the industry and providing data from their extensive
experience with implementing large-scale PV installations and working with Satcon on
developing requirements for data and utility side control.
The goal for Stage 2 was to develop and test a prototype design of the Grid-Smart Inverter (GSI)
and assess the overall performance of the system and the ability of value-added features to
mitigate any potential negative effects of high-penetration PV distributed generation. Prototype
testing was carried out at both Sandia National Laboratories and at Satcon‘s laboratory in
Boston, Massachusetts. Inverter design and prototyping was led primarily by Satcon with project
management carried out by FSEC. The test plan was created by Satcon, FSEC, and Sentech, with
Satcon actually carrying out the testing during the Witness Testing exercise in Boston. In Stage
2, a transient inverter model was created by Satcon to further investigate the transient
characteristics of the inverter under different operating conditions (e.g., low voltage ride-through
operation and rapid changes in irradiance).
Regarding the integrated system architecture, FSEC, NPPT, and Lakeland Electric began
developing potential strategies for implementing the PSAI-based island-detection. Potential fault
scenarios were considered, along with performance, cost, and design considerations for the PSAI
Permissive components, and potential system configurations and methods of implementation.
This work was continued into Stage 3 and culminated with a published proceedings paper at the
2011 IEEE International Symposium on Power Line Communications and Its Applications
(ISPLC) [5].
In Stage 3, field validation testing was carried out on the GSI and the ―shared inverter‖ concept.
Testing of the GSI was performed in Lakeland, Florida, with FSEC leading the effort in creating
the test plan; organizing the demonstration conference, specification, and procurement of the
measurement instrumentation; and project management. Lakeland Electric provided technical
expertise and some of the necessary hardware and worked in conjunction with Satcon and FSEC
to provide utility control of the inverter via the Lakeland SCADA system. Lakeland Electric staff
also performed the installation work of the hardware installed on the utility-side of the system. In
addition to the SCADA integration, Satcon performed the inverter/customer-side installation
work with assistance from SunEdison, the owner of the PV system. DX3 Enterprises Ltd.
provided the PSAI-based island-detection system. Installation of the signal injection transformer
19
was carried out by Lakeland Electric. In addition to the PSAI demonstration efforts carried out in
Lakeland, a more detailed modeling study was led by NPPT, leading to a paper published in the
Proceedings of the 37th
IEEE Photovoltaic Specialists Conference [6].
Figure 1: One-line diagram of a power system incorporating the concepts of the FSEC
team’s preliminary design of the Grid-Smart Inverter Architecture (GSIA)
20
The testing of the ―shared inverter‖ concept was led by Satcon. This test site was located at
Alpha Grainger‘s manufacturing facility in Franklin, Massachusetts.
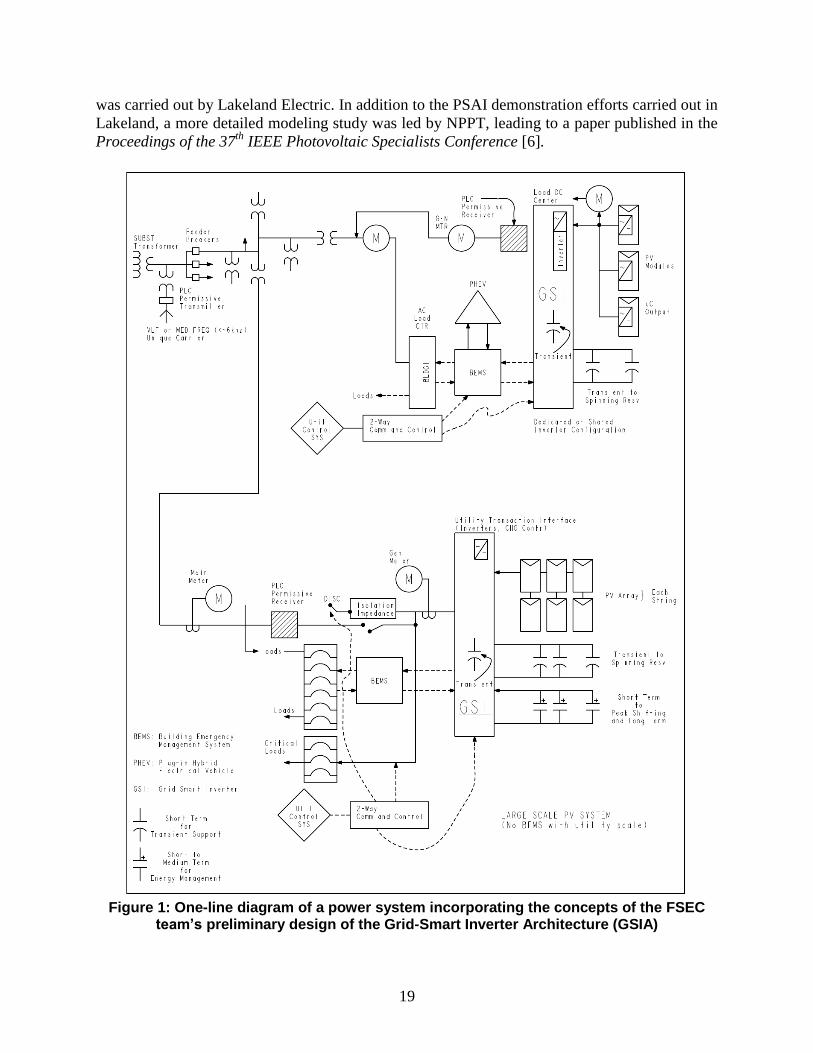
The FSEC team organized a Demonstration Site Conference, hosted by Lakeland Electric at their
headquarters in Lakeland, Florida, on September 22, 2011. At this conference, more than 55
people witnessed Lakeland Electric remotely control the Satcon GSI using their SCADA system.
Using multiple large display screens showing the SCADA interface and real-time current-voltage
characteristics (Figure 2), the advanced functionality of the GSIA was clearly demonstrated,
including power factor control, VAr injection, and PSAI-based island detection.
Figure 2: Jim Perkinson of Satcon describing the Lakeland SCADA interface, shown on the screen to the left, at the FSEC team’s Demonstration Site Conference. Also shown
are the real-time current-voltage vectors on the screen to the right.
2.3 SEGIS Concept Paper Comparisons Sandia National Laboratories‘ SEGIS Concept Paper [4] was critical in helping identify key
technical areas for the FSEC team‘s SEGIS project. Some of the topics featured in the SEGIS
Concept Paper that were selected for this project are included in Table 1 and broken out in the
three innovation areas of this project. The page number(s) listed after each bullet notes where
that topic can be found in [4].

21
Table 1: SEGIS Concept Paper comparisons with FSEC team’s project
FSEC Team Innovation Area SEGIS Concept Paper Topic and Page Number
Grid-Smart Inverter
Architecture
Innovative system-integrated inverter controller products
(pg. 20)
External communications (pg. 20-21)
Voltage regulation (pg. 21)
―Shared Inverter‖ Concept
Reduced cost and complexity of installation through
innovative installation methods (pg. 23)
Self-diagnostics for the inverter/controller/energy
management (pg. 23)
Integration with plug-in hybrid vehicle systems (pg. 25)
Permissive Anti-Islanding Anti-islanding control (pg. 20)
Continuous Power Line Carrier Communications (pg. 21)
Cross-Cutting Reducing inverter cost (pg. 25-26)
2.4 Market Update In the U.S., the SEGIS programs, supported through the U.S. Department of Energy, have
encouraged inverter manufacturers to develop advanced algorithms for power factor control and
low-voltage ride-though. Satcon has been extensively involved with the SEGIS program since its
inception in 2008. Moreover, Satcon has extensive real-world experience with ride-through of an
island microgrid system on the island of Lana‘i, Hawaii.
Satcon inverters power Hawaii‘s largest solar photovoltaic farm and micro-grid on the island of
Lana‘i, Hawaii. The 1.2 megawatt (MW) installation is the first solar photovoltaic power plant to
be controlled remotely by a utility, Maui Electric Company, Ltd. (MECO). MECO has to
manage the grid remotely from the island of Maui, thirty miles and an ocean channel away, by
ramping up and down different generation sources. They also have to be able to handle
intermittent power output from the PV plant due to cloud cover during the day and lack of solar
power at night. Given a 12-24 hour weather forecast and knowledge of expected solar irradiance
levels at all times during the day, MECO is able to predict when the solar plant is available to
generate power and when spinning reserve diesel generators need to be used to meet demand.
Satcon developed a remote utility-control system embedded in the inverters to be used at Lana‘i.
With this advanced system control technology, the PV plant is seamlessly integrated into the
utility grid, with the inverter serving as the central control point. The intelligence contained in
the inverter means that MECO can dynamically switch from solar to diesel energy sources and
back, thus supplying uninterrupted power to the island. Additionally, MECO can use the inverter
to generate reactive power from the PV plant, stabilizing the grid when it comes under stress.
The functionality developed and deployed in this project became the foundation for all of
Satcon‘s next generation solutions, including Equinox, Solstice, and the factory integrated
medium voltage building block, Prism Platform. A recent advertisement in SolarPro magazine
has been included in Appendix C.

22
23
3 SEGIS Tasks: Descriptions and Results
3.1 Stage 1: Evaluate Feasibility
3.1.1 Task 1: Conduct Feasibility Studies and Preliminary Design
To address this task, the team focused on three areas: (1) interconnection standards, (2)
communications, and (3) simulation model development. Based on these areas, the team worked
to understand the key requirements for realizing the Grid-Smart Inverter concept.
The standards issues, primarily associated with restrictive requirements of IEEE Std.1547 [4],
have been identified and their resolution in favor of different, more permissive grid-
interconnection standards for distributed generation continues to be actively pursued.
Specifically, through involvement in existing and emerging sub-committees of IEEE Std. 1547,
team members continue to advocate for inverter-based distributed generation. This included two
team members being present at the most recent IEEE Std.1547 Microgrid, Secondary Networks
and Simulation subcommittee meetings in Las Vegas in January 2009. The FSEC team has three
active balloting members of the IEEE committees and several others who have participated in
previous IEEE Std.1547 ballots.
Communications development focused on establishing the communications requirements for the
Grid-Smart Inverter operating grid-connected, under utility control, and assessing the ability of
current communications methods to provide the needed data connection for both monitoring and
control. Validating the results of this assessment of the ability of each PV inverter unit to
communicate bi-directionally with a local site controller, or SCADA remote terminal unit
(RTU), allowing the inverter-grid interface to be centrally controlled, was accomplished in
subsequent project stages.
Simulation model development and grid-connected inverter performance analysis under critical
conditions has supported the development and incorporation of necessary control features into
inverter controls. A separate project from this SEGIS effort, but with particular relevance,
involves a PV generation site on the Hawaiian island of Lana‘i, where a moderate PV plant
(1.2MW) is integrated into a small diesel grid (4MW). The penetration of 30% Solar PV coupled
with the small grid highlights many of the same concerns of large scale integration into the larger
utility grid. This project was undertaken at the request of the PV Integrator (SunPower), the PV
plant owner (Lana‘i Sustainability Research – a division of Castle and Cooke), the DOE, and the
local utility (MECO, HECO), to incorporate inverter control features that would enable the high
PV penetration, address and control intermittency, give the utility control over the plant from a
remote control center (on the island of Maui), and upgrade overall grid performance.
Incorporating these inverter and PV plant control features, integrated with the utility SCADA
system on the Lana‘i grid, required detailed software development, extensive simulation work,
and laboratory and field testing, which ultimately enabled the site owner to meet the
requirements of the Power Purchase Agreement with MECO, the local grid operator.
While this Lana‘i project is separate from the SEGIS effort and has distinct differences, it did
provide an opportunity to provide concept checks on SEGIS and to work on high-penetration at
24
one end of the spectrum of grid-connected PV power: The PV site can not only supply up to
30% of the grid load during peak solar hours, but also 10% of the annual electrical energy
demand, which today is all produced from diesel fuel. The features incorporated into the Lana‘i
inverter controls, all of which proved quite relevant to the SEGIS program, are listed below. The
implementation of these features is discussed in later sections.
Remote-Controlled Real Power Control
Remote-Controlled Power Ramp Rate
Remote-Controlled Power Factor Adjustment - The inverter can be used to source VArs,
and, in the Lana‘i case, the PPA specifies a PF adjustment within the range of 0.95
leading to 0.95 lagging, in increments of 0.005, with a <0.5 second response time.
Ride-Through Capability
3.1.2 Task 2: Estimated Product Performance and Cost
An initial performance and cost estimate for the SEGIS concept and hardware was carried out in
Stage 1 and refined further in Stage 2. Details regarding the performance and cost estimates are
given later in the description of Task 10.
3.1.3 Task 3: Identify Perceived and Actual Barriers and Mitigation Plans
In Stage 1, the team worked closely to identify key technical barriers to the integration of new
components and software implementation of new technology features in the preliminary inverter
design. The following barriers were identified:
1. Intermittency of PV Production
A common concern with renewable energy power plants is the effect of weather on power
production. For systems with natural resource storage, such as hydro, this concern is for time
scales of weeks and months. For wind and PV, the concerns and effects are for much shorter
time frames due to intermittent disturbances. While it is possible to forecast weather with
reasonable accuracy and so predict average power production across a region quite accurately,
the effects of gusts, squalls, clouds and the like can cause sudden disturbances in wind and PV
production from a single power plant. For solar PV interconnected at the distribution feeder
level, this could have a sudden and significant effect on power supply and quality within the
feeder. Addressing the disturbances in solar energy input to ensure that the grid is not unduly
disturbed and power quality maintained is a key element of the technical challenge to the large
scale grid integration of solar PV.
Mitigation Plan
PV plant ramp rate control can be achieved in a number of ways, some of which the FSEC team
studied with a view to implementation in Stages 2 and 3. Ramp-up is an easy task as the inverter
can be used to smoothly ramp up power production within the known projection of the DC array
capacity, which is determined from a V-I lookup table maintained by the MPPT algorithm.
Smooth ramp-down of power production can be achieved in three distinct ways. The first is to
anticipate the disturbance and its effects, and so ramp down in advance of the disturbance, a
technique that requires active measurement up-wind of the PV array. A second technique is to
25
operate the PV plant below capacity, and so provide dynamic range, which is a commonly used
approach in European Wind systems, but has direct economic consequences from lost power
production. Only applying this reserve power scheme in cloudy conditions can minimize the
economic impacts. The final technique is to use some amount of energy storage to supply the
energy during ramp-down of the PV plant.
2. Lack of Utility Control
Today‘s traditional inverter operates in an autonomous fashion, supplying power while
monitoring the voltage and frequency at the point of common coupling to check for disturbances.
At higher levels of penetration, this represents a lot of generation that cannot be controlled by the
utility. Control has two important meanings in this case—both the ability of utilities to remotely
shut down DERs when required and the ability for utilities to exercise the advanced power
management functions of the Grid-Smart inverter, either individually or as an aggregate (e.g., per
feeder).
Mitigation Plan
A critical part of this project lay in first demonstrating utility control of an inverter through a
SCADA system. Another important aspect was to then promulgate the full range of benefits of
this control to industry. In addition to control through SCADA, the PSAI-based anti-islanding
approach also provides an effective way to remotely shut down inverters during times of
overproduction or during switching operations.
3. Cost of Utility Scale PV
The utility is clearly the ultimate and (from a cost/price perspective) the toughest customer in the
power business. The Federal Energy Regulatory Commission mandates have driven local
Renewable Portfolio Standards (RPS) in many States (29 States + District of Columbia), which
on average are driving toward a goal of 1% of total energy supplied through new renewable
energy resources being added per year [8]. While PV is a natural distributed resource, and easily
deployed and aggregated in urban environments, it is relatively expensive when compared to
some other renewable resources, particularly wind. In recent years the typical customers for large
PV systems have been large consumers of electricity, where the target cost is the competing
retail electricity rate, and the energy was sold through Power Purchase Agreements (PPAs).
While this model does displace non-renewable power generation, it does not integrate well with
the operation and the economics of the overall grid. The FSEC team‘s goal for SEGIS is to help
achieve large scale utility adoption of PV, and a key component of this is cost.
Roughly speaking the cost of utility scale solar PV projects in 2008 was $5/watt which, assuming
a 5% rate of return, a 20 year plant life (fully recovered capital), and a capacity factor of 25%,
equates to approximately 4¢/kWh/(price/watt), or a LCOE of 20¢/kWh for completely
unsubsidized solar PV. This is considerably higher than the wholesale power rate in many parts
of the country, and is even higher than the sum of the wholesale power rate and the value of a
Renewable Energy Credit (typically 6¢ and 6¢ per kWhr respectively). Obviously, subsidies and
tax incentives can dramatically lower the LCOE from this nominal 20¢/kWh number, so that a
power producer paying an effective rate of $2/watt to install solar PV based on a state subsidy of
$2/watt and a 3 year investment tax credit, would incur as the effective cost of the solar
electricity 8¢/kWh.
26
Looking beyond mandates and subsidies, there are several major developments that portend a
dramatic drop in installed PV costs. After many years of shortage, world PV grade polysilicon
supplies are increasing dramatically, major thin film technologies are finally coming to market,
and total PV module supply exceeds demand. The recent results of these forces include a multi-
MW utility project with installed costs of $3.60/watt and high-volume panel pricing falling by
20% ($2.70/W down to $2.20/W). Large scale utility adoption will drive the scale and the
economies of the industry further. A final issue to consider around economics is the real or
perceived added value of large PV systems. Added value was a goal of the SEGIS projects, and
FSEC and its team focused on the added value as well as costs.
Mitigation Plan
The concept of utility ancillary services being provided by distributed PV plants is not new, but
is often misunderstood. Several UDAC members compared the VAr capability of PV plants to
those provided by switched VAr capacitor networks. PV inverters can provide dynamic VArs,
leading or lagging, to the grid, and often near the actual loads, which is quite powerful and
clearly has a value by reducing distribution losses.
4. IEEE Std. 1547
IEEE Std. 1547 requires that all customer-sited DG incorporate a means to detect loss of utility
power to ensure that inverters do not feed utility faults of open or downed utility lines. Also,
IEEE Std. 1547 specifies that DG should trip off line if the RMS voltage at the inverter‘s
terminals is 10% above or 12% below the nominal value for more than two seconds, or if the
frequency is not between 59.3 Hz and 60.5 Hz.
The mandatory inverter disconnect from the grid requirement as part of IEEE Std. 1547 will
likely be the source of grid instability as PV capacity grows. With higher penetrations of PV,
utilities will value allowing PV and other inverter-based DG to ride through voltage sags or
frequency disturbances. This is not possible with the stringent under/over voltage and under/over
frequency tripping of PV inverters used today or with the present active anti-islanding
requirements. These restrictive voltage or frequency trips can cause distributed PV to disconnect
at a time when their continued operation would provide high value generation to the host utility.
Thus, using stringent OV/UV and OF/UF settings to improve the detection of and response to
line faults and loss of grid connectivity has limited the ability of PV to provide high value to the
grid. Similarly, the active anti-islanding requirements are an impediment to DG based
microgrids.
Mitigation Plan
Today‘s grid interconnection standards are not compatible with the voltage regulation or
frequency-support functions. The modifications of the existing interconnection standards would
allow PV inverters to provide grid support—voltage regulation functions, implemented through
reactive power control, and would enable inverter-based DGs to be much more beneficial to the
grid than is currently possible. Unfortunately, this function would interfere with most anti-
islanding schemes as they are presently implemented.
27
There is a need for evaluation and testing of alternative loss-of-connectivity detection methods.
These alternative methods should not use destabilizing positive feedback, but rather facilitate the
implementation of grid support functions, without losing islanding detection effectiveness for
any combination of local loads, distributed generators, or system configurations. Potential
solutions to this problem include use of permissive signal anti-islanding (PSAI). PSAI has a
number of significant advantages for this application. If the PSAI signal meets certain criteria,
such as having a continuous carrier, then loss-of-connectivity, other general faults, and islanding
detection could all be achieved through the use of the PSAI signal as a continuity test of the line.
All that would be required would be to test for the presence or absence of the PSAI signal; its
presence indicates that the utility is still there, and vice-versa. The inverter would thus ―know‖
when it was islanding and could react appropriately, and active anti-islanding techniques would
be unnecessary. Voltage and frequency trip settings could be widened to better accommodate
utility transients and provide better ride-through, or even adjusted dynamically depending on
whether the inverter was in grid-tied or isolated operational mode. It would be valuable to
replace current active anti-islanding schemes with alternatives that facilitate the implementation
of grid support functions in inverters. This combination of concerns is addressed by the PSAI
strategy proposed by the FSEC team, a strategy that was presented at multiple technical
conferences [5-6].
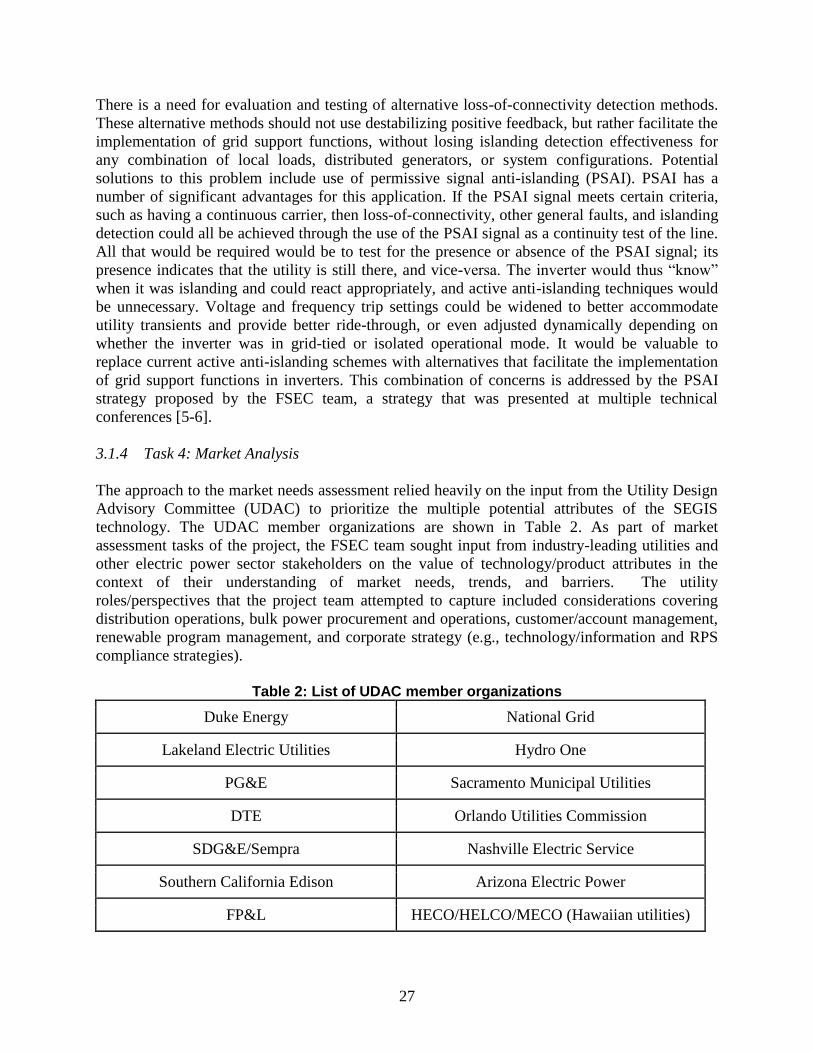
3.1.4 Task 4: Market Analysis
The approach to the market needs assessment relied heavily on the input from the Utility Design
Advisory Committee (UDAC) to prioritize the multiple potential attributes of the SEGIS
technology. The UDAC member organizations are shown in Table 2. As part of market
assessment tasks of the project, the FSEC team sought input from industry-leading utilities and
other electric power sector stakeholders on the value of technology/product attributes in the
context of their understanding of market needs, trends, and barriers. The utility
roles/perspectives that the project team attempted to capture included considerations covering
distribution operations, bulk power procurement and operations, customer/account management,
renewable program management, and corporate strategy (e.g., technology/information and RPS
compliance strategies).
Table 2: List of UDAC member organizations
Duke Energy National Grid
Lakeland Electric Utilities Hydro One
PG&E Sacramento Municipal Utilities
DTE Orlando Utilities Commission
SDG&E/Sempra Nashville Electric Service
Southern California Edison Arizona Electric Power
FP&L HECO/HELCO/MECO (Hawaiian utilities)
28
The suite of technologies embedded in the SEGIS program involve advanced inverters, controls,
communications systems, and, when required, energy storage [4]. The objectives of the market
research task performed by the FSEC team were to:
● Understand interests and respective drivers for utility-controlled large scale PV systems.
● Identify the SEGIS product attributes and functionality that are most relevant and valued
to potential utility customers.
● Gain insights into understanding of the current and expected technologies that allow for
utility control of PV systems.
● Discover expectations from utilities from the advanced SEGIS system.
● Gauge interest on the part of utilities to participate in continued product definition,
development, and testing of SEGIS technology.
The market analysis completed under Stage 1 of the project confirmed the need and value of the
advanced SEGIS attributes in a market expected to experience high growth of utility scale PV.
The Stage 1 findings identified key issues, functional requirements, and technical issues/risks to
be addressed. The functional requirements identified in the market analysis are specified in the
description of Task 7.1.
3.1.5 Task 5: Revise Stage 2 and 3 Plans Based on Stage 1 Investigation
By the end of Stage 1, there were planned changes to the Stage 2 Work Plan, which included the
following:
1. Originally, the plan was to use Hunt Technologies for the permissive power line carrier
communication signal for the anti-islanding function. Upon further review of the equipment
choices, FSEC and SatCon decided Cooper Power Systems (Energy Automation Systems
Division) was a better choice. At this point, the plan for Stage 2 was that the Cooper PSAI
system would be integrated and tested as part of the FSEC Team project. Later in Stage 3,
however, the FSEC Team ultimately went with DX3 Enterprises as the PSAI system provider,
which was used for the final demonstration testing in Lakeland at the end of Stage 3.
2. It had been anticipated that bench testing for the small prototype inverters (30-50 kVA)
developed in Stage 2 would be conducted at FSEC and the University of Central Florida‘s
Florida Power Electronics Center test facilities. Instead, all Stage 2 equipment staging and
testing was moved to Satcon‘s in-house Electronics Laboratory, which would allow Satcon
personnel to fabricate breadboards, and test, debug, and modify digital and analog electronics,
ranging from instrument signal conditioning to high power switching-amplifiers and inverters.
Laboratory instrumentation at this facility includes high-bandwidth analog and digital
oscilloscopes, programmable power supplies up to 300 kW dc, multiple-frequency function
generators, a circuit prototyping facility, high-bandwidth power amplifiers, precision voltmeters,
high-bandwidth current probes, an automatic impedance bridge, and three computer-aided
spectrum analyzers used for control loop and structural analysis. The microgrid section of the
Laboratory features a 3-phase programmable 100kW grid with variable voltage and frequency.
The specialized measurement instrumentation permits detailed component and system level
testing to assure design adequacy, and is recognized as a UL 1741 [9]certification site.
29
3. In the shared inverter concept development during Stage 1, Satcon concluded that cost and
efficiency targets needed to make DC-DC converters associated with each individual PV module
were difficult to meet. The shared inverter would interface the DC bus to the grid AC bus, and
could accept input from multiple PV arrays. Other generators and storage units would feed onto a
common DC bus, and DC loads could potentially draw from that same bus. This DC-coupled
interface could also be used at the module level to individually track the maximum power points
of PV modules, using on-board DC-DC converters. Such DC-DC converters could be
considerably less expensive and potentially more reliable than micro-inverters because they
would require much smaller filter capacitors and would have a much greater degree of cross-
applicability than micro-inverters. Satcon conducted trade-off studies for the panel-mounted or
string-level DC-DC converters, considering them from the individual module level up to the
multiple parallel string level, and concluded that the complexity of communications and control
out-weighed the benefits of the module-level converter. String or sub-string control, on the other
hand, reduces that complexity but still offers the benefits of making string operating parameters
available to the system operator, improved overall PV array efficiency, and upgraded inverter
throughput rating. Accordingly, in Stage 2, the attention shifted to making the DC-DC
conversion at the string or sub-string level instead of at the module level.
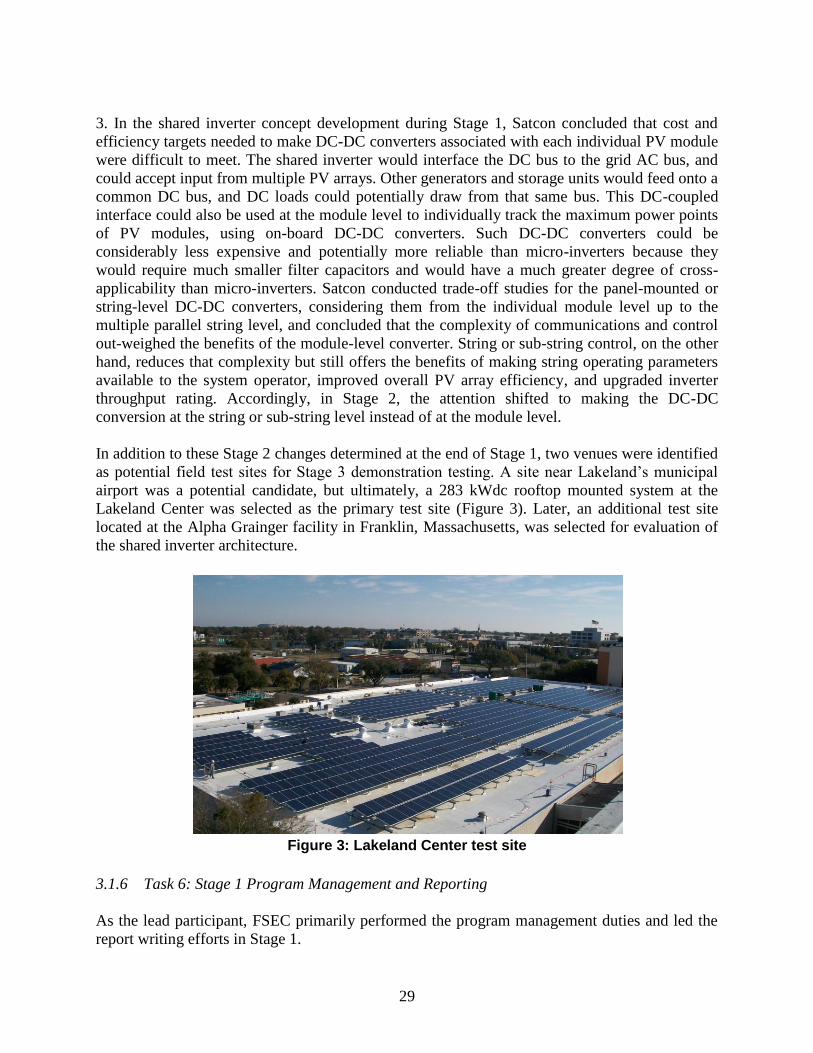
In addition to these Stage 2 changes determined at the end of Stage 1, two venues were identified
as potential field test sites for Stage 3 demonstration testing. A site near Lakeland‘s municipal
airport was a potential candidate, but ultimately, a 283 kWdc rooftop mounted system at the
Lakeland Center was selected as the primary test site (Figure 3). Later, an additional test site
located at the Alpha Grainger facility in Franklin, Massachusetts, was selected for evaluation of
the shared inverter architecture.
Figure 3: Lakeland Center test site
3.1.6 Task 6: Stage 1 Program Management and Reporting
As the lead participant, FSEC primarily performed the program management duties and led the
report writing efforts in Stage 1.
30
3.2 Stage 2: Prototype Development
3.2.1 Task 7: Comprehensive Design Development
At the beginning of Stage 2, a comprehensive engineering review of the preliminary GSI design
was carried out. In addition, a list of functional requirements was finalized, as described below,
and computer simulations at the inverter- and system-level were carried out to provide a rapid
prototyping environment and ―weed out‖ unnecessary experiments for the prototype evaluation.
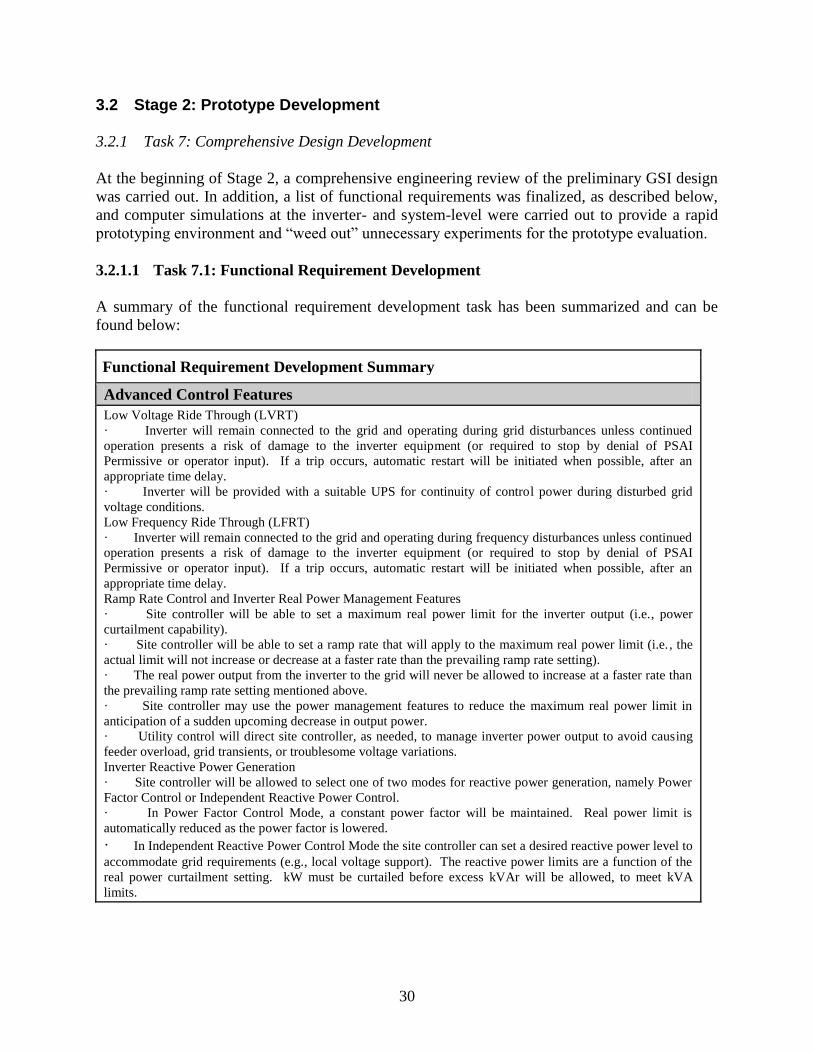
3.2.1.1 Task 7.1: Functional Requirement Development
A summary of the functional requirement development task has been summarized and can be
found below:
Functional Requirement Development Summary
Advanced Control Features
Low Voltage Ride Through (LVRT) · Inverter will remain connected to the grid and operating during grid disturbances unless continued
operation presents a risk of damage to the inverter equipment (or required to stop by denial of PSAI
Permissive or operator input). If a trip occurs, automatic restart will be initiated when possible, after an
appropriate time delay.
· Inverter will be provided with a suitable UPS for continuity of control power during disturbed grid
voltage conditions.
Low Frequency Ride Through (LFRT)
· Inverter will remain connected to the grid and operating during frequency disturbances unless continued
operation presents a risk of damage to the inverter equipment (or required to stop by denial of PSAI
Permissive or operator input). If a trip occurs, automatic restart will be initiated when possible, after an
appropriate time delay.
Ramp Rate Control and Inverter Real Power Management Features
· Site controller will be able to set a maximum real power limit for the inverter output (i.e., power
curtailment capability).
· Site controller will be able to set a ramp rate that will apply to the maximum real power limit (i.e., the
actual limit will not increase or decrease at a faster rate than the prevailing ramp rate setting).
· The real power output from the inverter to the grid will never be allowed to increase at a faster rate than
the prevailing ramp rate setting mentioned above.
· Site controller may use the power management features to reduce the maximum real power limit in
anticipation of a sudden upcoming decrease in output power.
· Utility control will direct site controller, as needed, to manage inverter power output to avoid causing
feeder overload, grid transients, or troublesome voltage variations.
Inverter Reactive Power Generation
· Site controller will be allowed to select one of two modes for reactive power generation, namely Power
Factor Control or Independent Reactive Power Control.
· In Power Factor Control Mode, a constant power factor will be maintained. Real power limit is
automatically reduced as the power factor is lowered.
· In Independent Reactive Power Control Mode the site controller can set a desired reactive power level to
accommodate grid requirements (e.g., local voltage support). The reactive power limits are a function of the
real power curtailment setting. kW must be curtailed before excess kVAr will be allowed, to meet kVA
limits.
31
Site Controllers
SCADA system interface – custom to match utility SCADA system · Interface between utility and site controller will be agreed between utility and Satcon
· Receives control messages from control center
· Transmits operating parameters to control center
Controller core
· Interprets control message from utility; sends control messages to site inverters
· Manages/optimizes/coordinates real and reactive power generation by inverters within its purview
· Communicates with control centers (e.g. Building Management System) managing on-site load (e.g. to
shed or re-start non-critical load when necessary)
Inverter control interface
· Test system must include at least 2 inverters; testing must validate ability to connect with the maximum
number that might be required
Controller provides data via SCADA to enable control room display and control actions
· Displays important site variables
· Commands for
Normal shutdown
Remote E-Stop
Output power limit
Adjustable power ramp rates (increase/positive and decrease/negative)
Reactive power control
· Integrates into existing Control Room Hardware
Integrated UPS for the site controller
· Maintain control functionality in ride-through situation
PSAI Integration
· The permissive carrier signal should operate continuously and have low energy consumption.
· The carrier should propagate through the network with limited attenuation.
· Three unique frequencies should be utilized for each phase of the three-phase power system, so that
single phase events can be detected.
· The carrier should be non-reproducible locally.
· There should be an acceptable signal to noise ratio.
· To ensure limited impact on energy yield, an appropriate anti-islanding fallback scheme should be in
place. An AI transition sequence would therefore be required that would transition between a fully functional,
ride-through enabled mode of operation that is made possible through PSAI and a limited functionality mode
of operation using traditional anti-islanding methods (local AI).
· Both the transmitter and receivers must perform reliably for long periods of time with minimal
maintenance.
· While transmitter cost can be amortized over the many distributed resources installed on that local utility
network, receiver cost must be very low to ensure there is limited increase in the levelized cost of energy
(LCOE) for the PV system.
Shared Inverters
· Single inverter able to aggregate output of multiple, different technology PV arrays · Shared inverter enabled by DC-DC converters, one for each array or string, each of which matches its
array or string characteristics
· Includes DC metering, DC safety/protections and contactors
32
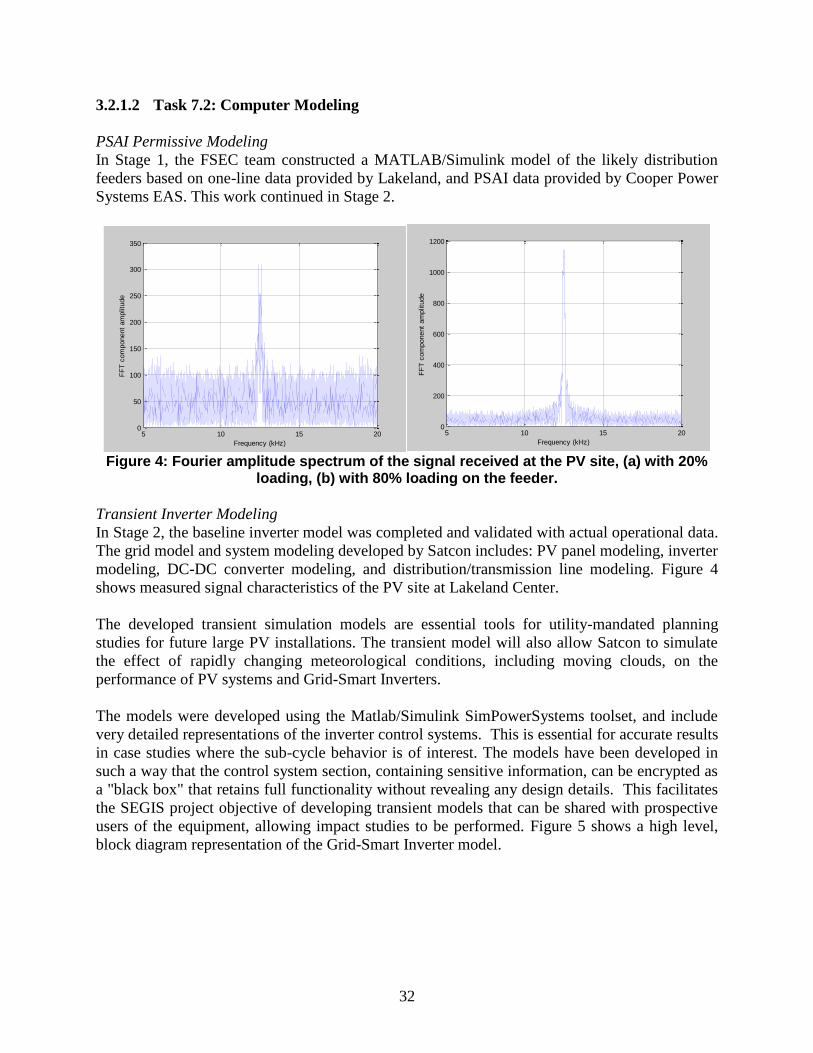
3.2.1.2 Task 7.2: Computer Modeling
PSAI Permissive Modeling
In Stage 1, the FSEC team constructed a MATLAB/Simulink model of the likely distribution
feeders based on one-line data provided by Lakeland, and PSAI data provided by Cooper Power
Systems EAS. This work continued in Stage 2.
Figure 4: Fourier amplitude spectrum of the signal received at the PV site, (a) with 20%
loading, (b) with 80% loading on the feeder.
Transient Inverter Modeling
In Stage 2, the baseline inverter model was completed and validated with actual operational data.
The grid model and system modeling developed by Satcon includes: PV panel modeling, inverter
modeling, DC-DC converter modeling, and distribution/transmission line modeling. Figure 4
shows measured signal characteristics of the PV site at Lakeland Center.
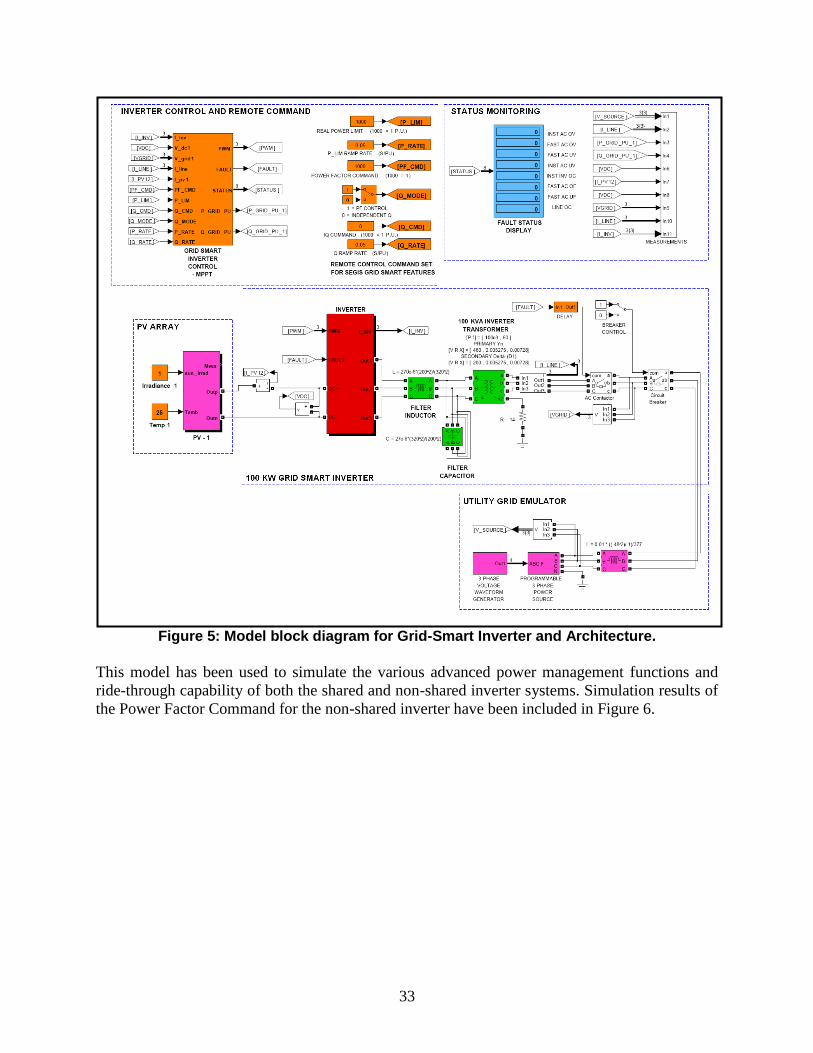
The developed transient simulation models are essential tools for utility-mandated planning
studies for future large PV installations. The transient model will also allow Satcon to simulate
the effect of rapidly changing meteorological conditions, including moving clouds, on the
performance of PV systems and Grid-Smart Inverters.
The models were developed using the Matlab/Simulink SimPowerSystems toolset, and include
very detailed representations of the inverter control systems. This is essential for accurate results
in case studies where the sub-cycle behavior is of interest. The models have been developed in
such a way that the control system section, containing sensitive information, can be encrypted as
a "black box" that retains full functionality without revealing any design details. This facilitates
the SEGIS project objective of developing transient models that can be shared with prospective
users of the equipment, allowing impact studies to be performed. Figure 5 shows a high level,
block diagram representation of the Grid-Smart Inverter model.
5 10 15 200
50
100
150
200
250
300
350
Frequency (kHz)
FF
T c
om
ponent
am
plit
ude
5 10 15 200
200
400
600
800
1000
1200
Frequency (kHz)
FF
T c
om
ponent
am
plit
ude
33
Figure 5: Model block diagram for Grid-Smart Inverter and Architecture.
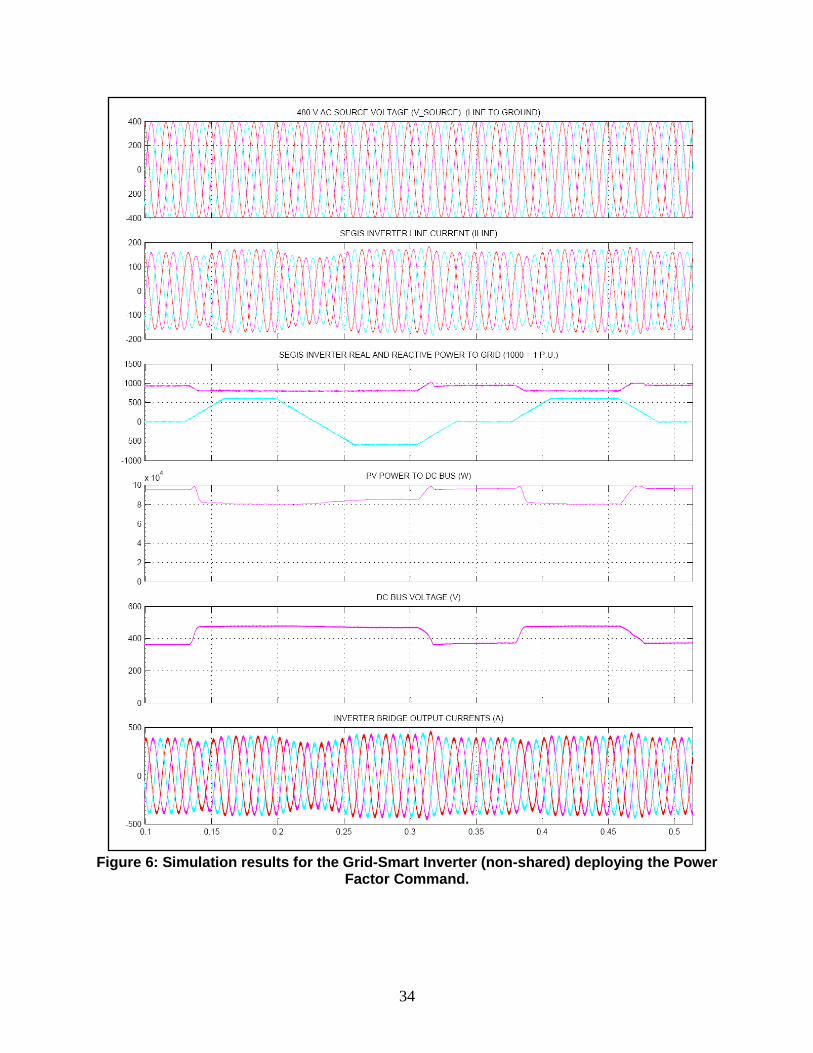
This model has been used to simulate the various advanced power management functions and
ride-through capability of both the shared and non-shared inverter systems. Simulation results of
the Power Factor Command for the non-shared inverter have been included in Figure 6.
34
Figure 6: Simulation results for the Grid-Smart Inverter (non-shared) deploying the Power
Factor Command.
35
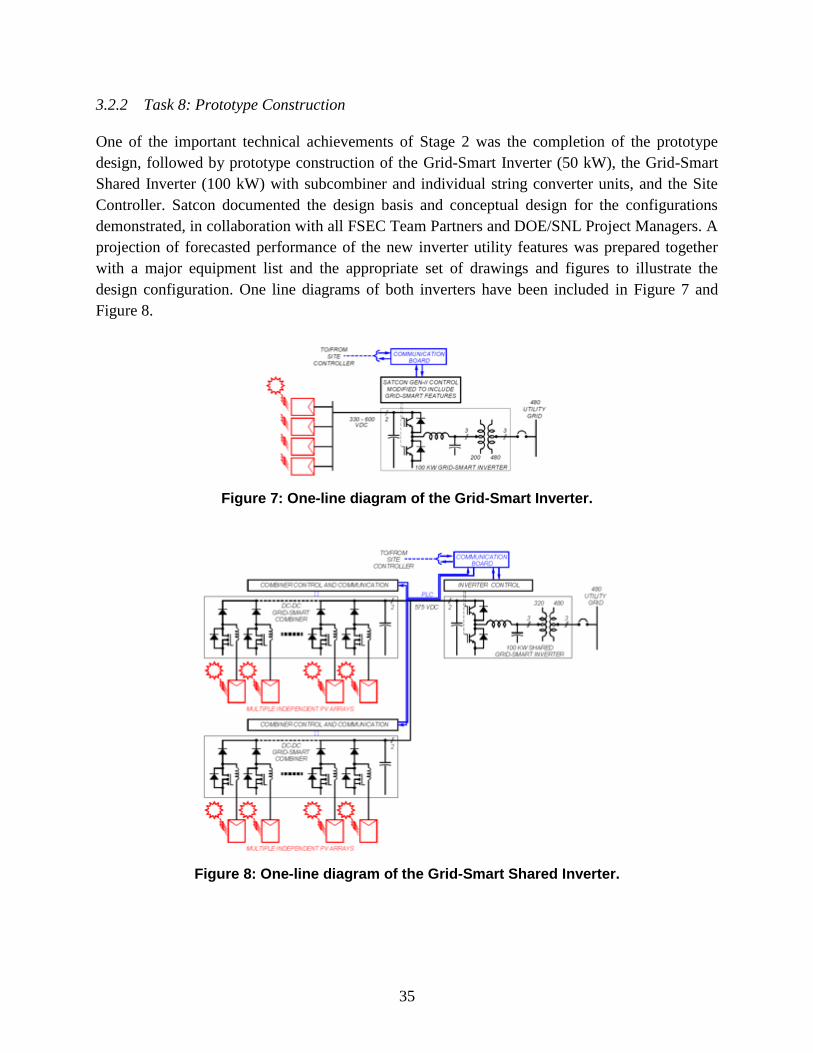
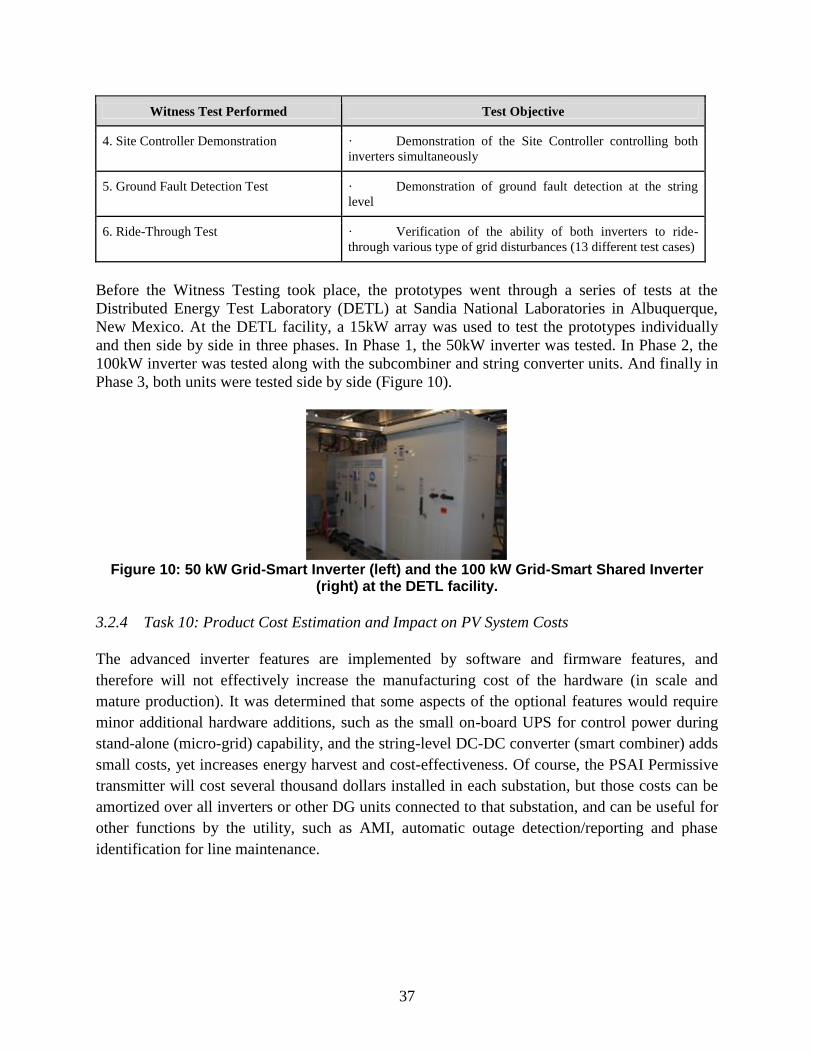
3.2.2 Task 8: Prototype Construction
One of the important technical achievements of Stage 2 was the completion of the prototype
design, followed by prototype construction of the Grid-Smart Inverter (50 kW), the Grid-Smart
Shared Inverter (100 kW) with subcombiner and individual string converter units, and the Site
Controller. Satcon documented the design basis and conceptual design for the configurations
demonstrated, in collaboration with all FSEC Team Partners and DOE/SNL Project Managers. A
projection of forecasted performance of the new inverter utility features was prepared together
with a major equipment list and the appropriate set of drawings and figures to illustrate the
design configuration. One line diagrams of both inverters have been included in Figure 7 and
Figure 8.
Figure 7: One-line diagram of the Grid-Smart Inverter.
Figure 8: One-line diagram of the Grid-Smart Shared Inverter.

36
The construction of the prototype units took place at the Satcon facility in Boston. Through the
course of Stage 2, these prototypes have undergone multiple iterations of design changes. For
example, the thermal management design for the subcombiner was improved, and several
improvements were made to the inverter control software. The image in Figure 9 shows the first-
generation subcombiner and the second-generation subcombiner featuring an improved thermal
management design.
Figure 9: Testing the first-generation Satcon Subcombiner (Left) and the 100 kW Grid-
Smart Shared Inverter (Right).
3.2.3 Task 9: Prototype Testing and Evaluation
The formal Witness Testing was conducted at the Satcon facility in Boston on April 13-16, 2010
and was attended by representatives from Sandia National Laboratories. A series of tests (Table
3 below) were performed on two different inverters, a Grid-Smart Inverter prototype (50kW unit)
and a Grid-Smart Shared Inverter prototype (100kW unit) with subcombiner and individual
string converter units (Figure 9). These tests included tests to verify communication from the
Site Controller to the inverters, tests to verify functionality of the advanced power management
features of the inverters, simulated fault testing on the individual string converter units, and ride-
through testing for both voltage and frequency disturbances. The test data has been made
available to the DOE/SNL Project Managers.
Table 3: Overview of tests performed during the Prototype Witness Testing exercise
Witness Test Performed Test Objective
1. Communications Test · Verification of accuracy of inverter Modbus data in ‗off‘
and ‗on‘ states · Demonstration of remote On/Off control of each inverter
2. Advanced Power Management Testing
of 50 kW Grid Smart Inverter · Verification of real power curtailment · Verification of power factor command
· Verification of reactive power command
· Verification of real power rate limit command
· Verification of reactive power rate limit command
3. Advanced Power Management Testing
of 100 kW Grid Smart Shared Inverter with
25 kW Subcombiner
· Verification of real power curtailment · Verification of power factor command
· Verification of reactive power command
· Verification of real power rate limit command
· Verification of reactive power rate limit command
37
Witness Test Performed Test Objective
4. Site Controller Demonstration · Demonstration of the Site Controller controlling both
inverters simultaneously
5. Ground Fault Detection Test · Demonstration of ground fault detection at the string
level
6. Ride-Through Test · Verification of the ability of both inverters to ride-
through various type of grid disturbances (13 different test cases)
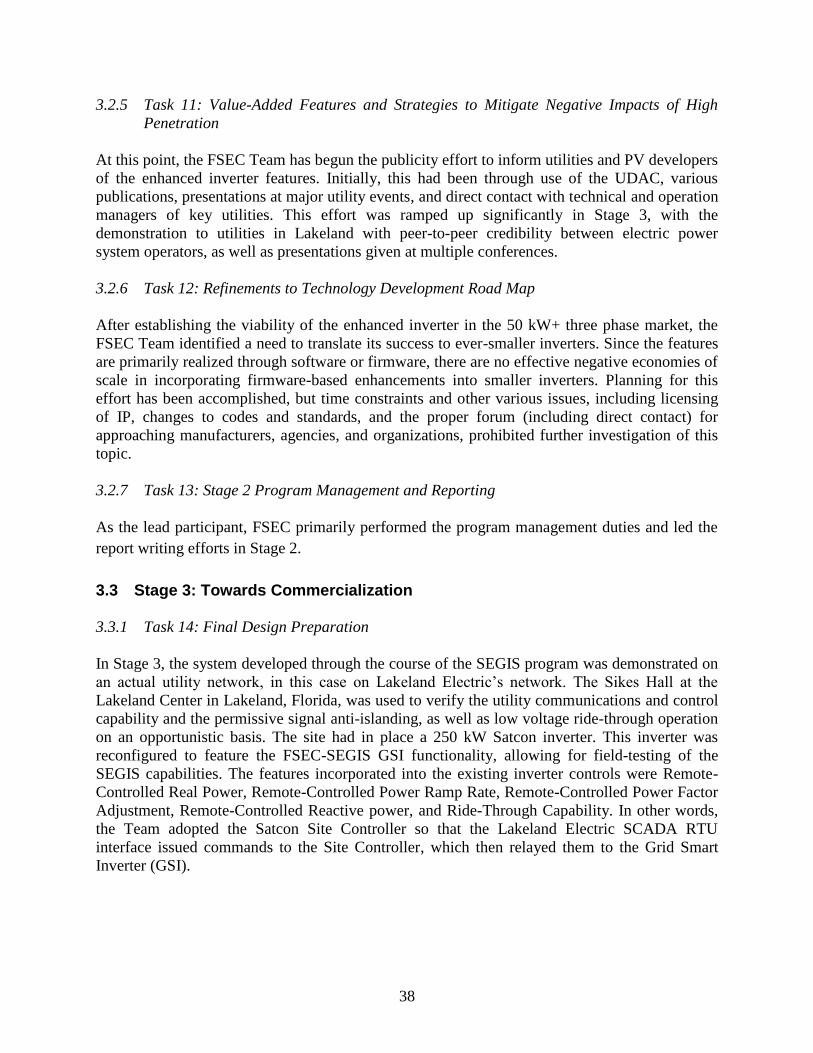
Before the Witness Testing took place, the prototypes went through a series of tests at the
Distributed Energy Test Laboratory (DETL) at Sandia National Laboratories in Albuquerque,
New Mexico. At the DETL facility, a 15kW array was used to test the prototypes individually
and then side by side in three phases. In Phase 1, the 50kW inverter was tested. In Phase 2, the
100kW inverter was tested along with the subcombiner and string converter units. And finally in
Phase 3, both units were tested side by side (Figure 10).
Figure 10: 50 kW Grid-Smart Inverter (left) and the 100 kW Grid-Smart Shared Inverter
(right) at the DETL facility.
3.2.4 Task 10: Product Cost Estimation and Impact on PV System Costs
The advanced inverter features are implemented by software and firmware features, and
therefore will not effectively increase the manufacturing cost of the hardware (in scale and
mature production). It was determined that some aspects of the optional features would require
minor additional hardware additions, such as the small on-board UPS for control power during
stand-alone (micro-grid) capability, and the string-level DC-DC converter (smart combiner) adds
small costs, yet increases energy harvest and cost-effectiveness. Of course, the PSAI Permissive
transmitter will cost several thousand dollars installed in each substation, but those costs can be
amortized over all inverters or other DG units connected to that substation, and can be useful for
other functions by the utility, such as AMI, automatic outage detection/reporting and phase
identification for line maintenance.
38
3.2.5 Task 11: Value-Added Features and Strategies to Mitigate Negative Impacts of High
Penetration
At this point, the FSEC Team has begun the publicity effort to inform utilities and PV developers
of the enhanced inverter features. Initially, this had been through use of the UDAC, various
publications, presentations at major utility events, and direct contact with technical and operation
managers of key utilities. This effort was ramped up significantly in Stage 3, with the
demonstration to utilities in Lakeland with peer-to-peer credibility between electric power
system operators, as well as presentations given at multiple conferences.
3.2.6 Task 12: Refinements to Technology Development Road Map
After establishing the viability of the enhanced inverter in the 50 kW+ three phase market, the
FSEC Team identified a need to translate its success to ever-smaller inverters. Since the features
are primarily realized through software or firmware, there are no effective negative economies of
scale in incorporating firmware-based enhancements into smaller inverters. Planning for this
effort has been accomplished, but time constraints and other various issues, including licensing
of IP, changes to codes and standards, and the proper forum (including direct contact) for
approaching manufacturers, agencies, and organizations, prohibited further investigation of this
topic.
3.2.7 Task 13: Stage 2 Program Management and Reporting
As the lead participant, FSEC primarily performed the program management duties and led the
report writing efforts in Stage 2.
3.3 Stage 3: Towards Commercialization
3.3.1 Task 14: Final Design Preparation
In Stage 3, the system developed through the course of the SEGIS program was demonstrated on
an actual utility network, in this case on Lakeland Electric‘s network. The Sikes Hall at the
Lakeland Center in Lakeland, Florida, was used to verify the utility communications and control
capability and the permissive signal anti-islanding, as well as low voltage ride-through operation
on an opportunistic basis. The site had in place a 250 kW Satcon inverter. This inverter was
reconfigured to feature the FSEC-SEGIS GSI functionality, allowing for field-testing of the
SEGIS capabilities. The features incorporated into the existing inverter controls were Remote-
Controlled Real Power, Remote-Controlled Power Ramp Rate, Remote-Controlled Power Factor
Adjustment, Remote-Controlled Reactive power, and Ride-Through Capability. In other words,
the Team adopted the Satcon Site Controller so that the Lakeland Electric SCADA RTU
interface issued commands to the Site Controller, which then relayed them to the Grid Smart
Inverter (GSI).
39
3.3.2 Task 15: Final Test Plan Preparation
The FSEC Team prepared a final test plan for the validation effort using the installed validation
site configuration. The Final Test Plan included details pertaining to validation of proper PSAI
signal transmission, propagation, and detection, and monitoring the critical electrical parameters
of the inverter, grid disturbances (e.g., high resolution digital fault recorders), and the resulting
inverter response. The Final Test Plan was constructed in a way to facilitate comparisons
between the experimental data collected at the field site and data from the models created in
Stages 1 and 2.
3.3.3 Task 16: Test Site Hardware and Software Installation/Integration
The work effort in this task included collecting performance data and recording inverter
electrical characteristics over time with a focus on data collected during the issuance of GSI
power management commands, as well as during potential low voltage ride-through scenarios. A
data recording system was designed to provide a fine-grained measure of the response seen on
the inverter output and record inverter response to system disturbances. Therefore, the Team
installed and programed a Bitronics M57x IEDs meter to provide real time values and store
multiple records consisting of fault records disturbance records. These registers were then sent to
SCADA via the Ethernet port. Additionally, the Team installed the ruggedized Gridsense
PowerMonic PM-45 unit, a 3φ power quality analyzer with logging capability, to collect data for
the advanced power management testing.
The Team also modified the existing Satcon inverter control algorithms, communications, and
control software, and customized the communications interface to meet the requirements of the
Lakeland Electric SCADA system in order to provide the control data and functionality to meet
the Lakeland Electric requirements.
With regard to the PSAI signal transmission and detection, a DX3 Anti-Islanding Signal
Generator in combination with a step-down transformer to a reduced voltage level for the single
generator operation were installed at the Palmetto Substation, which is the primary substation
feeding the Sikes Civic Center. A PSAI detector connected to the GSI was installed at the Civic
Center to validate of proper PSAI signal transmission and detection.
3.3.4 Task 17: Validation Testing
Stage 3 verification testing was designed around demonstrating in the field the capabilities that
have been developed in Stages 1 and 2. The core capabilities that were tested in Stage 3 include
the following:
1. Proper remote utility communications/control and advanced power management capabilities
of the Grid Smart Inverter Architecture (GSIA) using the Lakeland SCADA system
2. Ride-through operation during frequency and voltage disturbances
3. Proper operation of the PSAI as a means of anti-islanding
40
The testing procedures described in Section 4.3.2 validated the full range of FSEC-SEGIS GSI
functions including the results of control commands sent by the utility control center, except for
ride-through capability, which will only be recorded if a grid disturbance occurs (which could
likely occur for a low voltage situation, but probably not for a frequency disturbance).
3.3.5 Task 18: Commercialize the Grid-Smart Inverter Systems and Engender Industry
Acceptance of SEGIS Concepts
3.3.5.1 Task 18.1: Commercialization Efforts
The Team developed a commercialization plan, which detailed the important advantages
associated with the innovations created in Stage 1 and 2 of SEGIS, and attempted to engender
widespread industry acceptance of these innovations. The commercialization plan was based on
the strength of Satcon‘s experience with large scale PV systems with utility companies and
focused on the valuable features of the GSI system.
3.3.5.2 Task 18.2: Information Dissemination
The Team held a demonstration conference with more than 55 attendees from different
organizations across U.S. at the Lakeland Electric facilities on September 22, 2011. The Team
presented a real-time demonstration of the inverter control features developed under the DOE
SEGIS program by operators in the Lakeland Electric System Control Room system, including:
Direct utility control of Real & Reactive Power output and ramp rate
Ride-through of Voltage and Frequency disturbances
Utility-Permissive Anti-Island control through heart-beat signal
The Solstice® shared inverter architecture, bring enhanced production & installation
flexibility
VAr generation for grid or feeder voltage support or capacitor bank substitution (day or
night)
Advanced power management functions, including fast voltage regulation to mitigate
flicker
Bi-directional power flow allows DC energy storage for transient-to-long term real power
support
The Team also presented at the Solar Power International 2011 conference in Dallas, Texas, on
October 17. At this conference, the Team presented a summary of the three-year effort to
develop, validate and commercialize Grid-Smart Inverters for wider photovoltaic utilization,
particularly in the utility sector.
3.3.6 Task 19: Stage 3 Program Management and Reporting
As in Stages 1 and 2, FSEC primarily performed the program management duties and led the
report writing efforts in Stage 3.
41
4 Perceived Impacts for the Utility, Customer and PV Applications Future
4.1 Applications
FSEC-SEGIS inverters with smart functionality can play an active role in energy management,
system control of electricity grids, and grid support. FSEC-SEGIS Grid-smart inverter features
enable PV generation to act as ―hidden assets‖, providing ancillary services for the utility. With
enhanced communication and control capabilities, it allows the utility to regulate and monitor the
generation of real and reactive power, and ensure reliable disconnection when necessary. The
inverter low voltage ride-through capability ensures that the PV plant is present to help support
the system during and after voltage disturbances, enabling a swifter recovery from excursions
outside the traditional IEEE 1547 operating window. The Grid-smart inverter has the ability to
incorporate controlled energy storage in the inverter architecture, facilitating the use of evolving
storage technologies in mitigating the variability of PV power sources.
4.2 Value Added and Costs
This project was an important step toward the large-scale acceptance and deployment of PV
inverters with smart-functionality. The Team demonstrated that PV systems can act as much
more than merely an unpredictable negative load, with inverters becoming utility assets through
cost savings in investments for capacity expansions and voltage regulation equipment. The
project has increased the levels of DG that may be safely installed on utility feeders without
negatively impacting the existing protection and distribution infrastructure. Also, the
demonstrated inverter can significantly increase the share of PV generation in the electricity
grids due to its provision of ancillary services. The added value of FSEC-SEGIS Grid-smart
inverter (beyond energy production) includes mitigation of intermittencies and provision of
dispatchable renewables (Hybrid plants), control of real and reactive Power (dynamic), voltage
and frequency Ride-through, distribution backfeed capability, DG instrumentation and control
via SCADA, and voltage mode for grid recovery.
The advanced inverter features are implemented by software and firmware features, and
therefore will not effectively increase the manufacturing cost of the hardware in mature, high-
volume. It was determined that while some aspects of the optional features would require minor
cost increases and additional hardware, such as the small on-board UPS for control power during
stand-alone (micro-grid) capability and the string-level DC-DC converter (smart combiner),
these changes increase the overall system cost effectiveness. Of course, the PSAI Permissive
transmitter will cost several thousand dollars installed in each substation, but those costs can be
amortized over all inverters or other DG units connected to that substation, and can be useful for
other functions by the utility, such as AMI, automatic outage detection/reporting, and phase
identification for line maintenance.
42
4.3 U.S. Jobs
The near-term (through 2015) driver of new job growth based on Grid-Smart Inverters and
Architecture (GSIA) within Solar Energy Grid Integration Systems (SEGIS) will come from
limited increases in product sales and photovoltaic (PV) installations as GSIA removes the
market barriers of limited controllability and high intermittency common to utility-scale PV
installations. The project team estimates the near-term benefits will create approximately 1600
jobs through 2015 for Sun Edison and Satcon, directly supporting the manufacture, installation
and operation of Grid-Smart Inverters.
Of course, the greatest job growth will come in the longer term as GSIA technology accelerates
the PV utility-scale adoption rate by addressing the three primary barriers to utility acceptance of
large-scale grid integration of PV generation. Based on the market research done in Stage 1,
these barriers are:
1. fear of intermittency of the renewable supply;
2. fear of the inability to control the PV generation source in a way that fits into the existing
utility control structure, including islanding control and local VAr control; and
3. costs of PV power.
By eliminating or reducing these barriers and making PV a dispatchable resource, GSIA will be a
key component in the ability of all SEGIS technologies to accelerate PV adoption. Based upon
the results from IMS Research's recently released World Market for Photovoltaic Inverters 2011
(4th Edition) and its Q1 2011 PV Inverter Quarterly Market Tracker [10], Satcon has obtained
commanding positions within the North American and Asian markets, and has successfully
achieved significant growth in Europe. Satcon claims a 60 percent market share for large size
inverters (>100kW) in North America. According to the recent Solar Foundation™ report, solar
job growth over the next 12 months is anticipated to be almost 24%, representing approximately
24,000 additional new jobs [11]. Assuming all technologies supported in the SEGIS program are
successful, SEGIS has an estimated potential to increase PV capacity to as much as 3% of total
electricity supply over the next twenty years. The Energy Information Agency projects that PV
installations will grow as dispatchable PV replaces an increasing percentage of new peaking
capacity, up to 75% by 2030 [12]. The Solar Energy Industries Association estimates that
approximately 24.4 jobs are created for every 1 MW of PV installed per year [13]. While much
of the manufacturing work for PV modules and the balance-of-system (BOS) is done overseas,
the system integration, installation, and operation and maintenance (O&M) work will necessarily
add U.S. jobs, constituting 11.1 jobs / MW (including one (BOS) component job per MW for
Satcon, at 60% market share). Using the Energy Information Agency‘s high economic growth
estimate along with Solar Foundation™ report and assuming GSIA helps PV replace 75% of
peaking capacity, and with process efficiency improvements of 1% per year, the SEGIS-
augmented PV industry could provide more than 23,000 additional jobs and could add almost
350,000 job-years by 2030. Assuming that GSIA technology accounts for 60% of the high-
power, grid-tied inverter market share, GSIA could then be responsible for approximately 14,000
jobs and 218,000 job-years by 2030.
43
4.4 Long Term Standardizations
FSEC-SEGIS Grid-smart inverter features may be limited in their practical operation in the short
term due to the restrictions imposed by existing standards and practices that were designed with
low penetration levels in mind. The UL1741 / IEEE Std. 1547 documents today do not address
concerns for utility scale inverter-based DG connected to distribution systems. Main deficiencies
for larger commercial (non-utility-owned) installations include prohibition of autonomous local
voltage control, no provision for LVRT, multi-unit anti-islanding and short term (1 to 5 cycles)
performance, and failure to distinguish between inverter-based DG and conventional rotating
synchronous machine generators. A study can be used to accelerate the availability of smart
inverters in the marketplace and to develop industry practice and standard grid operation through
the application of smart inverters.

44
45
5 Conclusions
With support from the SEGIS partnerships, and cost-shared funding and technical assistance
from Sandia National Laboratories, the team believes the project goals have been met, and even
exceeded. The FSEC SEGIS team moved through conceptual designs, market analysis, prototype
development and characterization, and finally moved toward commercialization.
Early in the Stage 1 process for polling utilities, it became evident that the focus proposed was
directly responsive to the anxieties of utilities about high penetrations of PV. While there was
some early skepticism that the technologies could be modified and adapted to solve all concerns,
most doubts began to vanish by the later months of Stage 2, after the lab demonstrations
confirmed the robustness and flexibility of this architecture.
The successful demonstration conference held at Lakeland Electric on September 22, 2011,
exercised all of the SEGIS capabilities developed over the three years of work. Major successes
included the Grid Smart Inverter Architecture (GSIA), the Grid Smart Shared Inverter, a Smart
Subcombiner, and Permissive link communications. Functionality developed and demonstrated
included permissive-islanding, VAr control, ramp-rate control, power factor control, low voltage
ride through, low frequency ride through, and power management functions.
Without doubt, much work remains before extremely high levels of PV generation become
commonplace on utility distribution systems. But with a few exceptions as described below, this
work largely concerns ―soft issues‖ such as regulatory and legal considerations, policy,
standardization, codes, value assessment, and compensation. All are matters challenging and
critical to wide and routine deployment, but eminently solvable given the powerful economic
opportunities awaiting resolution. ―The Markets will answer‖ is a non-trivial assertion.
This said, there are certain technical improvements thought necessary to encourage the utility
industry with deployments over the 15-20% range. Areas where such work is needed include:
Storage control and integration of all characteristics, from the transient to long-time
domain
Sophisticated adaptive controls for aggregation and re-aggregation of PV resources
Advanced modeling and forecasting of PV resources, from the feeder level to all the
Control Areas
Adapting the operating and reliability strategies of the nationwide interconnected grid to
exploit the fast response of inverter-based generation
Advanced Permissive Signal Anti-Islanding technologies, including adaptive techniques
for self-identification of phase, feeder, and substation, while exploiting the low
bandwidth requirements for low-cost signal generators
Fortunately, government and industry are already moving on all these issues, as evidenced by the
projects of EPRI, IEEE, universities, and the national labs. Most important, NIST, DOE and
other agencies have been aggressively providing funding, such as the follow-on opportunity
designated SEGIS-AC (for SEGIS-Advanced Concepts). Work continues on components and
circuits that were developed during the three stages of the SEGIS contract.

46
47
6 References
[1] R. Messenger and J. Ventre, Photovoltaic Systems Engineering, 3rd ed. Boca Raton, FL:
CRC Press, 2010.
[2] J. Carrasco et al., ―Power-electronics systems for the grid-integration of renewable energy
sources: A survey‖, IEEE Trans. on Industrial Electronics, vol. 53, no. 4, 2006, p. 1002-
1016.
[3] L. Casey, S. Lasher, S. Rhoades, C. Schauder, and B. Semenov, ―A faster, smarter,
controllable, greener, distributed Grid - the keys to an advanced Grid that yields higher
power quality‖, Proc. of the 2010 IEEE CITRES, Waltham, MA, September 2010.
[4] Solar Energy Grid Integration Systems - "SEGIS": Concept Paper, Sandia National
Laboratories, Albuquerque, NM, October 2007.
[5] R. Reedy, K. Davis, D. Click, M. Ropp, and A. Shaffer, ―Power Line Carrier Permissive as
a Simple and Safe Method of Enabling Inverter Ride-Through Operation of Distributed
Grid-Tied Photovoltaic Systems‖, 2011 IEEE International Symposium on Power Line
Communications and Its Applications (ISPSAI), Udine, Italy, May 2011.
[6] M. Ropp, D. Joshi, R. Reedy, K. Davis, D. Click, A. Shaffer, ―New Field Results for Power
Line Carrier-Based Islanding Detection and an Updated Strengths and Weaknesses
Discussion‖, Proc. of the 37th IEEE Photovoltaic Specialists Conference, Seattle, WA, June
2011.
[7] Institute of Electrical and Electronics Engineers (IEEE), IEEE1547, Standard for
Interconnecting Distributed Resources with Electric Power Systems.
[8] Database of State Incentives for Renewables and Efficiency (DSIRE),
http://www.dsireusa.org/
[9] Underwriters Laboratory (UL), UL 1741, Standard for Inverters, Converters, Controllers
and Interconnection System Equipment for Use With Distributed Energy Resources.
[10] IMS Research, ―World Market for Photovoltaic Inverters‖, 2011.
[11] The Solar Foundation™ and BW Research Partnership, ―The National Solar Jobs Census
2011‖, October 2011.
[12] Energy Information Administration, ―International Energy Outlook - Solar Photovoltaic and
Solar Thermal Electric Technologies,‖ May 27, 2009.
[13] Kammen, Daniel, University of California – Berkeley, ―Testimony before the U.S. Senate
Hearing on Environment and Public Works,‖ Sept. 25 2007; and Navigant Consulting, Inc.,
―Economic Impacts of Extending Federal Solar Tax Credits,‖ Final Report, September 15,
2008. http://seia.org/galleries/pdf/Navigant%20Consulting%20Report%209.15.08.pdf.

48
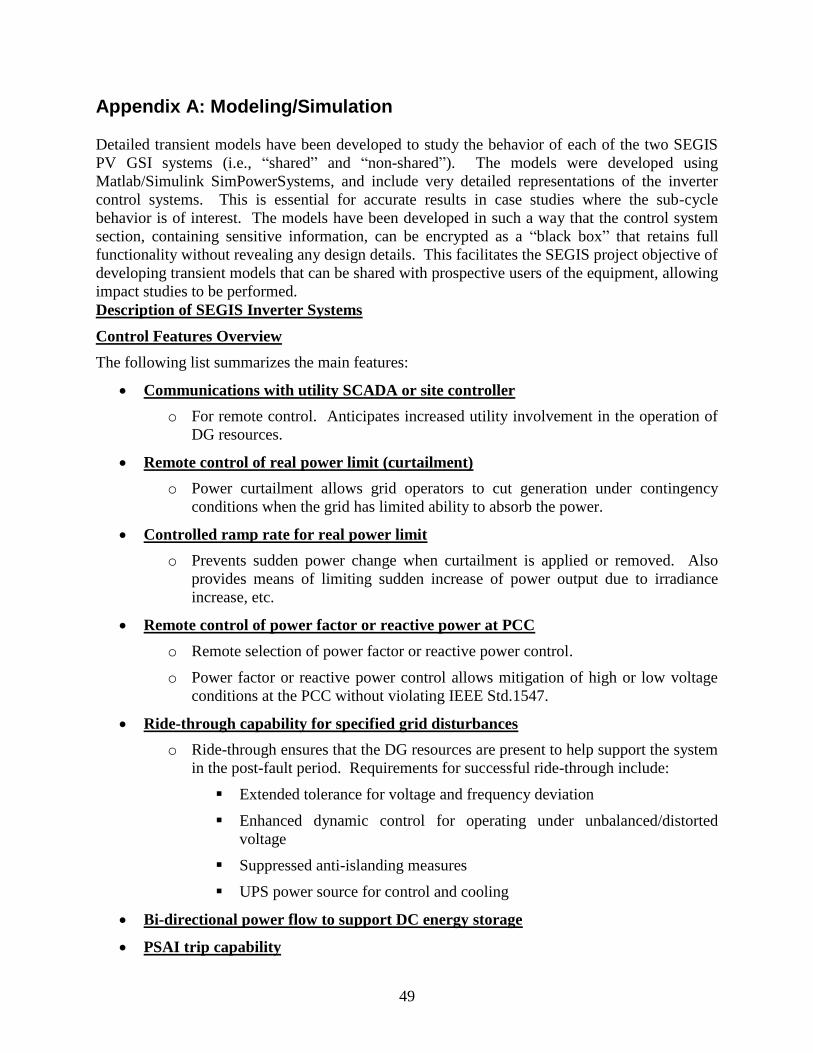
49
Appendix A: Modeling/Simulation
Detailed transient models have been developed to study the behavior of each of the two SEGIS
PV GSI systems (i.e., ―shared‖ and ―non-shared‖). The models were developed using
Matlab/Simulink SimPowerSystems, and include very detailed representations of the inverter
control systems. This is essential for accurate results in case studies where the sub-cycle
behavior is of interest. The models have been developed in such a way that the control system
section, containing sensitive information, can be encrypted as a ―black box‖ that retains full
functionality without revealing any design details. This facilitates the SEGIS project objective of
developing transient models that can be shared with prospective users of the equipment, allowing
impact studies to be performed.
Description of SEGIS Inverter Systems
Control Features Overview
The following list summarizes the main features:
Communications with utility SCADA or site controller
o For remote control. Anticipates increased utility involvement in the operation of
DG resources.
Remote control of real power limit (curtailment)
o Power curtailment allows grid operators to cut generation under contingency
conditions when the grid has limited ability to absorb the power.
Controlled ramp rate for real power limit
o Prevents sudden power change when curtailment is applied or removed. Also
provides means of limiting sudden increase of power output due to irradiance
increase, etc.
Remote control of power factor or reactive power at PCC
o Remote selection of power factor or reactive power control.
o Power factor or reactive power control allows mitigation of high or low voltage
conditions at the PCC without violating IEEE Std.1547.
Ride-through capability for specified grid disturbances
o Ride-through ensures that the DG resources are present to help support the system
in the post-fault period. Requirements for successful ride-through include:
Extended tolerance for voltage and frequency deviation
Enhanced dynamic control for operating under unbalanced/distorted
voltage
Suppressed anti-islanding measures
UPS power source for control and cooling
Bi-directional power flow to support DC energy storage
PSAI trip capability
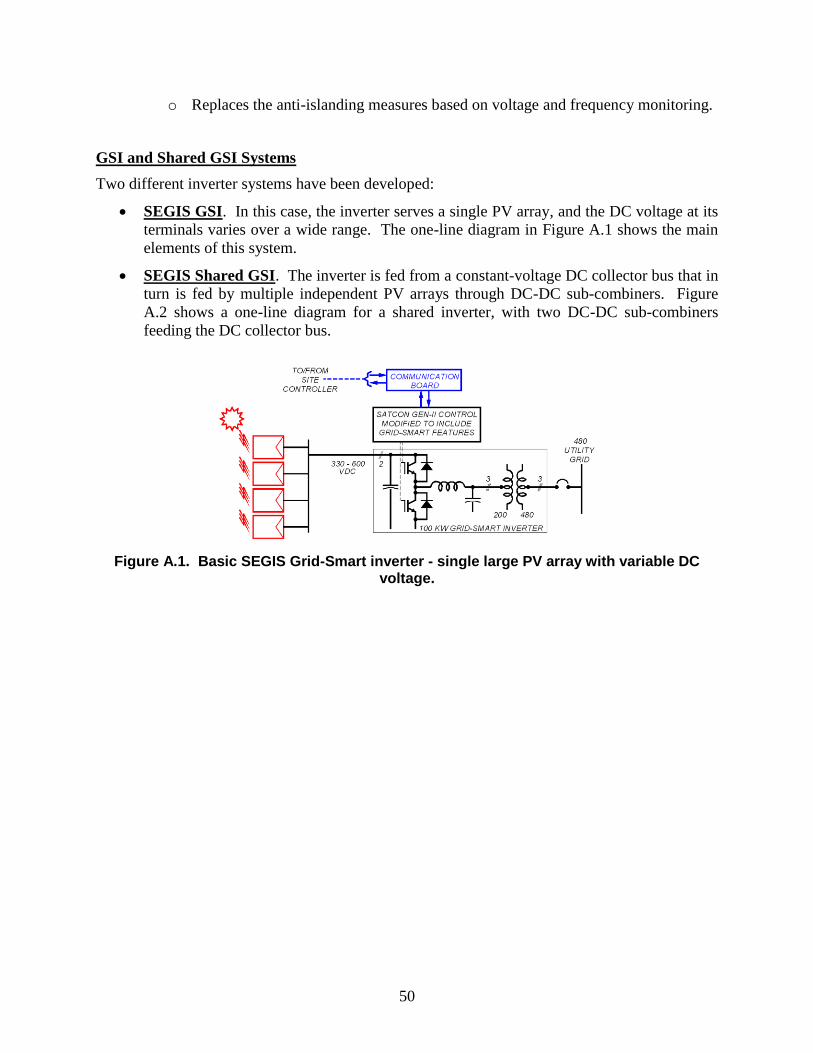
50
o Replaces the anti-islanding measures based on voltage and frequency monitoring.
GSI and Shared GSI Systems
Two different inverter systems have been developed:
SEGIS GSI. In this case, the inverter serves a single PV array, and the DC voltage at its
terminals varies over a wide range. The one-line diagram in Figure A.1 shows the main
elements of this system.
SEGIS Shared GSI. The inverter is fed from a constant-voltage DC collector bus that in
turn is fed by multiple independent PV arrays through DC-DC sub-combiners. Figure
A.2 shows a one-line diagram for a shared inverter, with two DC-DC sub-combiners
feeding the DC collector bus.
Figure A.1. Basic SEGIS Grid-Smart inverter - single large PV array with variable DC
voltage.
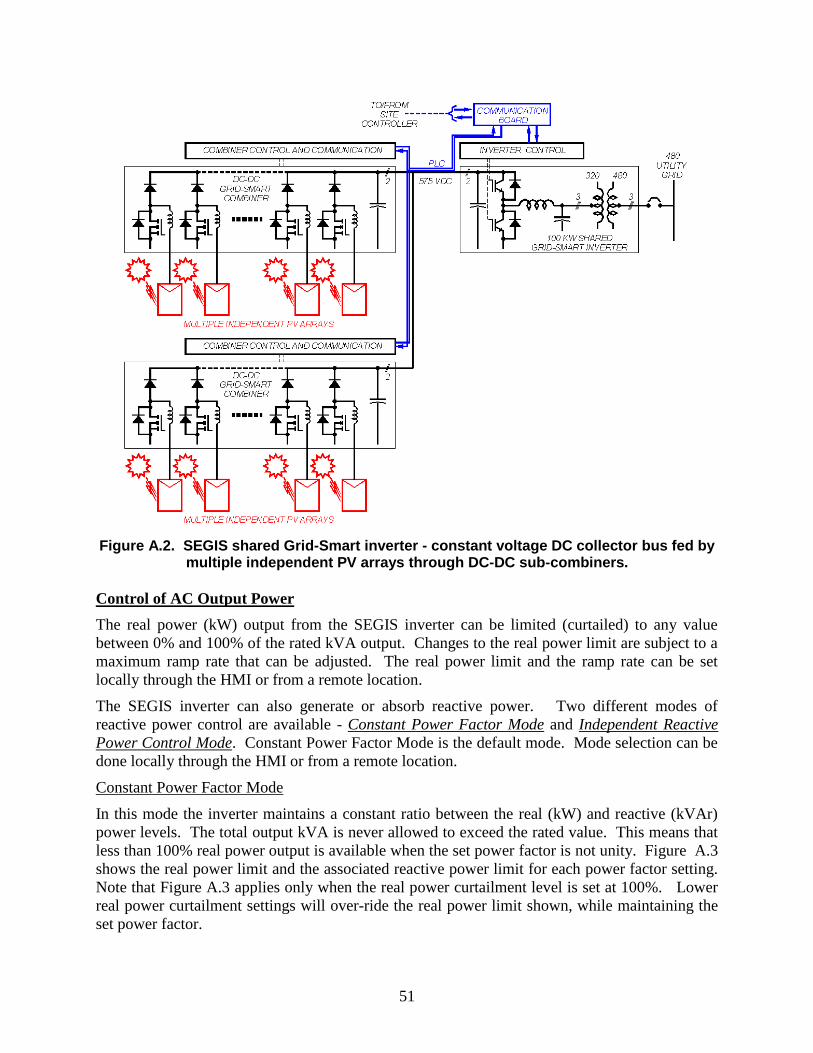
51
Figure A.2. SEGIS shared Grid-Smart inverter - constant voltage DC collector bus fed by
multiple independent PV arrays through DC-DC sub-combiners.
Control of AC Output Power
The real power (kW) output from the SEGIS inverter can be limited (curtailed) to any value
between 0% and 100% of the rated kVA output. Changes to the real power limit are subject to a
maximum ramp rate that can be adjusted. The real power limit and the ramp rate can be set
locally through the HMI or from a remote location.
The SEGIS inverter can also generate or absorb reactive power. Two different modes of
reactive power control are available - Constant Power Factor Mode and Independent Reactive
Power Control Mode. Constant Power Factor Mode is the default mode. Mode selection can be
done locally through the HMI or from a remote location.
Constant Power Factor Mode
In this mode the inverter maintains a constant ratio between the real (kW) and reactive (kVAr)
power levels. The total output kVA is never allowed to exceed the rated value. This means that
less than 100% real power output is available when the set power factor is not unity. Figure A.3
shows the real power limit and the associated reactive power limit for each power factor setting.
Note that Figure A.3 applies only when the real power curtailment level is set at 100%. Lower
real power curtailment settings will over-ride the real power limit shown, while maintaining the
set power factor.
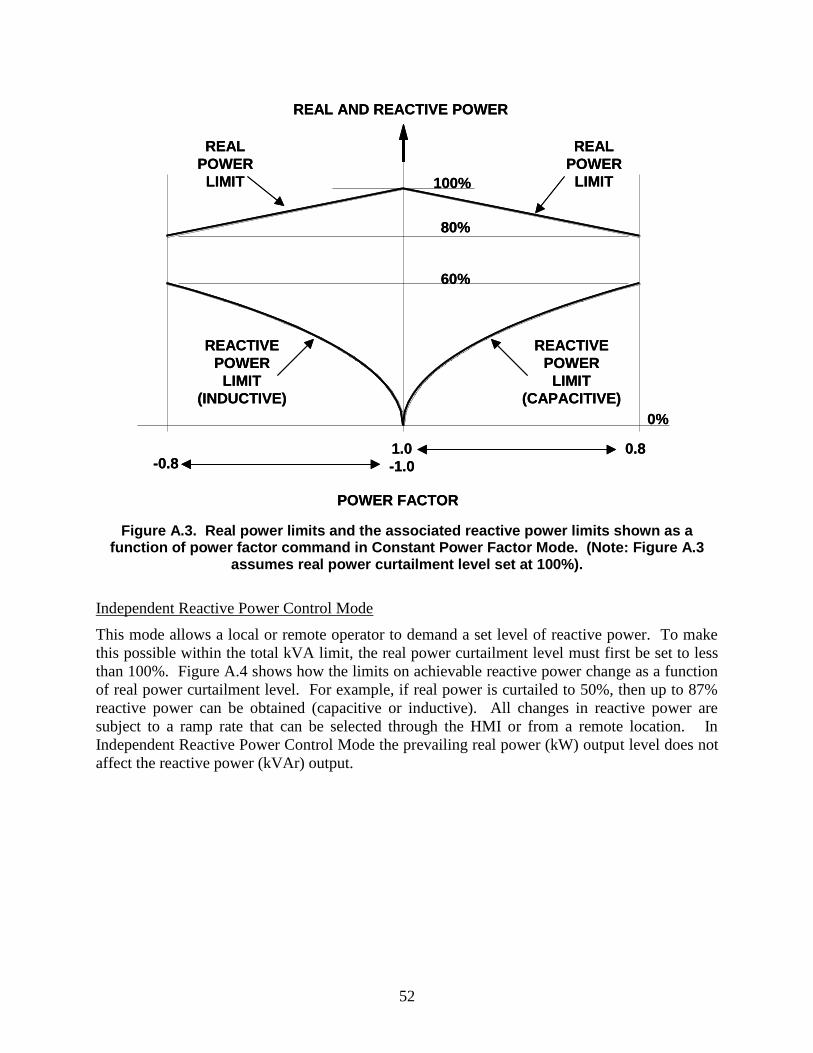
52
Figure A.3. Real power limits and the associated reactive power limits shown as a function of power factor command in Constant Power Factor Mode. (Note: Figure A.3
assumes real power curtailment level set at 100%).
Independent Reactive Power Control Mode
This mode allows a local or remote operator to demand a set level of reactive power. To make
this possible within the total kVA limit, the real power curtailment level must first be set to less
than 100%. Figure A.4 shows how the limits on achievable reactive power change as a function
of real power curtailment level. For example, if real power is curtailed to 50%, then up to 87%
reactive power can be obtained (capacitive or inductive). All changes in reactive power are
subject to a ramp rate that can be selected through the HMI or from a remote location. In
Independent Reactive Power Control Mode the prevailing real power (kW) output level does not
affect the reactive power (kVAr) output.
REAL AND REACTIVE POWER
100%
1.0
-1.0
POWER FACTOR
REACTIVE
POWER
LIMIT
(INDUCTIVE)
80%
60%
0%
0.8-0.8
REAL
POWER
LIMIT
REAL
POWER
LIMIT
REACTIVE
POWER
LIMIT
(CAPACITIVE)
REAL AND REACTIVE POWER
100%
1.0
-1.0
POWER FACTOR
REACTIVE
POWER
LIMIT
(INDUCTIVE)
80%
60%
0%
0.8-0.8
REAL
POWER
LIMIT
REAL
POWER
LIMIT
REACTIVE
POWER
LIMIT
(CAPACITIVE)
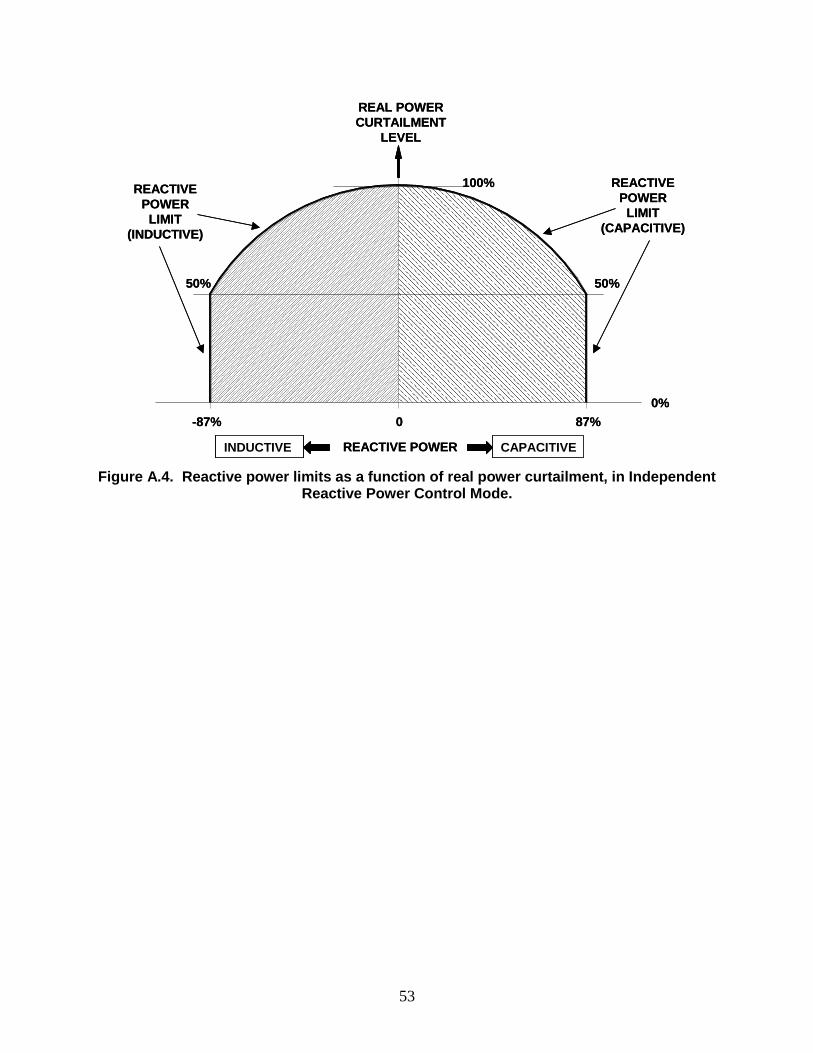
53
Figure A.4. Reactive power limits as a function of real power curtailment, in Independent Reactive Power Control Mode.
REAL POWER
CURTAILMENT
LEVEL
100%
87%-87% 0
0%
50%
INDUCTIVE CAPACITIVEREACTIVE POWER
REACTIVE
POWER
LIMIT
(CAPACITIVE)
REACTIVE
POWER
LIMIT
(INDUCTIVE)
50%
REAL POWER
CURTAILMENT
LEVEL
100%
87%-87% 0
0%
50%
INDUCTIVE CAPACITIVEREACTIVE POWER
REACTIVE
POWER
LIMIT
(CAPACITIVE)
REACTIVE
POWER
LIMIT
(INDUCTIVE)
50%
54
Simulink Model of SEGIS Grid Smart Inverter
Figure A.5 shows the top-level block diagram for the SEGIS Grid Smart inverter system model.
The following sub-systems are labeled in the diagram:
Inverter Control and Remote Command
o This sub-system contains the detailed model of the inverter controls that can be encrypted
as a "black box".
100 kW Grid Smart Inverter
o Standard IGBT bridge circuit with dc capacitor and LC three-phase output filter, feeding
grid interface transformer.
PV Array
o Detailed physics model of the PV array. Basically this is a photo-current source in parallel
with a conventional diode. The model includes series resistance and leakage, and is
responsive to inputs of irradiance and temperature.
Utility Grid Emulator
o For the purposes of testing the model system, this is set up as a basic Thevenin source
voltage behind a small series-connected source inductance.
Status Monitoring
o Display selected waveforms and latch time for various fault indicators.
Figure A.6 through Figure A.16 show the PV array characteristics, the block diagram and
recorded waveforms for tests of the non-shared Grid Smart inverter system: The waveforms
begin with the PV array model characteristics; block diagram for AC power management; and
then voltage, current, and power curves for various conditions.
Figure A.17 shows the model block diagram for the shared Grid Smart inverter system, followed
by corresponding PV array model characteristic (Figure A.18) and voltage, current, and power
curves (Figure A.19 and Figure A.20).
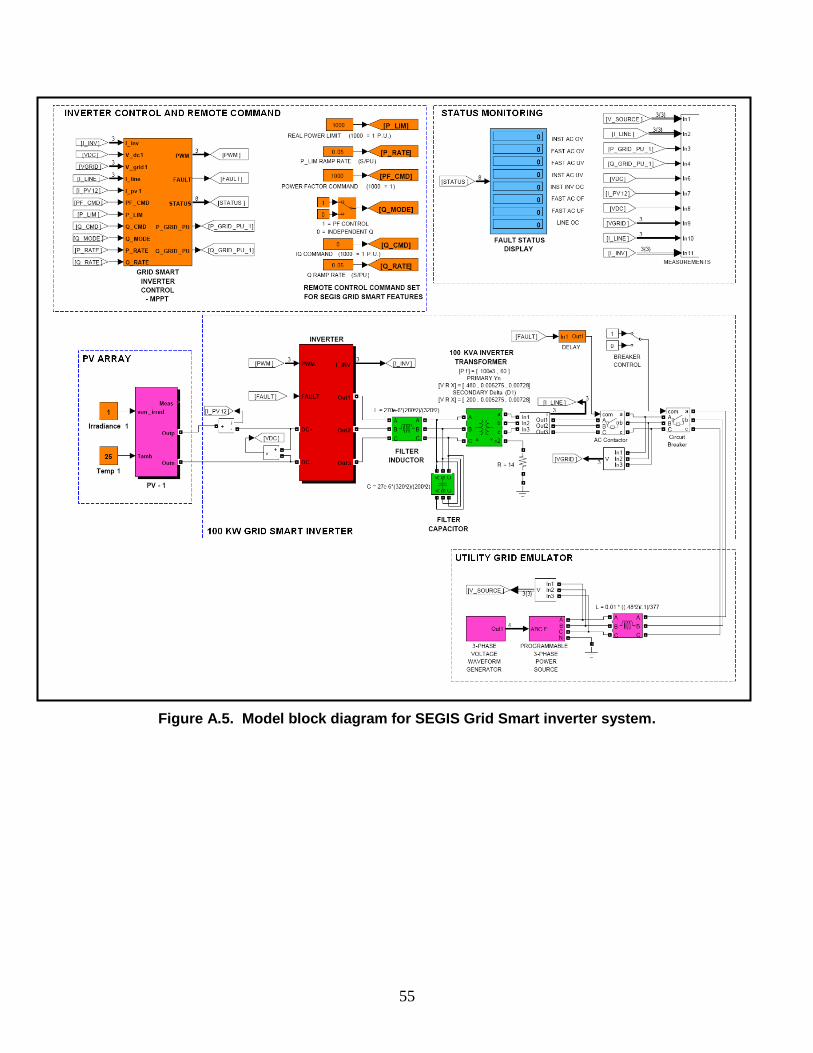
55
Figure A.5. Model block diagram for SEGIS Grid Smart inverter system.

56
Figure A.6. PV array model characteristics used for SEGIS Grid Smart inverter system model. Solyndra SL-001-157 panel; 6 in series; 105 in parallel.
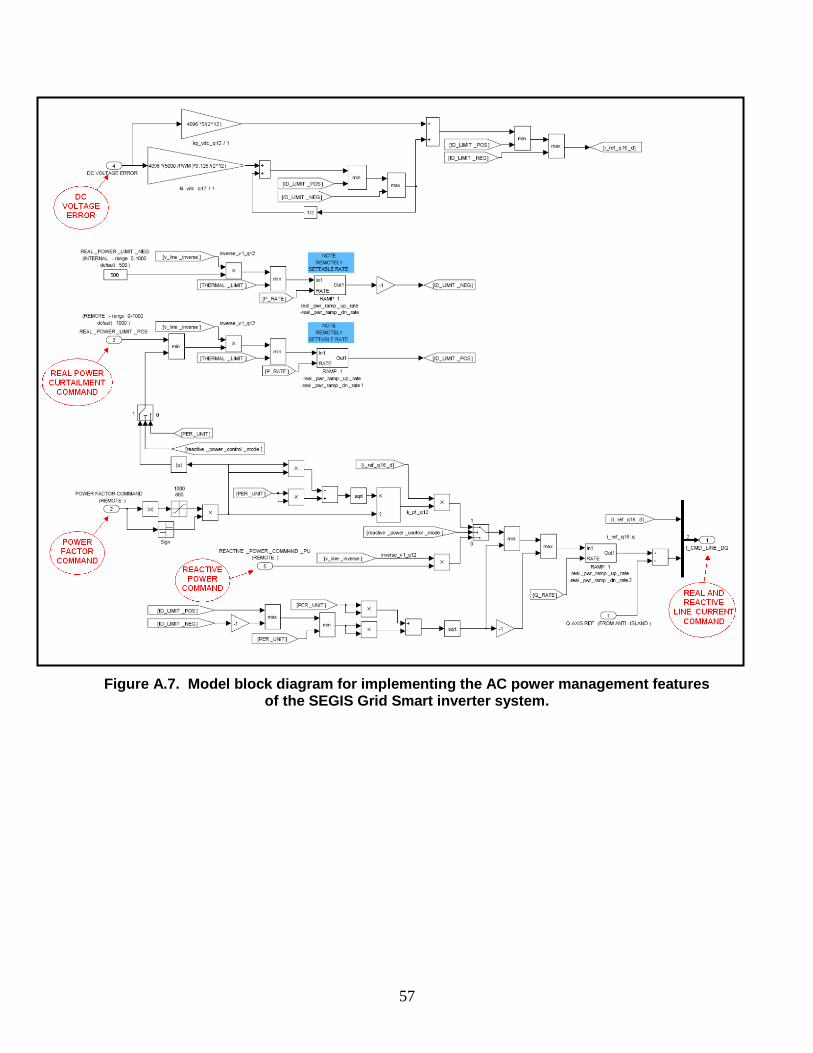
57
Figure A.7. Model block diagram for implementing the AC power management features of the SEGIS Grid Smart inverter system.
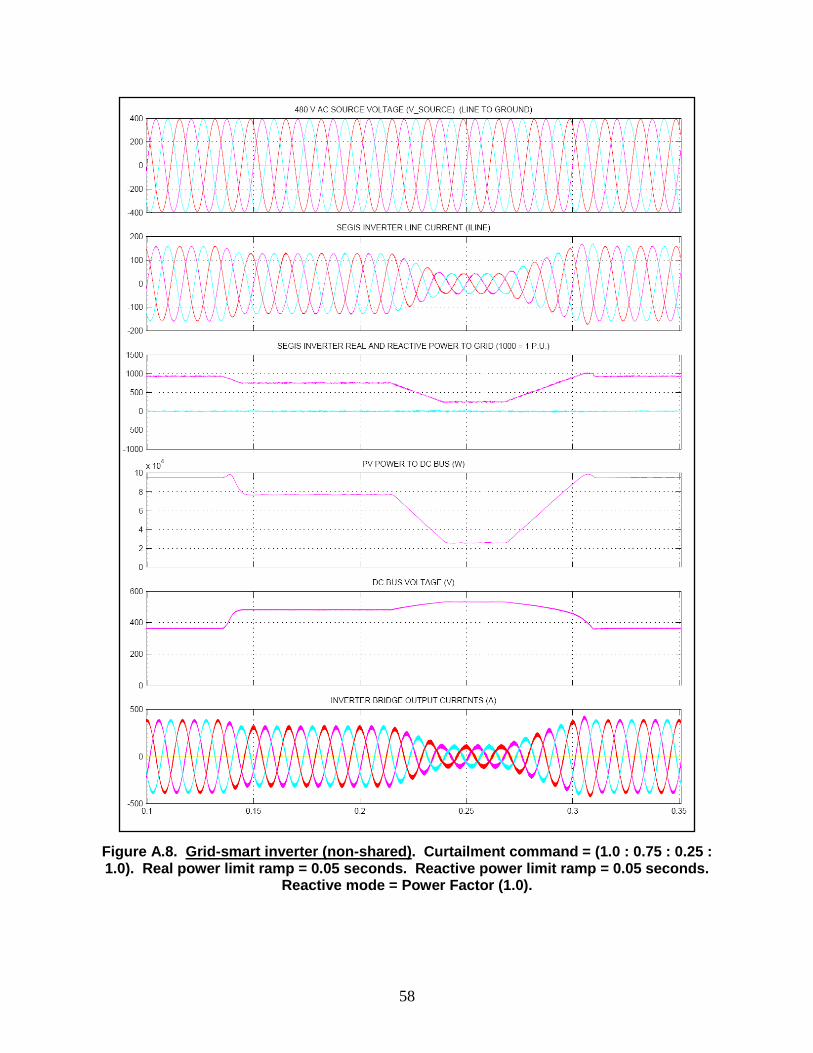
58
Figure A.8. Grid-smart inverter (non-shared). Curtailment command = (1.0 : 0.75 : 0.25 : 1.0). Real power limit ramp = 0.05 seconds. Reactive power limit ramp = 0.05 seconds.
Reactive mode = Power Factor (1.0).
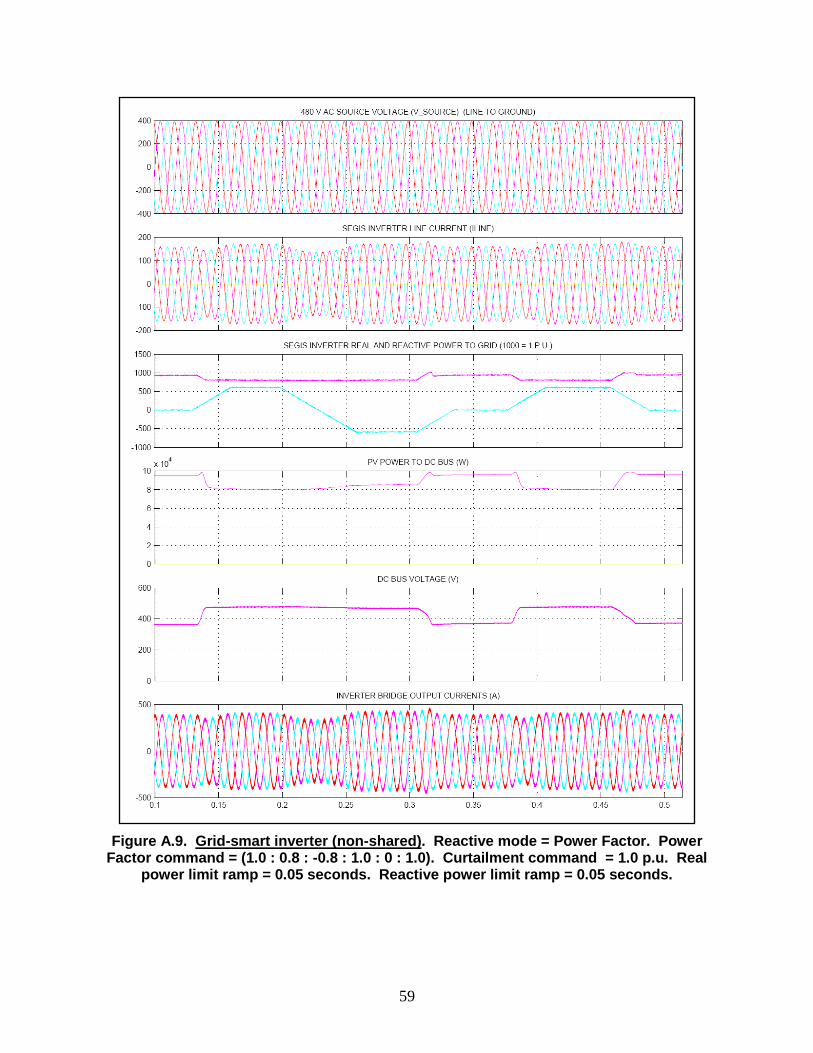
59
Figure A.9. Grid-smart inverter (non-shared). Reactive mode = Power Factor. Power Factor command = (1.0 : 0.8 : -0.8 : 1.0 : 0 : 1.0). Curtailment command = 1.0 p.u. Real
power limit ramp = 0.05 seconds. Reactive power limit ramp = 0.05 seconds.
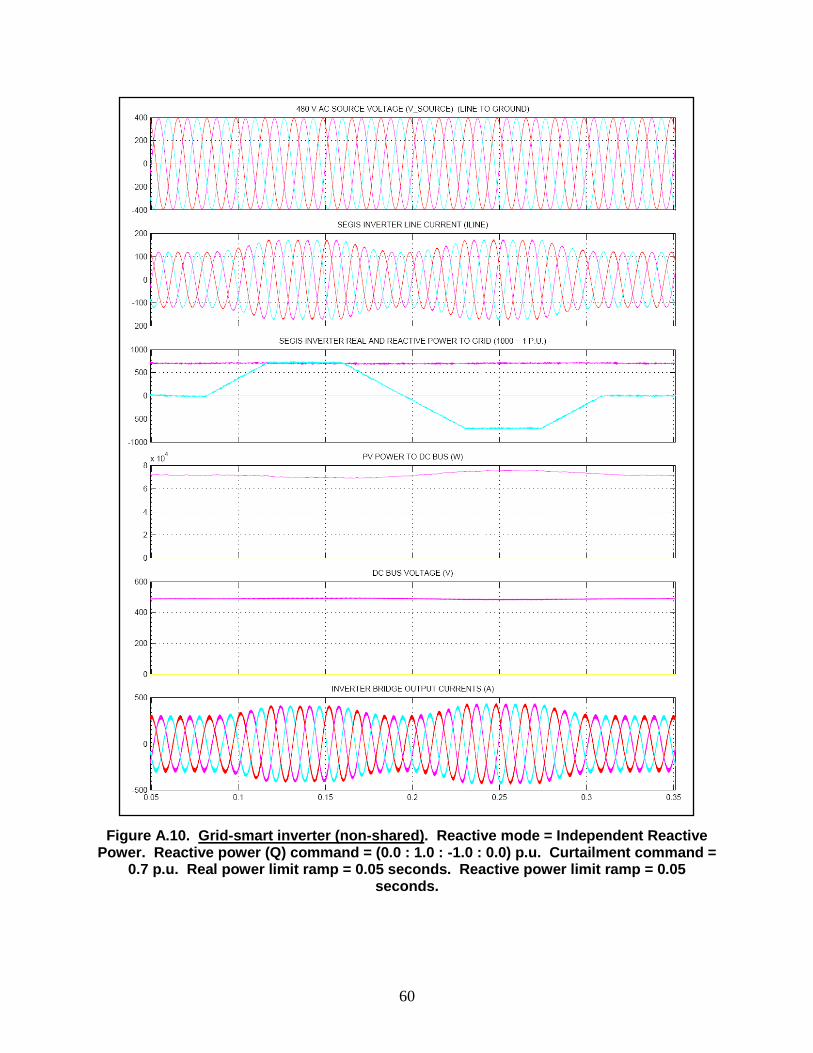
60
Figure A.10. Grid-smart inverter (non-shared). Reactive mode = Independent Reactive Power. Reactive power (Q) command = (0.0 : 1.0 : -1.0 : 0.0) p.u. Curtailment command =
0.7 p.u. Real power limit ramp = 0.05 seconds. Reactive power limit ramp = 0.05 seconds.
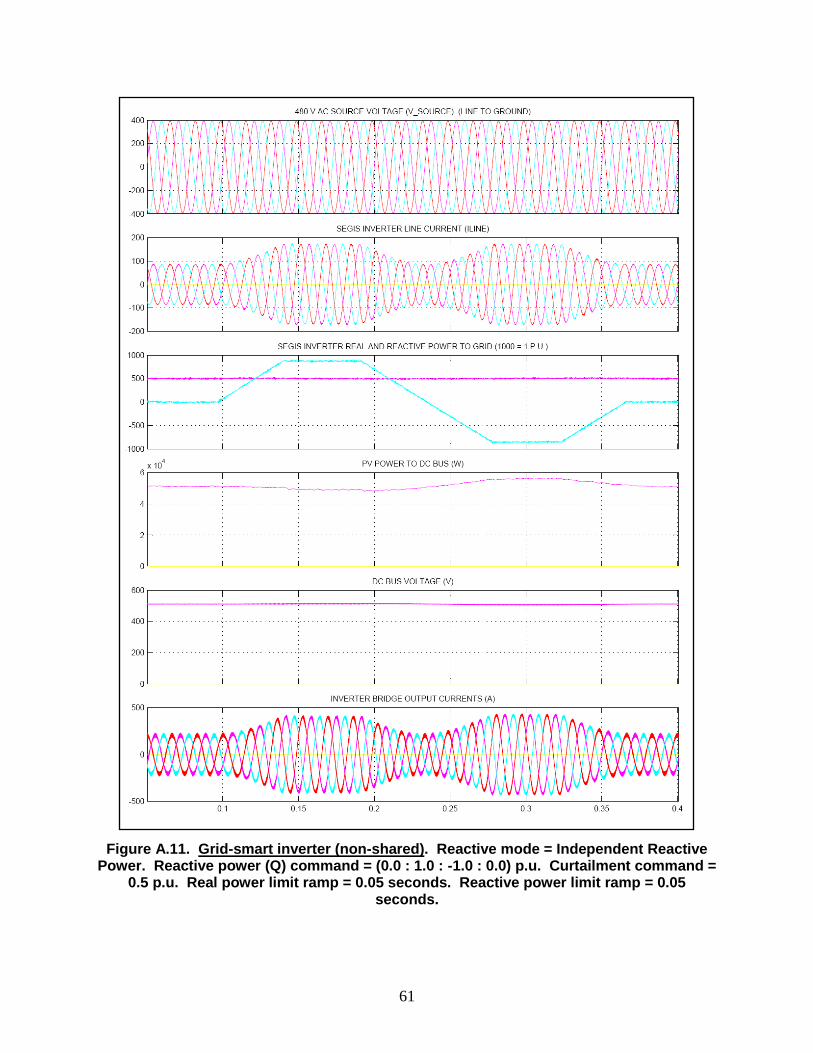
61
Figure A.11. Grid-smart inverter (non-shared). Reactive mode = Independent Reactive Power. Reactive power (Q) command = (0.0 : 1.0 : -1.0 : 0.0) p.u. Curtailment command =
0.5 p.u. Real power limit ramp = 0.05 seconds. Reactive power limit ramp = 0.05 seconds.
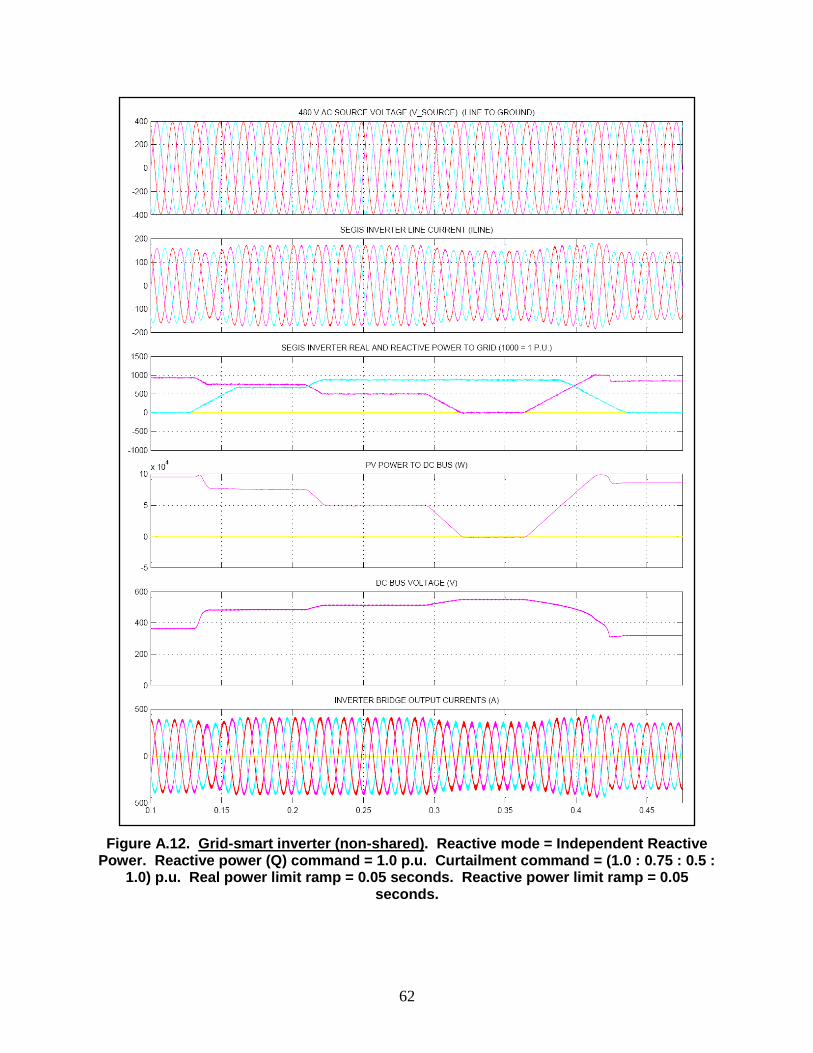
62
Figure A.12. Grid-smart inverter (non-shared). Reactive mode = Independent Reactive Power. Reactive power (Q) command = 1.0 p.u. Curtailment command = (1.0 : 0.75 : 0.5 :
1.0) p.u. Real power limit ramp = 0.05 seconds. Reactive power limit ramp = 0.05 seconds.
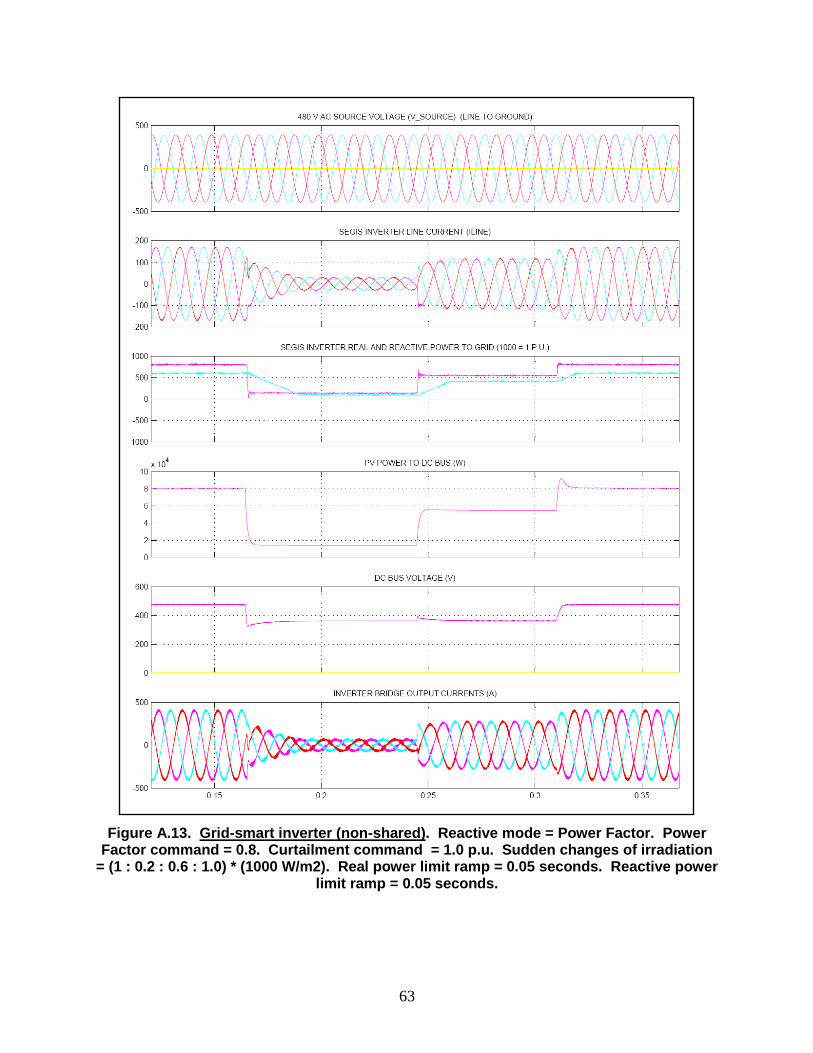
63
Figure A.13. Grid-smart inverter (non-shared). Reactive mode = Power Factor. Power Factor command = 0.8. Curtailment command = 1.0 p.u. Sudden changes of irradiation
= (1 : 0.2 : 0.6 : 1.0) * (1000 W/m2). Real power limit ramp = 0.05 seconds. Reactive power limit ramp = 0.05 seconds.
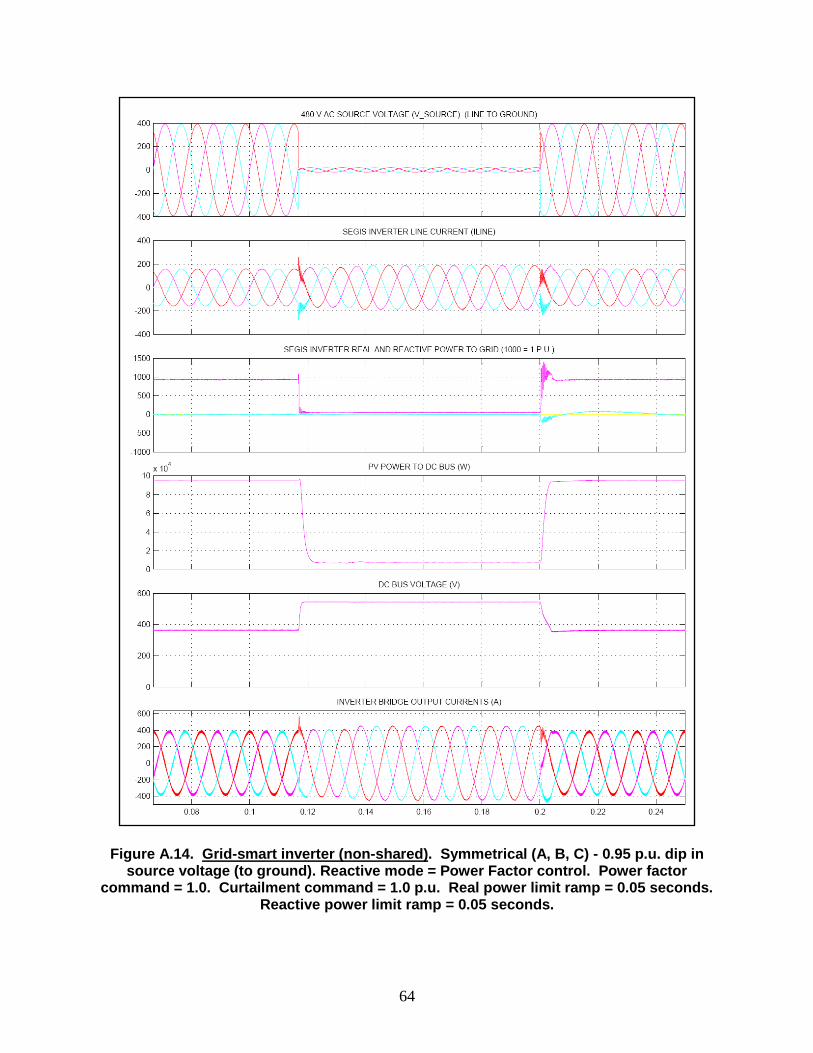
64
Figure A.14. Grid-smart inverter (non-shared). Symmetrical (A, B, C) - 0.95 p.u. dip in source voltage (to ground). Reactive mode = Power Factor control. Power factor
command = 1.0. Curtailment command = 1.0 p.u. Real power limit ramp = 0.05 seconds. Reactive power limit ramp = 0.05 seconds.
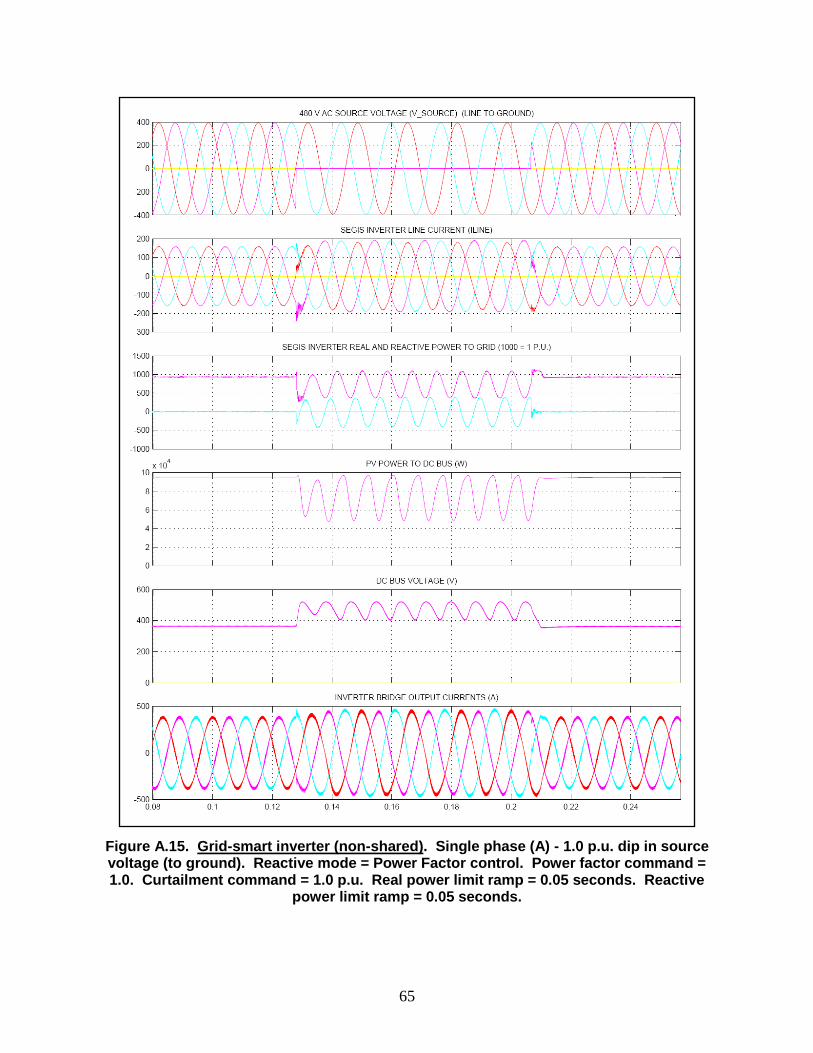
65
Figure A.15. Grid-smart inverter (non-shared). Single phase (A) - 1.0 p.u. dip in source voltage (to ground). Reactive mode = Power Factor control. Power factor command = 1.0. Curtailment command = 1.0 p.u. Real power limit ramp = 0.05 seconds. Reactive
power limit ramp = 0.05 seconds.
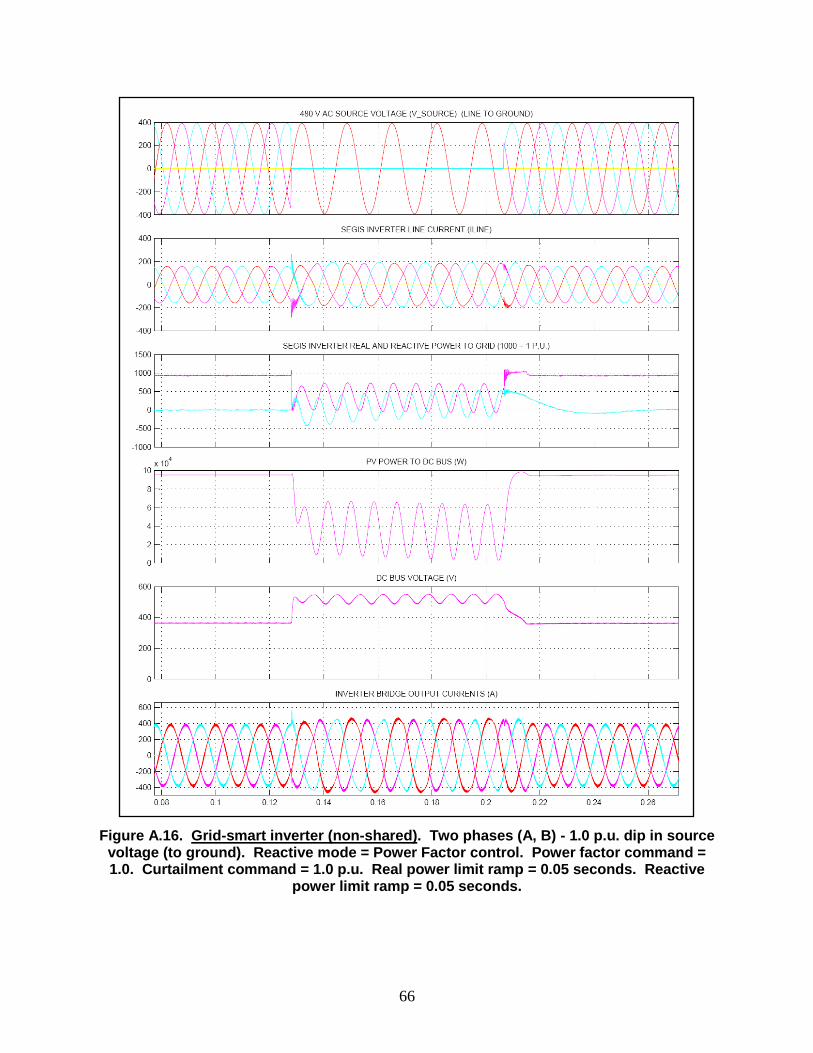
66
Figure A.16. Grid-smart inverter (non-shared). Two phases (A, B) - 1.0 p.u. dip in source voltage (to ground). Reactive mode = Power Factor control. Power factor command = 1.0. Curtailment command = 1.0 p.u. Real power limit ramp = 0.05 seconds. Reactive
power limit ramp = 0.05 seconds.
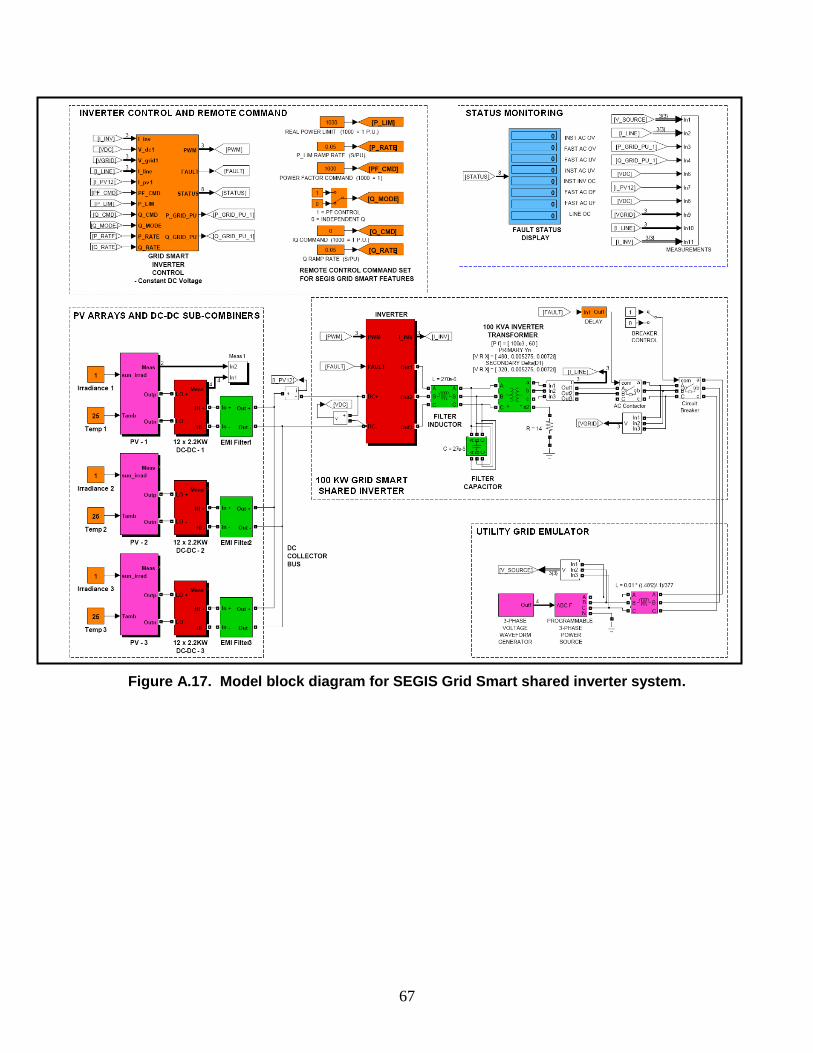
67
Figure A.17. Model block diagram for SEGIS Grid Smart shared inverter system.
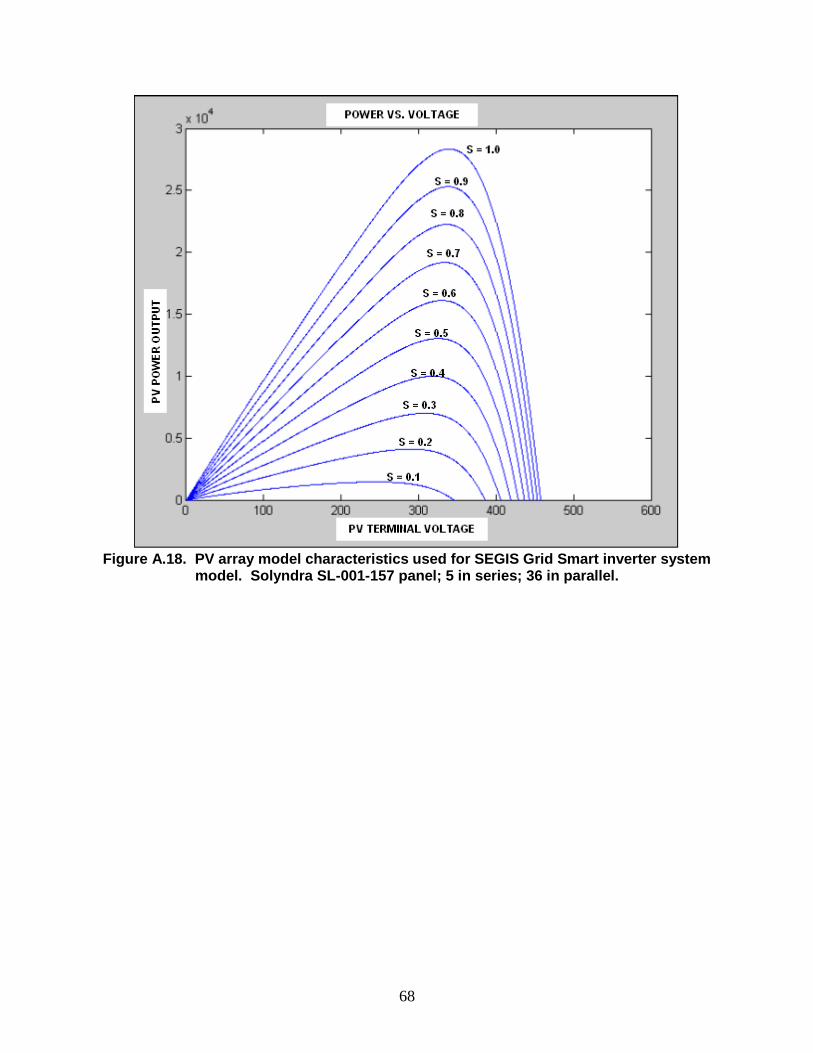
68
Figure A.18. PV array model characteristics used for SEGIS Grid Smart inverter system
model. Solyndra SL-001-157 panel; 5 in series; 36 in parallel.
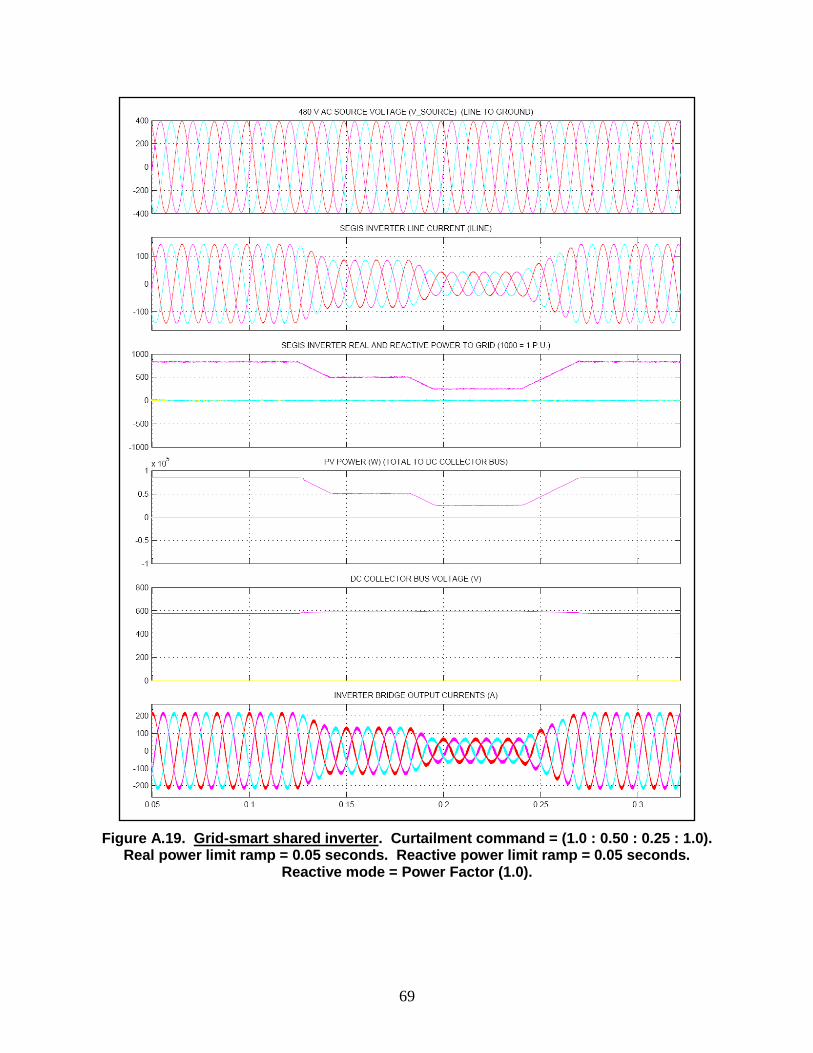
69
Figure A.19. Grid-smart shared inverter. Curtailment command = (1.0 : 0.50 : 0.25 : 1.0). Real power limit ramp = 0.05 seconds. Reactive power limit ramp = 0.05 seconds.
Reactive mode = Power Factor (1.0).
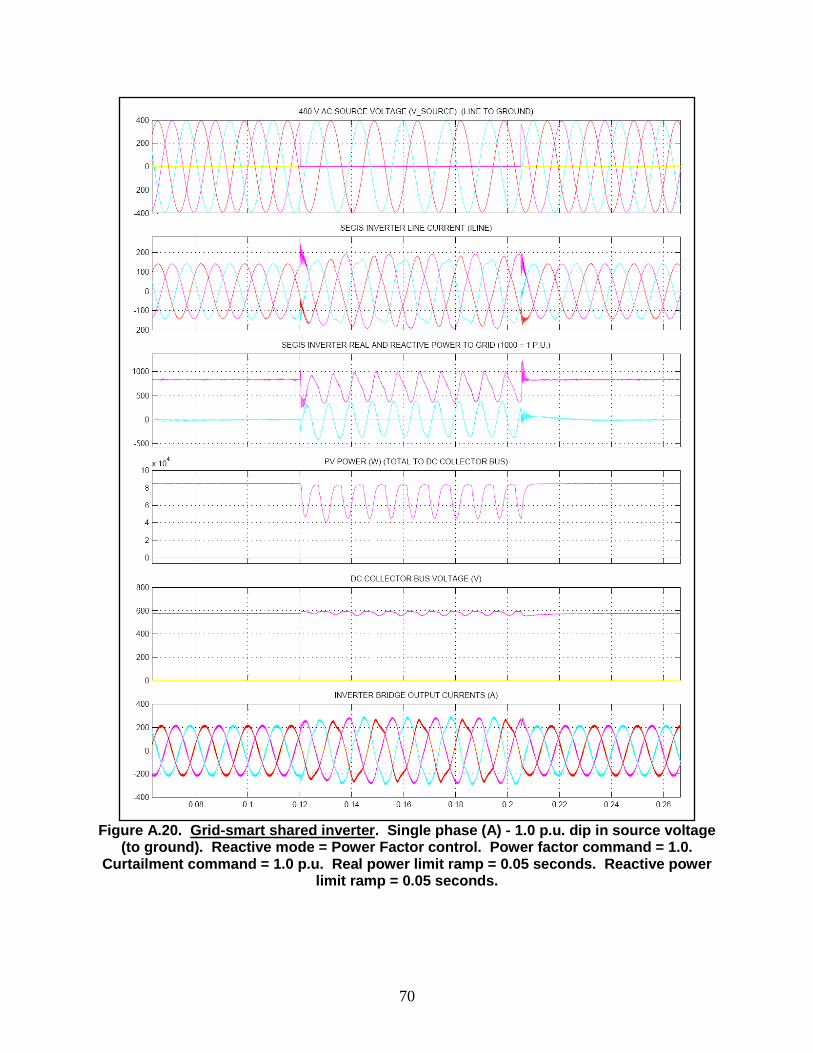
70
Figure A.20. Grid-smart shared inverter. Single phase (A) - 1.0 p.u. dip in source voltage
(to ground). Reactive mode = Power Factor control. Power factor command = 1.0. Curtailment command = 1.0 p.u. Real power limit ramp = 0.05 seconds. Reactive power
limit ramp = 0.05 seconds.
71
Appendix B: Witness Test Results (condensed)
SEGIS Witness Test Report
Version 1.0 (Edited)
This test report has been modified by the Florida Solar Energy Center
from the original version for brevity and enhanced clarity.
72
Introduction During the week of April 13 through 16, 2010 Sandia National Laboratories personnel witnessed
a series of tests conducted by the FSEC team held at the Satcon Technologies Corporation‘s
Boston laboratory. These demonstration tests showcased the Grid Smart capabilities of the
Satcon power inverters. In addition to the witness tests, Satcon presented a computer simulation
model of the inverter system exhibiting these features. Finally, Satcon demonstrated its string
combiner advanced data collection and fault detection capabilities.
Project Test Environment:
Model Satcon Solstice and Satcon Powergate Plus inverters
Power rating and
voltage
Shared inverter: 100 kW Satcon Solstice Inverter
Subcombiners: Satcon Solstice 2.2 kW Subcombiner
Non-Shared Inverter: 50 kW Satcon Powergate Plus Inverter
Test Location Satcon Test facility, Boston, MA
Source type (PV
array, etc.)
20 kW PV emulation system
30 kW Satcon Powergate Plus Inverter configured as an active
rectifier
Purpose of Tests Satcon personnel demonstrated three essential functional areas: the basic communication and
advanced power management features of the grid connected power inverters; a SCADA
compatible site control capability; and grid connected power inverter ride-through capacity under
several voltage and frequency disturbance scenarios.
Demonstrate Advanced Power Management Features The Electric Utility must manage the power supply in order to meet power demand. Solar
electric power as a generation source must be responsive to utility control if we hope to
realize wider adoption. The power inverter is the point of control. During the witness test,
Satcon demonstrated real and reactive power control, power ramping and curtailment.
Demonstrate Utility Remote Control of Inverters Typical SCADA systems employ an RS-485 interface to manage power generation
sources. Satcon has developed a utility site controller that can be operated via a RS-485
serial communications port. A notebook PC running a LabView graphical user interface
(GUI) was used to simulate a nominal version of one would find in a utility control room.
It provides a single point of control and data monitoring for the two inverter units under
test. This approach allows the operator to treat the site controller commanding multiple
inverters as a single virtual inverter.
Demonstrate Ride-through Capabilities UL 1741/IEEE Std.1547 standards today prohibit ride through behavior to enforce
islanding protection. A new ride-through standard is rolling out in European that permits
continued operation after temporary isolation from the electric utility system under
specific circumstances. Satcon demonstrated low voltage/low frequency ride through
73
capabilities of its modified inverters. In the future, a new version of the control software
will be deployed in Europe to support the ride through capabilities allowed by the new
IEC standard.
Computer Models Satcon developed Matlab/Simulink Computer models of the Grid Smart Inverter system and the
micro-grid. These models were used to predict the system behavior under the test laboratory
conditions and also in the field conditions.
Inverter System The inverter system model is based on the physical components. The model of the shared
inverter includes the inverter, its control software, three DC-DC subcombiners, PV
emulation sources, and a micro-grid emulating the utility grid. The model of the non-
shared inverter is less complex, consisting of the inverter, its control software, and the
simulated grid.
Micro-grid The utility grid emulator consists of a 3-phase voltage waveform generator driving a
programmable power source. Both the model and the physical grid operate at 480 V AC.
SEGIS Grid Smart System The inverter system and micro-grid models are integrated to create a full system model of
the SEGIS Grid Smart test system. Exercising this model provides a prediction of the
witness test outcome, and a basis for determining system response in difficult to test (at
least in the laboratory) situations.
Summary of Tests During the witness testing period, Satcon performed three categories of tests: advanced power
management, site control, and ride-through tests.
Advanced Power Management The Satcon inverters support remote real and reactive power command control, allowing
the remote user to set power factor and reactive power output. Power factor and real and
reactive power level changes are achieved via controlled ramping rather than abrupt step
functions. Utility operators also will have the ability to curtail real and reactive output.
These highly desirable utility features were demonstrated under controlled conditions in
the Satcon laboratory in Boston.
Site Control The site controller testing was designed to demonstrate that multiple inverters could be
monitored and controlled from a single node by a utility SCADA system. The site
controller monitors inverter parameters such as output of real and reactive power;
voltage, current, and frequency; and input of voltage, current, and power. It also enables
remote startup and shutdown to the site or separately to the individual inverters.
74
Ride-through The intent of the ride-through test is to show that the Satcon inverters, as modified for
this test, can withstand temporary low voltage conditions simulating grid instability or
loss of connectivity. The over and under frequency tests similarly demonstrate the
inverters‘ resilience during temporary grid frequency instability.
Summary of Results The Satcon inverters proved responsive to power factor and reactive power commands issued by
the simulated utility test interface. The units were able to maintain the programmed power levels
until otherwise instructed to change.
Data Collection The test data were recorded in 3 ways: on the worksheet directly, in tab-delimited log
files, and with oscilloscope waveform images.
Worksheets During the test execution, the testers recorded data by hand on the witness test
worksheets. Parameter values and a pass or fail indicators were entered for all the test
cases. These data were later entered into a spreadsheet for normalizing and also for
convenience when sharing. The original data sheets have been preserved for reference.
Log Files During the test period, all inverter and site controller responses were recorded in a tab-
delimited data file, capturing the inverter output parameters such as real power, reactive
power, apparent power, power factor, current, voltage, and frequency. The log files also
contain input parameters for voltage, current, and power. These data files were derived
from three sources: the site controller, a Yokogawa model WT3000 Precision Power
Analyzer on the 100kW shared inverter, and a second Yokogawa WT3000 connected to
the site controller. The site controller logged data at 10 second intervals. Three log files
were produced: one each for April 12, April 13, and April 14. The data in the April 12
file were not used for this report. The Yokogawa units sampled data at 1 second intervals.
Two log files were produced: one for the April 14 100 kW inverter tests and another for
April 15 ride-through tests. The Yokogawa recorders were beneficial in recording
inverter response to the ride-through tests. Neither the site controller nor the Yokogawa-
generated log files were able to capture the advanced power management ramp rate
transients. An oscilloscope was used instead.
Waveforms A Tektronix model TDS-3034 digital storage oscilloscope was used to record inverter
output during the real power ramp rate tests, the low voltage ride-through tests, and full
power testing. The other dynamic test for reactive power and power factor ramping could
not be captured on the oscilloscope. The oscilloscope produced both waveform image
captures and tabular data which were used for later plotting on Excel. The real power
ramp waveforms are plots of current versus time. A current-to-power equivalent was
calculated to plot theoretical ramp rates, which were superimposed on the Excel
75
generated charts. The ride-through test waveform images, associated tabular data, and
resultant Excel plots are measurements of volts versus time.
Test Results
Site Control Satcon demonstrated the ability from the LabView graphical user interface (GUI) to the
site controller to remotely control the two inverters. The inverters were enabled and
shutdown both individually and in aggregate. Following the demonstration of these remote
operations, we observed the remote monitoring capabilities in the LabView GUI.
Satcon next showed the power command features: curtailment, reactive power, and power
factor command. The operating parameters were entered into the LabView GUI for the
individual inverters and for the site. Receipt of the commands was acknowledged in the
LabView GUI, and the inverter input and output parameter values were recorded directly
on the test worksheets from the LabView GUI, the inverter HMI, and the Yokogawa
WT3000. The LabView application also maintained a data log record of these observations
as described in the ―Log Files‖ section above. The system responded positively to the
commands, and the tests were completed successfully.
Advanced Power Management Satcon demonstrated the controlled real and reactive power ramping functions at three
different ramp rates on the 50 kW inverter, the 100 kW shared inverter, and the two
inverters operating together under site control mode. The specified rates were 1%, 10%,
and 100% of inverter rated capacity per second. Real power data were captured on a
Tektronix Oscilloscope as mentioned above in the ―Waveform‖ section, and the response
waveforms images and numerical data were retained. The rise time was also recorded on
the test worksheets. The transient waveforms for the reactive power ramp rate tests could
not be captured; however, there was visual confirmation and the rise times were then
recorded on the test worksheets. The oscilloscope measured the current output, which
required that we calculate current ramp rate equivalent to the power ramp rate. We
observed a gradual ramping over time to the new set point as opposed to an abrupt step
function, and the set point was achieved within the upper and lower limits of the calculated
rise time.
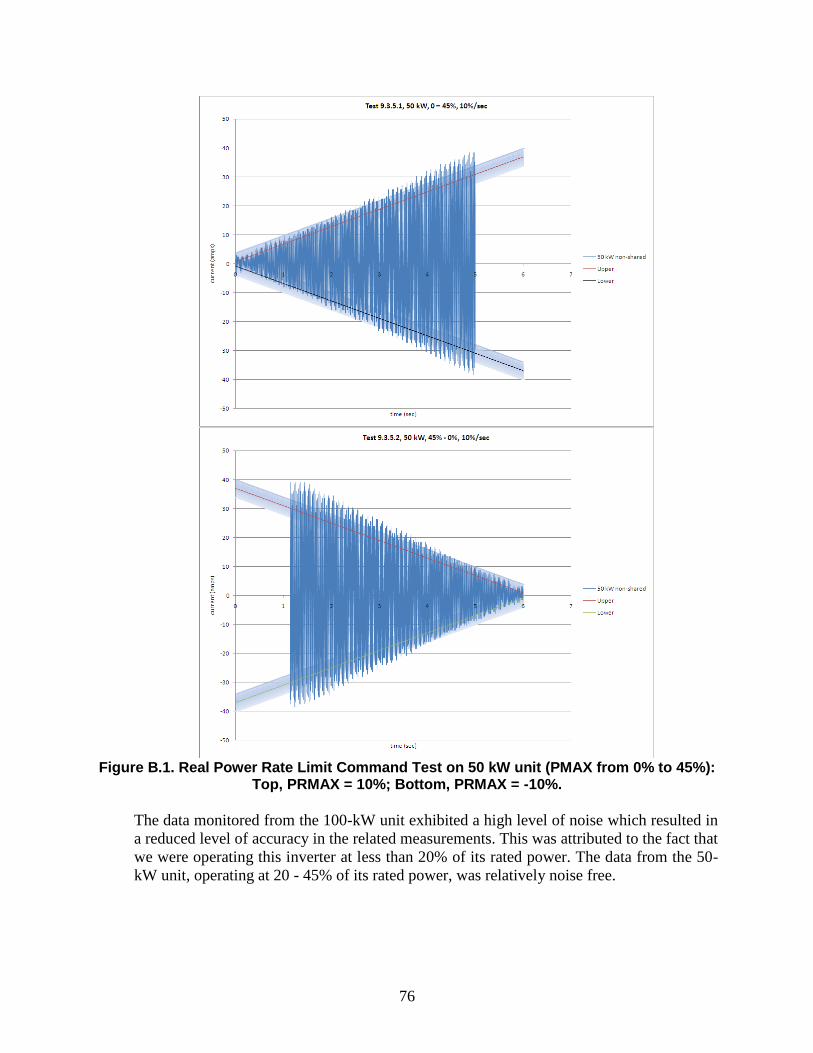
76
Figure B.1. Real Power Rate Limit Command Test on 50 kW unit (PMAX from 0% to 45%):
Top, PRMAX = 10%; Bottom, PRMAX = -10%.
The data monitored from the 100-kW unit exhibited a high level of noise which resulted in
a reduced level of accuracy in the related measurements. This was attributed to the fact that
we were operating this inverter at less than 20% of its rated power. The data from the 50-
kW unit, operating at 20 - 45% of its rated power, was relatively noise free.
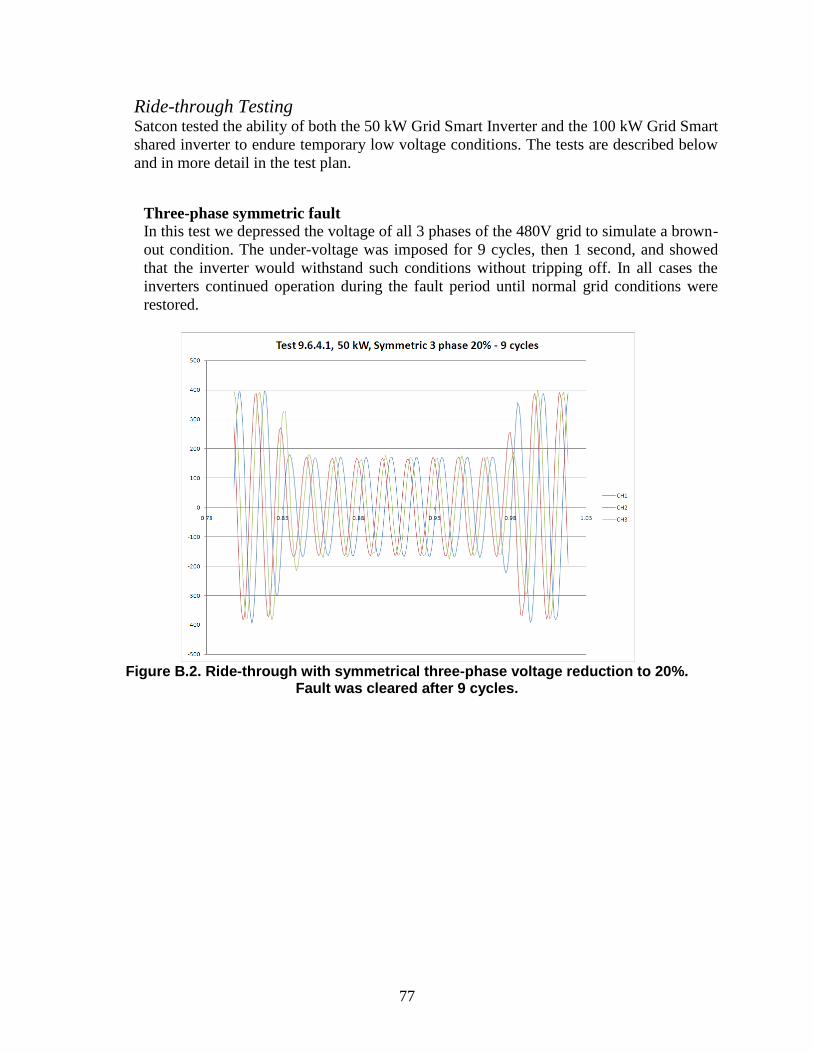
77
Ride-through Testing Satcon tested the ability of both the 50 kW Grid Smart Inverter and the 100 kW Grid Smart
shared inverter to endure temporary low voltage conditions. The tests are described below
and in more detail in the test plan.
Three-phase symmetric fault
In this test we depressed the voltage of all 3 phases of the 480V grid to simulate a brown-
out condition. The under-voltage was imposed for 9 cycles, then 1 second, and showed
that the inverter would withstand such conditions without tripping off. In all cases the
inverters continued operation during the fault period until normal grid conditions were
restored.
Figure B.2. Ride-through with symmetrical three-phase voltage reduction to 20%.
Fault was cleared after 9 cycles.
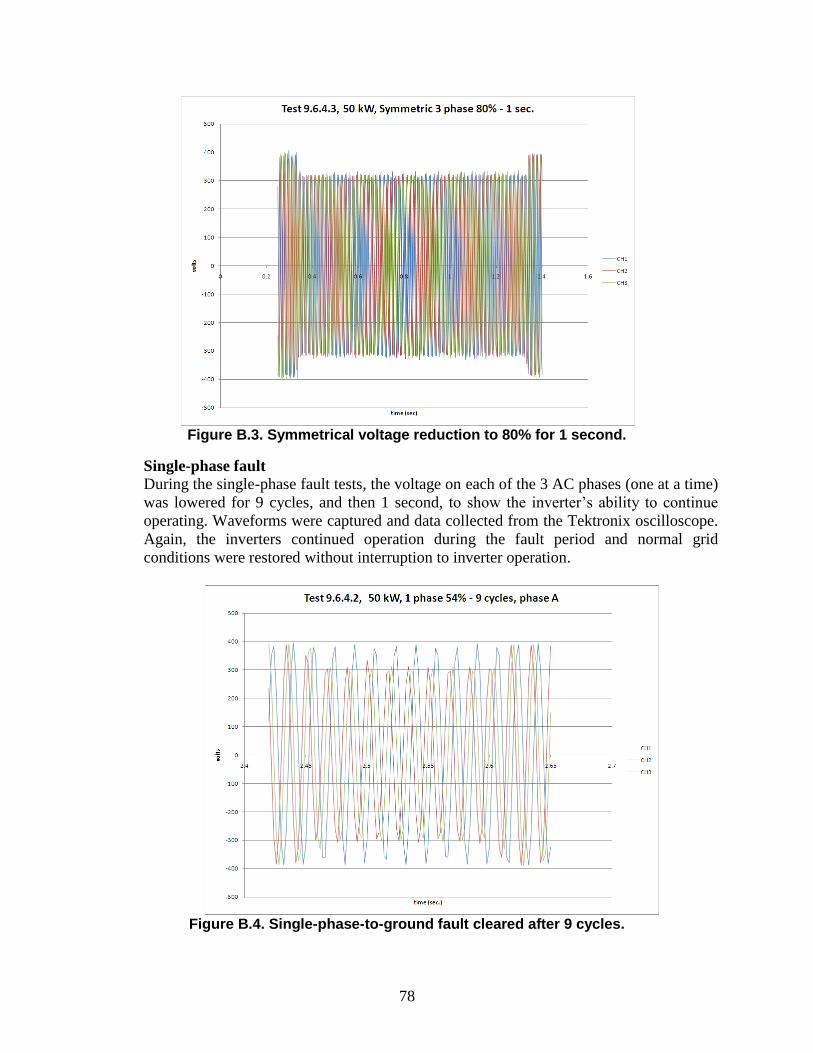
78
Figure B.3. Symmetrical voltage reduction to 80% for 1 second.
Single-phase fault
During the single-phase fault tests, the voltage on each of the 3 AC phases (one at a time)
was lowered for 9 cycles, and then 1 second, to show the inverter‘s ability to continue
operating. Waveforms were captured and data collected from the Tektronix oscilloscope.
Again, the inverters continued operation during the fault period and normal grid
conditions were restored without interruption to inverter operation.
Figure B.4. Single-phase-to-ground fault cleared after 9 cycles.
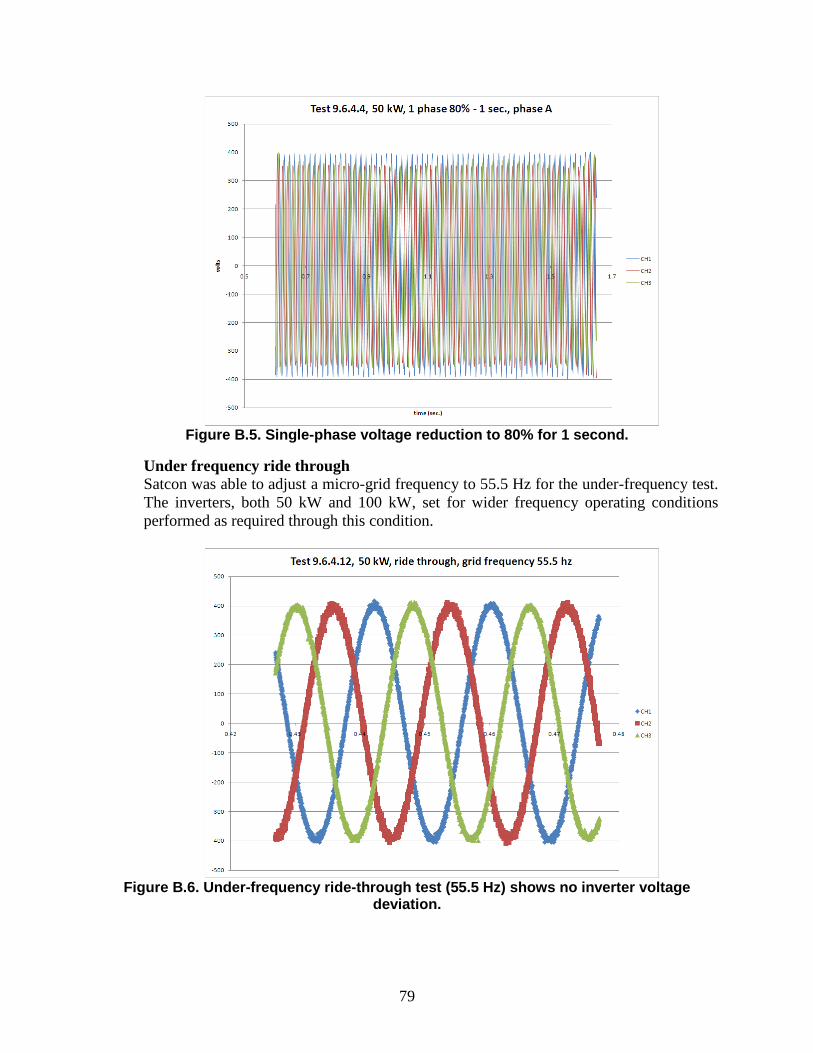
79
Figure B.5. Single-phase voltage reduction to 80% for 1 second.
Under frequency ride through
Satcon was able to adjust a micro-grid frequency to 55.5 Hz for the under-frequency test.
The inverters, both 50 kW and 100 kW, set for wider frequency operating conditions
performed as required through this condition.
Figure B.6. Under-frequency ride-through test (55.5 Hz) shows no inverter voltage
deviation.
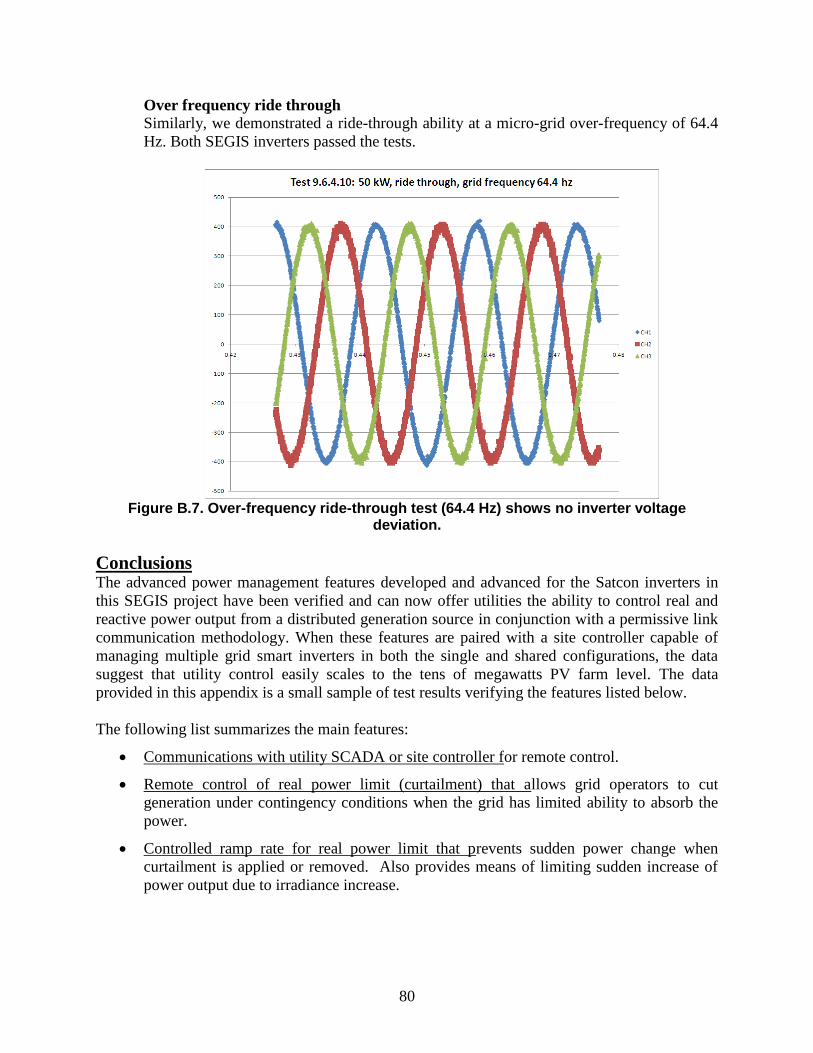
80
Over frequency ride through
Similarly, we demonstrated a ride-through ability at a micro-grid over-frequency of 64.4
Hz. Both SEGIS inverters passed the tests.
Figure B.7. Over-frequency ride-through test (64.4 Hz) shows no inverter voltage
deviation.
Conclusions The advanced power management features developed and advanced for the Satcon inverters in
this SEGIS project have been verified and can now offer utilities the ability to control real and
reactive power output from a distributed generation source in conjunction with a permissive link
communication methodology. When these features are paired with a site controller capable of
managing multiple grid smart inverters in both the single and shared configurations, the data
suggest that utility control easily scales to the tens of megawatts PV farm level. The data
provided in this appendix is a small sample of test results verifying the features listed below.
The following list summarizes the main features:
Communications with utility SCADA or site controller for remote control.
Remote control of real power limit (curtailment) that allows grid operators to cut
generation under contingency conditions when the grid has limited ability to absorb the
power.
Controlled ramp rate for real power limit that prevents sudden power change when
curtailment is applied or removed. Also provides means of limiting sudden increase of
power output due to irradiance increase.
81
Remote control of power factor or reactive power at PCC for Remote selection of power
factor or reactive power control provides mitigation of high or low voltage conditions at
the PCC without violating IEEE Std.1547.
Ride-through capability for specified grid disturbances that ensures the DG resources can
help support the utility grid system in a post-fault period. Requirements for successful
ride-through include:
o Extended tolerance for voltage and frequency deviation
o Enhanced dynamic control for operating under unbalanced/distorted voltage
o Suppressed anti-islanding measures
o A UPS power source for control and cooling
These new SEGIS capabilities all allow utilities to provide higher quality AC power and to
manage grid disturbances.

82

83
Appendix C: Satcon Advertisement Featuring GSI Functionality
Here is a recent advertisement from SolarPro magazine, which promotes many of the features
developed directly as a result of the SEGIS project.

84
85
DISTRIBUTION
External Distribution
Akhil, Abbas (2) Renewable Energy Ventures
1727 Soplo Rd. SE
Albuquerque, NM 87123
Ball, Greg (1) BEW Engineering
2303 Camino Ramon
Suite 220
San Ramon, CA 94583
Balog, Robert(1) PhD.-P.E; Assistant Professor
Dept. Electrical and Computer Eng.
Texas A&M University
216P Zachry Engineering Center
TAMU 3128
College Station, TX 77843-3128
Bower, Ward (10) Consultant
SEGIS Project Manager
13108 Hidden Valley NE
Albuquerque, NM 87111
Casey, Leo (5) SatCon
25 Drydock Avenue 7th Floor
Boston, MA 02210
Click, Dave (1) Florida Solar Energy Center
University of Central Florida
1679 Clear Lake Road
Cocoa, FL 32922
Coddington, Michael (1) National Renewable Energy Laboratory
1617 Cole Blvd.
Golden, CO 80401-3305
Davis, Kris (1) Florida Solar Energy Center
University of Central Florida
1679 Clear Lake Road
Cocoa, FL 32922
Gardow, Eva (1) First Energy
300 Madison Ave,
Morristown, NJ
Hammell, Darren(1) Princeton Power Systems
3490 U.S. Route 1
North Building 17
Princeton New Jersey 08540
Herig, Christy (1) Segue Consulting
3201 34th
St. South
St. Petersburg, FL 33711
Hoque, Aminul (1) EPRI, Power Delivery
942 Corridor Park Boulevard,
Knoxville, Tennessee 37932
86
Katz, Stan (1) Satcon
25 Drydock Avenue, 7th Floor
Boston, MA 02210
Key, Tom (1) EPRI, Power Delivery
942 Corridor Park Blvd.
Knoxville, Tennessee 37932
Kroposki, Benjamin (1) National Renewable Energy Laboratory
1617 Cole Blvd.
Golden, CO 80401-3305
Le, Minh (1) US DOE EERE –Solar Energy Technologies
Program
U.S. Department of Energy
1000 Independence Ave SW, EE-2A
Washington, DC 20585
Lynn, Kevin (1) US DOE EERE -Lead for Systems
Integration Solar Energy Technologies
U.S. Department of Energy
1000 Independence Ave SW - EE-2A
Washington, DC 20585
Mills-Price, Michael (1) PV Powered/Advanced Energy
20720 Brinson Blvd,
Bend OR. 97708
Moaveni, Houtan(1) Florida Solar Energy Center
University of Central Florida
1679 Clear Lake Road
Cocoa, FL 32922
Ozpineci, Burak (1) Oak Ridge National Labs
Power Electronics and Electric Machinery
Research Group
2360 Cherahala Boulevard
Knoxville, TN 37932
Perkins, Steve (1) Lakeland Electric
502 E Lemon St.
Lakeland, FL 33801
Perkinson, Jim (2) Satcon
25 Drydock Avenue, 7th Floor
Boston, MA 02210
Prestero, Mark (1) Satcon
25 Drydock Avenue, 7th Floor
Boston, MA 02210
Ramamoorthy,
Ramesh(1)
US DOE EERE - Program Manager Solar
Energy Technologies Program
U.S. Department of Energy
1000 Independence Ave SW; EE-2A
Washington, DC 20585
87
Razon, Alvin (1) US DOE EERE - CTR - Contractor for Solar
Energy Technologies Program
U.S. Department of Energy
1000 Independence Ave SW; EE-2A
Washington, DC 20585
Reedy, Bob (15) Florida Solar Energy Center
1679 Clearlake Rd,
Cocoa, FL 32922
Ropp, Mike (3) Northern Plains Power Technologies
807 32nd
avenue
Brookings, SD 57006-4716
m
Rustom, Khalid (1) Petra Solar
300-G Corporate Court
South Plainfield, NJ 07080
Sailor, Dave(1) Satcon
25 Drydock Avenue; 7th Floor
Boston, MA 02210
Senkowicz, Eric (1) Florida Reliability Coordinating Council
(FRCC)
The Towers at Westshore
1408 N. Westshore Blvd., Suite 1002,
Tampa, Florida 33607-4512
Shaffer, Alan (2) Lakeland Electric
502 E Lemon St,
Lakeland, FL 33801
Smith, Merrill (1) US DOE OE - Program Manager Office of
Electricity Delivery and Energy
U.S. Department of Energy
1000 Independence Ave SW; OE-10
Washington, DC 20585
Thomas, Holly (1) DOE Golden Field Office
1617 Cole Blvd.
Golden, CO 80401
Ton, Dan (4) US DOE OE - Program Manager, Office of
Electricity Delivery and Energy Reliability
Smart Grid Research
U.S. Department of Energy
1000 Independence Ave SW; OE-10
Washington, DC 20585
Wright, Chris (1) Florida Power & Light
700 Universe Blvd.
Juno Beach, FL 33408
Xu, Dr. Yan (1) Oak Ridge National Labs (ORNL)
P.O. Box 2008
Oak Ridge, TN 37831

88
Yuan, Guohui (1) US DOE EERE-CTE - Contractor for Solar
Energy Technologies Program
U.S. Department of Energy
1000 Independence Ave SW ; EE-2A
Washington, DC 20585
Zgonena, Timothy (1) Underwriters Laboratories
333 Pfingsten Road
Northbrook, IL 60062.

89
Internal Distribution
MS-0352 Jay Johnson Org-0718 [email protected]
MS-0717 Randy Shibata Org-10245 [email protected]
MS-0717 Carolyn David (2) Org-10245 [email protected]
MS-0721 Marjorie Tatro Org-6100 [email protected]
MS-0734 Lisa Sena-Henderson (5) Org-6111 [email protected]
MS-0734 Bruce Kelley Org-6632 [email protected]
MS-0735 Ron Pate Org-6926 [email protected]
MS-0951 Jennifer Granada Org-6112 [email protected]
MS-0978 Scott Kuszmaul Org-5946 [email protected]
MS-1033 Sig Gonzalez (3) Org-6112 [email protected]
MS-1033 Charles Hanley (3) Org-6112 [email protected]
MS-1033 Armando Fresquez Org-6112 [email protected]
MS-1033 Abe Ellis Org- 6112 [email protected]
MS-1033 Josh Stein Org-6112 [email protected]
MS-1104 Juan Torres (3) Org-6120 [email protected],
MS-1104 Rush Robinette Org-6110 [email protected]
MS-1108 Michael Hightower Org-6111 [email protected]
MS-1108 Ray Finley Org-6111 [email protected]
MS-1108 Jeff Carlson Org-6111 [email protected]
MS-1108 Jennifer Stinebaugh Org-6111 [email protected]
MS-1108 Jason Stamp Org-6111 [email protected]
MS-1108 Marvin Cook Org-6111 [email protected]
MS-1140 Ross Guttromson Org-6113 [email protected]
MS-1315 Jeff Nelson Org-1131 [email protected]
MS-0899 RIM-Reports Management, 9532 (electronic copy)

90