soil testing & plant analysis · 4 steps in the soil testing-nutrient recommendation system 1....
TRANSCRIPT
Soil Testing & Plant Analysis
Carrie Laboski
Dept. of Soil Science
UW-Madison
4 Steps in the soil testing-nutrient
recommendation system
1. Collect soil samples
2. Determine the nutrient availability of the soil represented by the samples (soil test)
3. Interpret the soil test results (soil test calibration)
4. Estimate the quantity of nutrient required by the crop (nutrient recommendation)
Soil Sampling
Minimum Requirements
Follow recommendations in UWEX A2100
How will the data be used?
One recommendation per field – whole field
Variable rate application – grid
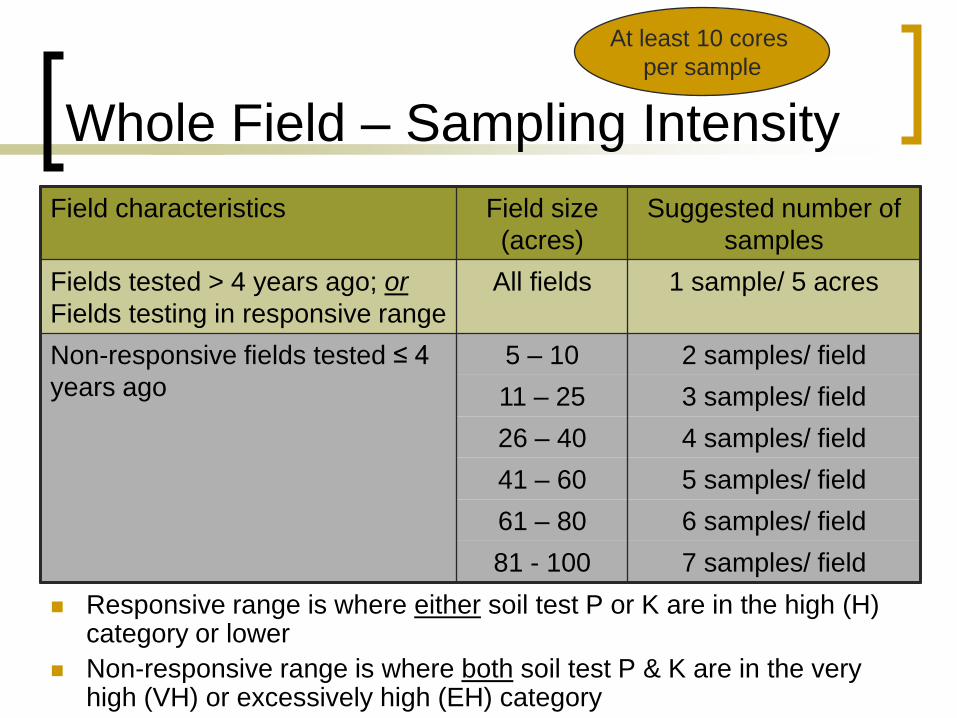
Whole Field – Sampling Intensity
Field characteristics Field size
(acres)
Suggested number of
samples
Fields tested > 4 years ago; or
Fields testing in responsive range
All fields 1 sample/ 5 acres
Non-responsive fields tested ≤ 4
years ago
5 – 10 2 samples/ field
11 – 25 3 samples/ field
26 – 40 4 samples/ field
41 – 60 5 samples/ field
61 – 80 6 samples/ field
81 - 100 7 samples/ field
Responsive range is where either soil test P or K are in the high (H) category or lower
Non-responsive range is where both soil test P & K are in the very high (VH) or excessively high (EH) category
At least 10 cores
per sample
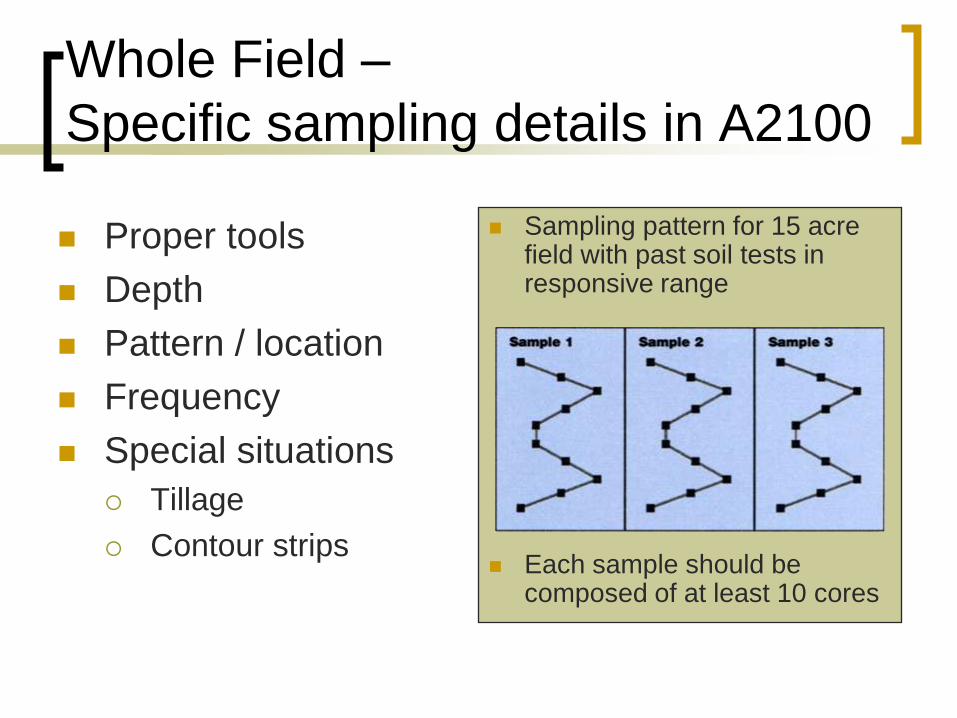
Whole Field –
Specific sampling details in A2100
Proper tools
Depth
Pattern / location
Frequency
Special situations
Tillage
Contour strips
Sampling pattern for 15 acre field with past soil tests in responsive range
Each sample should be composed of at least 10 cores
Grid
Unaligned systematic grid point method
300’ (2.1 acre) grid – if both P & K are in non-
responsive categories (VH & EH)
200’ (0.92 acre) grid – if either P or K are in
responsive categories (below H)
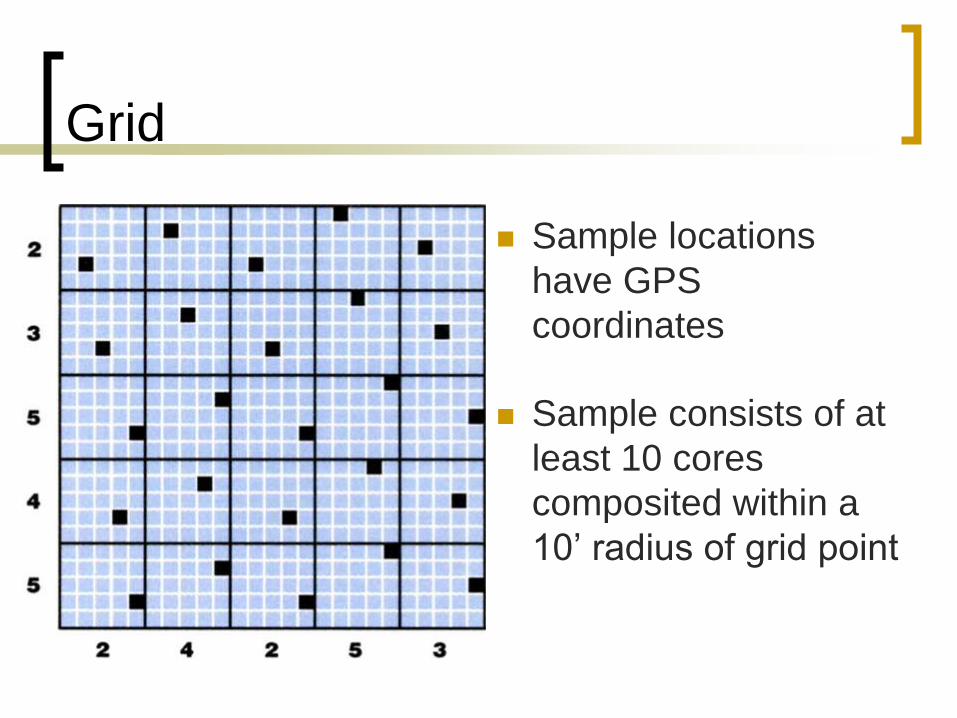
Grid
Sample locations
have GPS
coordinates
Sample consists of at
least 10 cores
composited within a
10’ radius of grid point
Soil Testing
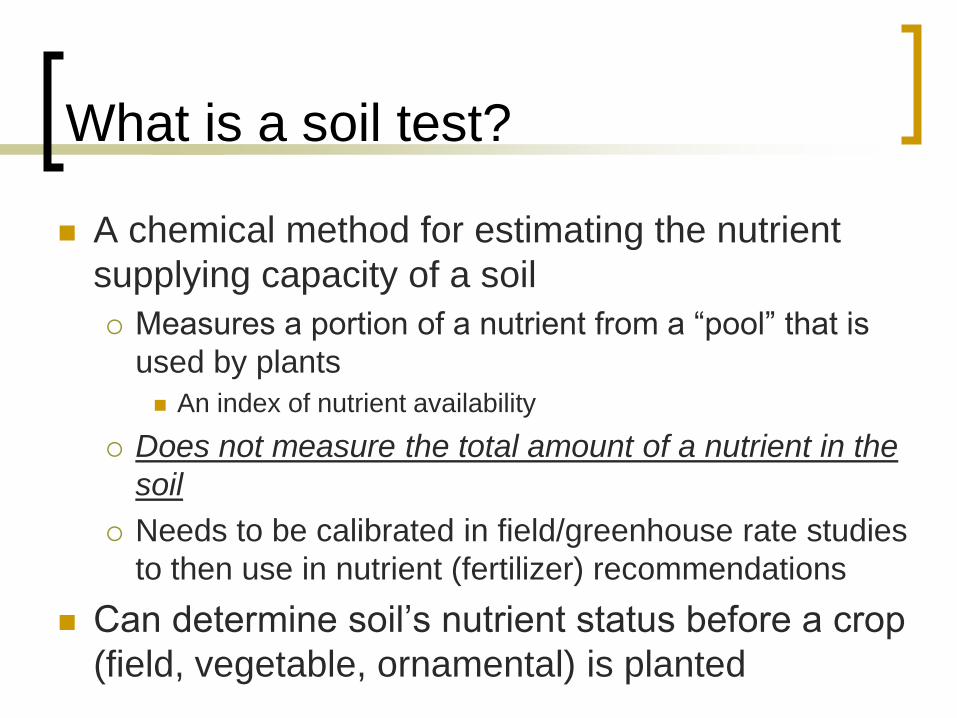
What is a soil test?
A chemical method for estimating the nutrient
supplying capacity of a soil
Measures a portion of a nutrient from a “pool” that is
used by plants
An index of nutrient availability
Does not measure the total amount of a nutrient in the
soil
Needs to be calibrated in field/greenhouse rate studies
to then use in nutrient (fertilizer) recommendations
Can determine soil’s nutrient status before a crop
(field, vegetable, ornamental) is planted
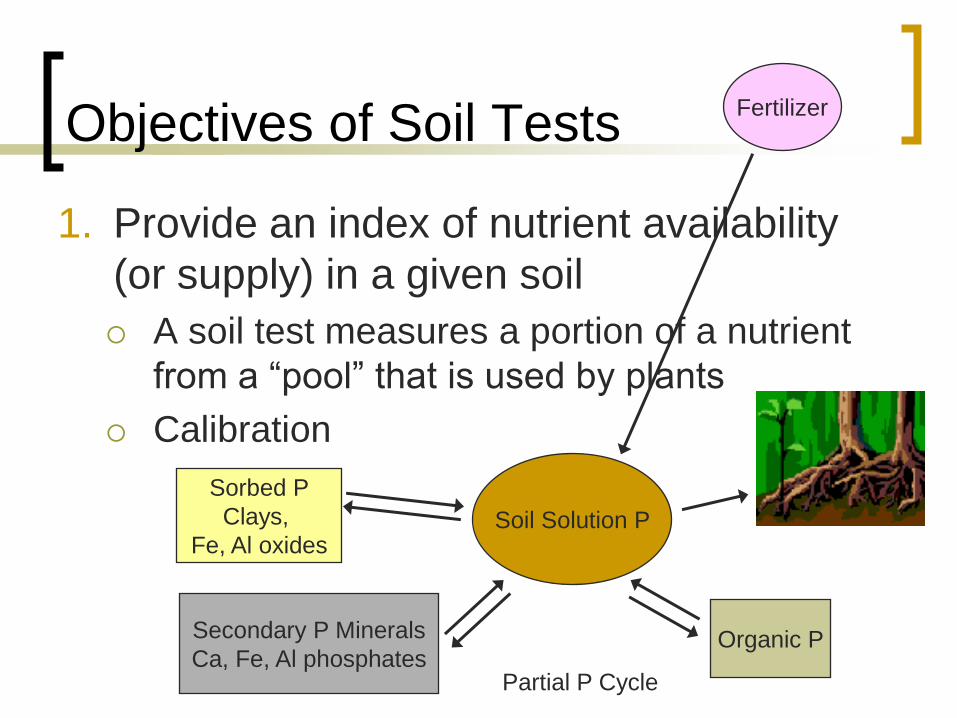
Objectives of Soil Tests
1. Provide an index of nutrient availability
(or supply) in a given soil
A soil test measures a portion of a nutrient
from a “pool” that is used by plants
Calibration
Sorbed P
Clays,
Fe, Al oxides
Secondary P Minerals
Ca, Fe, Al phosphatesOrganic P
Soil Solution P
Partial P Cycle
Fertilizer
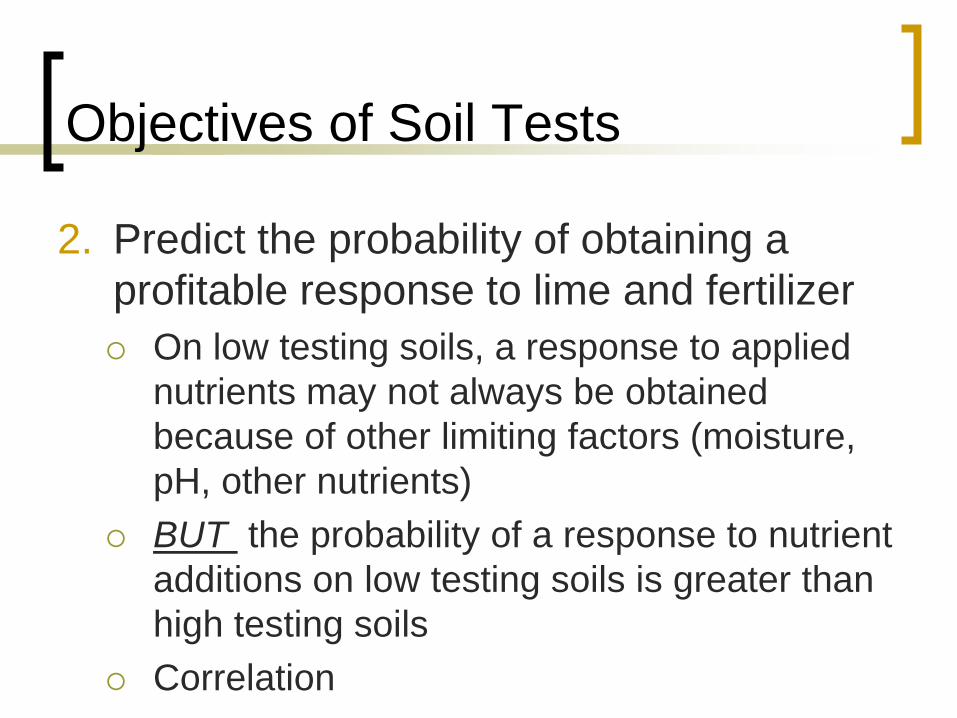
Objectives of Soil Tests
2. Predict the probability of obtaining a
profitable response to lime and fertilizer
On low testing soils, a response to applied
nutrients may not always be obtained
because of other limiting factors (moisture,
pH, other nutrients)
BUT the probability of a response to nutrient
additions on low testing soils is greater than
high testing soils
Correlation
Objectives of Soil Tests
3. Provide a basis for recommendations on
the amount of lime and fertilizer to apply
Relationships obtained through laboratory,
greenhouse, and field studies
Overriding Goal of Soil Testing
To obtain a value that will help to predict
the amount of nutrients (fertilizer) needed
to supplement the nutrient supplying
capacity of the soil such that maximum
economic yield is achieved
Now, and more so in the future, we will need
to balance environmental degradation with
economics
Nutrient Recommendation
Philosophies
Build and Maintain
Sufficiency Level
Cation Ratio/Balance
For immobile nutrients
Primarily P & K, not N
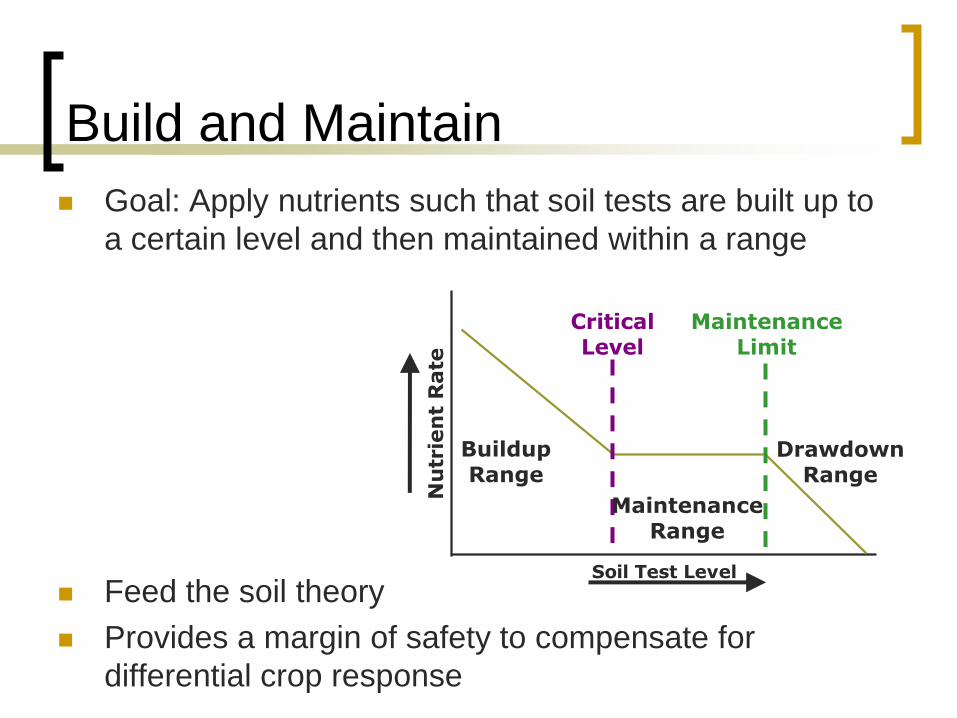
Build and Maintain
Goal: Apply nutrients such that soil tests are built up to
a certain level and then maintained within a range
Feed the soil theory
Provides a margin of safety to compensate for
differential crop response
Soil Test Level
Nu
trie
nt
Rate
BuildupRange
MaintenanceRange
DrawdownRange
CriticalLevel
MaintenanceLimit
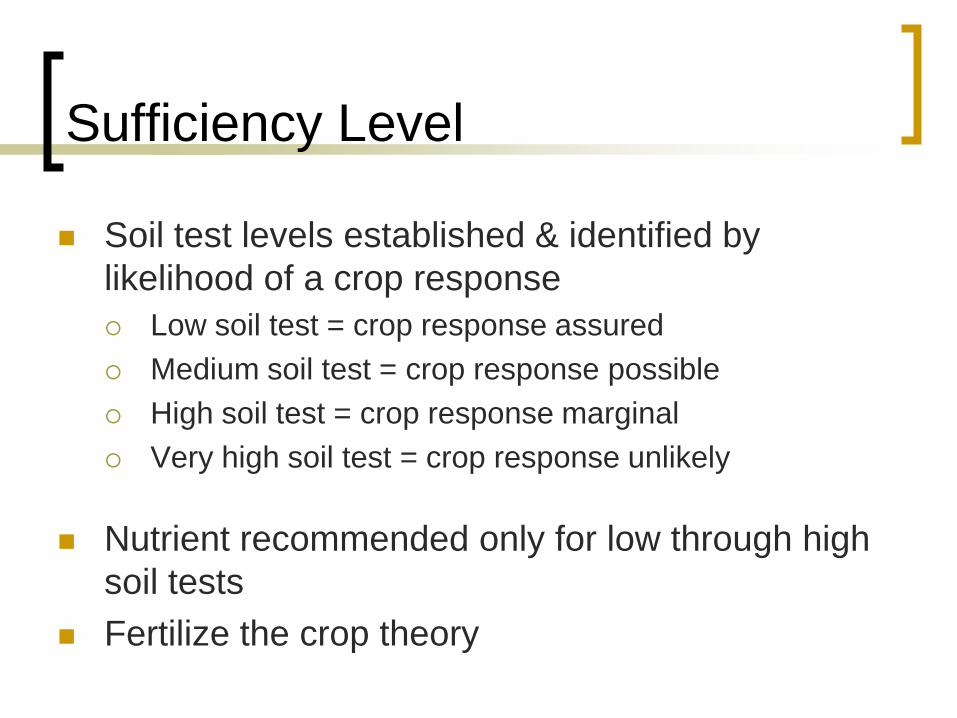
Sufficiency Level
Soil test levels established & identified by
likelihood of a crop response
Low soil test = crop response assured
Medium soil test = crop response possible
High soil test = crop response marginal
Very high soil test = crop response unlikely
Nutrient recommended only for low through high
soil tests
Fertilize the crop theory
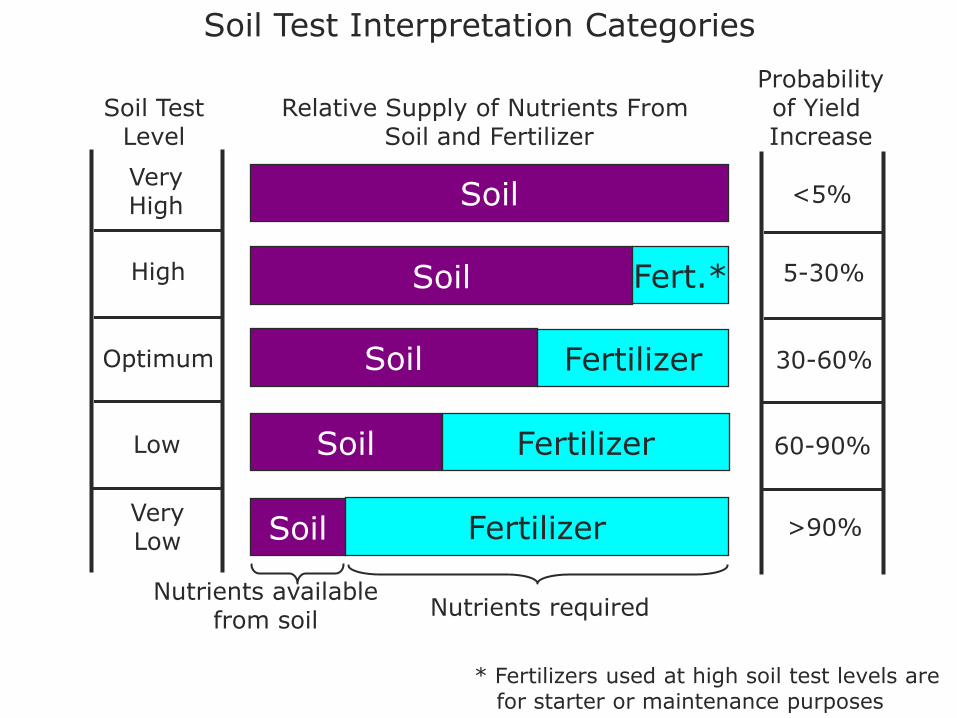
Soil
Soil
Soil
Soil
Soil Fertilizer
Fertilizer
Fertilizer
Fert.*
* Fertilizers used at high soil test levels are for starter or maintenance purposes
Nutrients available from soil
Nutrients required
Soil Test Interpretation Categories
VeryLow
Low
Optimum
High
VeryHigh
>90%
60-90%
30-60%
5-30%
<5%
Soil TestLevel
Probabilityof Yield Increase
Relative Supply of Nutrients From Soil and Fertilizer
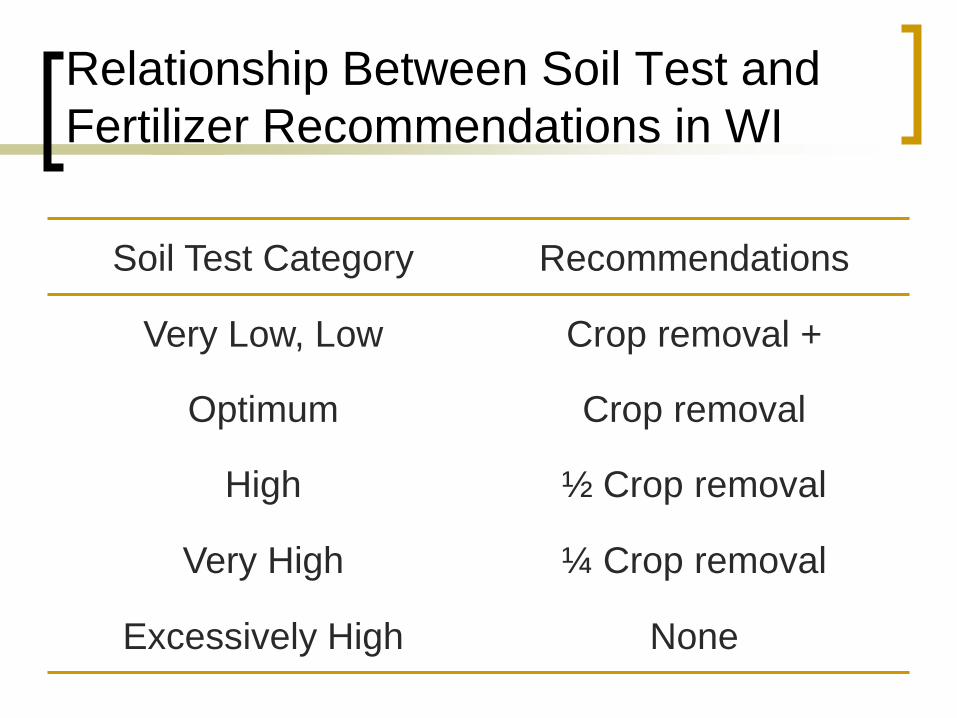
Relationship Between Soil Test and
Fertilizer Recommendations in WI
Soil Test Category Recommendations
Very Low, Low Crop removal +
Optimum Crop removal
High ½ Crop removal
Very High ¼ Crop removal
Excessively High None
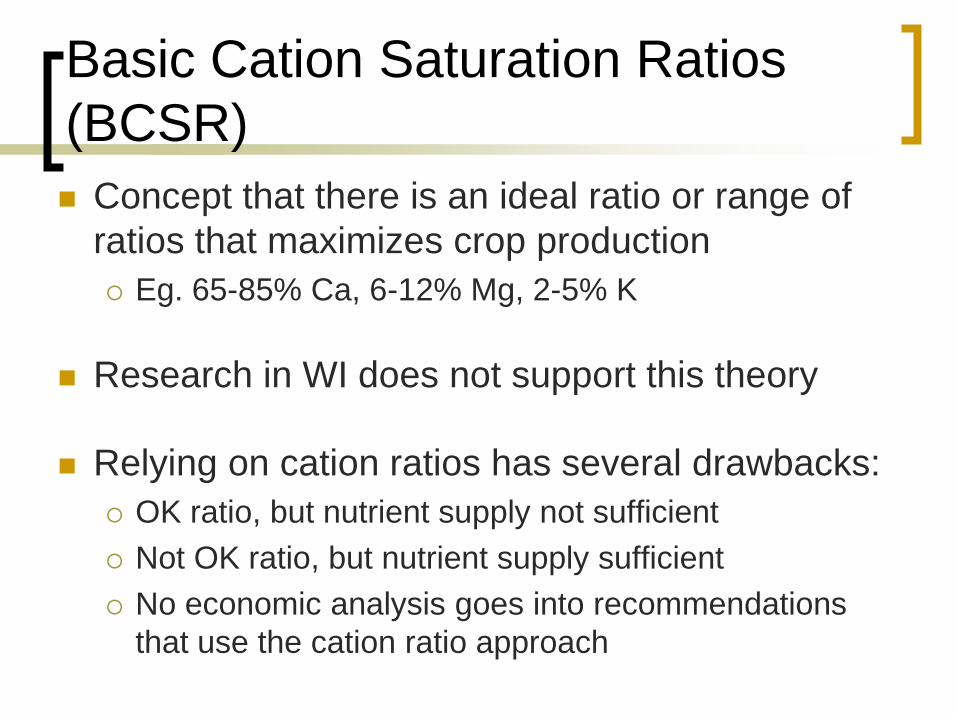
Basic Cation Saturation Ratios
(BCSR)
Concept that there is an ideal ratio or range of
ratios that maximizes crop production
Eg. 65-85% Ca, 6-12% Mg, 2-5% K
Research in WI does not support this theory
Relying on cation ratios has several drawbacks:
OK ratio, but nutrient supply not sufficient
Not OK ratio, but nutrient supply sufficient
No economic analysis goes into recommendations
that use the cation ratio approach
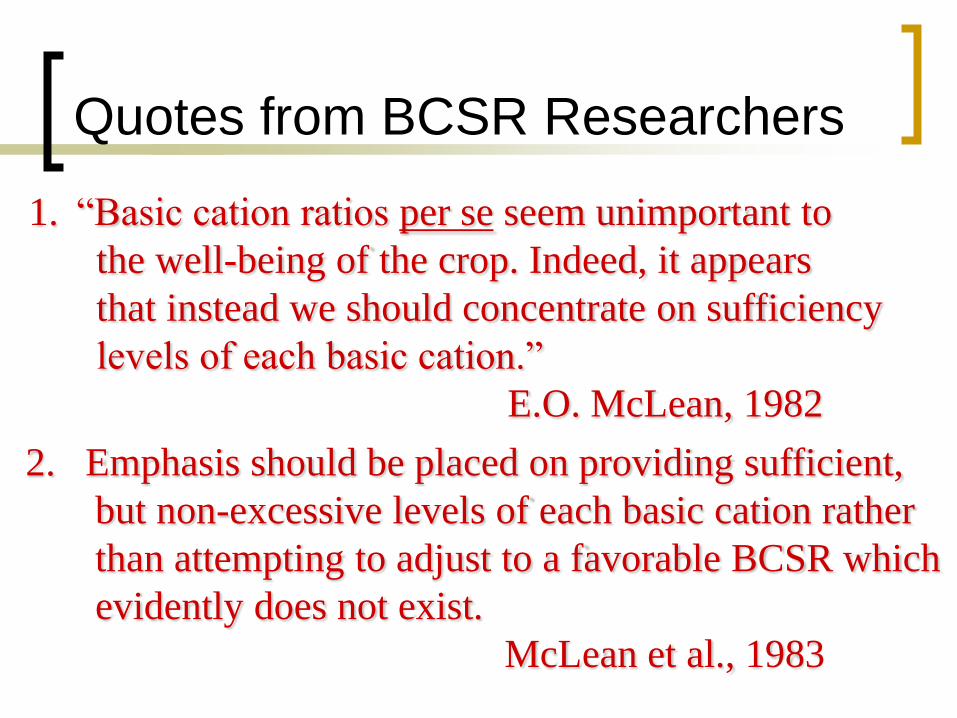
Quotes from BCSR Researchers
1. “Basic cation ratios per se seem unimportant to
the well-being of the crop. Indeed, it appears
that instead we should concentrate on sufficiency
levels of each basic cation.”
E.O. McLean, 1982
2. Emphasis should be placed on providing sufficient,
but non-excessive levels of each basic cation rather
than attempting to adjust to a favorable BCSR which
evidently does not exist.
McLean et al., 1983
A2809
http://cecommerce.uwex.edu/pdfs/A2809.PDF
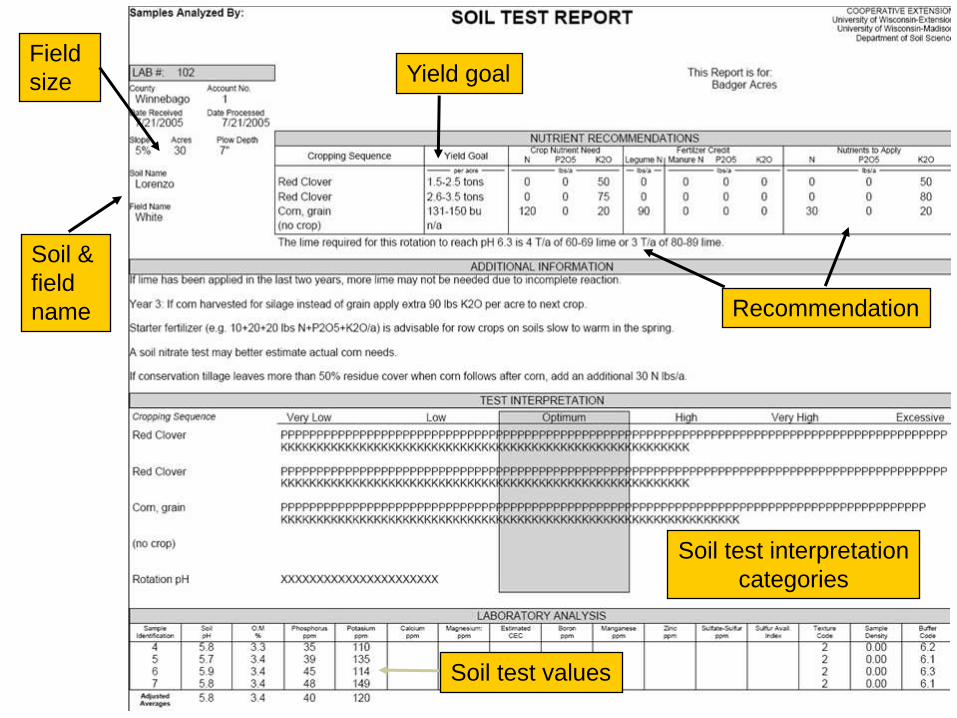
Soil &
field
name Recommendation
Soil test interpretation
categories
Yield goal
Soil test values
Field
size
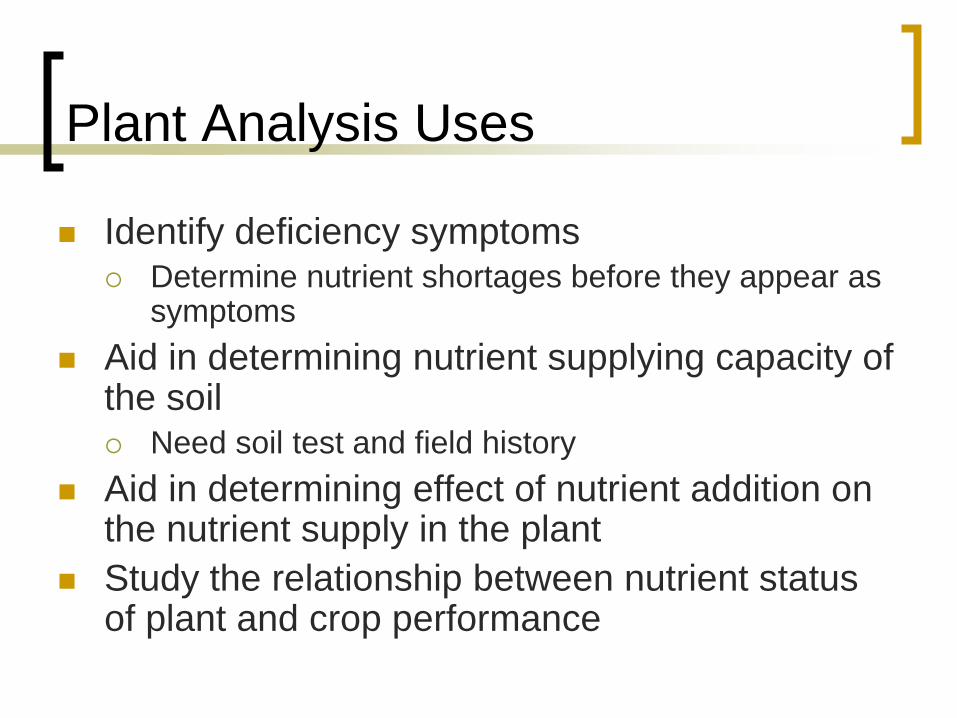
Plant Analysis Uses
Identify deficiency symptoms Determine nutrient shortages before they appear as
symptoms
Aid in determining nutrient supplying capacity of the soil Need soil test and field history
Aid in determining effect of nutrient addition on the nutrient supply in the plant
Study the relationship between nutrient status of plant and crop performance
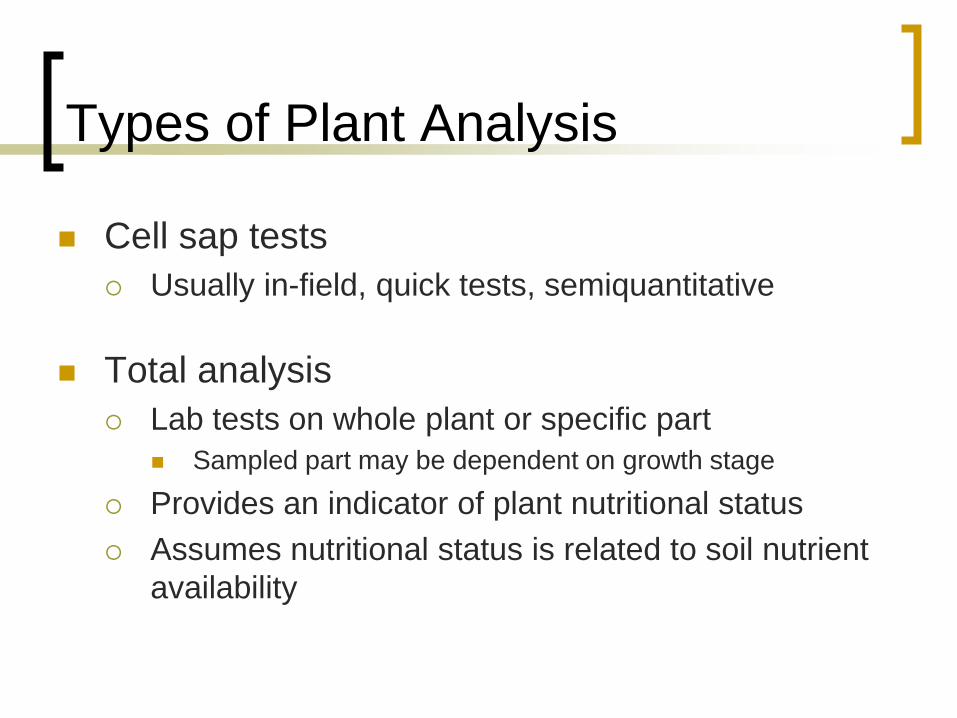
Types of Plant Analysis
Cell sap tests
Usually in-field, quick tests, semiquantitative
Total analysis
Lab tests on whole plant or specific part
Sampled part may be dependent on growth stage
Provides an indicator of plant nutritional status
Assumes nutritional status is related to soil nutrient
availability
Tissue Sampling
What to sample
When to sample
Sample handling
Refrigerated (kept cold)
Removal of contaminants (soil, dust,
fertilizer)
Interpretation
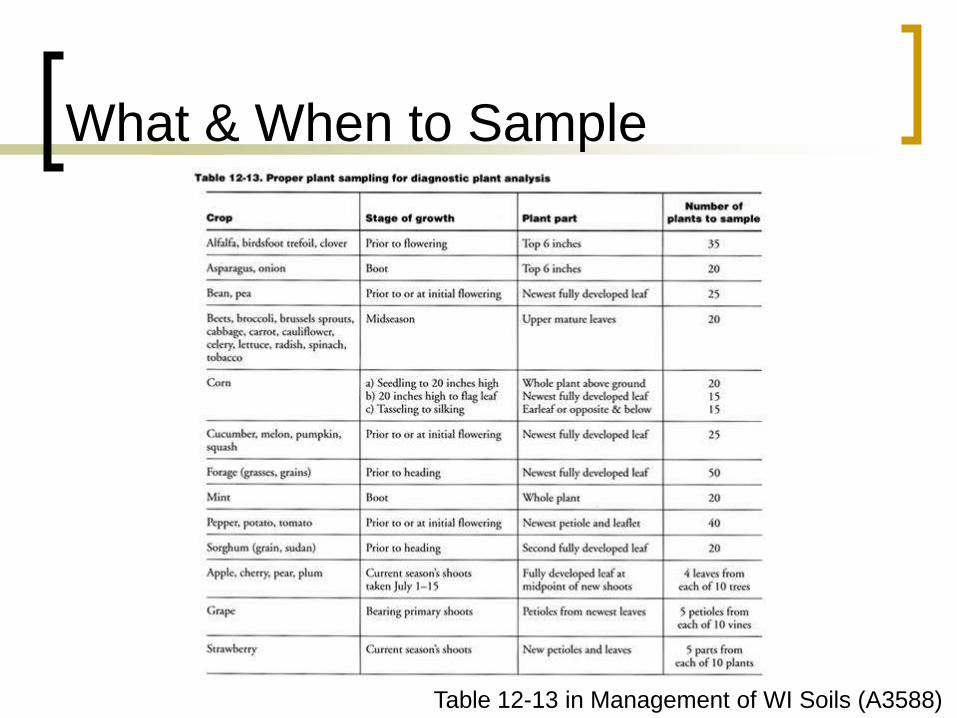
What & When to Sample
Table 12-13 in Management of WI Soils (A3588)
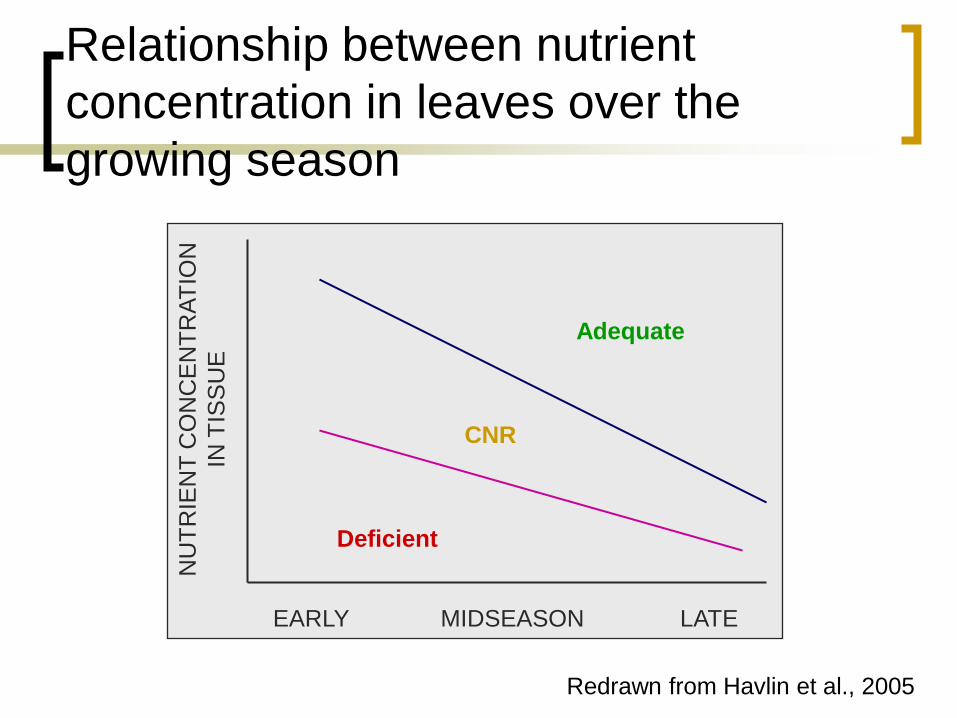
Relationship between nutrient
concentration in leaves over the
growing season
Redrawn from Havlin et al., 2005
EARLY LATEMIDSEASON
NU
TR
IEN
T C
ON
CE
NT
RA
TIO
N
IN T
ISS
UE
Adequate
CNR
Deficient
01020
30405060
708090
100
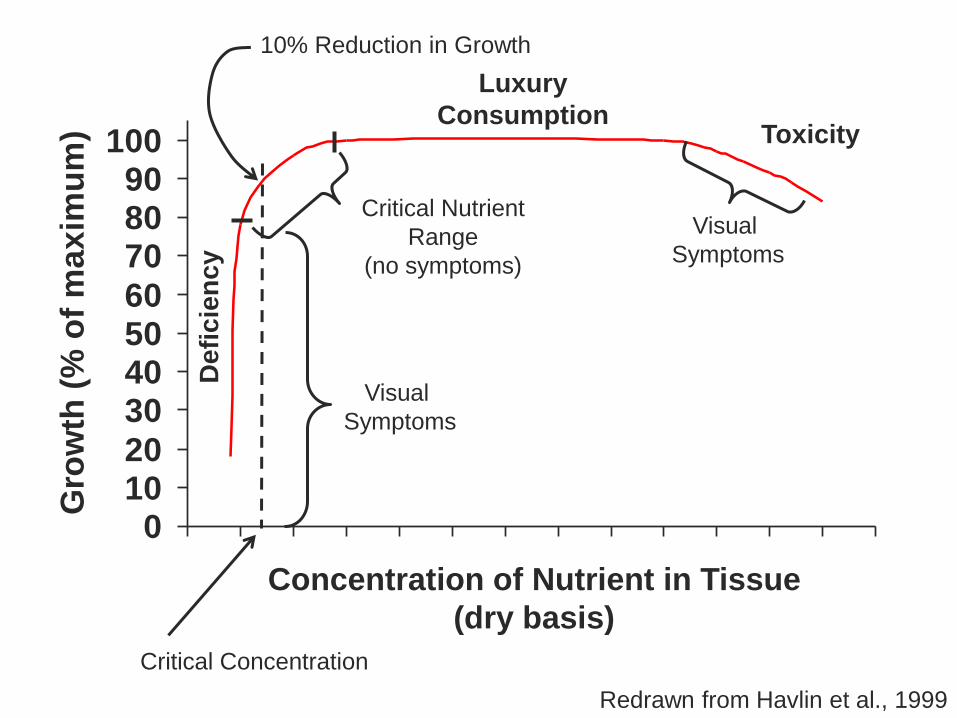
0 5 10 15 20 25 30 35 40 45 50 55 60 65
Gro
wth
(%
of
ma
xim
um
)Luxury
ConsumptionToxicity
Visual
Symptoms
De
fic
ien
cy
10% Reduction in Growth
Visual
Symptoms
Critical Nutrient
Range
(no symptoms)
Critical Concentration
Redrawn from Havlin et al., 1999
Concentration of Nutrient in Tissue
(dry basis)
Tissue Test Interpretation
Critical nutrient concentration ranges
(sufficiency ranges) Using Plant Analysis as a Diagnostic Tool
see New Horizons in Soil Science 2000
http://www.soils.wisc.edu/extension/publications/horizo
ns/index.htm
DRIS (Diagnostic & Recommendation Integrated System)
PASS (Plant Analysis with Standardized Scores)
Correction of deficiencies identified
with tissues tests may not be feasible
because:
Deficiency may have already caused yield loss
Crop may not respond at the growth stage tested
Crop may be too large for nutrient application
Weather may be unfavorable for fertilization and/or for crop to benefit
From Havlin et al., 2005
Using plant analysis to help
diagnose a field problem
Not a clear cut tool
Need to collect all the evidence:
Nutrient deficiency symptoms
Root growth patterns
Weather
Current field conditions
Field history
Tissue analysis
Soil analysis

Don’t Guess
Soil Test !