software applications in filter control, data acquisition and data analysis
TRANSCRIPT
This paper describes aspects of computer software use in filter apparatus
control and data acquisition and details a robust software procedure for
analysing cake filtration and consolidation data. It is shown how software can
be used to automate state-of-the-art laboratory scale leaf filters and piston
presses and facilitate the real-time display of parameters such as liquor transport rates and transient cake solids concentrations,, Typical expression
data from the piston press apparatus are used to illustrate an interactive
softvuare analysis procedure which uses basic experimental information
provided by the operator to calculate parameters which characterise a
separation; these include the specific cake resistance, voids ratio and
consolidation coefficient. Methods of overcoming the prolblems of data scatter
are highlighted along with the procedures used to provide expert guidance
during data analysis. The filtration and consolidation theories which underpin
the software are also briefly described to show how scale-up constants can be software derived for subsequent use in process simulations.
ES. Tarleton and R.J. Wakeman, Department of Chemical Engineering, Loughborough University, Lougbborough, Leics., LEll 3TU, UK.
(E-mail: E.S. Tarleton@Lb oro.ac. uk; R.J [email protected]. uk)
r: ,* Ax,.*, f the unit operations available to the process ;#‘” I_
” OA engineer, those associated with solid/liquid
If <<
‘: separation are perhaps the most difficult to :,* .:$ specify. Although a robust equipment selection &$$ &t:
““, :* *r <<,& ,$ procedure now exists ’ and detailed filter
design procedures are becoming available *, our lack of
fundamental understanding of suspension behaviour necessitates
recourse to laboratory and/or pilot plant tests in order to
establish parameters which characterise a separation; typical
apparati are either a leaf filter or piston press. The difficulties
associated with reliable data acquisition in filtration experiments
are well known and present considerable problems to the
separation technologist who is required to specify filtration plant.
Whilst theories for analysing cake filtration and consolidation are
both well established 2-4, their application is often ill-defined and
this creates further difficulties as variations in procedures
inevitably lead to errors.
The current work presents a philosophy which aims to provide
a co-ordinated approach to filter experimentation and data
analysis. It is argued that well instrumented and computer
software automated apparatus in conjunction with consistent
software aided analysis procedures allows the best opportunity to
acquire sufficient and accurate data for the correct simulation and
sizing of process scale filters.
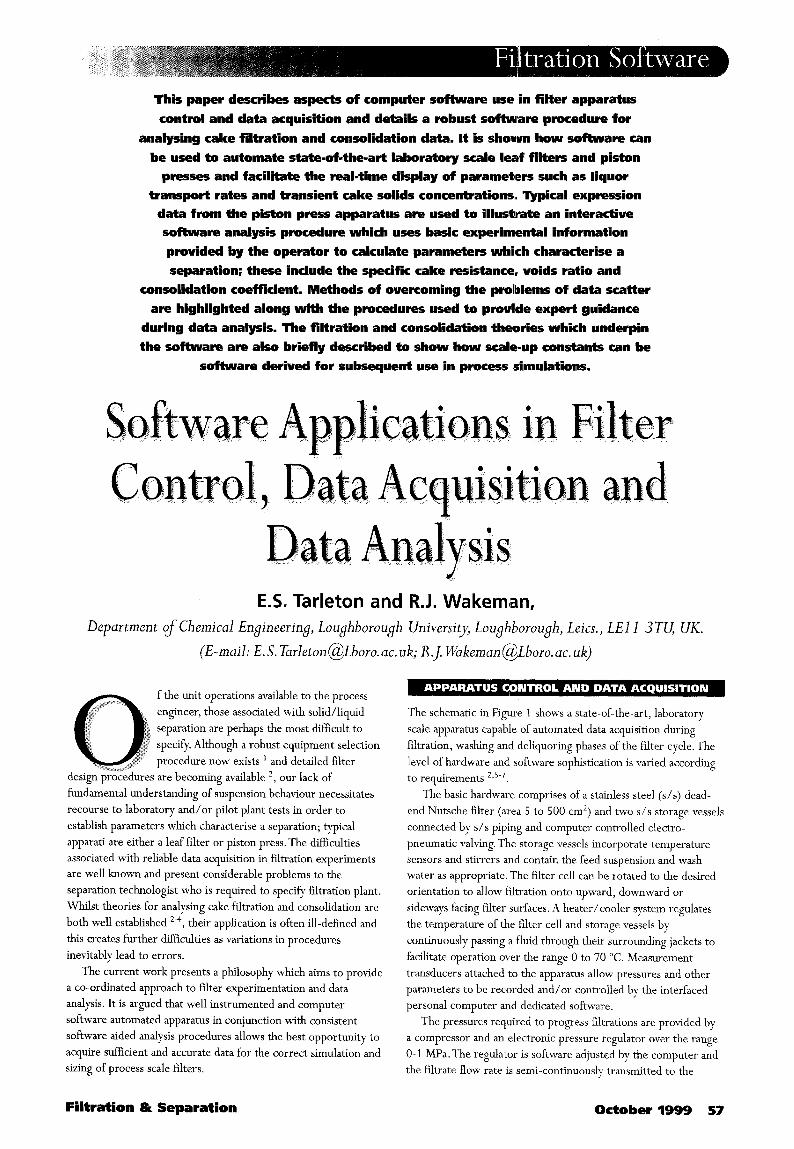
The schematic in Figure 1 shows a state-of-the-art, laboratory
scale apparatus capable of automated data acquisition during
filtration, washing and deliquoring phases of the filter cycle. The
level of hardware and software sophistication is varied according
to requirements 2,5-7.
The basic hardware comprises of a stainless steel (s/s) dead-
end Nutsche filter (area 5 to 500 cm*) and two s/s storage vessels
connected by s/s piping and computer controlled electro-
pneumatic valving. The storage vessels incorporate temperature
sensors and stirrers and contain the feed suspension and wash
water as appropriate. The filter cell can be rotated to the desired
orientation to allow filtration onto upward, downward or
sideways facing filter surfaces. A heater/cooler system regulates
the temperature of the filter cell and storage vessels by
continuously passing a fluid through their surrounding jackets to
facilitate operation over the range 0 to 70 “C. Measurement
transducers attached to the apparatus allow pressures and other
parameters to be recorded and/or controlled by the interfaced
personal computer and dedicated software.
Th e pressures required to progress filtrations are provided by
a compressor and an electronic pressure regulator over the range
0- 1 MPa. The regulator is software adjusted by the computer and
the filtrate flow rate is semi-continuously transmitted to the
Filtration & Separation October 1999 57
pressure I reaulator ,
Compressor -
I PT ii!? i I Valve / ;
controllers , I _ I I I I I
; ’ to valves I , I I I / 1 1
c--------------J ---------*--------------
computer via successive timed readings of mass from an
electronic balance. By monitoring the flow rate in such a manner,
use of a software control algorithm allows either constant
pressure, constant rate or variable pressure/variable rate filtration
to be performed without changing the suspension properties
through inappropriate pumping operations; the control algorithm
is based on the general form:
where p is the required pressure, p, is a constant, K is the
system gain, E is the flow error (i.e. required flow - measured
flow), t is time, zi is the integral time and 7d is the derivative
time. The rate and magnitude of the pressure adjustments is
dependent on the nature of the feed, the compressibility of the
filter cake and the desired process conditions.
The real time monitoring of cake growth rate and transient
changes in filter cake structure during filtration (and if required
solute concentration profiles in the cake during washing and/or
cake saturation profiles during deliquoring) is provided by series
of small electrodes fitted internally within the filter cell. The
electrodes which generally protrude a short distance into the cell
are arranged in single vertical planes or, if maximum data are
required, in sequences of horizontal rings. Signals to electrode
pairs are switched by the attached computer via software and
electronic circuitry to facilitate measurements.
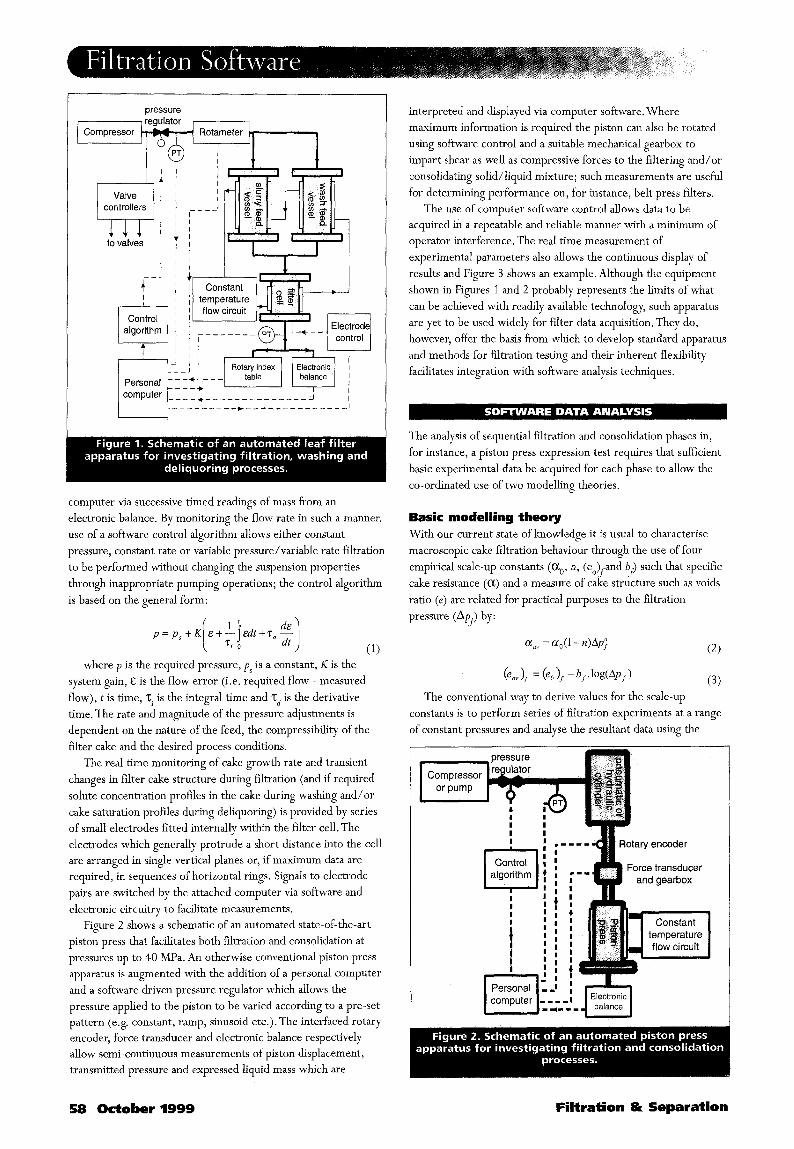
Figure 2 shows a schematic of an automated state-of-the-art
piston press that facilitates both filtration and consolidation at
pressures up to 40 MPa. An otherwise conventional piston press
apparatus is augmented with the addition of a personal computer
and a software driven pressure regulator which allows the
pressure applied to the piston to be varied according to a preset
pattern (e.g. constant, ramp, sinusoid etc.). The interfaced rotary
encoder, force transducer and electronic balance respectively
allow semi-continuous measurements of piston displacement, transmitted pressure and expressed liquid mass which are
interpreted and displayed via computer software. Where
maximum information is required the piston can also be rotated
using software control and a suitable mechanical gearbox to
impart shear as well as compressive forces to the filtering and/or
consolidating solid/liquid mixture; such measurements are useful
for determining performance on, for instance, belt press filters.
The use of computer software control allows data to be
acquired in a repeatable and reliable manner with a minimum of
operator interference. The real time measurement of
experimental parameters also allows the continuous display of
results and Figure 3 shows an example. Although the equipment
shown in Figures 1 and 2 probably represents the limits of what
can be achieved with readily available technology, such apparatus
are yet to be used widely for filter data acquisition. They do,
however, offer the basis from which to develop standard apparatus
and methods for filtration testing and their inherent flexibility
facilitates integration with software analysis techniques.
The analysis of sequential filtration and consolidation phases in,
for instance, a piston press expression test requires that sufficient
basic experimental data be acquired for each phase to allow the
co-ordinated use of two modelling theories.
Basic modelling theory With our current state of knowledge it is usual to characterise
macroscopic cake filtration behaviour through the use of four
empirical scale-up constants (a,, n, (e ) and b ) such that specific of f cake resistance (a) and a measure of cake structure such as voids
ratio (e) are related for practical purposes to the filtration
pressure (Apf) by:
a,” =a,(l-n)Ap; (2)
(e,, If = 6, >, - b, lo&k, 1 (3)
The conventional way to derive values for the scale-up
constants is to perform series of filtration experiments at a range
of constant pressures and analyse the resultant data using the
pressure
Rotary encoder
Force transducer and gearbox
Constant u-l temperature flow circuit
58 October 1999 Filtration & Separation
general filtration equation where the filtration time (9) and where C, is a constant obtained by combination with eqn. (9)
cumulative volume of filtrate (5) are related by: and equal to (2i / W, UC, ia .
t/ “a”w~ -= V/ 2A2Ap,~-s(l+(e~“)/Co/p,
(4) where /L is the filtrate viscosity, s is the solids mass fraction in
the feed, A is the filter area, p and p, are the filtrate and solids
densities respectively and Rm is the filter medium resistance.
When necessary, the changing cake thickness (h) can also be
theoretically related to the volume of filtrate by:
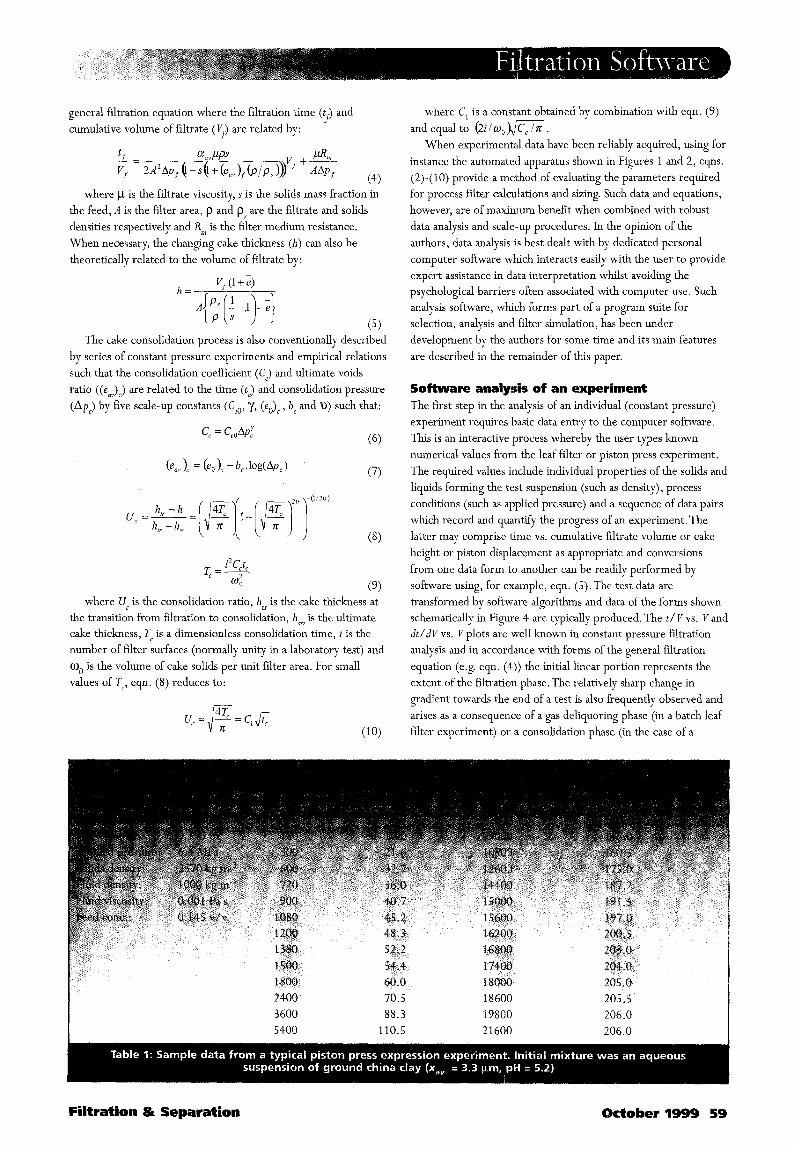
When experimental data have been reliably acquired, using for
instance the automated apparatus shown,in Figures 1 and 2, eqns.
(2)-( IO) provide a method of evaluating the parameters required
for process filter calculations and sizing. Such data and equations,
however, are of maximum benefit when combined with robust
data analysis and scale-up procedures. In the opinion of the
authors, data analysis is best dealt with by dedicated personal
computer software which interacts easily with the user to provide
expert assistance in data interpretation whilst avoiding the
psychological barriers often associated with computer use. Such
analysis software, which forms part of a program suite for
selection, analysis and filter simulation, has been under
development by the authors for some time and its main features
are described in the remainder of this paper.
The cake consolidation process is also conventionally described
by series of constant pressure experiments and empirical relations
such that the consolidation coefficient (C,) and ultimate voids
ratio ((Ed”),) are related to the time (t,) and consolidation pressure
(Ap,) by five scale-up constants (CeO, y, (eJc, bc and U) such that:
Cc = C&P: (6)
(e,, 1, = (e,), -b,. log(bp, 1 (7)
T,= PC t
-F % (9)
where U, is the consolidation ratio, htr is the cake thickness at
the transition from filtration to consolidation, h_ is the ultimate
cake thickness, 7, is a dimensionless consolidation time, i is the
number of filter surfaces (normally unity in a laboratory test) and
ci), is the volume of cake solids per unit filter area. For small
values of Tc, eqn. (8) reduces to:
Sofhware analysis of an experiment The first step in the analysis of an individual (constant pressure)
experiment requires basic data entry to the computer software.
This is an interactive process whereby the user types known
numerical values from the leaf filter or piston press experiment.
The required values include individual properties of the solids and
liquids forming the test suspension (such as density), process
conditions (such as applied pressure) and a sequence of data pairs
which record and quantify the progress of an experiment. The
latter may comprise time vs. cumulative filtrate volume or cake
height or piston displacement as appropriate and conversions
from one data form to another can be readily performed by
software using, for example, eqn. (5). The test data are
transformed by software algorithms and data of the forms shown
schematically in Figure 4 are typically produced. The t/ Y vs. V and
dt/dV vs. V plots are well known in constant pressure filtration
analysis and in accordance with forms of the general filtration
equation (e.g. eqn. (4)) the initial linear portion represents the
extent of the filtration phase. The relatively sharp change in
gradient towards the end of a test is also frequently observed and
arises as a consequence of a gas deliquoring phase (in a batch leaf
filter experiment) or a consolidation phase (in the case of a
1800 60.0 I8000 205 .O
2400 70.5 18600 205.5
3600 88.3 19800 206.0
Filtration & Separation October 1999 59
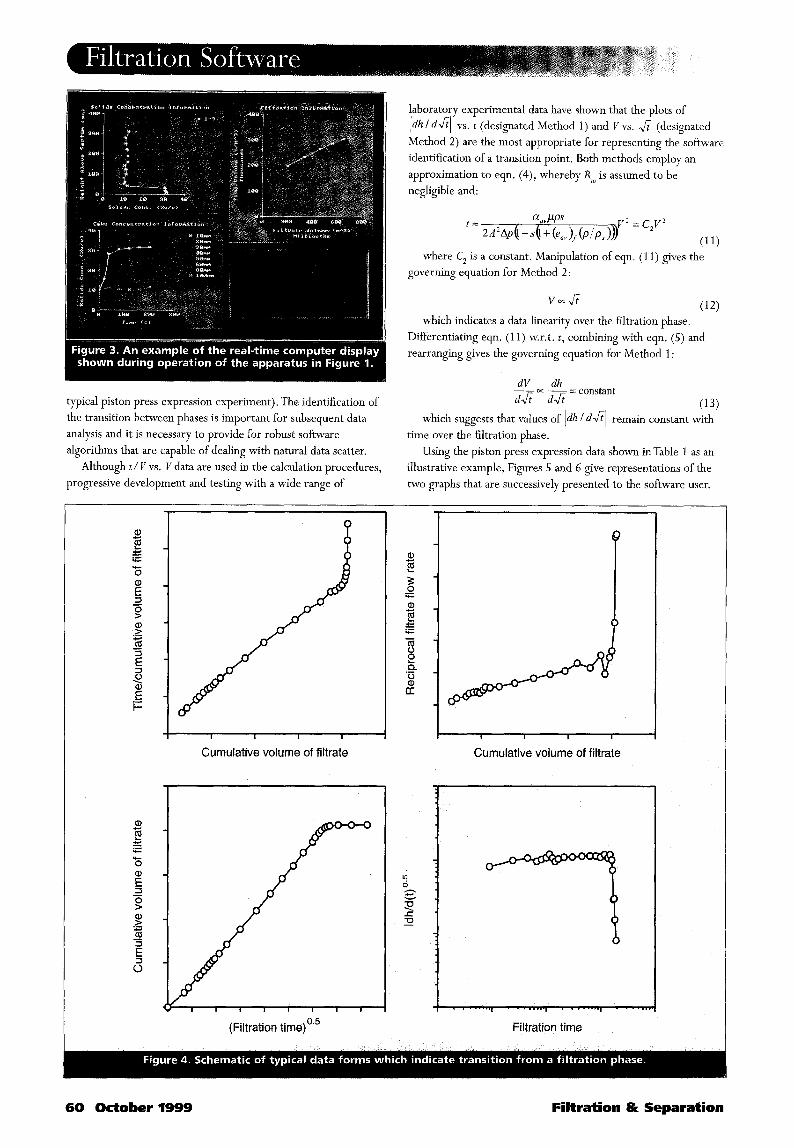
tpical piston press expression experiment). The identification of
the transition between phases is important for subsequent data
analysis and it is necessary to provide for robust software
algorithms that are capable of dealing with natural data scatter.
Although t/ V vs. Y data are used in the calculation procedures,
progressive development and testing with a wide range of
I I I I I I
Cumulative volume of filtrate
laboratory experimental data have shown that the plots of
ldh / d&l vs. t (designated Method 1) and V vs. & (designated Method 2) are the most appropriate for representing the software
identification of a transition point. Both methods employ an
approximation to eqn. (4), whereby Rm is assumed to be
negligible and:
where C2 is a constant. Manipulation of eqn. (11) gives the
governing equation for Method 2 :
which indicates a data linearity over the filtration phase.
Differentiating eqn. (11) w.r.t. t, combining with eqn. (5) and
rearranging gives the governing equation for Method 1:
YE = -@L = constant dth d&
which suggests that values of jdh /d&l remain constant 4:)
time over the filtration phase.
Using the piston press expression data shown in Table 1 as an
illustrative example, Figures 5 and 6 give representations of the
two graphs that are successively presented to the software user.
(Filtration time)0’5
Cumulative volume of filtrate
I . . . . . . ‘ . I . . “ “ . . I . . -..+
Filtration time
60 October 1999 Filtration & Separation
Tim
e/cu
mul
ative
vo
lum
e of
filt
rate
(s
mm
3)
Cum
ulat
ive
volu
me
of f
iltra
te W
)
0 b 00
Idh/
d(t)
0.51
(m s
-0 5
)
P
9 8
0
0 8
5:
I I
I
inte
ract
ive
curs
or
0 c
0
$ 0 0 0 0
Estim
ates
of
tran
sitio
n .--
6--a
---
--
f - i
nter
activ
e cw
*or
8 0 =!
2 22
8 I
8
Cons
olid
atio
n ra
tio
(-)
Cons
olid
atio
n ra
tio (
-) Co
nsol
idat
ion
ratio
(-)
0
0
Estim
ate
for
the
exte
nt
0
of th
e lin
ear
porti
on
0 ---
---_
0
Inte
racti
ve
curso
r
0 0
t
2 moisture content: moisture cantent: Final ratio mass wet/dry cake: Final ratio mass wet/dry cake: Final mass dry cake/filter area: 71.9 kg m* Final volume solids/filter area: 0.0280 m
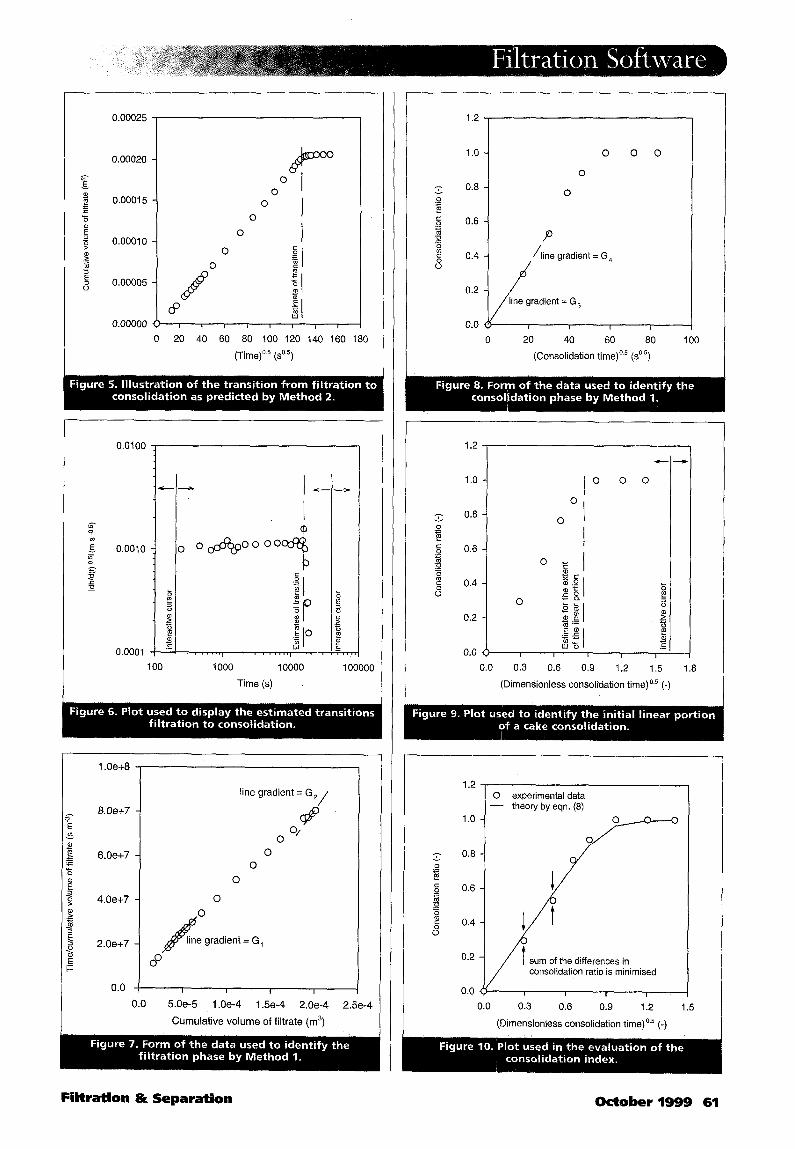
The first, a plot of V vs. & , is employed purely as an alternative
illustration of the position for the transition from filtration to
consolidation as predicted by Method 2. To identify the transition,
the software utilises the property of ideal linearity during the
filtration phase and performs a series of least square regressions.
These commence from an initial choice of three V vs. fi data
pairs at a smaller elapsed time and finish with a calculation using
all the available data pairs; the gradient of the regressed line being
recorded in each case. The sequence of gradients is examined by
the software and the time (t,) corresponding to the phase transi-
tion is identified from a position in the dataset (designated Gn,)
where three successive falls in gradient are recorded such that
t, = 0.$(t),,-, + @lnle3) where nl is a counter.
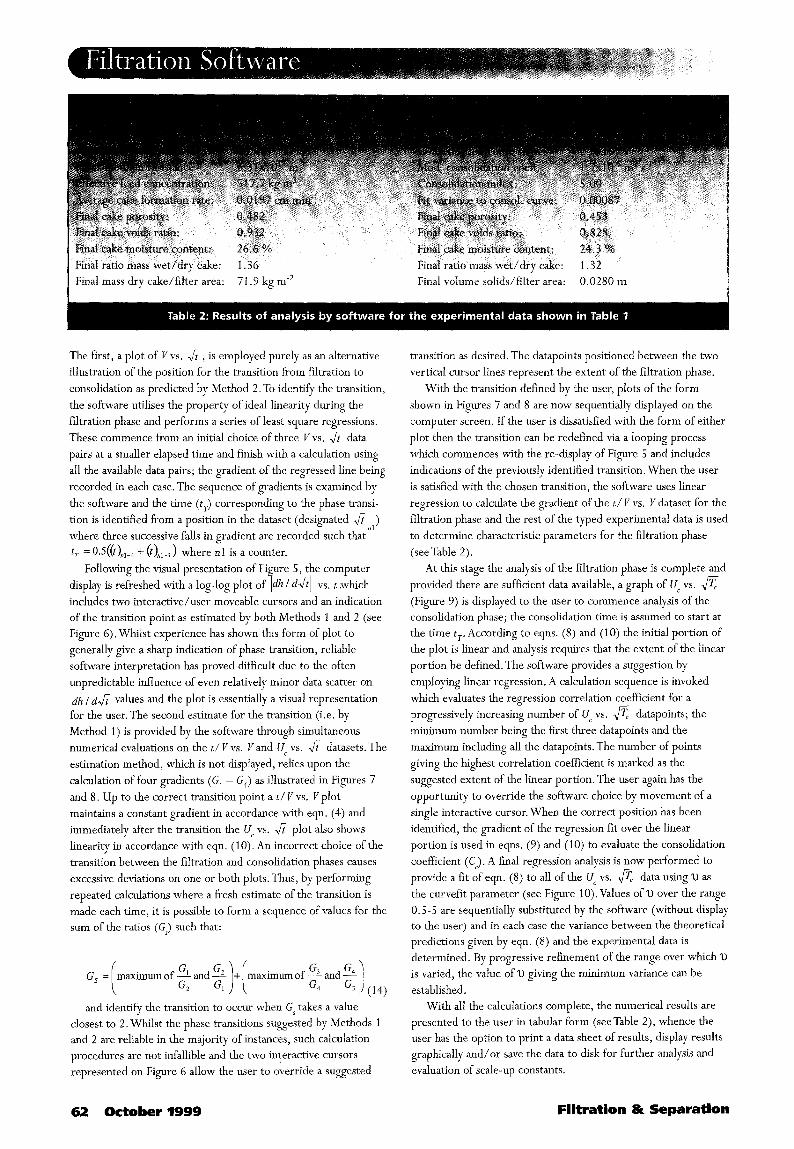
Following the visual presentation of Fi
bi
ure 5, the computer
display is refreshed with a log-log plot of dh / d&l vs. t .svhich
includes two interactive/user moveable cursors and an indication
of the transition point as estimated by both Methods 1 and 2 (see
Figure 6). Whilst experience has shown this form of plot to
generally give a sharp indication of phase transition, reliable
software interpretation has proved difficult due to the often
unpredictable influence of even relatively minor data scatter on
dh / d& values and the plot is essentially a visual representation
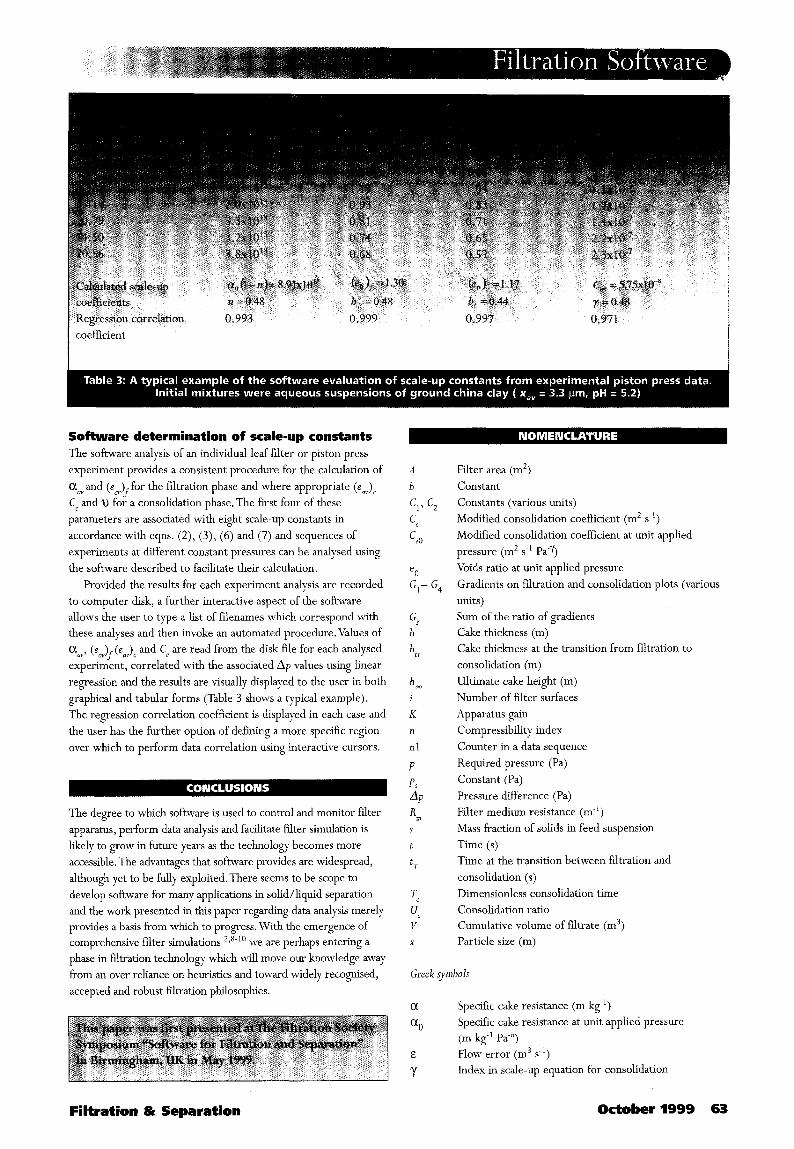
for the user. The second estimate for the transition (i.e. by
Method 1) is provided by the software through simultaneous
numerical evaluations on the t/ V vs. V and U, vs. & datasets. The
estimation method, which is not displayed, relies upon the
calculation of four gradients (G, - GJ as illustrated in Figures 7
and 8, Up to the correct transition point a t/ V vs. li plot
maintains a constant gradient in accordance with eqn. (4) and
immediately after the transition the U, vs. Ji plot also shows
linearity in accordance with eqn. (10). An incorrect choice of the
transition between the filtration and consolidation phases causes
excessive deviations on one or both plots. Thus, by performing
repeated calculations where a fresh estimate of the transition is
made each time, it is possible to form a sequence of values for the
sum of the ratios (G,) such that:
G, = maximum of 2 and $ 2 1
maximum of $ and 4
and identify the transition to occur when GS takes a value
closest to 2. Whilst the phase transitions suggested by Methods 1
and 2 are reliable in the majority of instances, such calculation procedures are not infallible and the two interactive cursors
represented on Figure 6 allow the user to override a suggested
62 October 1999
transition as desired. The datapoints positioned between the two
vertical cursor lines represent the extent of the filtration phase.
With the transition defined by the user, plots of the form
shown in Figures 7 and 8 are now sequentially displayed on the
computer screen. If the user is dissatisfied with the form of either
plot then the transition can be redefined via a looping process
which commences with the re-display of Figure 5 and includes
indications of the previously identified transition. When the user
is satisfied with the chosen transition, the software uses linear
regression to calculate the gradient of the t/ V vs. V dataset for the
filtration phase and the rest of the typed experimental data is used
to determine characteristic parameters for the filtration phase
(seeTable 2).
At this stage the analysis of the filtration phase is complete and
provided there are sufficient data available, a graph of U, vs. &
(Figure 9) is displayed to the user to commence analysis of the
consolidation phase; the consolidation time is assumed to start at
the time tr. According to eqns. (8) and (10) the initial portion of
the plot is linear and analysis requires that the extent of the linear
portion be defined. The software provides a suggestion by
employing linear regression. A calculation sequence is invoked
which evaluates the regression correlation coefficient for a
progressively increasing number of U, vs. fi datapoints; the
minimum number being the first three datapoints and the
maximum including all the datapoints. The number of points
giving the highest correlation coefficient is marked as the
suggested extent of the linear portion. The user again has the
opportunity to override the software choice by movement of a
single interactive cursor. When the correct position has been
identified, the gradient of the regression fit over the linear
portion is used in eqns. (9) and (10) to evaluate the consolidation
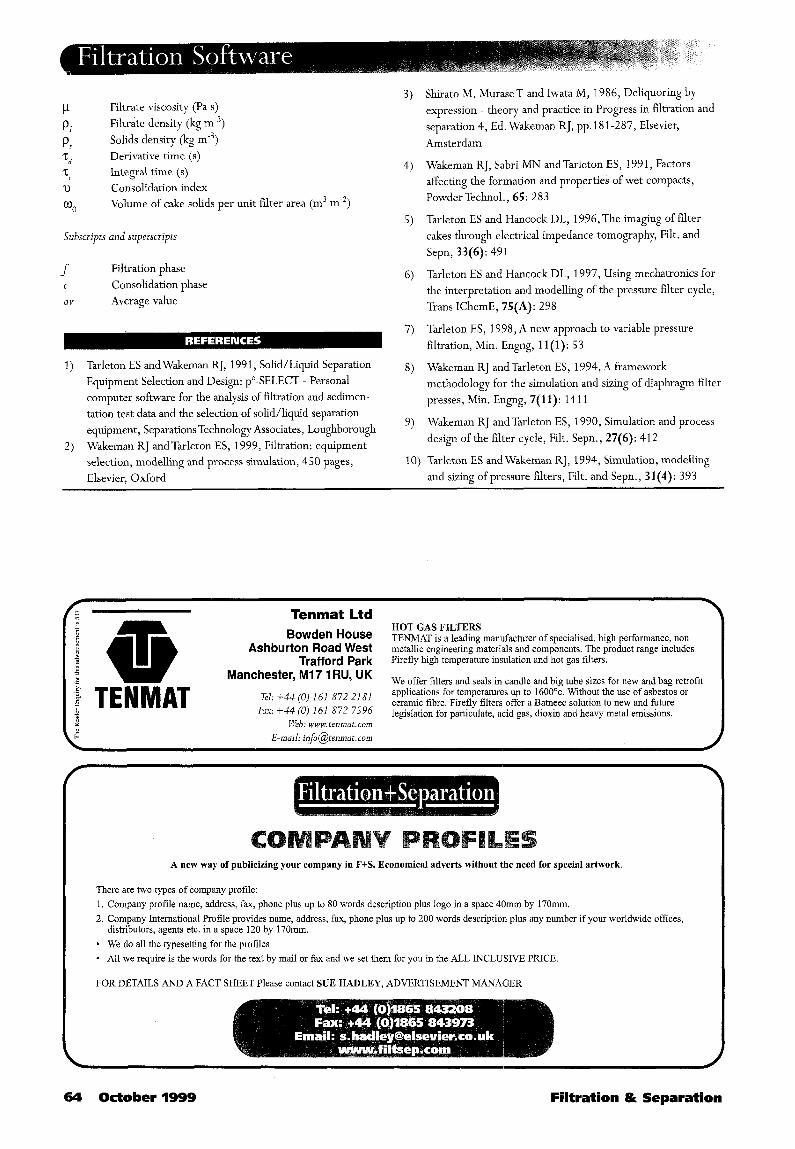
coefficient (C,). A final regression analysis is now performed to
provide a fit of eqn. (8) to all of the UC vs. fi data using 2) as
the curvefit parameter (see Figure 10). Values of 2) over the range
0.5-S are sequentially substituted by the software (without display
to the user) and in each case the variance between the theoretical
predictions given by eqn. (8) and the experimental data is
determined. By progressive refinement of the range over which 2)
is varied, the value of 2) giving the minimum variance can be
established. With all the calculations complete, the numerical results are
presented to the user in tabular form (see Table 2), whence the
user has the option to print a data sheet of results, display results
graphically and/or save the data to disk for further analysis and
evaluation of scale-up constants.
Filtration & Separation
1 Regression correlation
Sofhware determination of scale-up constants The software analysis of an individual leaf filter or piston press
experiment provides a consistent procedure for the calculation of
aa” and (eOv)s for the filtration phase and where appropriate (ear,)c
Cc and 2) for a consolidation phase. The first four of these
parameters are associated with eight scale-up constants in
accordance with eqns. (2), (3), (6) and (7) and sequences of
experiments at different constant pressures can be analysed using
the software described to facilitate their calculation.
Provided the results for each experiment analysis are recorded
to computer disk, a further interactive aspect of the software
allows the user to type a list of filenames which correspond with
these analyses and then invoke an automated procedure. Values of
aOv, (eOv)f (eav)c and Cc are read from the disk file for each analysed
experiment, correlated with the associated Ap values using linear
regression and the results are visually displayed to the user in both
graphical and tabular forms (Table 3 shows a typical example).
The regression correlation coefficient is displayed in each case and
the user has the further option of defining a more specific region
over which to perform data correlation using interactive cursors.
The degree to which software is used to control and monitor filter
apparatus, perform data analysis and facilitate filter simulation is
likely to grow in future years as the technology becomes more
accessible. The advantages that software provides are widespread,
although yet to be fully exploited. There seems to be scope to
develop software for many applications in solid/liquid separation
and the work presented in this paper regarding data analysis merely
provides a basis from which to progress. With the emergence of
comprehensive filter simulations 2,8-1o we are perhaps entering a
phase in filtration technology which will move our knowledge away
from an over reliance on heuristics and toward widely recognised,
accepted and robust filtration philosophies.
Filtration & Separation
A
b
Cl, 5
Cc C
e0
e0
G,- G4
cs h
h tr
T,
UC V
x
Filter area (m*)
Constant
Constants (various units)
Modified consolidation coefficient (m2 s-t)
Modified consolidation coefficient at unit applied
pressure (m* s-’ PaeY)
Voids ratio at unit applied pressure
Gradients on filtration and consolidation plots (various
units)
Sum of the ratio of gradients
Cake thickness (m)
Cake thickness at the transition from filtration to
consolidation (m)
Ultimate cake height (m)
Number of filter surfaces
Apparatus gain
Compressibility index
Counter in a data sequence
Required pressure (Pa)
Constant (Pa)
Pressure difference (Pa)
Filter medium resistance (m-l)
Mass fraction of solids in feed suspension
Time (s) Time at the transition between filtration and
consolidation (s)
Dimensionless consolidation time
Consolidation ratio
Cumulative volume of filtrate (m3)
Particle size (m)
Greek symbols
a Specific cake resistance (m kg-‘)
a0 Specific cake resistance at unit applied pressure
(m kg-’ Pa-“)
E Flow error (m3 s-l)
Y Index in scale-up equation for consolidation
October 1999 63
P Filtrate viscosity (Pa s)
Pl Filtrate density (kg mm3)
P5 Solids density (kg m-3)
2, Derivative time (s)
=I Integral time (s)
2) Consolidation index
00 Volume of cake solids per unit filter area (m3 mm*)
Subscripts and superscripts
f Filtration phase
c Consolidation phase
(I” Average value
1) Tarleton ES andwakeman RJ, 1991, Solid/Liquid Separation
Equipment Selection and Design: pC-SELECT - Personal computer software for the analysis of filtration and sedimen-
tation test data and the selection of solid/liquid separation
equipment, Separations Technology Associates, Loughborough
2) Wakeman RJ and Tarleton ES, 1999, Filtration: equipment
selection, modelling and process simulation, 450 pages,
Elsevier, Oxford
4)
5)
6)
Shirato M, Murase T and Iwata M, 1986, Deliquoring by
expression theory and practice in Progress in filtration and
separation 4, Ed. Wakeman RJ, pp. 18 l-287, Elsevier,
Amsterdam
Wakeman RJ, Sabri MN and Tarleton ES, 199 1, Factors
affecting the formation and properties of wet compacts,
Powder Technol., 65: 283
Tarleton ES and Hancock DL, 1996,The imaging of filter
cakes through electrical impedance tomography, Filt. and
Sepn, 33(6): 491
Tarleton ES and Hancock DL, 1997, Using mechatronics for
the interpretation and modelling of the pressure filter cycle,
Trans IChemE, 75(A): 298
Tarleton ES, 1998, A new approach to variable pressure
filtration, Min. Engng, 1 l(1): 53
Wakeman RJ and Tarleton ES, 1994, A framework
methodology for the simulation and sizing of diaphragm filter
presses, Min. Engng, 7(11): 1411
Wakeman RJ andTarleton ES, 1990, Simulation and process
design of the filter cycle, Filt. Sepn., 27(6): 412
10) Tarleton ES and Wakeman RJ, 1994, Simulation, modelling
and sizing of pressure filters, Filt. and Sepn., 31(4): 393
f R Tenmat Ltd ii 3 g
: T
Bowden House HOT GAS FILTERS TENMAT is a leading manufacturer of specialised, high performance, non
: Ashburton Road West metallic engineering materials and components. The product range includes 1 Trafford Park Firefly high temperature insulation and hot gas filters. c_ $ V Manchester, Ml7 1 RU, UK
f TENMAT We offer filters and seals in candle and big tube sizes for new and bag retrofit
7eI: i-44 (0) 161 872 2181 applications for temperatures up to 1600”~. Without the use of asbestos or
2 Fax: i-44 (0) 161 872 7596 ceramic fibre. Firefly filters offer a Batneec solution to new and future
1 legislation for particulate, acid gas, dioxin and heavy metal emissions. Web: ww. tenmat. corn
2 I- \
E-mail: [email protected] /
/ \
A new way of publicizing your company in F+S. Economical adverts without the need for special artwork.
There are two types of company profile: 1. Company profile name, address, fax, phone plus up to 80 words description plus logo in a space 4Omm by 170mm.
2. Company International Profile provides name, address, fax, phone plus up to 200 words description plus any number if your worldwide of&es, distributors, agents etc. in a space 120 by 170mm.
l We do all the typesetting for the profiles - All we require is the words for the text by mail or fax and we set them for you in the ALL INCLUSIVE PRICE.
FOR DETAILS AND A FACT SHEET Please contact SUE HADLEY ADVERTISEMENT MANAlGER
64 October 1999 Filtration & Separation