soda ash & derivatives resilient cash generator for solvay
TRANSCRIPT
Capital Markets Day June 10-11 2015
Soda Ash & Derivatives Resilient cash generator for Solvay
Christophe Clémente President, Soda Ash & Derivatives
Soda Ash & Derivatives Resilient cash generator for Solvay
June 10-11, 2015
Capital Markets Day 2
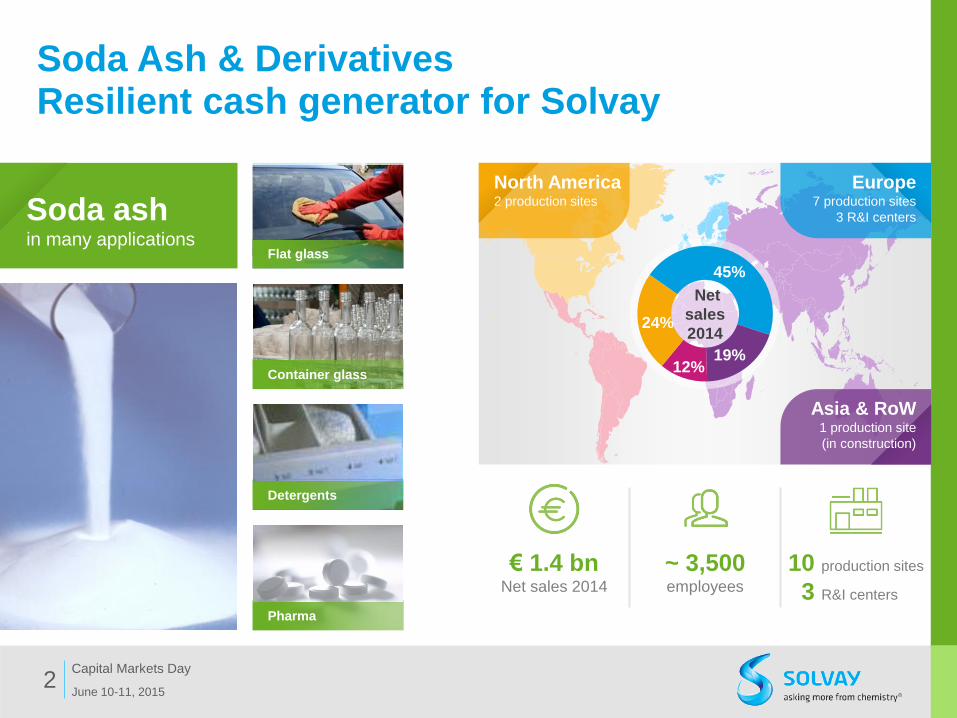
Pharma
Container glass
Flat glass
Detergents
Net
sales
2014
Europe 7 production sites
3 R&I centers
North America 2 production sites
Asia & RoW 1 production site
(in construction)
45%
19% 12%
24%
€ 1.4 bn Net sales 2014
~ 3,500 employees
10 production sites
3 R&I centers
Soda ash in many applications
Building & Construction
Building & Construction
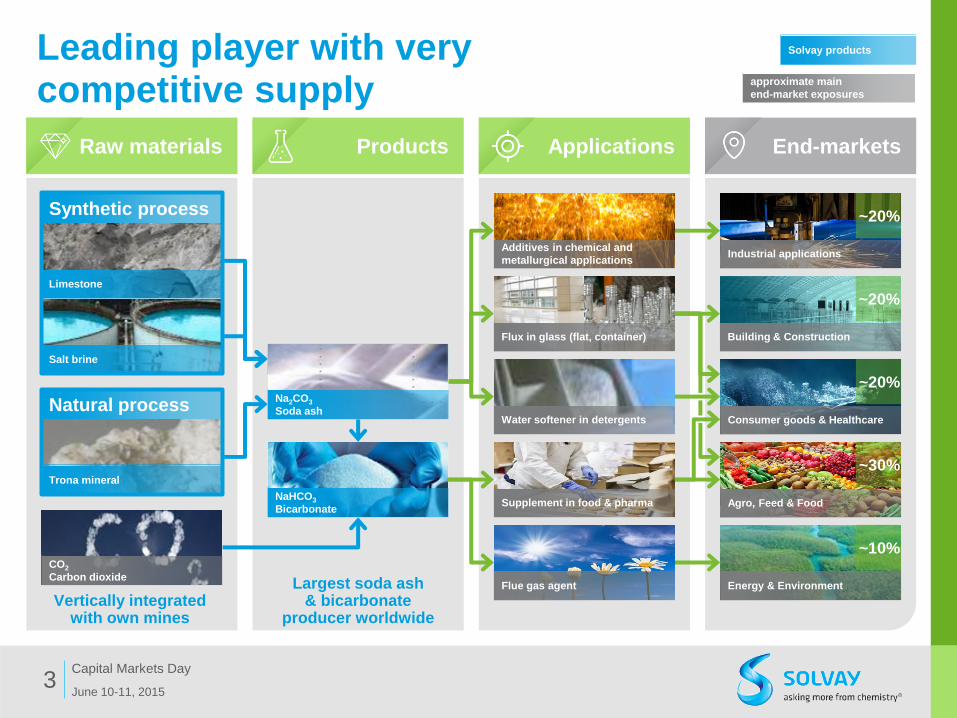
Leading player with very competitive supply
June 10-11, 2015
Capital Markets Day 3
Synthetic process
Vertically integrated with own mines
Largest soda ash & bicarbonate
producer worldwide
CO2
Carbon dioxide
Limestone
Salt brine
NaHCO3
Bicarbonate
Industrial applications
Building & Construction
Consumer goods & Healthcare
Agro, Feed & Food
Energy & Environment
Flux in glass (flat, container)
Water softener in detergents
Supplement in food & pharma
Flue gas agent
Additives in chemical and
metallurgical applications
~20%
~20%
~20%
~30%
~10%
Solvay products
approximate main
end-market exposures
Trona mineral
Raw materials Products Applications End-markets
Natural process
Na2Co3
Soda ash
Na2CO3
Soda ash
54 mt/yr
31 mt/yr
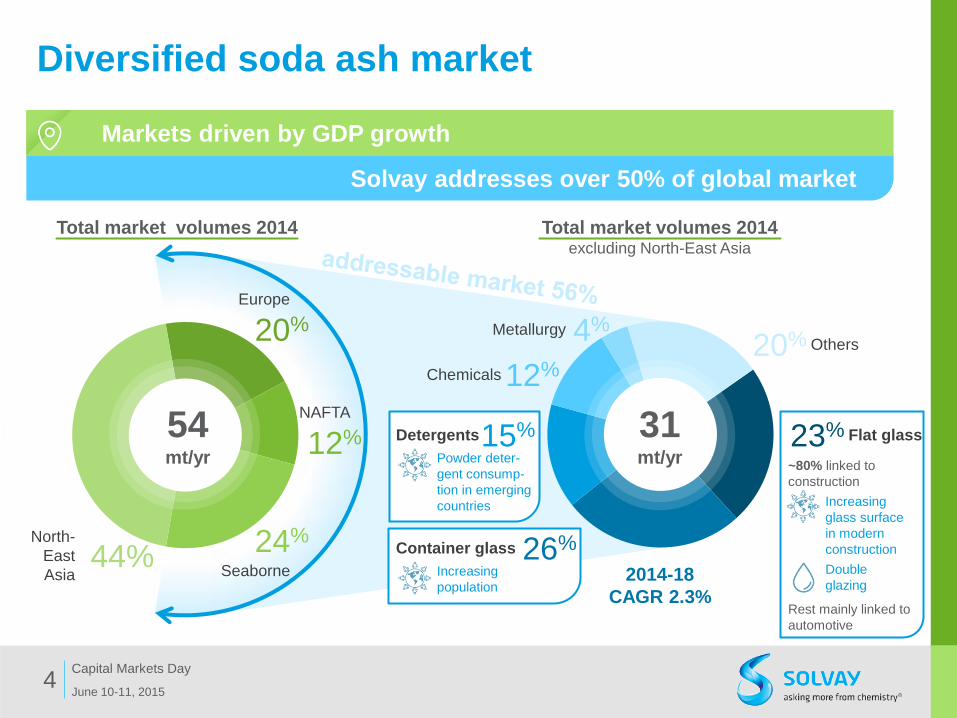
Diversified soda ash market
June 10-11, 2015
Capital Markets Day 4
Others 20% Metallurgy 4%
Chemicals 12%
Detergents 15%
20%
~80% linked to
construction
Increasing
glass surface
in modern
construction
Double
glazing
Rest mainly linked to
automotive
Powder deter-
gent consump-
tion in emerging
countries
Solvay addresses over 50% of global market
Total market volumes 2014 excluding North-East Asia
Markets driven by GDP growth
North-
East
Asia 44%
Seaborne
24%
NAFTA
12% Flat glass 23%
Europe
Container glass
Increasing
population
26%
Total market volumes 2014
2014-18
CAGR 2.3%
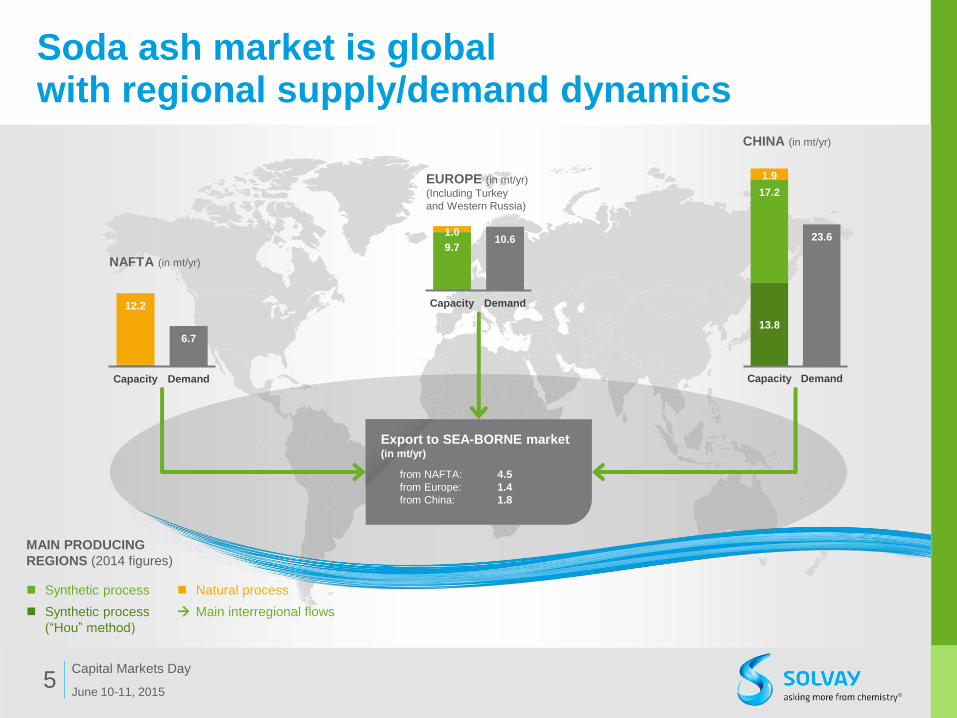
Soda ash market is global with regional supply/demand dynamics
June 10-11, 2015
Capital Markets Day 5
12.2
6.7
Capacity Demand
NAFTA (in mt/yr)
9.7
1.0 10.6
Capacity Demand
EUROPE (in mt/yr)
(Including Turkey
and Western Russia)
CHINA (in mt/yr)
13.8
17.2
1.9
23.6
Capacity Demand
Export to SEA-BORNE market (in mt/yr)
from NAFTA: 4.5
from Europe: 1.4
from China: 1.8
Synthetic process
Synthetic process
(“Hou” method)
Natural process
Main interregional flows
MAIN PRODUCING
REGIONS (2014 figures)
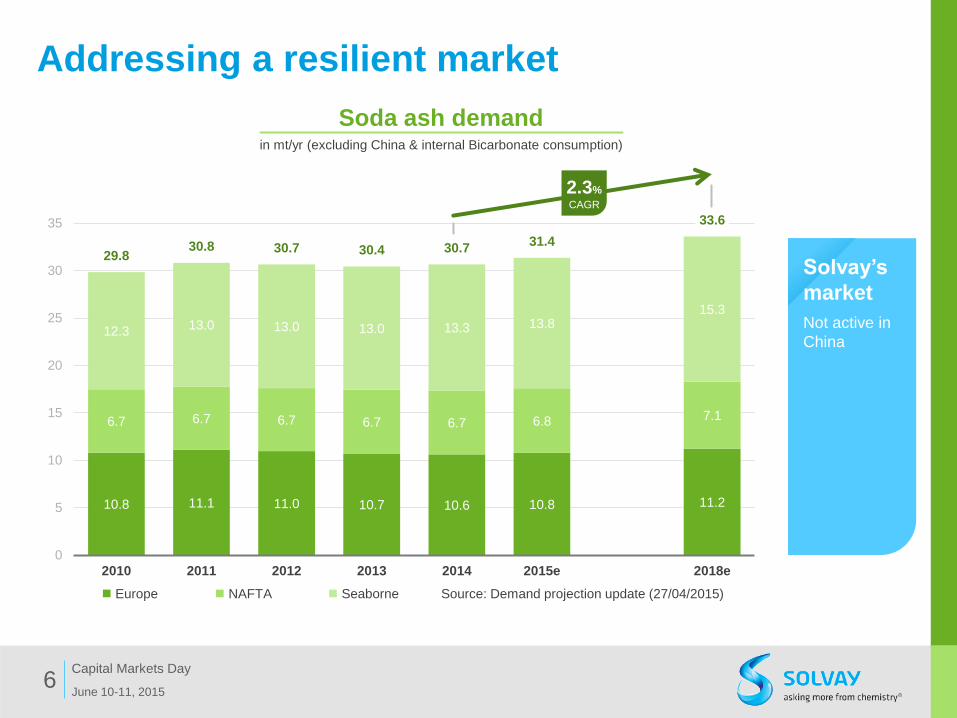
Addressing a resilient market
June 10-11, 2015
Capital Markets Day 6
10.8 11.1 11.0 10.7 10.6 10.8 11.2
6.7 6.7 6.7 6.7 6.7 6.8 7.1
12.3 13.0 13.0 13.0 13.3 13.8 15.3
29.8 30.8 30.7 30.4 30.7
31.4
33.6
0
5
10
15
20
25
30
35
2010 2011 2012 2013 2014 2015e 2018e
Source: Demand projection update (27/04/2015)
Soda ash demand in mt/yr (excluding China & internal Bicarbonate consumption)
Europe NAFTA Seaborne
2.3%
CAGR
Solvay’s
market
Not active in
China
Potential
expansion plans
in Turkey
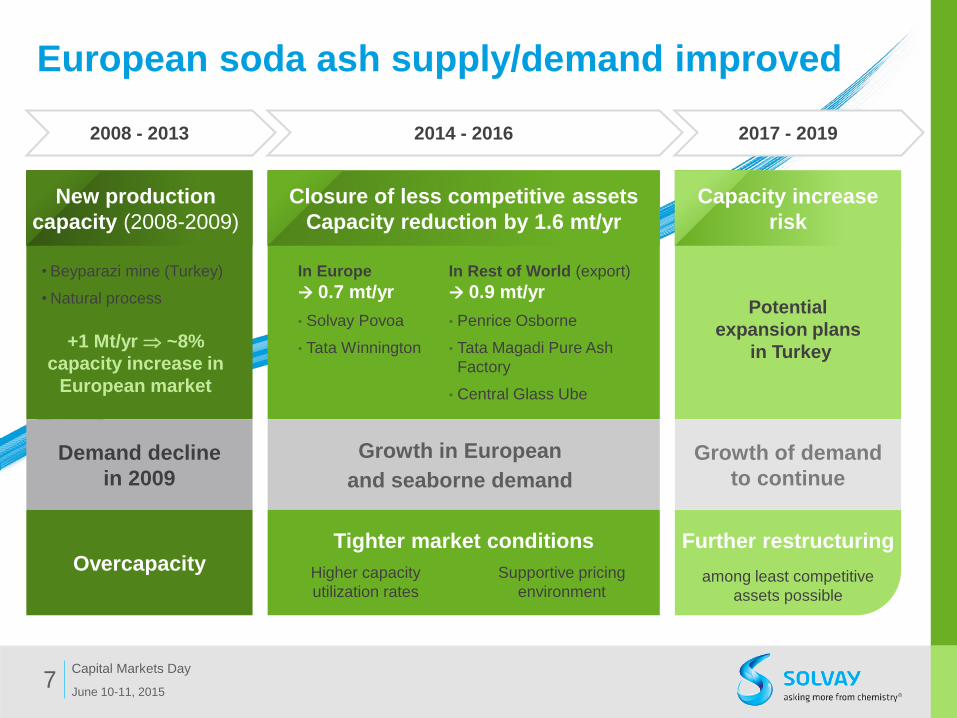
European soda ash supply/demand improved
June 10-11, 2015
Capital Markets Day 7
• Beyparazi mine (Turkey)
• Natural process
Closure of less competitive assets
Capacity reduction by 1.6 mt/yr
2017 - 2019 2014 - 2016 2008 - 2013
In Europe
0.7 mt/yr
• Solvay Povoa
• Tata Winnington
Growth in European
and seaborne demand
In Rest of World (export)
0.9 mt/yr
• Penrice Osborne
• Tata Magadi Pure Ash
Factory
• Central Glass Ube
Further restructuring Tighter market conditions
Supportive pricing
environment
Overcapacity
Capacity increase
risk
Growth of demand
to continue
Demand decline
in 2009
among least competitive
assets possible
Higher capacity
utilization rates
+1 Mt/yr ~8%
capacity increase in
European market
New production
capacity (2008-2009)
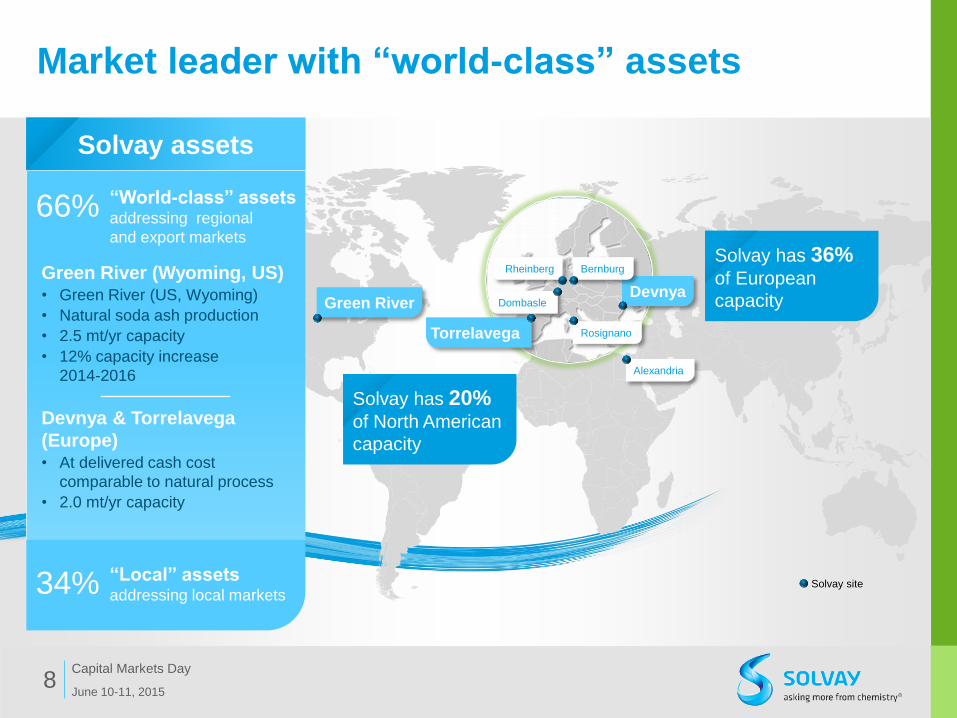
Market leader with “world-class” assets
June 10-11, 2015
Capital Markets Day 8
Solvay site
Bernburg Rheinberg
Dombasle Devnya
Torrelavega Rosignano
Alexandria
Green River
Green River (Wyoming, US) • Green River (US, Wyoming)
• Natural soda ash production
• 2.5 mt/yr capacity
• 12% capacity increase
2014-2016
Devnya & Torrelavega
(Europe) • At delivered cash cost
comparable to natural process
• 2.0 mt/yr capacity
Solvay assets
“Local” assets addressing local markets 34%
66% “World-class” assets addressing regional
and export markets
Solvay has 20% of North American
capacity
Solvay has 36% of European
capacity
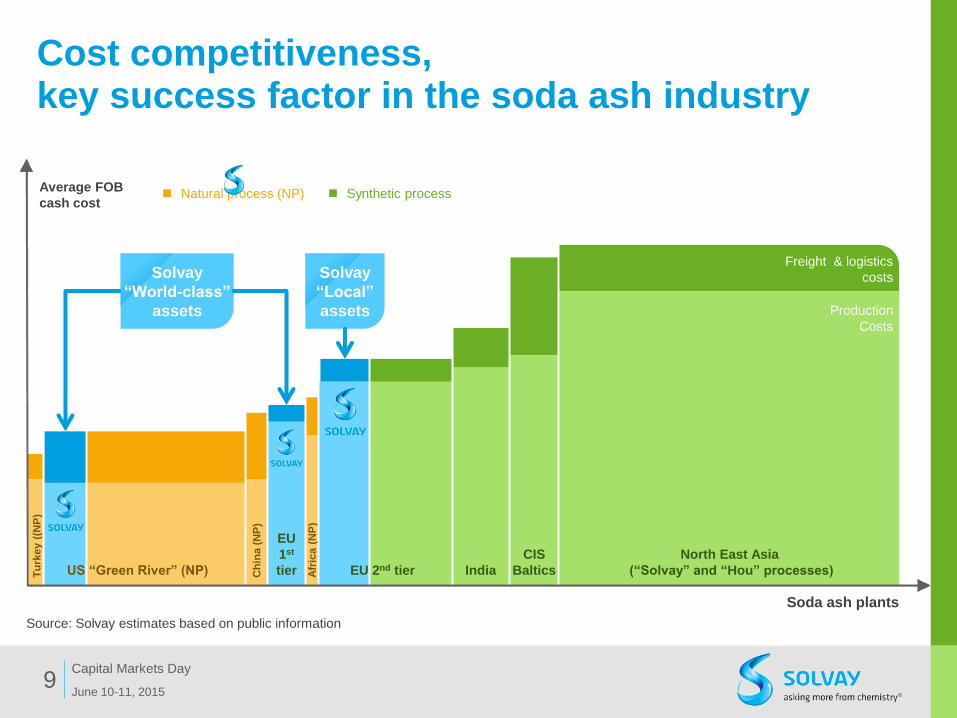
Cost competitiveness, key success factor in the soda ash industry
June 10-11, 2015
Capital Markets Day 9
Source: Solvay estimates based on public information
Afr
ica (
NP
)
Ch
ina
(N
P)
Tu
rkey (
(NP
)
Soda ash plants
Average FOB
cash cost
EU
1st
tier India
CIS
Baltics
North East Asia
(“Solvay” and “Hou” processes) EU 2nd tier US “Green River” (NP)
Production
Costs
Freight & logistics
costs
Synthetic process Natural process (NP)
Solvay
“World-class”
assets
Solvay
“Local”
assets
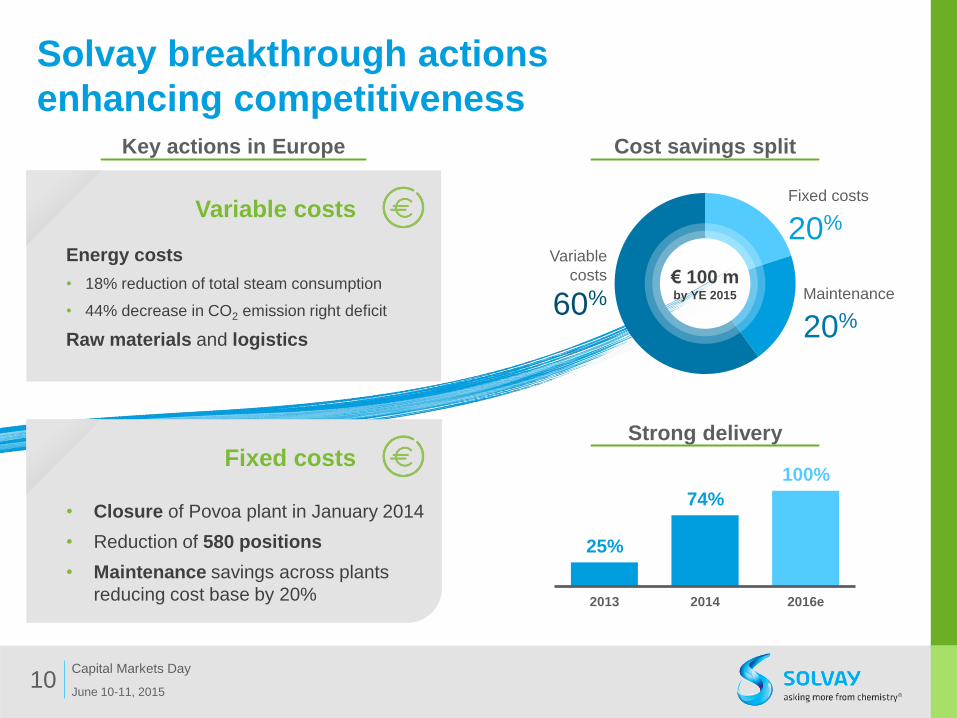
Variable costs
Energy costs
• 18% reduction of total steam consumption
• 44% decrease in CO2 emission right deficit
Raw materials and logistics
Solvay breakthrough actions
enhancing competitiveness
June 10-11, 2015
Capital Markets Day 10
25%
74%
100%
2013 2014 2016e
Strong delivery
Maintenance
20%
Fixed costs
20%
Variable
costs
60%
Cost savings split
Fixed costs
• Closure of Povoa plant in January 2014
• Reduction of 580 positions
• Maintenance savings across plants
reducing cost base by 20%
Key actions in Europe
€ 100 m by YE 2015
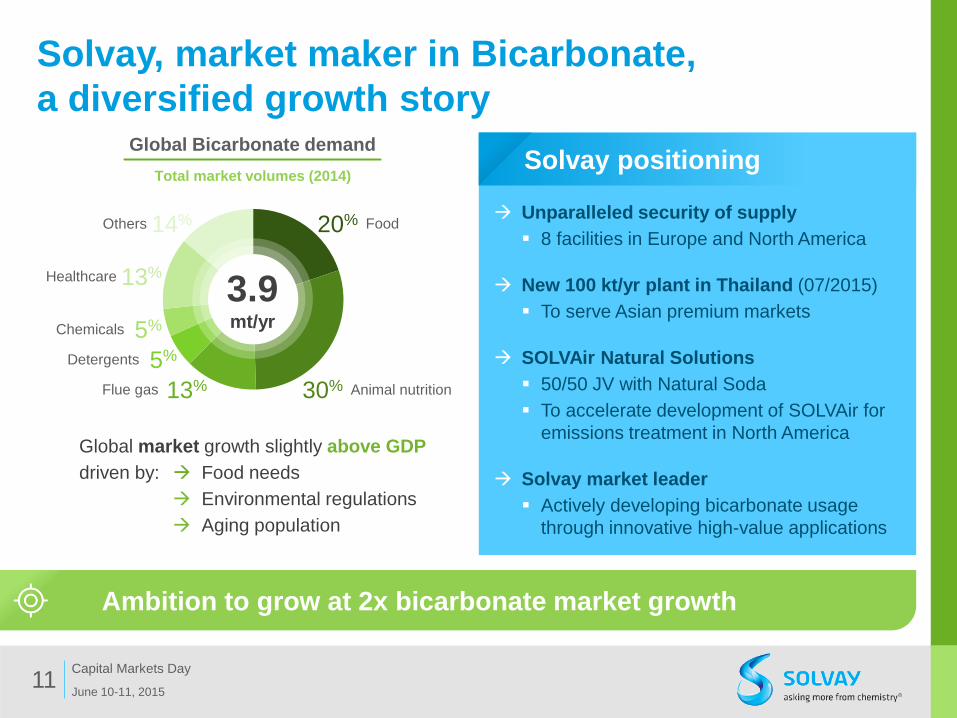
Global Bicarbonate demand
Solvay, market maker in Bicarbonate,
a diversified growth story
June 10-11, 2015
Capital Markets Day 11
Ambition to grow at 2x bicarbonate market growth
Others 14%
Healthcare
5%
13%
5% Chemicals
13% Flue gas 30% Animal nutrition
20% Food
Total market volumes (2014)
Detergents
Unparalleled security of supply
8 facilities in Europe and North America
New 100 kt/yr plant in Thailand (07/2015)
To serve Asian premium markets
SOLVAir Natural Solutions
50/50 JV with Natural Soda
To accelerate development of SOLVAir for
emissions treatment in North America
Solvay market leader
Actively developing bicarbonate usage
through innovative high-value applications
Global market growth slightly above GDP
driven by: Food needs
Environmental regulations
Aging population
3.9 mt/yr
Solvay positioning
Flue gas treatment
Food
Animal feed
Healthcare
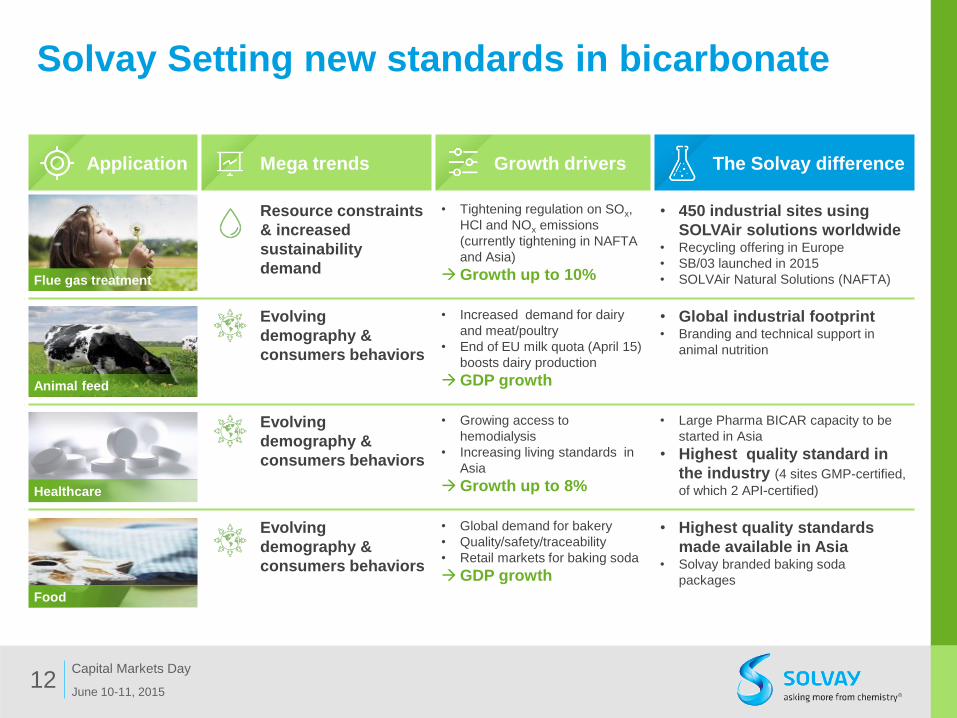
Solvay Setting new standards in bicarbonate
June 10-11, 2015
Capital Markets Day 12
Application Mega trends Growth drivers The Solvay difference
Resource constraints
& increased
sustainability
demand
• Tightening regulation on SOx,
HCl and NOx emissions
(currently tightening in NAFTA
and Asia)
Growth up to 10%
• 450 industrial sites using
SOLVAir solutions worldwide • Recycling offering in Europe
• SB/03 launched in 2015
• SOLVAir Natural Solutions (NAFTA)
Evolving
demography &
consumers behaviors
• Increased demand for dairy
and meat/poultry
• End of EU milk quota (April 15)
boosts dairy production
GDP growth
• Global industrial footprint • Branding and technical support in
animal nutrition
Evolving
demography &
consumers behaviors
• Growing access to
hemodialysis
• Increasing living standards in
Asia
Growth up to 8%
• Large Pharma BICAR capacity to be
started in Asia
• Highest quality standard in
the industry (4 sites GMP-certified,
of which 2 API-certified)
Evolving
demography &
consumers behaviors
• Global demand for bakery
• Quality/safety/traceability
• Retail markets for baking soda
GDP growth
• Highest quality standards
made available in Asia • Solvay branded baking soda
packages

Key take-aways
June 10-11, 2015
Capital Markets Day 13
Resilient profitability
REBITDA growing at mid-single digit CAGR over 2013-2016
Underpinned by very competitive assets
Ensuring competitive soda ash assets
Breakthrough operational excellence actions across European
soda ash plants to further reinforce competiveness
Ramping up capacity of natural soda ash production in the U.S.
Market maker for bicarbonate
Growing at 2x market growth

SPEAKER’S
RESUME
June 10-11, 2015
Capital Markets Day 14
President, Soda Ash & Derivatives
Christophe Clémente
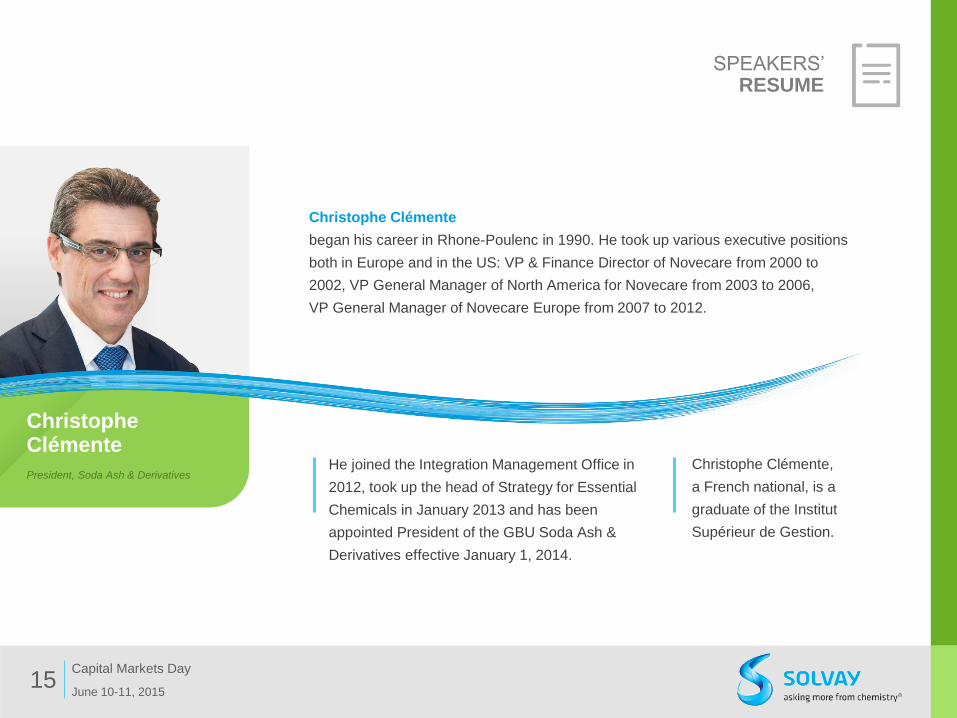
SPEAKERS’ RESUME
Christophe Clémente
began his career in Rhone-Poulenc in 1990. He took up various executive positions
both in Europe and in the US: VP & Finance Director of Novecare from 2000 to
2002, VP General Manager of North America for Novecare from 2003 to 2006,
VP General Manager of Novecare Europe from 2007 to 2012.
He joined the Integration Management Office in
2012, took up the head of Strategy for Essential
Chemicals in January 2013 and has been
appointed President of the GBU Soda Ash &
Derivatives effective January 1, 2014.
Christophe Clémente,
a French national, is a
graduate of the Institut
Supérieur de Gestion.
June 10-11, 2015
Capital Markets Day 15
June 10-11 2015
Capital Markets Day 16
CONTACT
INFORMATION
Maria Alcón-Hidaglo
Head of Investor Relations
+32 2 264 1984
E-mail : [email protected]
Geoffroy Raskin
Investor Relations, Senior Manager
+32 2 264 1540
E-mail : [email protected]
Catherine Jouvet
Retail shareholder relations Manager
+32 2 264 2732
E-mail : [email protected]
Laetitia Van Minnenbruggen
Events Coordinator
+32 2 264 3025
E-mail : [email protected]
Bisser Alexandrov
Investor Relations, Manager
+32 2 264 2142
E-mail : [email protected]
June 10-11, 2015
Capital Markets Day 17
DISCLAIMER
To the extent that statements made in these presentations contain information that is not historical, these statements are
essentially forward-looking. The achievement of forward-looking statements contained in these presentations are subject to
risks and uncertainties because of a number of factors, including general economic factors, interest rate and foreign currency
exchange rate fluctuations; changing market conditions, product competition; the nature of product development, impact of
acquisitions, restructurings, products withdrawals; regulatory approval processes, all-in scenario of R&D projects and other
unusual items. Consequently, actual results may differ materially from those expressed or implied by such forward-looking
statements. Forward-looking statements can be identified by the use of words such as “expects,” “plans,” “will,” “believes,”
“may,” “could,” “estimates,” “intends,” “goals,” “targets,” “objectives,” “potential,” and other words of similar meaning. Should
known or unknown risks or uncertainties materialize, or should our assumption prove inaccurate, actual results could vary
materially from those anticipated. The Company undertakes no obligation to publicly update any forward-looking statements.
www.solvay.com