socioeconomic bias, turnout decline, and the puzzle of...
TRANSCRIPT
Socioeconomic Bias, Turnout Decline, and the Puzzle of Participation
David Darmofal Department of Political Science
University of South Carolina 350 Gambrell Hall
Columbia, SC 29208 Phone: (803) 777-5440
E-mail: [email protected]
Abstract
Socioeconomic bias in voter participation poses fundamental challenges to the exercise of representative democracy. Among these are inequities in political communication and representation and a lack of political incorporation of citizens often on the periphery of society. Despite the critical implications of socioeconomic turnout bias, central questions regarding this bias in the United States remain unresolved. Has turnout bias increased over the past several decades, or has the class skew in the electorate remained largely unchanged? If socioeconomic turnout bias has increased, why has this occurred? I find that socioeconomic bias in voter participation has increased in the United States since 1960. This increased socioeconomic turnout bias did not result from decreased party mobilization efforts, as some studies contend. Instead, low- and middle-class citizens have disproportionately stopped voting because of less participatory attitudes, weakened social attachments, and changes in demographics. Where the party mobilization thesis suggests a quick reversal of the increased turnout bias if the parties simply alter their mobilization efforts, the broad and long-term sources of increased bias I identify suggest only a gradual and incremental reversal of this increased bias. The paper’s findings also bring us closer to a resolution of the puzzle of why turnout declined in the United States after 1960 despite relaxed registration laws and rising education levels. Relaxed registration laws did little to boost voter turnout. At the same time, increased education levels were insufficient to offset the turnout depressing effects of the attitudinal, social, and demographic changes of recent decades.
I thank R. Michael Alvarez, Jan Box-Steffensmeier, Wendy Tam Cho, M. Margaret Conway, Brian Gaines, Jennifer Jerit, James Kuklinski, Peter Nardulli, and Herb Weisberg for their helpful comments and suggestions. I also thank Dawn Owens-Nicholson for her help with data collection.
Political equality is a fundamental tenet of representative democracy. For citizens to
enjoy equal expression and representation in the public sphere, they must enjoy a basic equality
in political rights (Pateman 1970; Dahl 1998). Without this political equality, certain voices will
be privileged while others are disprivileged. Reflecting its Lockean heritage, American political
culture defines these shared political rights as negative rights. As a consequence, although
fundamental political rights such as the rights to vote, petition, and assembly are shared equally
by Americans, the ability to realize them is not. Disparities in socioeconomic status afford some
citizens a much greater opportunity to exercise these political rights, and a much greater voice in
the political process as a consequence (Verba, Schlozman, and Brady 1995). This inequality in
participation is evidenced even in the exercise of the most central and inherently equal of all
political rights, the right to vote. Although each citizen is afforded the same voice in the voting
booth, citizens high in socioeconomic status are much more likely than citizens low in
socioeconomic status to make their voices heard through voting (Verba and Nie 1972; Piven and
Cloward 1989). Much as with the pluralist chorus (Schattschneider 1960), the American voting
electorate sings with an upper-class accent.
This socioeconomic bias in voter participation carries several problematic normative
implications. If non-voting, lower-class citizens’ policy preferences differ from those of voting,
upper-class citizens’ preferences, elections will not accurately reflect the public’s will. And
evidence suggests that these preferences do in fact diverge, with non-voters more likely to
support social welfare spending than voters (Bennett and Resnick 1990; see also Verba and Nie
1972; Verba et al. 1993; but see Wolfinger and Rosenstone 1980; Teixeira 1992). As a
consequence, different candidates are elected than would be elected by a voting electorate with
no class skew. The result is policy outcomes that disproportionately favor the upper-class, who
vote disproportionately (Hill and Leighley 1992; Hill, Leighley, and Hinton-Andersson 1995;
1
Burnham 1987; Piven and Cloward 1989; but see Shaffer 1981). In short, socioeconomic bias in
voting produces representational inequities on both the demand and supply sides of American
politics.
The implications of socioeconomic turnout bias extend beyond representational concerns.
In the classic Millsian ([1860] 1958) perspective, voter participation is also valued because of its
educative function (see also Pateman 1970). By voting (and taking part in the inter- and intra-
personal deliberation that precedes voting), citizens become better-informed, more efficacious,
and broadened in their concerns, and better equipped for future participation as a consequence.
Individuals low in socioeconomic status have the most to gain in citizenship from voting, but are
least likely to realize these gains as a consequence of their abstention. This may further produce
a lack of legitimacy and support for the political system among these citizens often already on
the periphery of social and political life. At the extreme, abstention and the accompanying lack
of political socialization may promote democratic instability by providing a receptive audience
for political demagoguery.
Socioeconomic inequalities in participation clearly pose considerable implications for
representative democracy. Yet the most central questions regarding socioeconomic turnout bias
in the United States remain unresolved. Has turnout bias increased over the past several decades
as turnout rates in the United States have declined, or has the class skew in the electorate
remained largely unchanged? An increase in socioeconomic turnout bias in recent decades would
make the normative implications of participatory inequalities all the more pressing.
Equally important, if socioeconomic turnout bias has increased, why has this been the
case? If increased turnout bias can be traced to a particular change in elite behavior such as a
decline in partisan mobilization, a ready remedy exists for the quick reversal of this bias. If,
conversely, increased turnout bias has been produced by a broader constellation of long-term
2
societal changes, the reversal of this bias is much more likely to occur through a gradual and
incremental process at best.
Existing studies disagree over whether voters have become increasingly unrepresentative
of the larger American society. Some scholars (Reiter 1979; Burnham 1987; Rosenstone and
Hansen 1993) argue that they have, finding that turnout in presidential elections has declined
most among lower socioeconomic classes. Other scholars (Leighley and Nagler 1992; Teixeira
1992), however, find no increase in socioeconomic turnout bias. They find, instead, that different
socioeconomic classes have stopped voting at roughly the same rates. The divergence in findings
between these two sets of studies results, primarily, from differences in research design.
Even the most recent of these studies, however, examine socioeconomic turnout bias only
through the 1988 election. As a consequence, we do not know whether any trends in
socioeconomic bias have worsened or become less severe in the intervening years, or why this
might be the case. Equally problematic, all of these studies rely primarily on reported turnout and
none directly replicate their central analyses with validated turnout measures based on
respondents’ actual voting records.1
Rosenstone and Hansen and Burnham attribute the increased turnout bias they find to the
political parties disproportionately cutting back their mobilization of lower socioeconomic
1 Leighley and Nagler use the NES validated turnout measure to supplement their analysis
of reported turnout, but do not directly measure turnout bias trends using validated turnout. They find that high-income respondents have become more likely than low-income respondents to overreport their turnout over time, and conclude, therefore, that self-reported turnout provides a conservative test of increases in turnout bias (Leighley and Nagler 1992, 732). However, employing their income quintiles, increased turnout bias exists even when validated turnout is substituted for reported turnout. Leighley and Nagler also use the validated turnout measure as the dependent variable in a series of election-specific multivariate turnout models. Because the 1988 income coefficient is not larger than the 1964 income coefficient, they conclude that turnout bias has not increased. Increased turnout bias along income lines, however, need not be caused by income. Instead, it may be caused by factors such as political attitudes that covary with income.
3

groups. Neither study, however, provides a direct empirical test of this mobilization thesis. At the
same time that they argue that mobilization rates were declining, several other political, social,
and demographic changes were also taking place. These societal changes may also have
increased turnout bias. If so, the sources of turnout bias are more complex and the reversal of this
bias poses a more formidable challenge for reform-minded groups than the mobilization thesis
would suggest.
In this paper, I identify which voters have stopped voting and why they have done so. I
provide a comprehensive, updated analysis of trends in turnout bias through the 2000 presidential
election. I examine these trends using each of the three principal measures of turnout in the
discipline: the National Election Studies (NES) reported turnout, the NES validated turnout, and
the Census Bureau’s Current Population Surveys (CPS) reported turnout. Finally, I examine
these trends using each of the three principal measures of socioeconomic status: education,
income, and occupation.
I find that turnout bias increased along both education and income lines over the past four
decades as lower and middle class voters disproportionately stopped voting. This education and
income bias increased both during the 1960-1972 period of aggregate turnout decline and the
1972-2000 period of aggregate turnout stability. Turnout bias has increased according to both the
NES and CPS reported turnout measures and the NES validated measure. Contrary to the
conclusions of Rosenstone and Hansen and Burnham, this increased turnout bias did not result
from changes in party mobilization. The political parties have increased their contacting of all
classes since 1960 and have actually increased their contacting more among less-educated
citizens than among better-educated citizens. Instead, lower and middle class groups
disproportionately stopped voting because of less participatory attitudes, weakened social
attachments, and changing demographics.
4
This paper proceeds as follows. In the next sections, I examine the existing literature on
turnout decline and turnout bias and the principal explanation for increased turnout bias: the
mobilization thesis. In the following section, I examine trends in turnout bias using the three
measures of turnout. Next, I estimate a probit model to identify the sources of increased turnout
bias. I conclude by discussing the findings’ implications for turnout bias and for the puzzle of
why turnout declined despite rising education levels and relaxed registration laws.
Socioeconomic Bias in Turnout Decline
Few trends in recent American politics have been as dramatic as the decline in voter
turnout. Turnout among eligible voters fell 7.6 percentage points between 1960 and 1972, with
the bulk of this decline, 5.3 points, occurring between 1968 and 1972 (McDonald and Popkin
2001, 966). Although turnout has not declined further since, the drop in turnout has persisted. As
a result, fifteen and a half million fewer voters went to the polls in November 2000 than would
have had turnout stayed at its 1960 rate. This mass abstention has led several scholars (Abramson
and Aldrich 1982; Teixeira 1992; Putnam 2000; Rosenstone and Hansen 1993) to express
concerns about the political health of the American polity. Some argue that a disillusioned
citizenry is becoming disconnected from its government (Teixeira 1992; Abramson and Aldrich
1982). For their part, political elites are seen as increasingly unresponsive to the concerns of
citizens who have stopped voting (Rosenstone and Hansen 1993).
A central question about the aggregate turnout decline remains unresolved: which
citizens produced it? Was the turnout decline from 1960 to 1972 produced equally by all social
classes, or was it produced disproportionately by lower class groups? Has the aggregate turnout
stability since 1972 been produced by stable turnout among different classes, or by offsetting
turnout trends, with declines among lower class groups matched by increases among upper class
groups? Equally important, why have citizens who have stopped voting done so?
5
Studies that addressed trends in turnout bias into the late 1980s varied significantly in
their research designs. Reiter (1979, 304) sampled white respondents in the NES and found that
low-income and less-educated whites’ reported turnout fell more than twice as much as high-
income and better-educated whites’ between 1960 and 1976. Burnham (1987) also sampled a
subset of the electorate (males) and found that blue-collar males’ reported turnout in the CPS fell
roughly twice as much as white-collar males’ between 1964 and 1980. Rosenstone and Hansen
(1993, 243) used reported turnout for the entire NES sample and also found marked increases in
turnout bias along education and income lines between 1960 and 1988.
Teixeira (1992), conversely, found little increase in turnout bias along education, income,
or occupation lines between 1972 and 1988 using reported turnout in the CPS. He also concluded
that there was little increase in turnout bias using NES reported turnout between 1960 and 1988.
Leighley and Nagler (1992) likewise found little increase in socioeconomic turnout bias between
1964 and 1988. They found that the lowest income quintile in the CPS had a turnout decline of
11.0 percentage points over these years while the top income quintile had an only slightly
smaller decline of 8.3 percentage points. Leighley and Nagler concluded, as a result, that “the
voters remain the same.”2
The Mobilization Thesis
Studies that found an increased socioeconomic turnout bias into the late 1980s contended
that the political parties were responsible for the increased abstention by lower class groups.
Rosenstone and Hansen (1993, 242-244) argued that as the civil rights movement receded so too
did party mobilization efforts, disproportionately depressing low SES turnout, which was
particularly dependent on this mobilization. Burnham (1987, 124) argued, alternatively, that the
2 The 1964 CPS survey, however, is a problematic baseline for an examination of trends in socioeconomic turnout bias. The 1964 Census Bureau survey included no citizenship question (McDonald and Popkin 2001). As a consequence, non-citizens are included as valid responses on the turnout question (i.e., as non-voters) even though they were ineligible to vote.
6
Democratic party reduced its mobilization of lower SES groups as it shifted its issue appeals
toward higher-status citizens whom it hoped to attract in an information economy. Burnham
further argued that this change in party strategy also reduced low SES citizens’ partisan
attachments and external efficacy, and that this also depressed low SES turnout.
This mobilization thesis offers a simple solution for any increases in turnout bias. The
thesis posits that a reduction in turnout bias does not require the reversal of several distinct
political, social, and demographic trends. Instead, if the political parties simply increase their
mobilization of lower SES citizens, any increased class bias should disappear.
The mobilization thesis, however, remains untested. Rosenstone and Hansen (1993, 248)
infer that declining mobilization increased SES turnout bias from evidence that it depressed
African American turnout. African Americans, however, are not a socioeconomically
homogeneous group. Burnham bases his argument for the mobilization thesis on survey data and
aggregate electoral data that lack measures of party contacting efforts.
Other political, social, and demographic changes occurred over the past four decades and
may also have produced increased turnout bias. Citizens’ political attitudes became less
participatory, producing decreased psychological motives for voting (Teixiera 1992; Abramson
and Aldrich 1982). Social attachments between citizens weakened, further decreasing the
psychological motives for voting while increasing the information and transaction costs of voting
(Putnam 2000). At the same time, many lower-class workers’ earnings fell (Levy and Murnane
1992), increasing these citizens’ financial hurdles to voting.
Examining Changes in Socioeconomic Turnout Bias
Socioeconomic status is a multidimensional concept, reflecting an individual’s social and
economic location in society. The three principal measures of socioeconomic status – education,
income, and occupation – each tap different elements of SES (Knoke 1979, Himmelstein and
7
McRae 1988). Moreover, each of these SES measures differs in its relationship to turnout, with
education exhibiting the strongest of the three relationships (Wolfinger and Rosenstone 1980).
For these reasons, the more comprehensive studies of turnout bias trends have generally
examined these trends along several measures of socioeconomic status.
Education has generally been measured using the individual’s level of education. Income
has typically been measured using family income, specifically the respondent’s family’s location
in the family income distribution, with the family’s income quintile particularly preferred (see
Leighley and Nagler 1992).3 Occupation has been measured with categories for white-collar and
blue-collar positions. In this paper, I employ these socioeconomic status measures, and examine
trends in turnout bias along each measure.
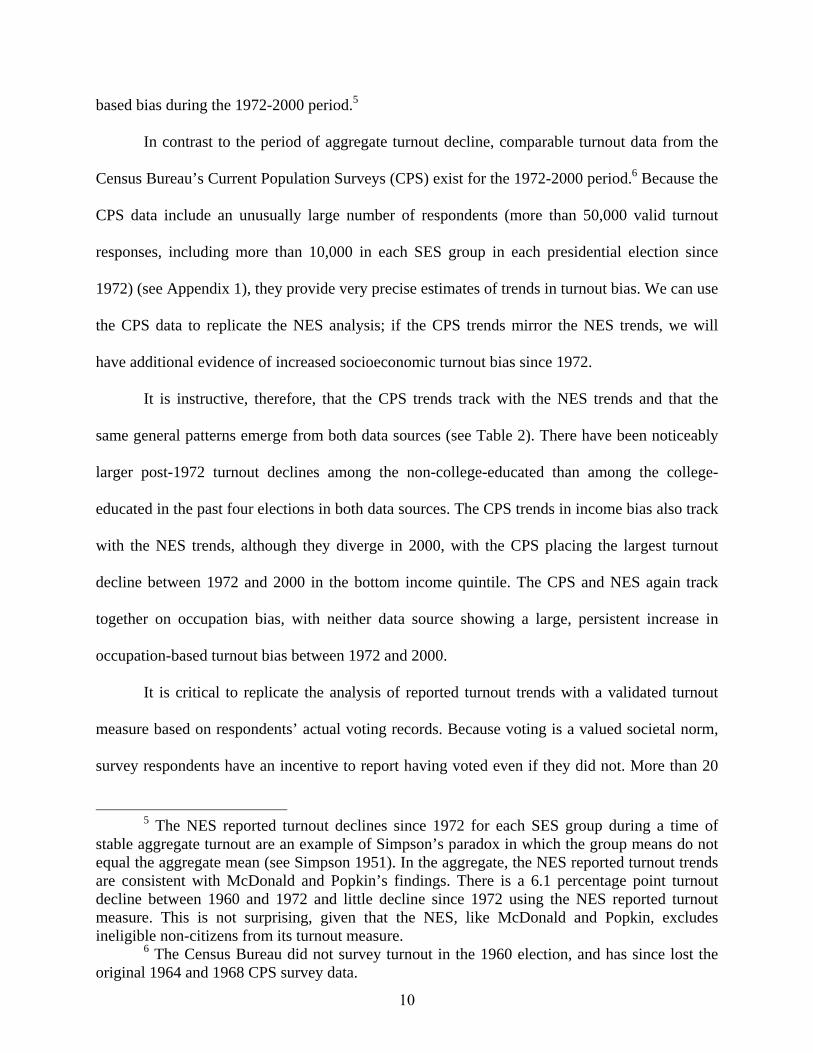
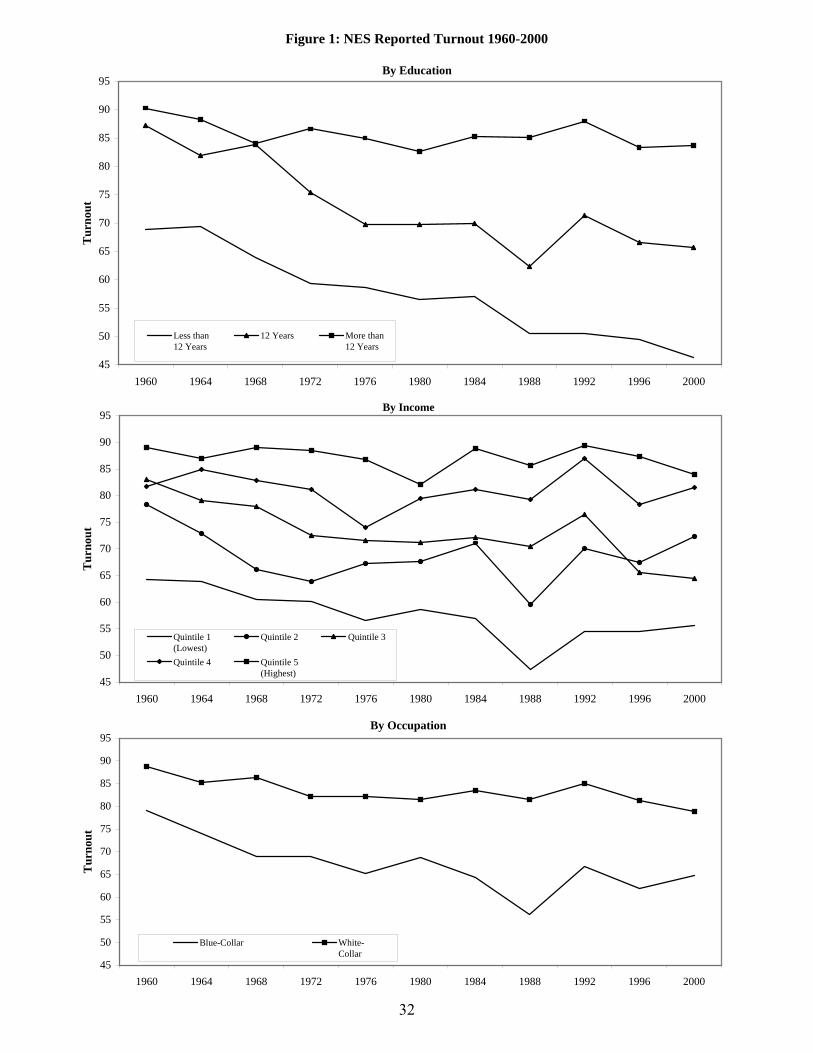
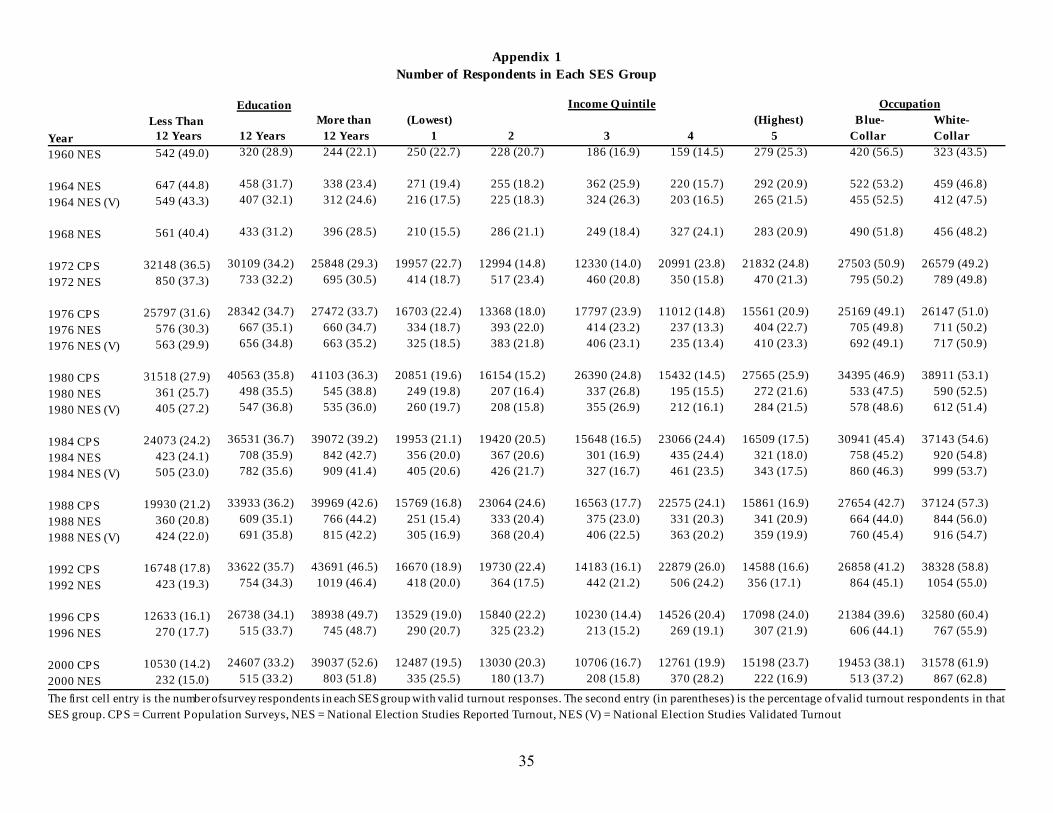
Figure 1 plots the National Election Studies (NES) self-reported turnout rates for
education, income, and occupation groups from 1960 through 2000. (Appendix 1 lists the
number of respondents in each SES group). Table 1 presents these turnout rates, the turnout
changes from 1960 for each group, and the 95 percent confidence intervals around these
changes.4
As Figure 1 and Table 1 show, turnout bias increased significantly along education lines
over the past four decades. Non-college-educated citizens’ turnout fell more than 20 points
between 1960 and 2000. In contrast, college-educated citizens’ turnout fell less than seven points
3 There are two reasons why family income is typically relativized and education is not.
As Leighley and Nagler (1992, 727) note, income quintiles are “more comparable over time than is the individual’s absolute income level.” Equally important, specific education levels, unlike specific family income levels, impart citizens with particular information and skills relevant to voting (e.g., bureaucratic skills are taught in both high school and college but abstract conceptual skills are taught primarily in the latter).
4 Professional, managerial, sales, and clerical workers were coded as white-collar; skilled and semi-skilled workers, service workers, foresters, fishers, farmers, farm managers, farm and non-farm laborers, and foremen were coded as blue-collar.
8
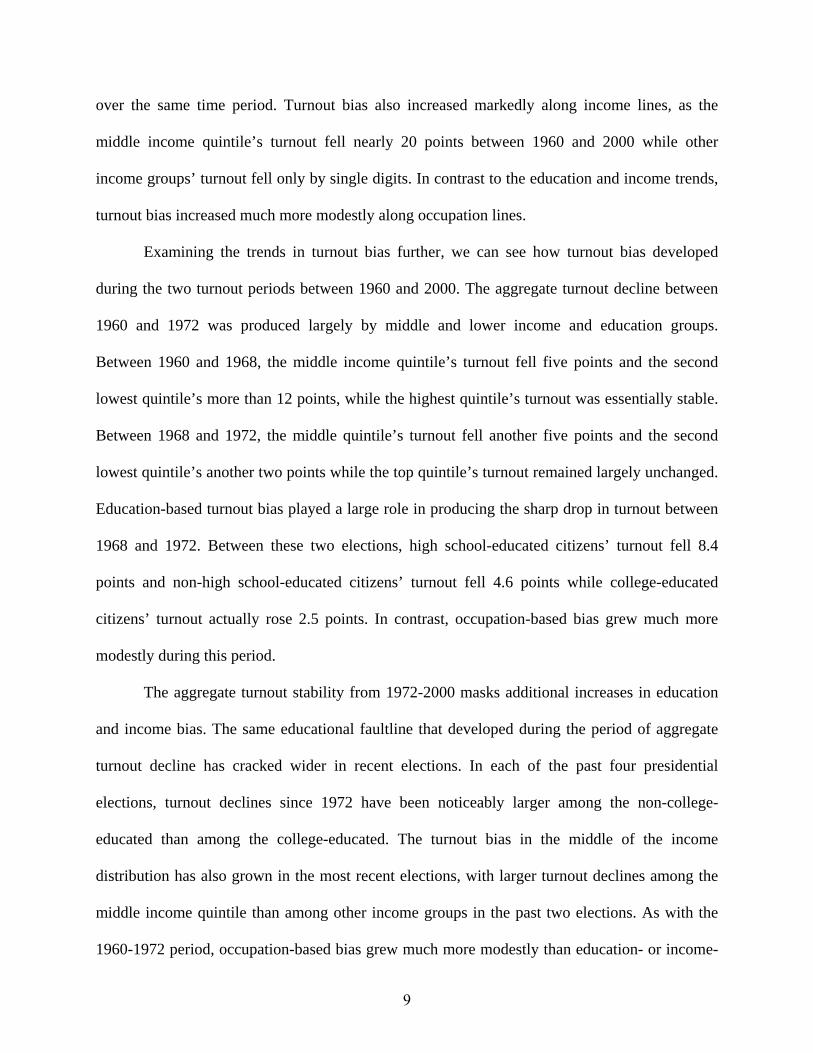
over the same time period. Turnout bias also increased markedly along income lines, as the
middle income quintile’s turnout fell nearly 20 points between 1960 and 2000 while other
income groups’ turnout fell only by single digits. In contrast to the education and income trends,
turnout bias increased much more modestly along occupation lines.
Examining the trends in turnout bias further, we can see how turnout bias developed
during the two turnout periods between 1960 and 2000. The aggregate turnout decline between
1960 and 1972 was produced largely by middle and lower income and education groups.
Between 1960 and 1968, the middle income quintile’s turnout fell five points and the second
lowest quintile’s more than 12 points, while the highest quintile’s turnout was essentially stable.
Between 1968 and 1972, the middle quintile’s turnout fell another five points and the second
lowest quintile’s another two points while the top quintile’s turnout remained largely unchanged.
Education-based turnout bias played a large role in producing the sharp drop in turnout between
1968 and 1972. Between these two elections, high school-educated citizens’ turnout fell 8.4
points and non-high school-educated citizens’ turnout fell 4.6 points while college-educated
citizens’ turnout actually rose 2.5 points. In contrast, occupation-based bias grew much more
modestly during this period.
The aggregate turnout stability from 1972-2000 masks additional increases in education
and income bias. The same educational faultline that developed during the period of aggregate
turnout decline has cracked wider in recent elections. In each of the past four presidential
elections, turnout declines since 1972 have been noticeably larger among the non-college-
educated than among the college-educated. The turnout bias in the middle of the income
distribution has also grown in the most recent elections, with larger turnout declines among the
middle income quintile than among other income groups in the past two elections. As with the
1960-1972 period, occupation-based bias grew much more modestly than education- or income-
9
based bias during the 1972-2000 period.5
In contrast to the period of aggregate turnout decline, comparable turnout data from the
Census Bureau’s Current Population Surveys (CPS) exist for the 1972-2000 period.6 Because the
CPS data include an unusually large number of respondents (more than 50,000 valid turnout
responses, including more than 10,000 in each SES group in each presidential election since
1972) (see Appendix 1), they provide very precise estimates of trends in turnout bias. We can use
the CPS data to replicate the NES analysis; if the CPS trends mirror the NES trends, we will
have additional evidence of increased socioeconomic turnout bias since 1972.
It is instructive, therefore, that the CPS trends track with the NES trends and that the
same general patterns emerge from both data sources (see Table 2). There have been noticeably
larger post-1972 turnout declines among the non-college-educated than among the college-
educated in the past four elections in both data sources. The CPS trends in income bias also track
with the NES trends, although they diverge in 2000, with the CPS placing the largest turnout
decline between 1972 and 2000 in the bottom income quintile. The CPS and NES again track
together on occupation bias, with neither data source showing a large, persistent increase in
occupation-based turnout bias between 1972 and 2000.
It is critical to replicate the analysis of reported turnout trends with a validated turnout
measure based on respondents’ actual voting records. Because voting is a valued societal norm,
survey respondents have an incentive to report having voted even if they did not. More than 20
5 The NES reported turnout declines since 1972 for each SES group during a time of
stable aggregate turnout are an example of Simpson’s paradox in which the group means do not equal the aggregate mean (see Simpson 1951). In the aggregate, the NES reported turnout trends are consistent with McDonald and Popkin’s findings. There is a 6.1 percentage point turnout decline between 1960 and 1972 and little decline since 1972 using the NES reported turnout measure. This is not surprising, given that the NES, like McDonald and Popkin, excludes ineligible non-citizens from its turnout measure.
6 The Census Bureau did not survey turnout in the 1960 election, and has since lost the original 1964 and 1968 CPS survey data.
10
percent of actual non-voters in NES surveys do invalidly report having voted (Silver, Anderson,
and Abramson 1986, 613). Such overreports will pose a problem for studies of socioeconomic
turnout bias if different socioeconomic groups have changed significantly in their relative
propensities to overreport their voting over time. If they have, observed increases in
socioeconomic turnout bias may simply be a product of over-time changes in overreports, rather
than in over-time changes in turnout.
Recognizing the problem of overreported turnout, the National Election Studies validated
the reported turnout of respondents in the 1964 and 1976-1988 surveys by examining the
respondents’ registration and voting records.7 The trends in turnout bias using this validated
turnout measure are reported in Table 3. It is important to note that the increases in turnout bias
did not result from differences in turnout overreports across socioeconomic groups over time.
Turnout bias increased also according to the NES validated turnout measure, and the trends in
turnout bias between 1964 and 1988 vary only marginally between the NES reported and
validated measures. For example, in three-fourths of the cases, the differences in turnout bias
between the top and bottom SES groups are 3.5 percentage points or less across the two
measures.
The increases in turnout bias along education and income lines over the past four decades
are all the more surprising when one considers the strong socioeconomic skew in turnout that
existed in 1960. Lower and middle class citizens were already turning out at lower rates than
their upper class counterparts four decades ago. These lower turnout bases, however, did not lead
lower and middle class citizens to experience a floor effect in their turnout declines. Instead,
7 Although the NES also attempted to validate the turnout of respondents in the 1972 survey, these data are problematic. Typically, the NES validated respondents’ reported turnout within several months of the election (Traugott 1989, 11). However, the NES did not attempt to validate the reported turnout of respondents in the 1972 survey until 1977. Because respondents’ voting records could have been lost or purged during the intervening five years, the NES argues against using the vote validations for 1972 respondents (see Traugott 1989).
11
even though starting from much lower turnout bases, lower and middle SES groups still
experienced larger percentage point declines in turnout than their higher SES counterparts.
Because of these lower turnout bases, the relative declines in turnout among lower and
middle class citizens have been even more dramatic. For example, non-high school-educated
citizens’ 22.6 point turnout decline since 1960 represents a 33 percent drop in this group’s
turnout from its 1960 level. By contrast, college-educated citizens’ 6.7 point turnout decline over
this same period represents only a 7.4 percent decline in turnout. Lower and middle class groups’
turnout has not only declined more in absolute terms over the past four decades. Because of their
lower turnout bases, these groups have also lost much larger shares of their earlier turnout than
have higher-status groups.
Over the past four decades, voters have become much less educationally and
economically representative of the larger society. Why has this increase in turnout bias occurred?
The mobilization thesis places the blame with the political parties. Alternatively, I posited that
changes in political attitudes, social connectedness, and demographics may have increased bias.
In the next section, I estimate a turnout model to identify the sources of turnout bias in the two
recent turnout periods.
Explaining Increased Socioeconomic Turnout Bias
I employed NES data on presidential elections from 1960 through 2000 to identify the
sources of turnout decline and turnout bias over the past four decades. The model included five
sets of variables: measures of party mobilization, political attitudes, social connectedness,
demographics, and registration laws. I discuss these measures in turn next.
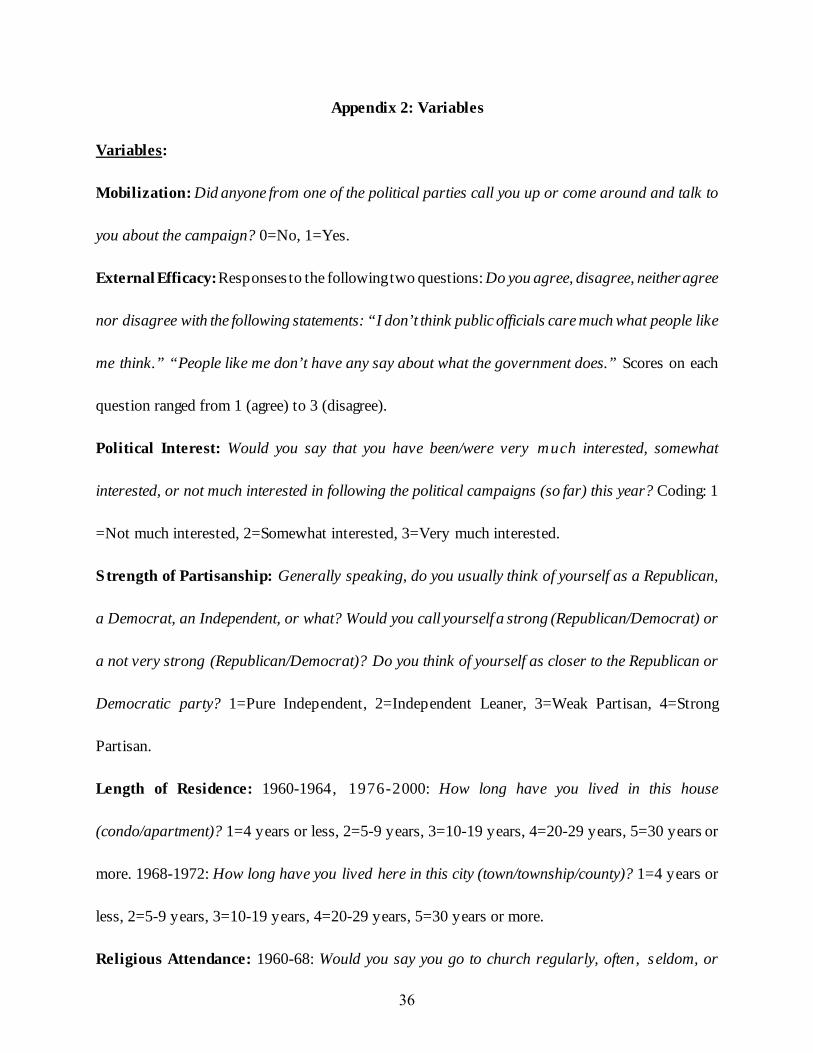
To examine the mobilization thesis, I included the standard NES party contacting
measure of mobilization employed by Rosenstone and Hansen (1993) and other scholars (see
Appendix 2 for the question wording and coding of all variables). I included three measures of
12
political attitudes in the model: external efficacy, political interest, and strength of partisanship.
Each taps a source of voter participation identified in previous turnout studies (Abramson and
Aldrich 1982; Teixeira 1992) and each is posited to have a positive relationship to turnout. The
external efficacy measure is a two-item measure of NES respondents’ perceptions of elite
responsiveness to citizens. Political interest is measured with an item on NES respondents’
interest in the year’s campaigns. Partisanship is measured with a folded scale of the strength of
partisan identification.
I included three measures of social connectedness. Each measure of connectedness
should be associated with stronger psychological motives for voting and lower information and
transaction costs of voting. Each, therefore, should be positively related to turnout. I included a
length of residence variable, measuring the number of years that respondents had lived at their
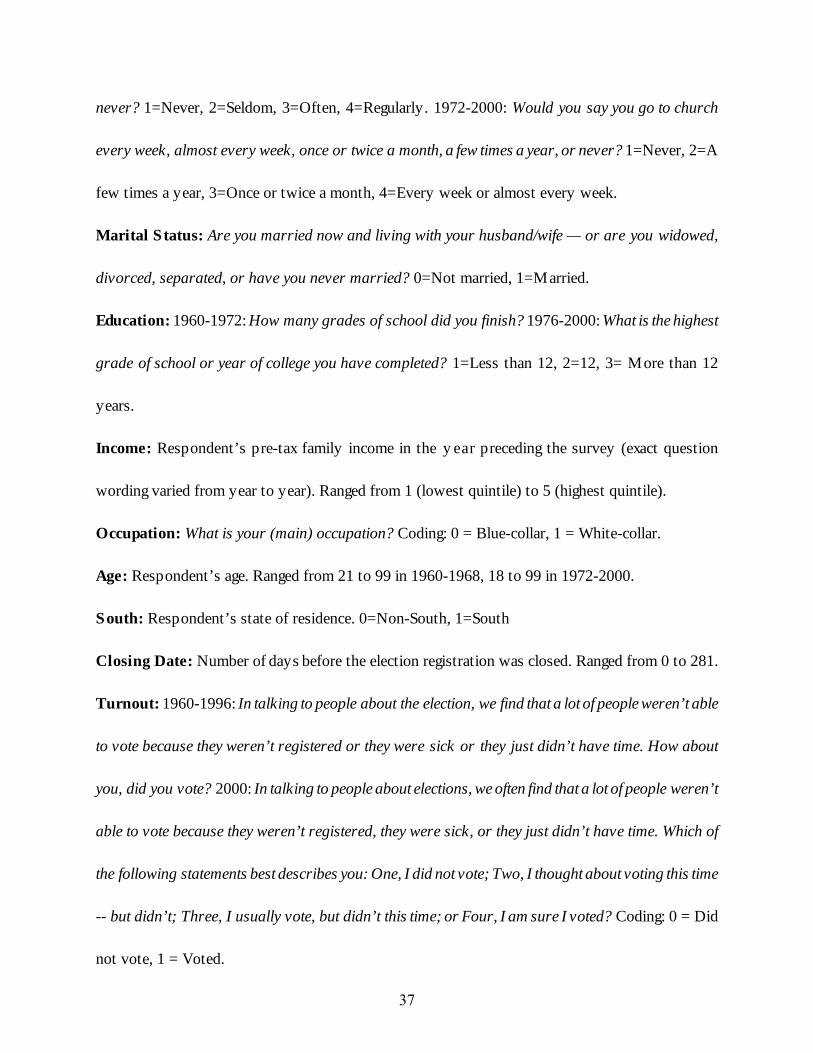
present residence.8 I included a religious attendance variable, measuring how frequently
respondents reported attending religious services. I also included a dichotomous measure of
marital status, with the expectation that married respondents’ turnout should be higher as a result
of spousal mobilization (Wolfinger and Rosenstone 1980).
I included each of the three measures of socioeconomic status employed in the earlier
analysis of turnout trends. Each should be positively related to turnout. Citizens with more
education are hypothesized to vote at higher rates because of stronger interest in politics and
more experience with the bureaucratic hurdles associated with voting (Wolfinger and Rosenstone
1980, 79). Because education may have a non-monotonic relationship to turnout (Wolfinger and
Rosenstone 1980, 124), I also included a squared education term. Income should also be
8 This question, unfortunately, was not asked in 1968 or 1972. Given the importance of these two elections for turnout bias, and the theoretical importance of social connectedness, I employed a measure of the respondent’s length of community residence for these two elections. This did not significantly change the parameter estimates for the residence variable in the pooled model, as interactions of community residence with 1968 and 1972 were both insignificant.
13

positively related to turnout because it eases the financial hurdles to voting. For the same reason,
white-collar workers should be more likely to vote than blue-collar workers. To test this, I
included the dichotomous measure of occupation used in the earlier analysis.
I included two additional demographic measures that are consistently related to turnout. I
included age and age-squared variables, with age measured in years. Turnout is expected to
increase as individuals age and gain participatory attitudes and experience in overcoming the
bureaucratic hurdles of voting before declining in later years as voter participation becomes more
difficult (Wolfinger and Rosenstone 1980, 60; but see Highton and Wolfinger 2001). Since
voters in the South have had, and continue to have, lower turnout rates than voters outside the
South, I also included a South dummy variable measuring whether respondents resided in the
South.
Brody (1978) hypothesized that relaxed registration requirements should have boosted
turnout over the past four decades. To examine this, I augmented the NES data with data on
registration laws. Wolfinger and Rosenstone (1980) found that the most important registration
law for turnout was the closing date, the date on which registration for the election closed. As a
consequence, I included a closing date variable measuring the number of days before the election
that registration closed.9 Nagler (1991) found that closing dates had their strongest deterrent
effect on high school-educated citizens’ turnout. To replicate Nagler’s analysis and test for an
interaction between closing date and education levels, I interacted closing date with education
and with squared education. The dependent variable in the model was the NES self-reported
turnout measure.
9 Because these data were not readily available for 1968, I linearly interpolated the
closing date data for that election. An interaction of the closing date and a dummy variable for 1968 was insignificant, indicating that the interpolation did not significantly alter the estimate for closing date in the pooled model.
14

Predicted Probabilities Model
I employed a predicted probabilities technique to determine how over-time changes in
these factors produced over-time changes in SES groups’ turnout rates. The technique involved
transforming NES respondents from typical members of their SES group on a variable of interest
in an earlier election into typical members of the group on the same variable in a later election
and calculating the difference in predicted turnout rates for the group that resulted from this
change (see also Teixeira 1992). First, I estimated a probit model on pooled NES data from the
1960 through 2000 presidential elections. The estimates from this model are reported in Table
4.10 I used these coefficient estimates to calculate the predicted probability of voting for each
NES respondent in a given election, giving members of each SES group their group’s average
value on the variable of interest in that election. Summing these probabilities for the SES group
in that election produced the group’s predicted turnout rate for that election. Next, to determine
how over-time changes in a factor affected the group’s turnout rate, I shifted each member’s
value on the variable of interest to the group’s average on the variable in a later election. Again I
summed the resulting predicted probabilities of voting for the group. The difference in the
group’s turnout rates across the elections was the difference attributable to the factor of interest.
For example, to identify how changes in external efficacy affected the lowest income
quintile’s turnout between 1960 and 1968, I gave each 1960 lowest quintile respondent the mean
1960 external efficacy value for that group (4.4), kept their values on the remaining variables at
their 1960 levels, and calculated their probabilities of voting. I summed these probabilities to
calculate the group’s predicted turnout. Next, I gave each lowest quintile respondent in 1960 the
10 I also examined more complex models incorporating year and period dummies and interaction terms. Although a few of these terms reached statistical significance, the substantive results differed little between the model presented here and these more complex specifications. Because there was little substantive difference between the models, I chose to keep the more parsimonious specification presented here.
15
mean 1968 external efficacy value for the group (3.5), kept their values on the remaining
variables at their original 1960 levels, and recalculated their probabilities of voting. I summed
these predicted probabilities to calculate the group’s predicted turnout given the change to the
group’s 1968 external efficacy mean. Next, I calculated the difference between the group’s
original predicted turnout and their new predicted turnout. The difference between the two
predicted turnout levels was the turnout change attributable to changes in external efficacy.11
I calculated these predicted probabilities over three time periods that were identified as
central to turnout bias in the previous analysis: 1960 to 1968, 1968 to 1972, and 1972 to 2000.12
Doing so identified the sources of turnout change and turnout bias over these periods. These
sources of turnout change and bias are presented in Tables 5, 6, and 7, respectively. Each table
presents the estimated turnout change during the period that was attributable to each of the
variables in the probit model. Beneath each of these estimates are their 95 percent confidence
intervals.
Results
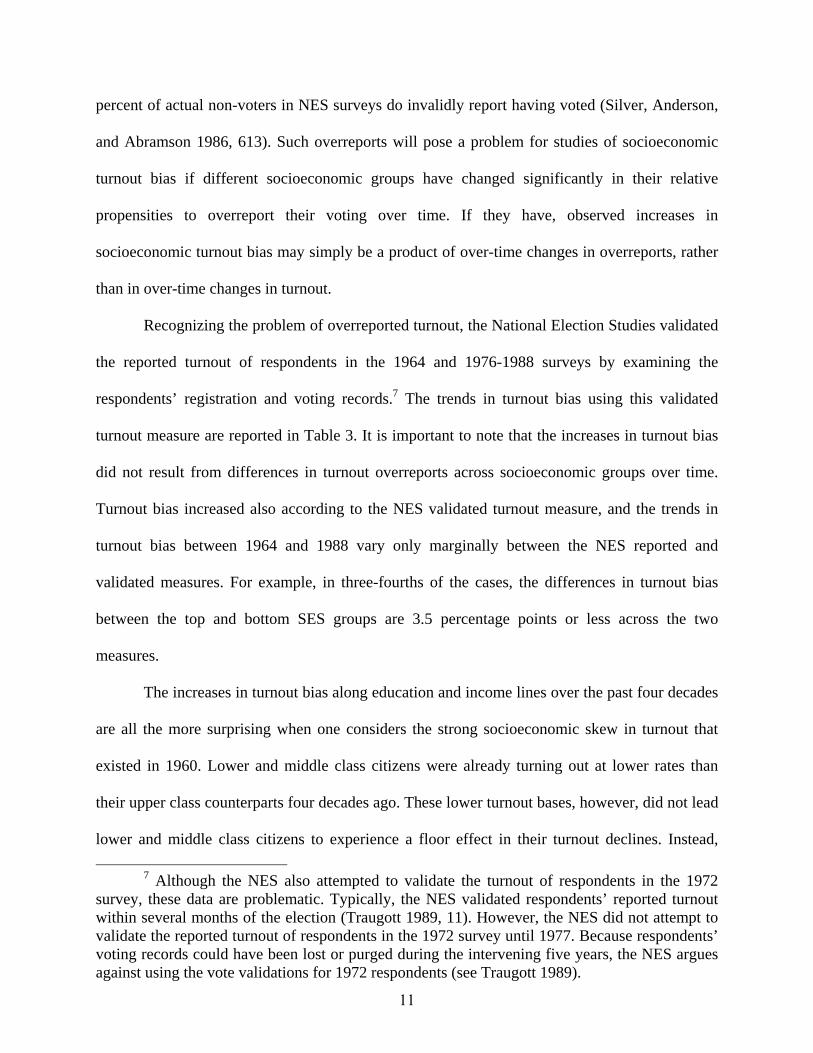
As the tables show, there is no empirical support for the mobilization thesis. The parties
have not disproportionately reduced their mobilization of lower class groups. Instead,
mobilization has increased among all socioeconomic groups, and has increased particularly
among the least educated (see Figure 2). The percentage of citizens without a high school
11 To calculate the turnout effects of variables included in interaction terms, I shifted
these variables (in both their main effect and interaction term) to their values in later elections while keeping the other variable included in the interaction term at its earlier level. For example, to identify the turnout effects of closing date changes between 1960 and 1968, I shifted the closing date variable in both its main effect and interaction terms to its 1968 level for an SES group while keeping the education and education-squared terms with which it was interacted at their 1960 levels for the SES group.
12 Because community residence rather than household residence was used in 1968 and 1972, the turnout differences due to changes in length of residence were only calculated for the 1968 to 1972 period.
16
education who reported that a party contacted them more than doubled between 1960 and 2000
(from 13.6 percent in 1960 to 30.3 percent in 2000). In contrast, the percentage of college-
educated citizens reporting a party contact increased less than eight points over this same period
(from 32.8 percent to 40.4 percent). Changes in party mobilization actually reduced turnout bias
along education lines, rather than increase it. The turnout of non-high school-educated citizens
was boosted two points by increased party mobilization between 1960 and 2000 while the
turnout of college-educated citizens was raised only half a point by increased mobilization over
the same period.
The increases in turnout bias instead were produced by a combination of changes in
political attitudes, social connectedness, and demographics. The 1960 to 1972 period of
aggregate turnout decline particularly was an era of dramatic political and social change. Not
surprisingly, citizens’ political attitudes and social attachments underwent significant change
during this period. These political and social changes affected citizens’ electoral participation,
particularly depressing turnout among middle and lower class groups.
Changes in attitudes and social connectedness increased income bias between 1960 and
1968. During this period, the second lowest quintile’s turnout fell more than two and a half
points and the middle quintile’s more than two points as a result of declining external efficacy.
Turnout declines due to declining efficacy were significantly less pronounced among upper
income citizens. At the same time, middle and lower income turnout fell nearly a point in
response to changes in marital status, while upper income turnout was largely unchanged.13
The increase in income bias between 1968 and 1972 was produced by additional
attitudinal and social changes, as well as demographic changes. Between 1968 and 1972, the
13 Some of the turnout decline for the SES groups remains unexplained in each period. This is a product of the lack of NES time-series questions that have been asked consistently across the elections examined.
17
middle quintile’s turnout fell by nearly three points and the second lowest quintile’s by nearly
two points in response to attitudinal changes while the highest quintile’s turnout was essentially
unchanged. Both declining interest and partisanship were particularly consequential; each
produced significantly different turnout trends between the former two income groups and the
latter group (see Figure 3).
At the same time, the second lowest income quintile became noticeably younger -- their
average age fell from 48.8 to 44.1 years between these two elections -- and less rooted.14 Their
turnout fell more than two points between these elections as a consequence. In contrast, the top
quintile’s turnout fell less than half a point in response to changes in age and community
residence. For their part, the middle quintile became less likely to attend religious services over
this period and they had a significantly larger turnout decline as a consequence than either richer
or poorer citizens.
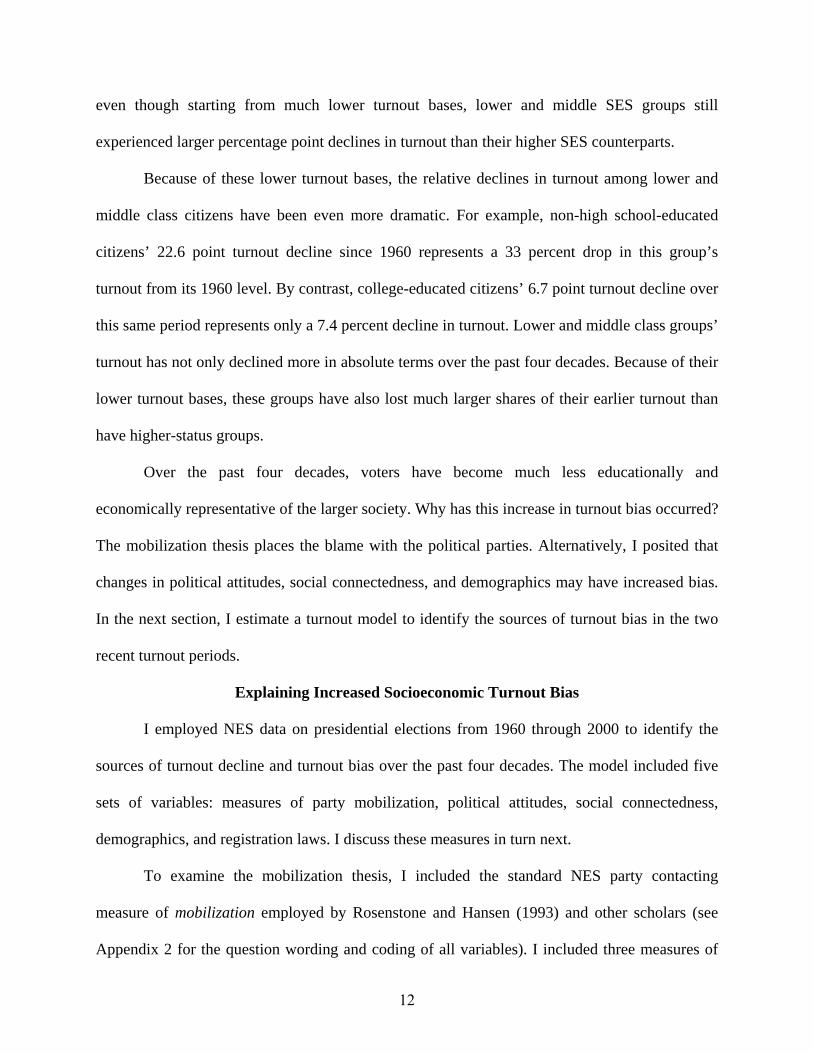
The disproportionate drops in turnout between 1968 and 1972 among middle and lower
education groups were produced by attitudinal changes among these groups. Changes in political
attitudes between 1968 and 1972 dropped turnout among the high school-educated by 2.7 points
and among the non-high school-educated by 1.8 points while reducing turnout among the
college-educated by only .8 points. Declining external efficacy, political interest, and
partisanship all produced significantly larger turnout declines among the high school-educated
than among the college-educated (see Figure 4). Declines in political interest and partisanship
also produced significantly larger turnout declines among the non-high school-educated than
among the college-educated between these two elections.
14 This quintile’s declining age over these two elections does not appear to be the product
of a large concentration of newly eligible 18 to 20 year-old citizens in the quintile. As demonstrated by a one-way ANOVA, the second lowest quintile was no more likely than any other quintile to have 18 to 20 year-olds in 1972.
18
Though political change was less dramatic during the 1972-2000 period than during the
1960-1972 period, social and demographic changes continued apace. Moral and social values
changed. The nation also moved from a manufacturing economy to an information economy. Not
surprisingly, changes in social connectedness and demographics were particularly consequential
for turnout bias between 1972 and 2000.
Declines in social connectedness particularly increased education bias. Between 1972 and
2000, changes in social attachments depressed turnout among the least-educated by three points
and among the high school-educated by 1.7 points while hardly touching turnout among the
college-educated (see Figure 5). Declining religious attendance and marital status both produced
significantly larger turnout declines among the non-college-educated than among the college-
educated.
Income changes also increased turnout bias along education lines between 1972 and
2000. Falling incomes reduced non-college-educated citizens’ turnout significantly more than
college-educated citizens’ over this period. This reflects the increased economic premium placed
on education in recent decades. At the same time, declining partisanship reduced turnout among
the non-college-educated while rising partisanship increased turnout among the college-
educated.
Along income lines, turnout declined more among the middle quintile than among other
quintiles over this period because of changes in social connectedness. The middle quintile’s
turnout fell 1.7 points in response to declining social connectedness, while the top quintile’s
turnout fell only half a point. Middle income citizens’ declining religious attendance and
declining likelihood of being married both depressed the group’s turnout.
It is noteworthy that while changes in political attitudes, social connectedness, and
demographics reduced middle and lower class groups’ turnout over the past four decades,
19
relaxed registration laws, in contrast to Brody’s thesis, did not increase these groups’ turnout.
Relaxed closing dates, in fact, did little to boost turnout among SES groups in any of the time
periods examined here. This is also in contrast to Wolfinger and Rosenstone’s (1980) finding of
a large, 6.1 point turnout increase that would result from removing closing dates altogether.
There are two reasons why relaxed closing dates had a much smaller positive effect on
turnout than the previous literature would suggest. First, although closing dates have been
relaxed over the past several decades, they have not been eliminated entirely. On average,
registration still closed more than 20 days before election day in 2000. Second, closing dates
near election day likely reflect certain states’ commitment to participation. Once the political
attitudes and social connectedness of the citizens in these states are included in a turnout model
(they were absent from Wolfinger and Rosenstone’s model), the independent effects of closing
dates on turnout are reduced.
Conclusion
The significant turnout decline since 1960 in the United States, a principal concern of
both empirical and normative scholars, has not been produced equally by all social classes.
Instead, turnout has declined more among middle and lower education and income groups than
among higher education and income groups. As a consequence of this disproportionate
abstention, an electorate that was already strongly class skewed four decades ago has become
markedly more unrepresentative socioeconomically over the past four decades. Elected officials
are increasingly being chosen by citizens who are educationally and economically
unrepresentative of the broader American society.
In contrast to Rosenstone and Hansen’s and Burnham’s mobilization thesis, changes in
partisan mobilization have not produced this increased socioeconomic turnout bias over the past
four decades. In fact, changes in party mobilization efforts have actually marginally reduced
20
turnout bias over this period. Had the parties produced the increased socioeconomic turnout bias,
a ready remedy would exist to increase representational equity: the parties would simply need to
increase their mobilization of lower class groups. In fact, the parties have already done this, and
turnout bias has increased nonetheless.
In a now classic essay, Brody (1978) argued that the decline in turnout despite rising
education levels and relaxed registration laws constituted the “puzzle of political participation.”
The results in this paper bring us closer to a resolution of Brody’s puzzle. They also argue that
identifying the sources of increased turnout bias is also the key to unlocking Brody’s puzzle.
In contrast to Brody’s thesis, relaxed registration laws did little to boost turnout over the
past four decades. Equally important, the educational upgrading that was central to Brody’s
thesis bypassed a significant portion of the American electorate. By the 2000 election, nearly half
of eligible voters still had not attended college. And in that election, these citizens who had not
attended college turned out at rates more than 20 points below their counterparts from four
decades ago. Turnout declined, and turnout bias increased, in large part because non-college-
educated citizens’ turnout, with little boost from educational upgrading or relaxed registration
laws, was unable to withstand the effects of the attitudinal, social, and demographic trends of the
past four decades.
The educational upgrading that Brody envisioned is a process that will develop only over
the long term. The turnout gains that can be expected to accompany this upgrading will also
therefore accrue only gradually over time. Reversals in turnout bias and turnout decline are all
the more likely to be gradual because of the nature of their attitudinal, social, and demographic
sources. These trends developed over several decades and are unlikely to reverse rapidly in
response to external interventions.
Declining external efficacy since 1960 has depressed turnout among the non-college-
21
educated by four points. For turnout bias and turnout decline to reverse, these citizens will need
to feel much more confident that political elites are responsive to their concerns, and that their
votes, as a consequence, are worth casting. It seems highly unlikely, however, that there is
anything that political elites can, or will, do in the short-term to significantly reverse the decline
in external efficacy.
Beyond this critical attitudinal change, citizens will also need to reconnect with each
other if turnout bias and turnout decline are to reverse. The decline in social connectedness
identified by Putnam and others has significantly depressed turnout. Again, however, any
reversals in social attachments are likely to be only gradual. The minimal and transitory nature of
increases in civic behaviors following the September 11th terrorist attacks (Putnam 2002) suggest
that even a shared, traumatic national experience is limited in its capacity to reconnect citizens to
each other.
Finally, the increased economic premium placed on education since the early 1970s has
reduced earnings among less-educated citizens. This economic premium is structural, a product
of the transition from an industrial economy to an information economy. As a consequence, a
rapid reversal in this earnings decline seems highly unlikely.
The multiple sources of turnout decline and turnout bias raise a troubling normative note
for citizens and groups interested in seeing these participation trends reversed. Lacking the ready
remedy of a change in party mobilization strategies, reform-minded citizens and groups are
dependent instead upon the reversal of multiple attitudinal, social, and demographic trends. By
their nature, these trends are only likely to reverse gradually, if at all. As a consequence, the
reversal of the increased socioeconomic turnout bias that has developed over the past four
decades is likely to be a gradual and incremental process at best.
22
Data
The National Election Studies data used in this paper come from the American National
Election Studies Cumulative Data File, 1948-2000 (ICPSR #8475), the American National
Election Studies, 1948-1997 (CD-ROM) (ICPSR #2536), and the American National Election
Study, 2000: Pre- and Post-Election Survey (ICPSR #3131). The Current Population Surveys
data used in this paper come from The Current Population Survey: Voter Supplement Files,
1972, 1976, 1980, 1984, 1988, 1992, 1996, 2000 (ICPSR #60, 7699, 7875, 8457, 9318, 6365,
2205, 3182). The closing date data used in this paper are from: Council of State Governments.
Various Years. The Book of the States. Lexington, KY: Council of State Governments; Smith,
Constance E. 1960. Voting and Election Laws: Laws for Voters. New York, NY: Oceana; and
Yadlosky, Elizabeth. 1964. “Voting Laws of the 50 States and the District of Columbia.”
Washington, D.C.: U.S. Library of Congress, Legislative Research Service. The closing date data
will be deposited with ICPSR.
23
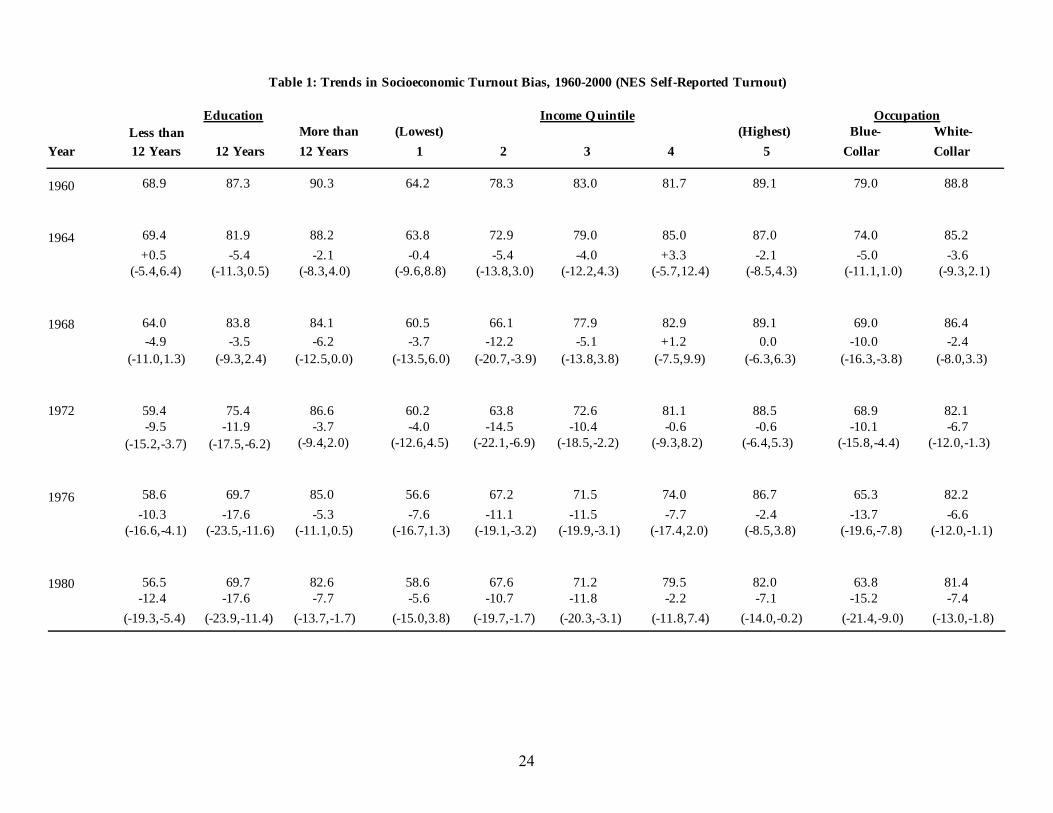
Table 1: Trends in Socioeconomic Turnout Bias, 1960-2000 (NES Self-Reported Turnout)
Education Income Quintile Occupation Less than More than (Lowest) (Highest) Blue- White-
Year 12 Years 12 Years 12 Years 1 2 3 4 5 Collar Collar
1960 68.9 87.3 90.3 64.2 78.3 83.0 81.7 89.1 79.0 88.8
1964 69.4 81.9 88.2 63.8 72.9 79.0 85.0 87.0 74.0 85.2+0.5 -5.4 -2.1 -0.4 -5.4 -4.0 +3.3 -2.1 -5.0 -3.6
(-5.4,6.4) (-11.3,0.5) (-8.3,4.0) (-9.6,8.8) (-13.8,3.0) (-12.2,4.3) (-5.7,12.4) (-8.5,4.3) (-11.1,1.0) (-9.3,2.1)
1968 64.0 83.8 84.1 60.5 66.1 77.9 82.9 89.1 69.0 86.4-4.9 -3.5 -6.2 -3.7 -12.2 -5.1 +1.2 0.0 -10.0 -2.4
(-11.0,1.3) (-9.3,2.4) (-12.5,0.0) (-13.5,6.0) (-20.7,-3.9) (-13.8,3.8) (-7.5,9.9) (-6.3,6.3) (-16.3,-3.8) (-8.0,3.3)
1972 59.4 75.4 86.6 60.2 63.8 72.6 81.1 88.5 68.9 82.1-9.5 -11.9 -3.7 -4.0 -14.5 -10.4 -0.6 -0.6 -10.1 -6.7
(-15.2,-3.7) (-17.5,-6.2) (-9.4,2.0) (-12.6,4.5) (-22.1,-6.9) (-18.5,-2.2) (-9.3,8.2) (-6.4,5.3) (-15.8,-4.4) (-12.0,-1.3)
1976 58.6 69.7 85.0 56.6 67.2 71.5 74.0 86.7 65.3 82.2-10.3 -17.6 -5.3 -7.6 -11.1 -11.5 -7.7 -2.4 -13.7 -6.6
(-16.6,-4.1) (-23.5,-11.6) (-11.1,0.5) (-16.7,1.3) (-19.1,-3.2) (-19.9,-3.1) (-17.4,2.0) (-8.5,3.8) (-19.6,-7.8) (-12.0,-1.1)
1980 56.5 69.7 82.6 58.6 67.6 71.2 79.5 82.0 63.8 81.4-12.4 -17.6 -7.7 -5.6 -10.7 -11.8 -2.2 -7.1 -15.2 -7.4
(-19.3,-5.4) (-23.9,-11.4) (-13.7,-1.7) (-15.0,3.8) (-19.7,-1.7) (-20.3,-3.1) (-11.8,7.4) (-14.0,-0.2) (-21.4,-9.0) (-13.0,-1.8)
24
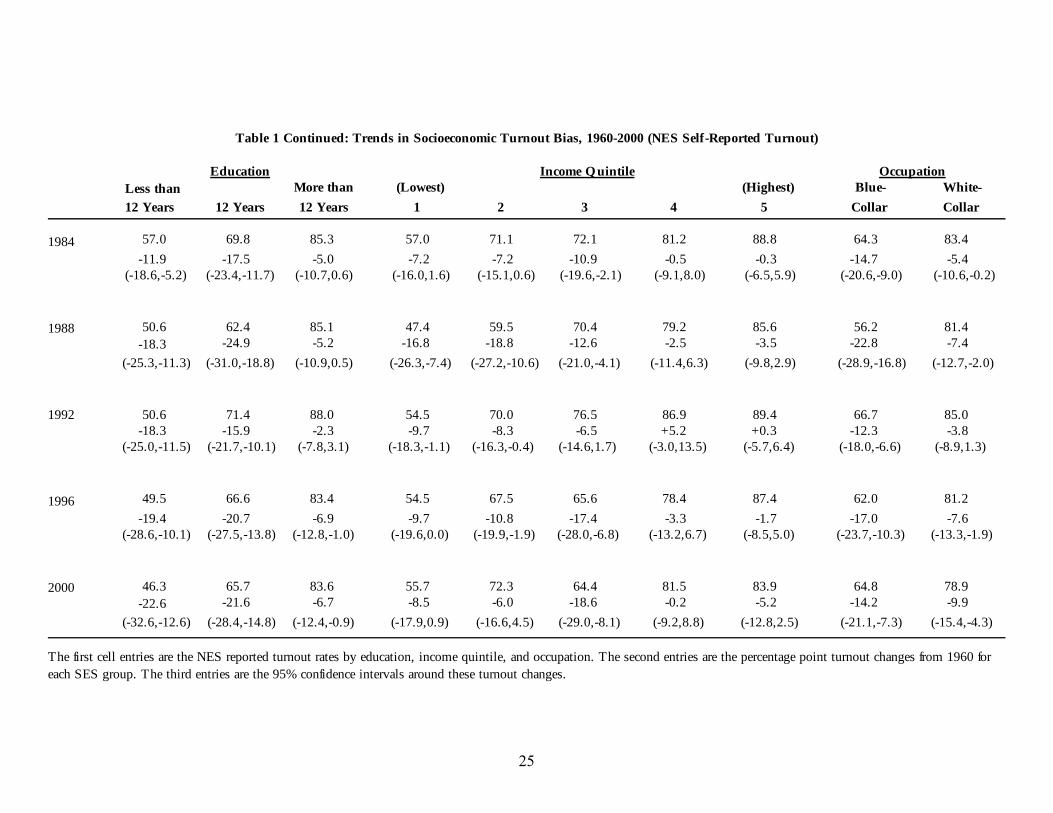
Table 1 Continued: Trends in Socioeconomic Turnout Bias, 1960-2000 (NES Self-Reported Turnout)
Education Income Quintile OccupationLess than More than (Lowest) (Highest) Blue- White-12 Years 12 Years 12 Years 1 2 3 4 5 Collar Collar
1984 57.0 69.8 85.3 57.0 71.1 72.1 81.2 88.8 64.3 83.4-11.9 -17.5 -5.0 -7.2 -7.2 -10.9 -0.5 -0.3 -14.7 -5.4
(-18.6,-5.2) (-23.4,-11.7) (-10.7,0.6) (-16.0,1.6) (-15.1,0.6) (-19.6,-2.1) (-9.1,8.0) (-6.5,5.9) (-20.6,-9.0) (-10.6,-0.2)
1988 50.6 62.4 85.1 47.4 59.5 70.4 79.2 85.6 56.2 81.4-18.3 -24.9 -5.2 -16.8 -18.8 -12.6 -2.5 -3.5 -22.8 -7.4
(-25.3,-11.3) (-31.0,-18.8) (-10.9,0.5) (-26.3,-7.4) (-27.2,-10.6) (-21.0,-4.1) (-11.4,6.3) (-9.8,2.9) (-28.9,-16.8) (-12.7,-2.0)
1992 50.6 71.4 88.0 54.5 70.0 76.5 86.9 89.4 66.7 85.0-18.3 -15.9 -2.3 -9.7 -8.3 -6.5 +5.2 +0.3 -12.3 -3.8
(-25.0,-11.5) (-21.7,-10.1) (-7.8,3.1) (-18.3,-1.1) (-16.3,-0.4) (-14.6,1.7) (-3.0,13.5) (-5.7,6.4) (-18.0,-6.6) (-8.9,1.3)
1996 49.5 66.6 83.4 54.5 67.5 65.6 78.4 87.4 62.0 81.2-19.4 -20.7 -6.9 -9.7 -10.8 -17.4 -3.3 -1.7 -17.0 -7.6
(-28.6,-10.1) (-27.5,-13.8) (-12.8,-1.0) (-19.6,0.0) (-19.9,-1.9) (-28.0,-6.8) (-13.2,6.7) (-8.5,5.0) (-23.7,-10.3) (-13.3,-1.9)
2000 46.3 65.7 83.6 55.7 72.3 64.4 81.5 83.9 64.8 78.9-22.6 -21.6 -6.7 -8.5 -6.0 -18.6 -0.2 -5.2 -14.2 -9.9
(-32.6,-12.6) (-28.4,-14.8) (-12.4,-0.9) (-17.9,0.9) (-16.6,4.5) (-29.0,-8.1) (-9.2,8.8) (-12.8,2.5) (-21.1,-7.3) (-15.4,-4.3)
The first cell entries are the NES reported turnout rates by education, income quintile, and occupation. The second entries are the percentage point turnout changes from 1960 foreach SES group. The third entries are the 95% confidence intervals around these turnout changes.
25
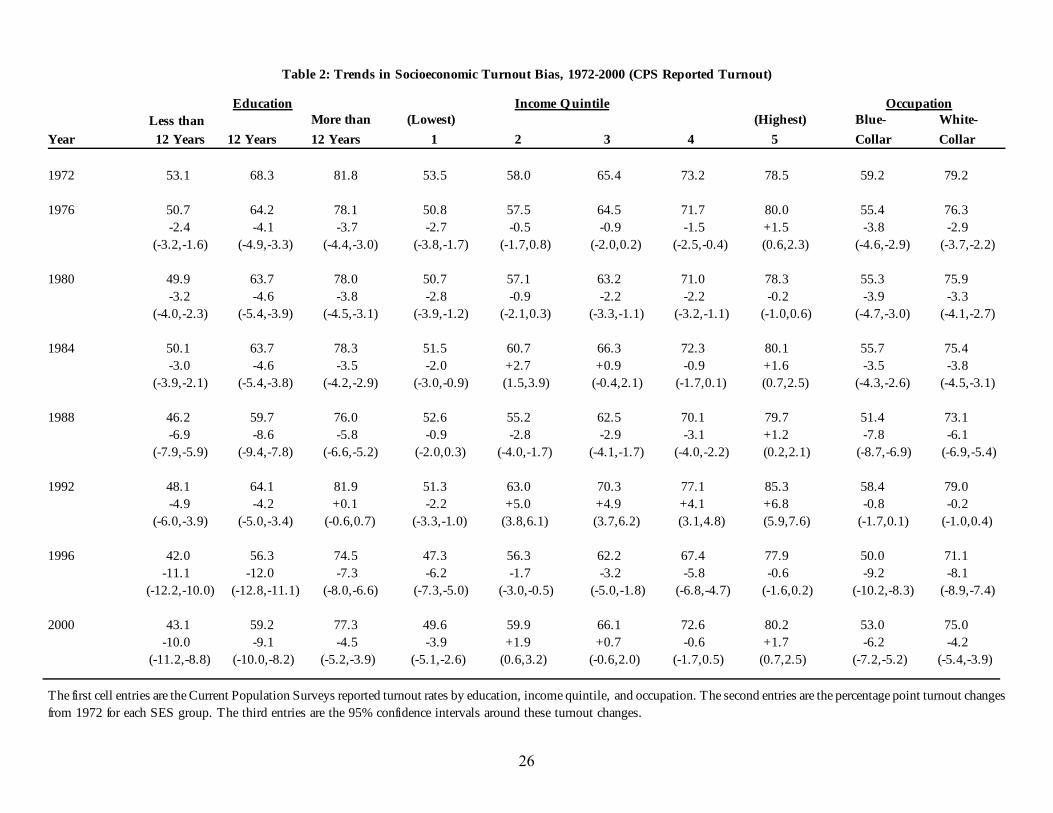
Table 2: Trends in Socioeconomic Turnout Bias, 1972-2000 (CPS Reported Turnout)
Education Income Quintile OccupationLess than More than (Lowest) (Highest) Blue- White-
Year 12 Years 12 Years 12 Years 1 2 3 4 5 Collar Collar
1972 53.1 68.3 81.8 53.5 58.0 65.4 73.2 78.5 59.2 79.2
1976 50.7 64.2 78.1 50.8 57.5 64.5 71.7 80.0 55.4 76.3-2.4 -4.1 -3.7 -2.7 -0.5 -0.9 -1.5 +1.5 -3.8 -2.9
(-3.2,-1.6) (-4.9,-3.3) (-4.4,-3.0) (-3.8,-1.7) (-1.7,0.8) (-2.0,0.2) (-2.5,-0.4) (0.6,2.3) (-4.6,-2.9) (-3.7,-2.2)
1980 49.9 63.7 78.0 50.7 57.1 63.2 71.0 78.3 55.3 75.9-3.2 -4.6 -3.8 -2.8 -0.9 -2.2 -2.2 -0.2 -3.9 -3.3
(-4.0,-2.3) (-5.4,-3.9) (-4.5,-3.1) (-3.9,-1.2) (-2.1,0.3) (-3.3,-1.1) (-3.2,-1.1) (-1.0,0.6) (-4.7,-3.0) (-4.1,-2.7)
1984 50.1 63.7 78.3 51.5 60.7 66.3 72.3 80.1 55.7 75.4-3.0 -4.6 -3.5 -2.0 +2.7 +0.9 -0.9 +1.6 -3.5 -3.8
(-3.9,-2.1) (-5.4,-3.8) (-4.2,-2.9) (-3.0,-0.9) (1.5,3.9) (-0.4,2.1) (-1.7,0.1) (0.7,2.5) (-4.3,-2.6) (-4.5,-3.1)
1988 46.2 59.7 76.0 52.6 55.2 62.5 70.1 79.7 51.4 73.1-6.9 -8.6 -5.8 -0.9 -2.8 -2.9 -3.1 +1.2 -7.8 -6.1
(-7.9,-5.9) (-9.4,-7.8) (-6.6,-5.2) (-2.0,0.3) (-4.0,-1.7) (-4.1,-1.7) (-4.0,-2.2) (0.2,2.1) (-8.7,-6.9) (-6.9,-5.4)
1992 48.1 64.1 81.9 51.3 63.0 70.3 77.1 85.3 58.4 79.0-4.9 -4.2 +0.1 -2.2 +5.0 +4.9 +4.1 +6.8 -0.8 -0.2
(-6.0,-3.9) (-5.0,-3.4) (-0.6,0.7) (-3.3,-1.0) (3.8,6.1) (3.7,6.2) (3.1,4.8) (5.9,7.6) (-1.7,0.1) (-1.0,0.4)
1996 42.0 56.3 74.5 47.3 56.3 62.2 67.4 77.9 50.0 71.1-11.1 -12.0 -7.3 -6.2 -1.7 -3.2 -5.8 -0.6 -9.2 -8.1
(-12.2,-10.0) (-12.8,-11.1) (-8.0,-6.6) (-7.3,-5.0) (-3.0,-0.5) (-5.0,-1.8) (-6.8,-4.7) (-1.6,0.2) (-10.2,-8.3) (-8.9,-7.4)
2000 43.1 59.2 77.3 49.6 59.9 66.1 72.6 80.2 53.0 75.0-10.0 -9.1 -4.5 -3.9 +1.9 +0.7 -0.6 +1.7 -6.2 -4.2
(-11.2,-8.8) (-10.0,-8.2) (-5.2,-3.9) (-5.1,-2.6) (0.6,3.2) (-0.6,2.0) (-1.7,0.5) (0.7,2.5) (-7.2,-5.2) (-5.4,-3.9)
The first cell entries are the Current Population Surveys reported turnout rates by education, income quintile, and occupation. The second entries are the percentage point turnout changesfrom 1972 for each SES group. The third entries are the 95% confidence intervals around these turnout changes.
26
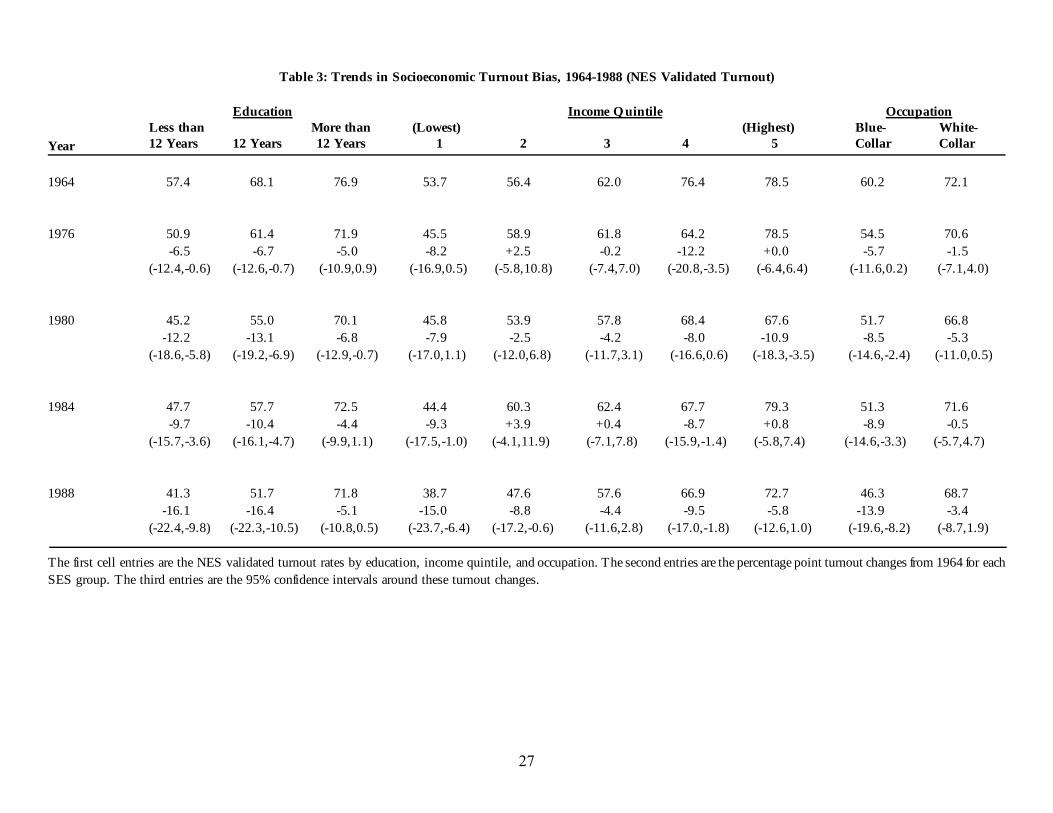
Table 3: Trends in Socioeconomic Turnout Bias, 1964-1988 (NES Validated Turnout)
Education Income Quintile OccupationLess than More than (Lowest) (Highest) Blue- White-
Year 12 Years 12 Years 12 Years 1 2 3 4 5 Collar Collar
1964 57.4 68.1 76.9 53.7 56.4 62.0 76.4 78.5 60.2 72.1
1976 50.9 61.4 71.9 45.5 58.9 61.8 64.2 78.5 54.5 70.6-6.5 -6.7 -5.0 -8.2 +2.5 -0.2 -12.2 +0.0 -5.7 -1.5
(-12.4,-0.6) (-12.6,-0.7) (-10.9,0.9) (-16.9,0.5) (-5.8,10.8) (-7.4,7.0) (-20.8,-3.5) (-6.4,6.4) (-11.6,0.2) (-7.1,4.0)
1980 45.2 55.0 70.1 45.8 53.9 57.8 68.4 67.6 51.7 66.8-12.2 -13.1 -6.8 -7.9 -2.5 -4.2 -8.0 -10.9 -8.5 -5.3
(-18.6,-5.8) (-19.2,-6.9) (-12.9,-0.7) (-17.0,1.1) (-12.0,6.8) (-11.7,3.1) (-16.6,0.6) (-18.3,-3.5) (-14.6,-2.4) (-11.0,0.5)
1984 47.7 57.7 72.5 44.4 60.3 62.4 67.7 79.3 51.3 71.6-9.7 -10.4 -4.4 -9.3 +3.9 +0.4 -8.7 +0.8 -8.9 -0.5
(-15.7,-3.6) (-16.1,-4.7) (-9.9,1.1) (-17.5,-1.0) (-4.1,11.9) (-7.1,7.8) (-15.9,-1.4) (-5.8,7.4) (-14.6,-3.3) (-5.7,4.7)
1988 41.3 51.7 71.8 38.7 47.6 57.6 66.9 72.7 46.3 68.7-16.1 -16.4 -5.1 -15.0 -8.8 -4.4 -9.5 -5.8 -13.9 -3.4
(-22.4,-9.8) (-22.3,-10.5) (-10.8,0.5) (-23.7,-6.4) (-17.2,-0.6) (-11.6,2.8) (-17.0,-1.8) (-12.6,1.0) (-19.6,-8.2) (-8.7,1.9)
The first cell entries are the NES validated turnout rates by education, income quintile, and occupation. The second entries are the percentage point turnout changes from 1964 for eachSES group. The third entries are the 95% confidence intervals around these turnout changes.
27
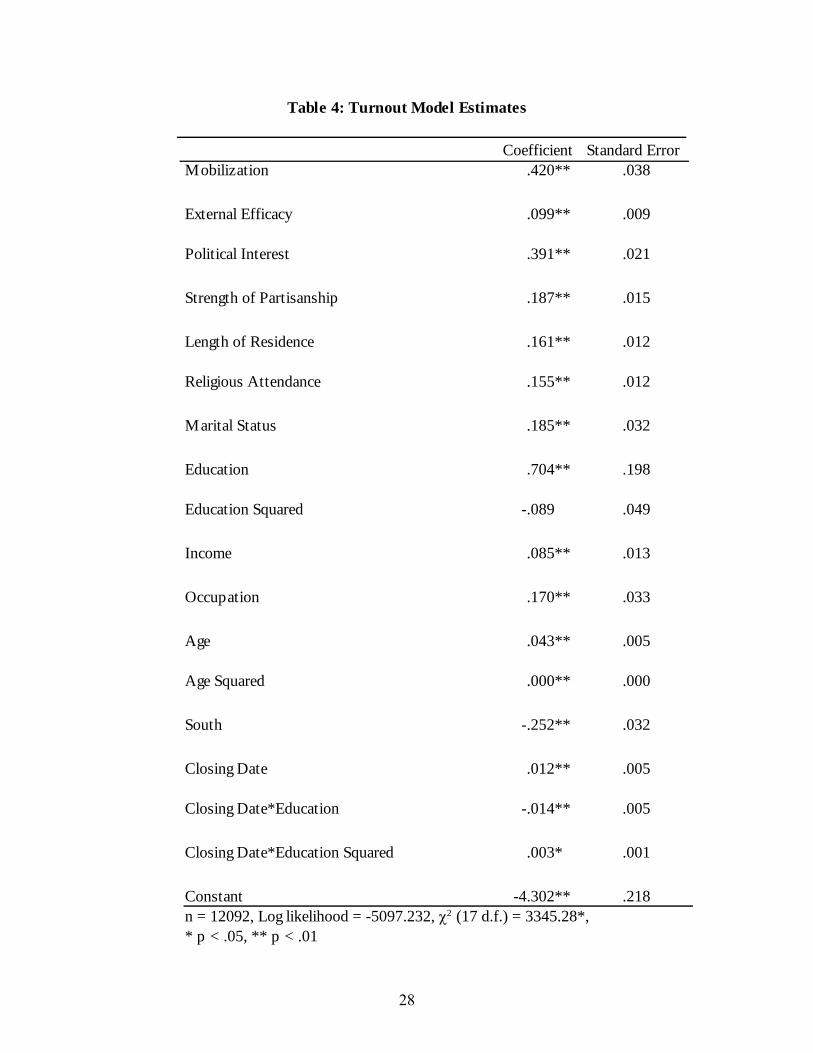
Table 4: Turnout Model Estimates
Coefficient Standard ErrorMobilization .420** .038
External Efficacy .099** .009
Political Interest .391** .021
Strength of Partisanship .187** .015
Length of Residence .161** .012
Religious Attendance .155** .012
Marital Status .185** .032
Education .704** .198
Education Squared -.089 .049
Income .085** .013
Occupation .170** .033
Age .043** .005
Age Squared .000** .000
South -.252** .032
Closing Date .012** .005
Closing Date*Education -.014** .005
Closing Date*Education Squared .003* .001
Constant -4.302** .218n = 12092, Log likelihood = -5097.232, χ2 (17 d.f.) = 3345.28*, * p < .05, ** p < .01
28
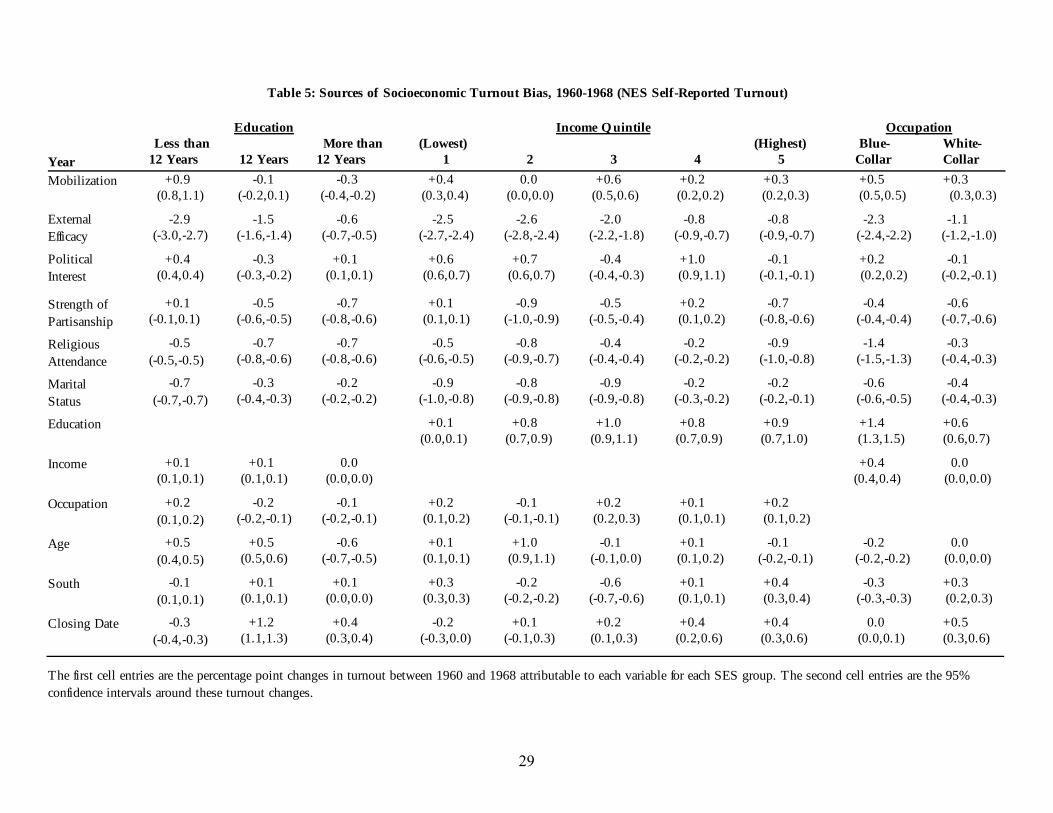
Table 5: Sources of Socioeconomic Turnout Bias, 1960-1968 (NES Self-Reported Turnout)
Education Income Quintile Occupation Less than More than (Lowest) (Highest) Blue- White-
Year 12 Years 12 Years 12 Years 1 2 3 4 5 Collar CollarMobilization +0.9 -0.1 -0.3 +0.4 0.0 +0.6 +0.2 +0.3 +0.5 +0.3
(0.8,1.1) (-0.2,0.1) (-0.4,-0.2) (0.3,0.4) (0.0,0.0) (0.5,0.6) (0.2,0.2) (0.2,0.3) (0.5,0.5) (0.3,0.3)
External -2.9 -1.5 -0.6 -2.5 -2.6 -2.0 -0.8 -0.8 -2.3 -1.1Efficacy (-3.0,-2.7) (-1.6,-1.4) (-0.7,-0.5) (-2.7,-2.4) (-2.8,-2.4) (-2.2,-1.8) (-0.9,-0.7) (-0.9,-0.7) (-2.4,-2.2) (-1.2,-1.0)
Political +0.4 -0.3 +0.1 +0.6 +0.7 -0.4 +1.0 -0.1 +0.2 -0.1Interest (0.4,0.4) (-0.3,-0.2) (0.1,0.1) (0.6,0.7) (0.6,0.7) (-0.4,-0.3) (0.9,1.1) (-0.1,-0.1) (0.2,0.2) (-0.2,-0.1)
Strength of +0.1 -0.5 -0.7 +0.1 -0.9 -0.5 +0.2 -0.7 -0.4 -0.6Partisanship (-0.1,0.1) (-0.6,-0.5) (-0.8,-0.6) (0.1,0.1) (-1.0,-0.9) (-0.5,-0.4) (0.1,0.2) (-0.8,-0.6) (-0.4,-0.4) (-0.7,-0.6)
Religious -0.5 -0.7 -0.7 -0.5 -0.8 -0.4 -0.2 -0.9 -1.4 -0.3Attendance (-0.5,-0.5) (-0.8,-0.6) (-0.8,-0.6) (-0.6,-0.5) (-0.9,-0.7) (-0.4,-0.4) (-0.2,-0.2) (-1.0,-0.8) (-1.5,-1.3) (-0.4,-0.3)
Marital -0.7 -0.3 -0.2 -0.9 -0.8 -0.9 -0.2 -0.2 -0.6 -0.4Status (-0.7,-0.7) (-0.4,-0.3) (-0.2,-0.2) (-1.0,-0.8) (-0.9,-0.8) (-0.9,-0.8) (-0.3,-0.2) (-0.2,-0.1) (-0.6,-0.5) (-0.4,-0.3)
Education +0.1 +0.8 +1.0 +0.8 +0.9 +1.4 +0.6(0.0,0.1) (0.7,0.9) (0.9,1.1) (0.7,0.9) (0.7,1.0) (1.3,1.5) (0.6,0.7)
Income +0.1 +0.1 0.0 +0.4 0.0(0.1,0.1) (0.1,0.1) (0.0,0.0) (0.4,0.4) (0.0,0.0)
Occupation +0.2 -0.2 -0.1 +0.2 -0.1 +0.2 +0.1 +0.2(0.1,0.2) (-0.2,-0.1) (-0.2,-0.1) (0.1,0.2) (-0.1,-0.1) (0.2,0.3) (0.1,0.1) (0.1,0.2)
Age +0.5 +0.5 -0.6 +0.1 +1.0 -0.1 +0.1 -0.1 -0.2 0.0(0.4,0.5) (0.5,0.6) (-0.7,-0.5) (0.1,0.1) (0.9,1.1) (-0.1,0.0) (0.1,0.2) (-0.2,-0.1) (-0.2,-0.2) (0.0,0.0)
South -0.1 +0.1 +0.1 +0.3 -0.2 -0.6 +0.1 +0.4 -0.3 +0.3(0.1,0.1) (0.1,0.1) (0.0,0.0) (0.3,0.3) (-0.2,-0.2) (-0.7,-0.6) (0.1,0.1) (0.3,0.4) (-0.3,-0.3) (0.2,0.3)
Closing Date -0.3 +1.2 +0.4 -0.2 +0.1 +0.2 +0.4 +0.4 0.0 +0.5(-0.4,-0.3) (1.1,1.3) (0.3,0.4) (-0.3,0.0) (-0.1,0.3) (0.1,0.3) (0.2,0.6) (0.3,0.6) (0.0,0.1) (0.3,0.6)
The first cell entries are the percentage point changes in turnout between 1960 and 1968 attributable to each variable for each SES group. The second cell entries are the 95%confidence intervals around these turnout changes.
29
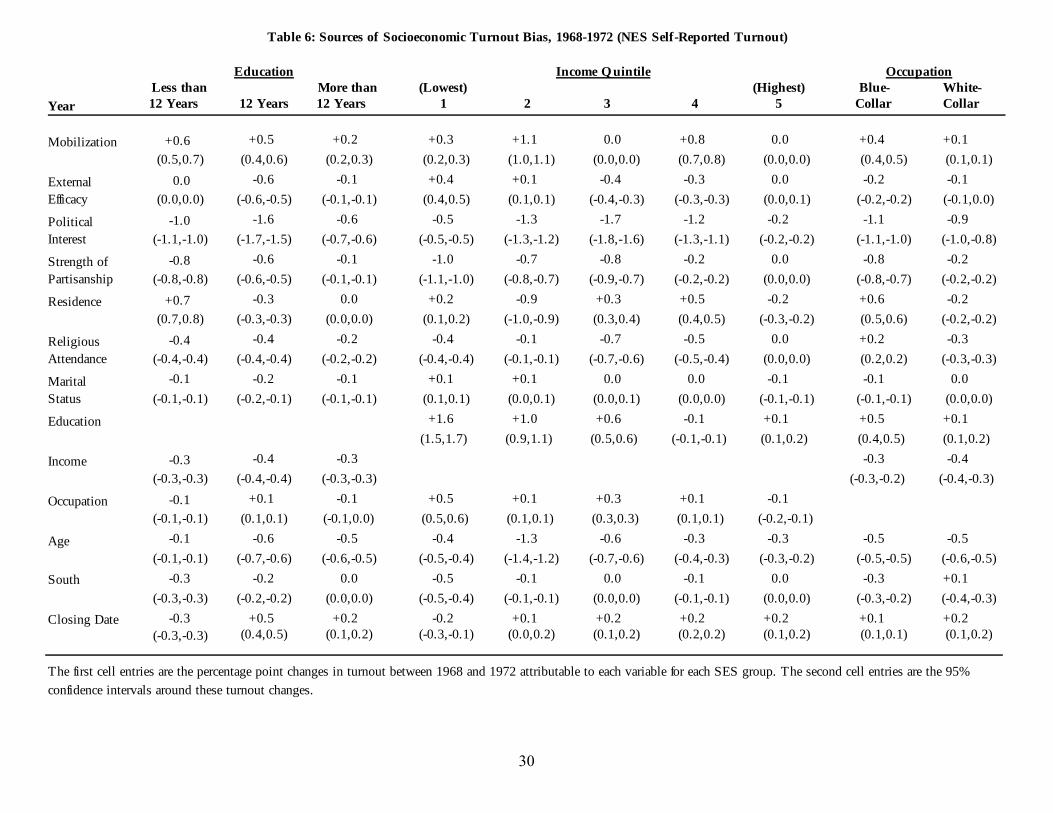
Table 6: Sources of Socioeconomic Turnout Bias, 1968-1972 (NES Self-Reported Turnout)
Education Income Quintile OccupationLess than More than (Lowest) (Highest) Blue- White-
Year 12 Years 12 Years 12 Years 1 2 3 4 5 Collar Collar
Mobilization +0.6 +0.5 +0.2 +0.3 +1.1 0.0 +0.8 0.0 +0.4 +0.1(0.5,0.7) (0.4,0.6) (0.2,0.3) (0.2,0.3) (1.0,1.1) (0.0,0.0) (0.7,0.8) (0.0,0.0) (0.4,0.5) (0.1,0.1)
External 0.0 -0.6 -0.1 +0.4 +0.1 -0.4 -0.3 0.0 -0.2 -0.1Efficacy (0.0,0.0) (-0.6,-0.5) (-0.1,-0.1) (0.4,0.5) (0.1,0.1) (-0.4,-0.3) (-0.3,-0.3) (0.0,0.1) (-0.2,-0.2) (-0.1,0.0)
Political -1.0 -1.6 -0.6 -0.5 -1.3 -1.7 -1.2 -0.2 -1.1 -0.9Interest (-1.1,-1.0) (-1.7,-1.5) (-0.7,-0.6) (-0.5,-0.5) (-1.3,-1.2) (-1.8,-1.6) (-1.3,-1.1) (-0.2,-0.2) (-1.1,-1.0) (-1.0,-0.8)
Strength of -0.8 -0.6 -0.1 -1.0 -0.7 -0.8 -0.2 0.0 -0.8 -0.2Partisanship (-0.8,-0.8) (-0.6,-0.5) (-0.1,-0.1) (-1.1,-1.0) (-0.8,-0.7) (-0.9,-0.7) (-0.2,-0.2) (0.0,0.0) (-0.8,-0.7) (-0.2,-0.2)
Residence +0.7 -0.3 0.0 +0.2 -0.9 +0.3 +0.5 -0.2 +0.6 -0.2(0.7,0.8) (-0.3,-0.3) (0.0,0.0) (0.1,0.2) (-1.0,-0.9) (0.3,0.4) (0.4,0.5) (-0.3,-0.2) (0.5,0.6) (-0.2,-0.2)
Religious -0.4 -0.4 -0.2 -0.4 -0.1 -0.7 -0.5 0.0 +0.2 -0.3Attendance (-0.4,-0.4) (-0.4,-0.4) (-0.2,-0.2) (-0.4,-0.4) (-0.1,-0.1) (-0.7,-0.6) (-0.5,-0.4) (0.0,0.0) (0.2,0.2) (-0.3,-0.3)
Marital -0.1 -0.2 -0.1 +0.1 +0.1 0.0 0.0 -0.1 -0.1 0.0Status (-0.1,-0.1) (-0.2,-0.1) (-0.1,-0.1) (0.1,0.1) (0.0,0.1) (0.0,0.1) (0.0,0.0) (-0.1,-0.1) (-0.1,-0.1) (0.0,0.0)
Education +1.6 +1.0 +0.6 -0.1 +0.1 +0.5 +0.1(1.5,1.7) (0.9,1.1) (0.5,0.6) (-0.1,-0.1) (0.1,0.2) (0.4,0.5) (0.1,0.2)
Income -0.3 -0.4 -0.3 -0.3 -0.4(-0.3,-0.3) (-0.4,-0.4) (-0.3,-0.3) (-0.3,-0.2) (-0.4,-0.3)
Occupation -0.1 +0.1 -0.1 +0.5 +0.1 +0.3 +0.1 -0.1(-0.1,-0.1) (0.1,0.1) (-0.1,0.0) (0.5,0.6) (0.1,0.1) (0.3,0.3) (0.1,0.1) (-0.2,-0.1)
Age -0.1 -0.6 -0.5 -0.4 -1.3 -0.6 -0.3 -0.3 -0.5 -0.5(-0.1,-0.1) (-0.7,-0.6) (-0.6,-0.5) (-0.5,-0.4) (-1.4,-1.2) (-0.7,-0.6) (-0.4,-0.3) (-0.3,-0.2) (-0.5,-0.5) (-0.6,-0.5)
South -0.3 -0.2 0.0 -0.5 -0.1 0.0 -0.1 0.0 -0.3 +0.1(-0.3,-0.3) (-0.2,-0.2) (0.0,0.0) (-0.5,-0.4) (-0.1,-0.1) (0.0,0.0) (-0.1,-0.1) (0.0,0.0) (-0.3,-0.2) (-0.4,-0.3)
Closing Date -0.3 +0.5 +0.2 -0.2 +0.1 +0.2 +0.2 +0.2 +0.1 +0.2(-0.3,-0.3) (0.4,0.5) (0.1,0.2) (-0.3,-0.1) (0.0,0.2) (0.1,0.2) (0.2,0.2) (0.1,0.2) (0.1,0.1) (0.1,0.2)
The first cell entries are the percentage point changes in turnout between 1968 and 1972 attributable to each variable for each SES group. The second cell entries are the 95%confidence intervals around these turnout changes.
30
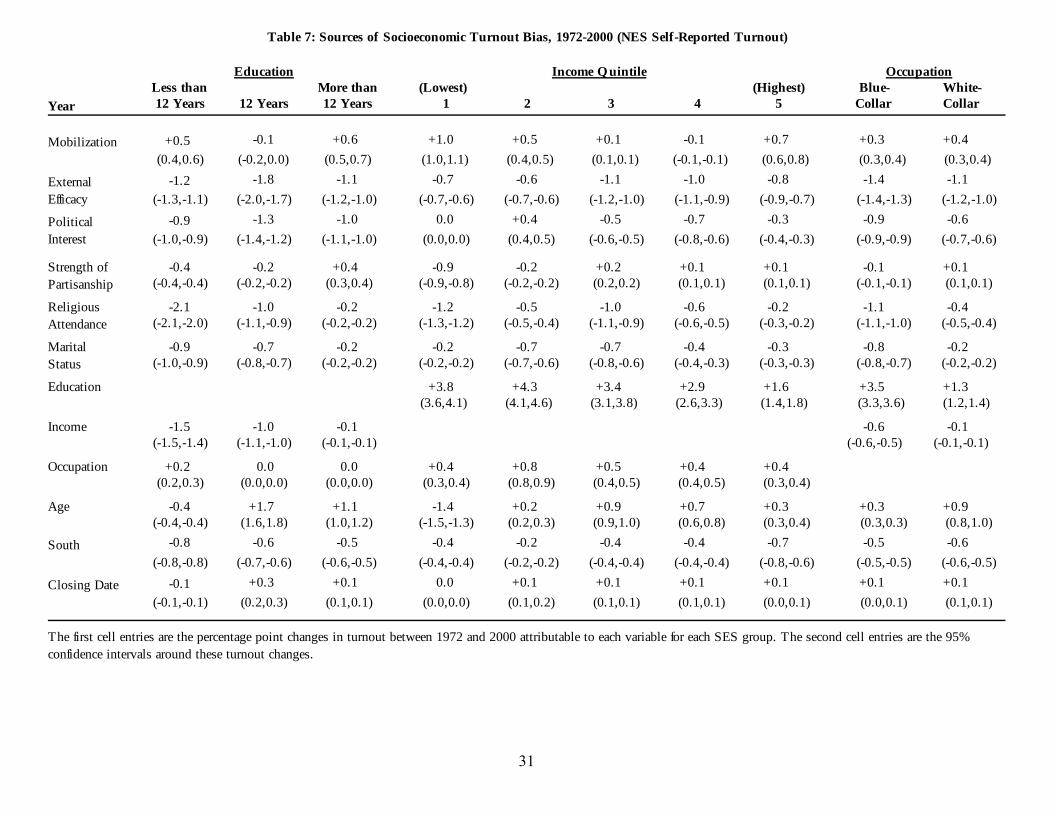
Table 7: Sources of Socioeconomic Turnout Bias, 1972-2000 (NES Self-Reported Turnout)
Education Income Quintile OccupationLess than More than (Lowest) (Highest) Blue- White-
Year 12 Years 12 Years 12 Years 1 2 3 4 5 Collar Collar
Mobilization +0.5 -0.1 +0.6 +1.0 +0.5 +0.1 -0.1 +0.7 +0.3 +0.4(0.4,0.6) (-0.2,0.0) (0.5,0.7) (1.0,1.1) (0.4,0.5) (0.1,0.1) (-0.1,-0.1) (0.6,0.8) (0.3,0.4) (0.3,0.4)
External -1.2 -1.8 -1.1 -0.7 -0.6 -1.1 -1.0 -0.8 -1.4 -1.1Efficacy (-1.3,-1.1) (-2.0,-1.7) (-1.2,-1.0) (-0.7,-0.6) (-0.7,-0.6) (-1.2,-1.0) (-1.1,-0.9) (-0.9,-0.7) (-1.4,-1.3) (-1.2,-1.0)
Political -0.9 -1.3 -1.0 0.0 +0.4 -0.5 -0.7 -0.3 -0.9 -0.6Interest (-1.0,-0.9) (-1.4,-1.2) (-1.1,-1.0) (0.0,0.0) (0.4,0.5) (-0.6,-0.5) (-0.8,-0.6) (-0.4,-0.3) (-0.9,-0.9) (-0.7,-0.6)
Strength of -0.4 -0.2 +0.4 -0.9 -0.2 +0.2 +0.1 +0.1 -0.1 +0.1Partisanship (-0.4,-0.4) (-0.2,-0.2) (0.3,0.4) (-0.9,-0.8) (-0.2,-0.2) (0.2,0.2) (0.1,0.1) (0.1,0.1) (-0.1,-0.1) (0.1,0.1)
Religious -2.1 -1.0 -0.2 -1.2 -0.5 -1.0 -0.6 -0.2 -1.1 -0.4Attendance (-2.1,-2.0) (-1.1,-0.9) (-0.2,-0.2) (-1.3,-1.2) (-0.5,-0.4) (-1.1,-0.9) (-0.6,-0.5) (-0.3,-0.2) (-1.1,-1.0) (-0.5,-0.4)
Marital -0.9 -0.7 -0.2 -0.2 -0.7 -0.7 -0.4 -0.3 -0.8 -0.2Status (-1.0,-0.9) (-0.8,-0.7) (-0.2,-0.2) (-0.2,-0.2) (-0.7,-0.6) (-0.8,-0.6) (-0.4,-0.3) (-0.3,-0.3) (-0.8,-0.7) (-0.2,-0.2)
Education +3.8 +4.3 +3.4 +2.9 +1.6 +3.5 +1.3(3.6,4.1) (4.1,4.6) (3.1,3.8) (2.6,3.3) (1.4,1.8) (3.3,3.6) (1.2,1.4)
Income -1.5 -1.0 -0.1 -0.6 -0.1(-1.5,-1.4) (-1.1,-1.0) (-0.1,-0.1) (-0.6,-0.5) (-0.1,-0.1)
Occupation +0.2 0.0 0.0 +0.4 +0.8 +0.5 +0.4 +0.4(0.2,0.3) (0.0,0.0) (0.0,0.0) (0.3,0.4) (0.8,0.9) (0.4,0.5) (0.4,0.5) (0.3,0.4)
Age -0.4 +1.7 +1.1 -1.4 +0.2 +0.9 +0.7 +0.3 +0.3 +0.9(-0.4,-0.4) (1.6,1.8) (1.0,1.2) (-1.5,-1.3) (0.2,0.3) (0.9,1.0) (0.6,0.8) (0.3,0.4) (0.3,0.3) (0.8,1.0)
South -0.8 -0.6 -0.5 -0.4 -0.2 -0.4 -0.4 -0.7 -0.5 -0.6(-0.8,-0.8) (-0.7,-0.6) (-0.6,-0.5) (-0.4,-0.4) (-0.2,-0.2) (-0.4,-0.4) (-0.4,-0.4) (-0.8,-0.6) (-0.5,-0.5) (-0.6,-0.5)
Closing Date -0.1 +0.3 +0.1 0.0 +0.1 +0.1 +0.1 +0.1 +0.1 +0.1(-0.1,-0.1) (0.2,0.3) (0.1,0.1) (0.0,0.0) (0.1,0.2) (0.1,0.1) (0.1,0.1) (0.0,0.1) (0.0,0.1) (0.1,0.1)
The first cell entries are the percentage point changes in turnout between 1972 and 2000 attributable to each variable for each SES group. The second cell entries are the 95%confidence intervals around these turnout changes.
31
By Income
45
50
55
60
65
70
75
80
85
90
95
1960 1964 1968 1972 1976 1980 1984 1988 1992 1996 2000
Tur
nout
Quintile 1(Lowest)
Quintile 2 Quintile 3
Quintile 4 Quintile 5(Highest)
Figure 1: NES Reported Turnout 1960-2000
By Education
45
50
55
60
65
70
75
80
85
90
95
1960 1964 1968 1972 1976 1980 1984 1988 1992 1996 2000
Tur
nout
Less than12 Years
12 Years More than12 Years
By Occupation
45
50
55
60
65
70
75
80
85
90
95
1960 1964 1968 1972 1976 1980 1984 1988 1992 1996 2000
Tur
nout
Blue-Collar White-Collar
32
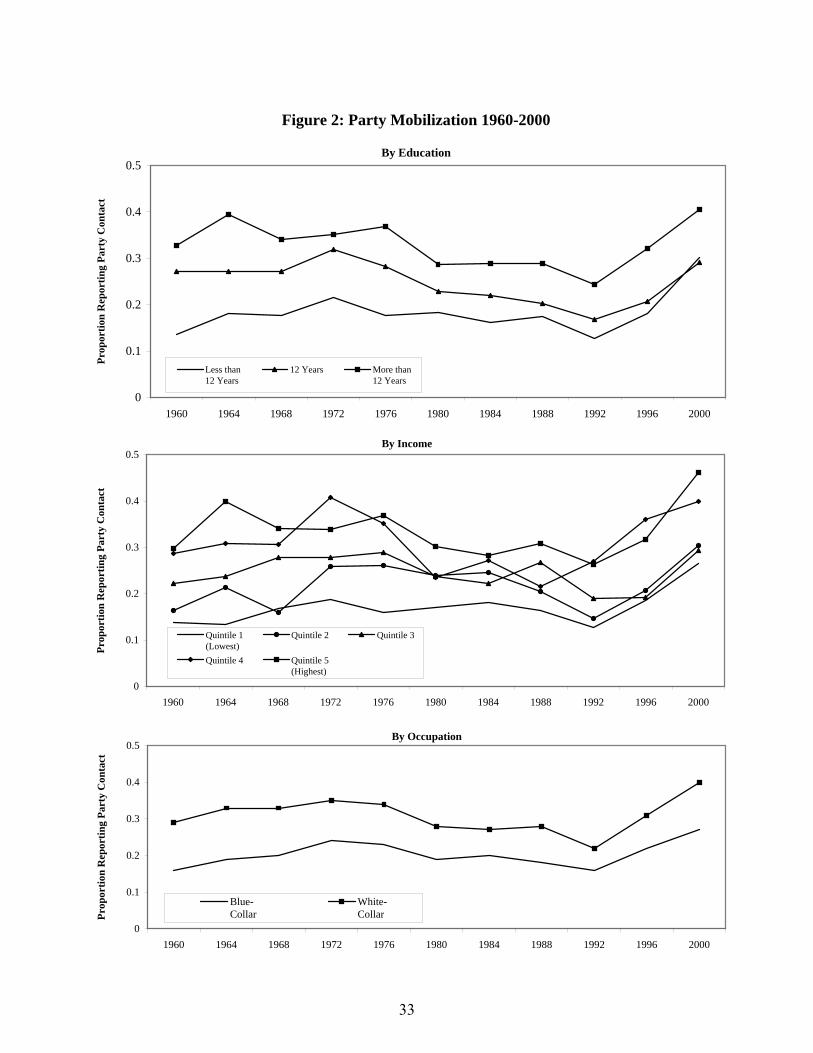
Figure 2: Party Mobilization 1960-2000
By Education
0
0.1
0.2
0.3
0.4
0.5
1960 1964 1968 1972 1976 1980 1984 1988 1992 1996 2000
Prop
ortio
n R
epor
ting
Part
y C
onta
ct
Less than12 Years
12 Years More than12 Years
By Occupation
0
0.1
0.2
0.3
0.4
0.5
1960 1964 1968 1972 1976 1980 1984 1988 1992 1996 2000
Prop
ortio
n R
epor
ting
Part
y C
onta
ct
Blue-Collar
White-Collar
By Income
0
0.1
0.2
0.3
0.4
0.5
1960 1964 1968 1972 1976 1980 1984 1988 1992 1996 2000
Prop
ortio
n R
epor
ting
Part
y C
onta
ct
Quintile 1(Lowest)
Quintile 2 Quintile 3
Quintile 4 Quintile 5(Highest)
33
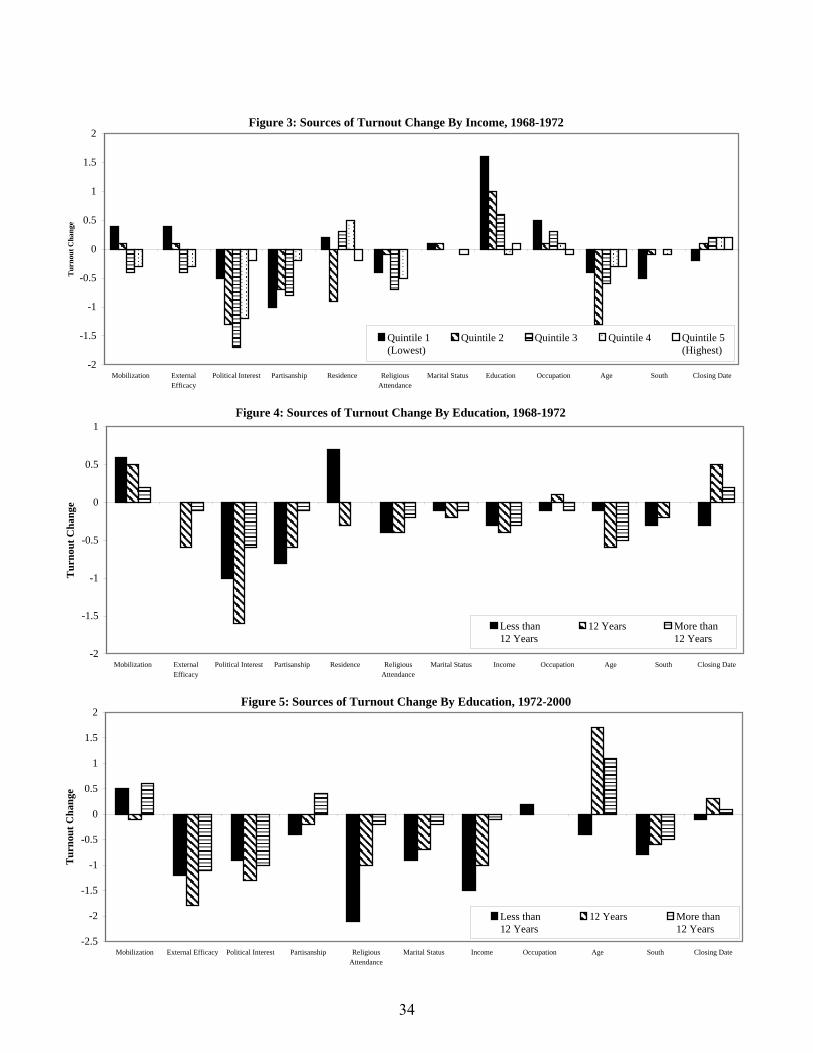
Figure 4: Sources of Turnout Change By Education, 1968-1972
-2
-1.5
-1
-0.5
0
0.5
1
Mobilization ExternalEfficacy
Political Interest Partisanship Residence ReligiousAttendance
Marital Status Income Occupation Age South Closing Date
Tur
nout
Cha
nge
Less than12 Years
12 Years More than12 Years
Figure 5: Sources of Turnout Change By Education, 1972-2000
-2.5
-2
-1.5
-1
-0.5
0
0.5
1
1.5
2
Mobilization External Efficacy Political Interest Partisanship ReligiousAttendance
Marital Status Income Occupation Age South Closing Date
Tur
nout
Cha
nge
Less than12 Years
12 Years More than12 Years
Figure 3: Sources of Turnout Change By Income, 1968-1972
-2
-1.5
-1
-0.5
0
0.5
1
1.5
2
Mobilization ExternalEfficacy
Political Interest Partisanship Residence ReligiousAttendance
Marital Status Education Occupation Age South Closing Date
Tur
nout
Cha
nge
Quintile 1(Lowest)
Quintile 2 Quintile 3 Quintile 4 Quintile 5(Highest)
34
Appendix 1Number of Respondents in Each SES Group
Education Income Quintile OccupationLess Than More than (Lowest) (Highest) Blue- White-
Year 12 Years 12 Years 12 Years 1 2 3 4 5 Collar Collar1960 NES 542 (49.0) 320 (28.9) 244 (22.1) 250 (22.7) 228 (20.7) 186 (16.9) 159 (14.5) 279 (25.3) 420 (56.5) 323 (43.5)
1964 NES 647 (44.8) 458 (31.7) 338 (23.4) 271 (19.4) 255 (18.2) 362 (25.9) 220 (15.7) 292 (20.9) 522 (53.2) 459 (46.8)1964 NES (V) 549 (43.3) 407 (32.1) 312 (24.6) 216 (17.5) 225 (18.3) 324 (26.3) 203 (16.5) 265 (21.5) 455 (52.5) 412 (47.5)
1968 NES 561 (40.4) 433 (31.2) 396 (28.5) 210 (15.5) 286 (21.1) 249 (18.4) 327 (24.1) 283 (20.9) 490 (51.8) 456 (48.2)
1972 CPS 32148 (36.5) 30109 (34.2) 25848 (29.3) 19957 (22.7) 12994 (14.8) 12330 (14.0) 20991 (23.8) 21832 (24.8) 27503 (50.9) 26579 (49.2)1972 NES 850 (37.3) 733 (32.2) 695 (30.5) 414 (18.7) 517 (23.4) 460 (20.8) 350 (15.8) 470 (21.3) 795 (50.2) 789 (49.8)
1976 CPS 25797 (31.6) 28342 (34.7) 27472 (33.7) 16703 (22.4) 13368 (18.0) 17797 (23.9) 11012 (14.8) 15561 (20.9) 25169 (49.1) 26147 (51.0)1976 NES 576 (30.3) 667 (35.1) 660 (34.7) 334 (18.7) 393 (22.0) 414 (23.2) 237 (13.3) 404 (22.7) 705 (49.8) 711 (50.2)1976 NES (V) 563 (29.9) 656 (34.8) 663 (35.2) 325 (18.5) 383 (21.8) 406 (23.1) 235 (13.4) 410 (23.3) 692 (49.1) 717 (50.9)
1980 CPS 31518 (27.9) 40563 (35.8) 41103 (36.3) 20851 (19.6) 16154 (15.2) 26390 (24.8) 15432 (14.5) 27565 (25.9) 34395 (46.9) 38911 (53.1)1980 NES 361 (25.7) 498 (35.5) 545 (38.8) 249 (19.8) 207 (16.4) 337 (26.8) 195 (15.5) 272 (21.6) 533 (47.5) 590 (52.5)1980 NES (V) 405 (27.2) 547 (36.8) 535 (36.0) 260 (19.7) 208 (15.8) 355 (26.9) 212 (16.1) 284 (21.5) 578 (48.6) 612 (51.4) 1984 CPS 24073 (24.2) 36531 (36.7) 39072 (39.2) 19953 (21.1) 19420 (20.5) 15648 (16.5) 23066 (24.4) 16509 (17.5) 30941 (45.4) 37143 (54.6)1984 NES 423 (24.1) 708 (35.9) 842 (42.7) 356 (20.0) 367 (20.6) 301 (16.9) 435 (24.4) 321 (18.0) 758 (45.2) 920 (54.8)1984 NES (V) 505 (23.0) 782 (35.6) 909 (41.4) 405 (20.6) 426 (21.7) 327 (16.7) 461 (23.5) 343 (17.5) 860 (46.3) 999 (53.7)
1988 CPS 19930 (21.2) 33933 (36.2) 39969 (42.6) 15769 (16.8) 23064 (24.6) 16563 (17.7) 22575 (24.1) 15861 (16.9) 27654 (42.7) 37124 (57.3)1988 NES 360 (20.8) 609 (35.1) 766 (44.2) 251 (15.4) 333 (20.4) 375 (23.0) 331 (20.3) 341 (20.9) 664 (44.0) 844 (56.0)1988 NES (V) 424 (22.0) 691 (35.8) 815 (42.2) 305 (16.9) 368 (20.4) 406 (22.5) 363 (20.2) 359 (19.9) 760 (45.4) 916 (54.7)
1992 CPS 16748 (17.8) 33622 (35.7) 43691 (46.5) 16670 (18.9) 19730 (22.4) 14183 (16.1) 22879 (26.0) 14588 (16.6) 26858 (41.2) 38328 (58.8)1992 NES 423 (19.3) 754 (34.3) 1019 (46.4) 418 (20.0) 364 (17.5) 442 (21.2) 506 (24.2) 356 (17.1) 864 (45.1) 1054 (55.0)
1996 CPS 12633 (16.1) 26738 (34.1) 38938 (49.7) 13529 (19.0) 15840 (22.2) 10230 (14.4) 14526 (20.4) 17098 (24.0) 21384 (39.6) 32580 (60.4)1996 NES 270 (17.7) 515 (33.7) 745 (48.7) 290 (20.7) 325 (23.2) 213 (15.2) 269 (19.1) 307 (21.9) 606 (44.1) 767 (55.9)
2000 CPS 10530 (14.2) 24607 (33.2) 39037 (52.6) 12487 (19.5) 13030 (20.3) 10706 (16.7) 12761 (19.9) 15198 (23.7) 19453 (38.1) 31578 (61.9)2000 NES 232 (15.0) 515 (33.2) 803 (51.8) 335 (25.5) 180 (13.7) 208 (15.8) 370 (28.2) 222 (16.9) 513 (37.2) 867 (62.8)
The first cell entry is the number of survey respondents in each SES group with valid turnout responses. The second entry (in parentheses) is the percentage of valid turnout respondents in thatSES group. CPS = Current Population Surveys, NES = National Election Studies Reported Turnout, NES (V) = National Election Studies Validated Turnout
35
Appendix 2: Variables
Variables:
Mobilization: Did anyone from one of the political parties call you up or come around and talk to
you about the campaign? 0=No, 1=Yes.
External Efficacy: Responses to the following two questions: Do you agree, disagree, neither agree
nor disagree with the following statements: “I don’t think public officials care much what people like
me think.” “People like me don’t have any say about what the government does.” Scores on each
question ranged from 1 (agree) to 3 (disagree).
Political Interest: Would you say that you have been/were very much interested, somewhat
interested, or not much interested in following the political campaigns (so far) this year? Coding: 1
=Not much interested, 2=Somewhat interested, 3=Very much interested.
Strength of Partisanship: Generally speaking, do you usually think of yourself as a Republican,
a Democrat, an Independent, or what? Would you call yourself a strong (Republican/Democrat) or
a not very strong (Republican/Democrat)? Do you think of yourself as closer to the Republican or
Democratic party? 1=Pure Independent, 2=Independent Leaner, 3=Weak Partisan, 4=Strong
Partisan.
Length of Residence: 1960-1964, 1976-2000: How long have you lived in this house
(condo/apartment)? 1=4 years or less, 2=5-9 years, 3=10-19 years, 4=20-29 years, 5=30 years or
more. 1968-1972: How long have you lived here in this city (town/township/county)? 1=4 years or
less, 2=5-9 years, 3=10-19 years, 4=20-29 years, 5=30 years or more.
Religious Attendance: 1960-68: Would you say you go to church regularly, often, seldom, or
36
never? 1=Never, 2=Seldom, 3=Often, 4=Regularly. 1972-2000: Would you say you go to church
every week, almost every week, once or twice a month, a few times a year, or never? 1=Never, 2=A
few times a year, 3=Once or twice a month, 4=Every week or almost every week.
Marital Status: Are you married now and living with your husband/wife — or are you widowed,
divorced, separated, or have you never married? 0=Not married, 1=Married.
Education: 1960-1972: How many grades of school did you finish? 1976-2000: What is the highest
grade of school or year of college you have completed? 1=Less than 12, 2=12, 3= More than 12
years.
Income: Respondent’s pre-tax family income in the y ear preceding the survey (exact question
wording varied from year to year). Ranged from 1 (lowest quintile) to 5 (highest quintile).
Occupation: What is your (main) occupation? Coding: 0 = Blue-collar, 1 = White-collar.
Age: Respondent’s age. Ranged from 21 to 99 in 1960-1968, 18 to 99 in 1972-2000.
South: Respondent’s state of residence. 0=Non-South, 1=South
Closing Date: Number of days before the election registration was closed. Ranged from 0 to 281.
Turnout: 1960-1996: In talking to people about the election, we find that a lot of people weren’t able
to vote because they weren’t registered or they were sick or they just didn’t have time. How about
you, did you vote? 2000: In talking to people about elections, we often find that a lot of people weren’t
able to vote because they weren’t registered, they were sick, or they just didn’t have time. Which of
the following statements best describes you: One, I did not vote; Two, I thought about voting this time
-- but didn’t; Three, I usually vote, but didn’t this time; or Four, I am sure I voted? Coding: 0 = Did
not vote, 1 = Voted.
37
References
Abramson, Paul R., and John H. Aldrich. 1982. “The Decline of Electoral Participation in America.”
American Political Science Review 76(3): 502-521.
Bennett, Stephen Earl, and David Resnick. 1990. “The Implications of Nonvoting for Democracy
in the United States.” American Journal of Political Science 34(3): 771-802.
Brody, Richard A. 1978. “The Puzzle of Political Participation in America.” In The New American
Political System, ed. Anthony King. Washington, D.C.: American Enterprise Institute.
Burnham, Walter Dean. 1987. “The Turnout Problem.” In Elections American Style, ed. James A.
Reichley. Washington, D.C.: Brookings Institution.
Burns, Nancy, Donald R. Kinder, Steven J. Rosenstone, Virginia Sapiro, and the National Election
Studies. NATIONAL ELECTION STUDIES, 2000: PRE-/POST-ELECTION STUDY
[dataset]. Ann Arbor, MI: University of Michigan, Center for Political Studies [producer and
distributor], 2001.
Council of State Governments. Various years. The Book of the States. Lexington, KY: Council of
State Governments.
Dahl, Robert A. 1998. On Democracy. New Haven, CT: Yale University Press
Highton, Benjamin, and Raymond E. Wolfinger. 2001. “The First Seven Years of the Political Life
Cycle.” American Journal of Political Science 45(1): 202-209.
Hill, Kim Quaile, and Jan E. Leighley. 1992. “The Policy Consequences of Class Bias in Stat e
Electorates.” American Journal of Political Science 36(2): 351-366.
Hill, Kim Quaile, Jan E. Leighley, and Angela Hinton-Andersson. 1995. “Lower-Class Mobilization
38
and Policy Linkage in the United States.” American Journal of Political Science 39(1): 75-86.
Himmelstein, Jerome L., and James A. McRae, Jr.. 1988. “Social Issues and Socioeconomic Status.”
Public Opinion Quarterly 52(4): 492-512.
Knoke, David. 1979. “Stratification and the Dimensions of American Polit ical Orientations.”
American Journal of Political Science 23: 772-791.
Leighley, Jan E., and Jonathan Nagler. 1992. “Socioeconomic Class Bias in Turnout, 1964-1988: The
Voters Remain the Same.” American Political Science Review 86(3): 725-736.
Levy, Frank, and Richard J. Murnane. 1992. “U.S. Earnings Levels and Earnings Inequality: A
Review of Recent Trends and Proposed Explanations.” Journal of Economic Literature 30(3):
1333-1381.
McDonald, Michael P., and Samuel L. Popkin. 2001. “The Myth of the Vanishing Voter.” American
Political Science Review 95(4): 963-974.
Mill, John Stuart. [1860] 1958. Considerations on Representative Government. New York, NY:
Liberal Arts Press.
Nagler, Jonathan. 1991. “The Effect of Registration Laws and Education on U.S. Voter Turnout.”
American Political Science Review 85(4): 1393-1405.
Pateman, Carole. 1970. Participation and Democratic Theory. Cambridge: Cambridge University
Press.
Putnam, Robert D. 2000. Bowling Alone: The Collapse and Revival of American Community. New
York, NY: Simon & Schuster.
Putnam, Robert D. 2002. “Bowling Together.” The American Prospect February 11: 20-22.
39
Reiter, Howard L. 1979. “Why is Turnout Down?” Public Opinion Quarterly 43: 297-311.
Rosenstone, Steven J., and John Mark Hansen. 1993. Mobilization, Participation, and Democracy
in America. New York, NY: Macmillan Publishing Company.
Sapiro, Virginia, Steven J. Rosenstone, and the National Election Studies. 1948-2000 Cumulative
Data File [dataset]. Ann Arbor, MI: University of Michigan, Center for Political Studies
[producer and distributor], 2001.
Sapiro, Virginia, Steven J. Rosenstone, Warren E. Miller, and the National Elect ion Studies.
AMERICAN NATIONAL ELECTION STUDIES, 1948-1997 [CD-ROM]. ICPSR ed. Ann
Arbor, MI: Inter-university Consortium for Political and Social Research [producer and
distributor], 1998.
Schattschneider, E.E. 1960. The Semi-Sovereign People: A Realist’s View of Democracy in America.
New York, NY: Holt, Rinehart, and Winston.
Shaffer, Stephen D. 1981. “A Multivariate Explanation of Decreasing Turnout in President ial
Elections, 1960-1976. American Journal of Political Science 25(1): 68-95.
Silver, Brian D., Barbara Anderson, and Paul R. Abramson. 1986. “Who Overreports Voting?”
American Political Science Review 80(2): 613-624.
Simpson, E.H. 1951. “The Interpretation of Interaction in Contingency Tables.” Journal of the Royal
Statistical Society, Series B 13: 238-41.
Smith, Constance E. 1960. Voting and Election Laws: Laws for Voters. New York, NY: Oceana.
Teixeira, Ruy A. 1992. The Disappearing American Voter. Washington, D.C.: Brookings Institution.
Traugott, Santa. 1989. “Validating Self-reported Vote: 1964-88.” Paper presented at the annual
40
meeting of the American Statistical Association, Washington, D.C.
U.S. Department of Commerce, Bureau of the Census. Current Population Survey: Voter Supplement
File, various years [computer files]. ICPSR version. Washington, D.C.: U.S. Department of
Commerce, Bureau of the Census [producer], various years. Ann Arbor, MI: Inter-university
Consortium for Political and Social Research [distributor], various years.
Verba, Sidney, and Norman H. Nie. 1972. Participation in America: Political Democracy and Social
Equality. Chicago, IL: University of Chicago Press.
Verba, Sidney, Kay Lehman Schloz man, and Henry E. Brady. 1995. Voice and Equality: Civic
Voluntarism in American Politics. Cambridge: Harvard University Press.
Verba, Sidney, Kay Lehman Schlozman, Henry E. Brady, and Norman H. Nie. 1993. “Citizen
Activity: Who Participates? What Do They Say?” American Political Science Review 87(2):
303-318.
Wolfinger, Raymond E., and Steven J . Rosens tone. 1980. Who Votes? New Haven, CT: Yale
University Press.
Yadlosky, Elizabeth. 1964. “Voting Laws of the 50 States and the District of Columbia.”
Washington, D.C.: U.S. Library of Congress, Legislative Reference Service.
41