social indicators predicting postsecondary success indicators predicting postsecondary success ......
TRANSCRIPT

SocialIndicatorsPredictingPostsecondary
Success
Daniel Princiotta Laura Lippman Renee Ryberg Hannah Schmitz David Murphey Mae Cooper
4/1/2014
Thisreportwaspreparedundergrant#8332fromtheLuminaFoundation.ChildTrendsisgratefultotheLuminaFoundationforitssupportbutthefindingsaretheauthorsaloneanddonotnecessarily
reflectthoseofthefoundation.

i
Contents Introduction .................................................................................................................................................. 1
Review of Literature ...................................................................................................................................... 2
Demographic Predictors ........................................................................................................................... 2
Gender. ................................................................................................................................................. 2
Race/ethnicity. ...................................................................................................................................... 3
Nativity. ................................................................................................................................................. 4
Family-Level Predictors ............................................................................................................................. 4
First-generation college-goers. ............................................................................................................. 4
Social support. ...................................................................................................................................... 5
Health. ................................................................................................................................................... 5
Individual Behavior/Characteristics .......................................................................................................... 5
Non-traditional students. ..................................................................................................................... 5
Individual characteristics measured at secondary or primary education levels. ................................. 6
Individual characteristics measured at the postsecondary level. ......................................................... 6
Academic Behavior/Performance Predictors ........................................................................................... 8
Primary/secondary school. ................................................................................................................... 8
Postsecondary level. ............................................................................................................................. 9
Institutional Predictors: Secondary ........................................................................................................... 9
Institutional Predictors: Postsecondary .................................................................................................. 10
Structural predictors. .......................................................................................................................... 10
Selectivity. ........................................................................................................................................... 10
Institution type. .................................................................................................................................. 10
Student-body composition. ................................................................................................................ 10
Postsecondary institution climate. ..................................................................................................... 11
Analysis Plan ............................................................................................................................................... 12
Methods ...................................................................................................................................................... 12
Data sources ............................................................................................................................................ 12
Analysis ................................................................................................................................................... 16
Interpreting odds ratios ...................................................................................................................... 17
Interpreting statistical significance ..................................................................................................... 19
Results ......................................................................................................................................................... 19
NELS ........................................................................................................................................................ 19
BPS .......................................................................................................................................................... 23
Predicting any postsecondary completion ......................................................................................... 23

ii
Predicting completion at four-year institutions ................................................................................. 26
Predicting completion at two-year institutions .................................................................................. 28
Predicting completion at less-than-two-year institutions .................................................................. 31
Predicting non-completion at four-year institutions simply .............................................................. 32
Discussion .................................................................................................................................................... 33
The predictive power of social indicators ............................................................................................... 33
Predicting postsecondary completion among high school completers .................................................. 34
Predicting postsecondary completion among postsecondary education attendees ............................. 35
Translating findings into actions ............................................................................................................. 37
Suggested indicators and data sources to monitor postsecondary completion .................................... 37
Limitations of the study .......................................................................................................................... 40
Future directions for research ................................................................................................................ 41
References .................................................................................................................................................. 42
Appendix A. Tables ...................................................................................................................................... 47
Appendix B. Technical Appendix ................................................................................................................. 80
Sampling error ........................................................................................................................................ 80
NELS Variable Descriptions ..................................................................................................................... 80
Demographics ................................................................................................................................ 80
Psychosocial ................................................................................................................................... 81
Family Relationships ...................................................................................................................... 84
High School Academics .................................................................................................................. 85
High School Experience .................................................................................................................. 86
Student Perception of High School Climate ................................................................................... 88
High School Characteristics ............................................................................................................ 89
Transition ....................................................................................................................................... 90
Postsecondary Characteristics ....................................................................................................... 92
Outcome variables ......................................................................................................................... 95
BPS Variable Descriptions ....................................................................................................................... 95
Demographics ................................................................................................................................ 95
High School .................................................................................................................................... 96
Postsecondary Pre-enrollment ...................................................................................................... 96
Postsecondary Post-enrollment ..................................................................................................... 97
Outcome Variables ....................................................................................................................... 100

1
Introduction In the 2009-10 school year, the U.S. produced 1.6 million bachelor’s degrees and 850,000 associate’s degrees (Snyder & Dillow, 2012). However, in order to reach the Obama administration’s goal of becoming the world leader in college degree attainment by 2020, an estimated additional 13.3 million degrees will be required (Santiago & Callan, 2010). More broadly, in terms of all postsecondary credentials, the United States must produce about 24 million additional credentials by 2025, if it is to attain a 60 percent rate of degree attainment among adults 25-64 and keep pace with leading OECD countries. By contrast, with current attainment rates, the United States is on track to produce only slightly more than one-tenth that figure: 278,500 additional credentials by 2025 (Prince & Choitz, 2012).
The United States is competitive with other countries in terms of the number of bachelor’s degrees it awards, but it lags behind other OECD countries in award of other postsecondary credentials, such as professional certificates and associate’s degrees. Among OECD nations, the U.S. ranks second in percentage of workers with a bachelor’s degree; however, the U.S. is ranked sixteenth in the world on sub-baccalaureate education. The sub-baccalaureate category includes associate’s degrees, postsecondary certificates, employer-based training, industry-based certifications, and apprenticeships that prepare individuals for middle-class occupations and salaries (Carnevale, Jayasundera, & Hanson, 2012).
Most middle- and high-school students aspire (and expect) to gain some form of postsecondary education, and about 70 percent of high school graduates start college within two years of graduation (Venezia, Kirst, & Antonio, 2003). However, when it comes to college completion, a number of statistics paint a discouraging picture. Only about 59 percent of full-time, first-time students at four-year institutions in 2005 who were seeking a bachelor’s or equivalent degree completed such a degree within six years of their tenure at the institution where they started (Knapp, Kelly-Reid, & Ginder, 2012). Completion rates for those starting part-time, or at less than four year institutions (and planning to transfer) are even lower; only about 33 percent of full-time, first-time students at two-year institutions in 2007 completed a degree or certification (Knapp et al., 2012).
Despite this, there have been some gains in postsecondary completion (hereafter, PSC1
Some of the barriers to PSC appear to be structural. Often there is poor alignment between the knowledge and skills emphasized by high school assessments, and those reflected in college entrance and placement requirements. Coursework between the two levels is also not well articulated. Current data systems are inadequate for addressing students’ needs and progress from one level to another (Venezia et al., 2003). College counseling, and college-preparatory course-offerings, vary widely in quantity and quality across high schools (Bradley & Blanco, 2010). Dropout rates are especially high in
) rates. Between the 1996 and 2003 starting cohorts, the six-year graduation rate for bachelor’s degree students at four-year institutions went from 55 to 57 percent (Snyder & Dillow, 2012). Associate’s degrees and professional certificates, typically awarded by community colleges or private for-profit institutions, make up a large and growing proportion of postsecondary awards (Horn, Xiaojie, & Weko, 2009). The total number of sub-baccalaureate degrees earned increased by 28 percent between 1997 and 2007, to 1.5 million (Horn et al., 2009). Combining degree types, the percentage of Americans between 25 and 64 with a two or four-year college degree has increased by 0.8 percent from 2008 to 2011 (Lumina Foundation, 2013).
1 For the purpose of this report, postsecondary completion is defined as completion of any of the following qualifications after secondary school: professional certificate, associate’s degree, bachelor’s degree.

2
the freshman year, due to both inadequate academic preparation and personal challenges associated with students’ newly independent status, including anxiety, depression, and substance use (Carter, 2007; Hu & St. John, 2001).
One consequence of poor academic preparation at the secondary level is high levels of remedial course-taking in college. At four-year institutions, 40 percent of students take one or more remedial courses; at two-year institutions, it is 63 percent (National Center for Education Statistics, 2012). According to analysis by Complete College America (2011), half (50 percent) of associate degree-seekers, and more than one in five (21 percent) bachelor’s degree-seekers, require remediation. Even with the assistance of remedial courses, remedial students (at certificate, associate’s, and bachelor’s levels) are significantly less likely to graduate, though this is likely due to the underlying characteristics of remedial students, rather than a failure of remediation (Attewell, Lavin, Domina, & Levey, 2006).
Many students, whether they are candidates for a certificate, an associate’s degree, or a bachelor’s degree, do not spend their college time efficiently. Students spend too much time earning their certificate or degree, and the additional time taken to finish does not translate into a significantly increased likelihood of graduation. Part-time students, naturally, take longer to complete their programs, but even full-time students take excessive time to complete; students take more credits than necessary, spend time in non-credit remediation courses, and take semester or year-long breaks (Complete College America, 2011).
As noted in the following review, full-time enrollment status is associated with degree completion; 33 percent of entering students in 2004 who spent at least one semester part-time, and 71 percent of part-time-only students, dropped out within six years (U.S. Department of Education, 2011). Yet, 44 percent of U.S. public college students attended part-time in fall of 2010 (Aud et al., 2012).
Family and work commitments can reduce the likelihood of PSC. Among current undergraduates, fully three-quarters are managing some combination of family responsibilities, jobs, and commuting to class, whereas just one-quarter follow a model that includes full-time attendance, on-campus residence, and having parents who are primarily responsible for college bills (Complete College America, 2011).
Review of Literature Note: We exclude from this review studies which did not specifically use PSC or persistence beyond the freshman year as an outcome measure. Thus, we do not include studies where the independent variable was educational attainment but the analyses reported did not separately examine PSC. We also include only studies that used some kind of multivariate analysis, in order to identify the predictive value of a given variable, independent of possible confounds with other variables. Where possible, we have specified the population denominator on which the dependent measures were based: for example, high school graduates, or students who enrolled for their first year of postsecondary education.
Demographic Predictors Gender. According to descriptive data, females, on average, are more likely than males to complete a bachelor’s degree within six years (150 percent of the normal time to degree completion). However, gender may be confounded with pre-college academic preparation or undergraduate major, among other variables. Multivariate studies that show females with a (growing) advantage in PSC include Ross and colleagues (2012), Harper and Harris (2012), Alon and Gelbgiser (2011), Jepson (2008), Lee and colleagues (2008), Reisel (2011), Goldin, Katz, and Kuziemko (2006), Lohfink and Paulsen (2005) (among first-generation students only), Conger and Long (2010), and DeAngelo and colleagues (2011). In contrast, Buchmann and DiPrete (2006) do not find such an effect after controlling for academic

3
performance, though they do find interaction effects between gender and family structure. Many more studies use this variable as a general control, and it may or may not be significant, given the other variables studied.
Black females have higher rates of PSC than black males (Brunn & Kao, 2008; Harper & Harris, 2012; Ross et al., 2012). Though the effect is not as strong, white females are also more likely than white males to complete PSE among beginning PS students (Ross et al., 2012). In one model, black females had greater odds of obtaining a postsecondary degree than white females, after controlling for other factors such as socioeconomic status (Brunn & Kao, 2008).
Race/ethnicity. Hispanics/Latinos2
Hispanic ethnicity in some studies is negatively associated with PSC, though it may be important to distinguish between foreign-born Hispanics, or those who have foreign-born parents, versus those who represent one or more native-born generations (see Nativity section, below). Among college undergraduates, Latino first- and second-generation immigrants are less likely than their Asian immigrant counterparts, and all undergraduates, to have taken pre-calculus or calculus courses in high school (Staklis & Horn, 2012).
will be nearly one in four of the U.S. population of 18- to 29-year-olds by 2020 (Santiago & Callan, 2010), and are already the largest minority group on college campuses. Their enrollment in PSE in 2011 reached a record 12.6 million students—46 percent of Latino high school completers (Fry & Lopez, 2012). Despite these enrollment rates, the proportion of Latinos who have attained a postsecondary degree is the lowest of any major racial/ethnic group (United States Census Bureau, 2012). Although they represent 16.5 percent of all college enrollments in 2011, Latinos in 2010 accounted for 8.5 percent of all bachelor’s degree recipients, and 13.2 percent of those receiving associate’s degrees (Fry & Lopez, 2012). A smaller proportion of Latino students than whites immediately enroll in college after high school, and just 36 percent of first-time, full-time Latino students finish a degree within six years, compared with 71 percent of white students (Liu, 2012).
According to one study, the gap between whites and Hispanics in PSC cannot be attributed to differences in parental educational attainment. Using five different data sets, the authors conclude that, in the most selective postsecondary institutions, Hispanic students, in spite of rising rates of high school completion and college enrollment, are less likely than their white counterparts to complete a bachelor’s degree (Alon, Domina, & Tienda, 2010; Ross et al., 2012).
Black students—and particularly black males—are another group that has historically had poor postsecondary outcomes, including low rates of both enrollment and completion at postsecondary institutions. Many studies show being black is associated with lower PSC rates (Jepsen, 2008; United States General Accounting Office, 2003). With black male student athletes having especially low rates of college graduation compared to their peers (Harper & Harris, 2012).
But there are exceptions. Among high school graduates, Jepson finds no relationship when looking at associate’s degree attainment alone. In another study of those who attended college, being black or Hispanic was a positive predictor of completion after controlling for academic preparation and socio-economic status (Boardman, Alexander, Miech, MacMillan, & Shanahan, 2012). Asian and white students generally have been shown to have an advantage in PSC rates over students in other race/ethnicity categories (Aud et al., 2012; DeAngelo et al., 2011; Lee et al., 2008). However, findings from one older study showed no independent effect associated with race (Adelman, 1999).
2 In this document, we use Hispanic/Latino interchangeably, because general usage varies, and documents we reviewed do not always specify how they are defining these terms.

4
Nativity. First- or second-generation immigrants often face challenges with respect to PSC. Analysis of data from the National Postsecondary Student Aid Study shows that the largest proportion (30 percent) of first-generation immigrant undergraduates are Asians, while Hispanics are the largest proportion (41 percent) among second-generation Americans. Both groups enroll in community colleges at higher rates than do all undergraduates. In 2007-08, immigrants and second-generation Americans comprised 23 percent of U.S. undergraduates (Staklis & Horn, 2012).
As a group, immigrant undergraduates are older than all undergraduates; however, second-generation Americans are younger. Both immigrant and second-generation American college students are more likely than all undergraduates to be in the lowest income group. Latinos, whether immigrants or second-generation American, are more likely (55 and 54 percent, respectively) than all undergraduates (33 percent) to have parents who did not participate in postsecondary education. Asian undergraduates who are immigrants are more likely (38 percent) than those who are second-generation Americans (28 percent) to have parents without any PSC (Staklis & Horn, 2012).
Among first-generation immigrants (but not second-generation) Hispanic ethnicity was negatively associated with persistence into a second year at four-year institutions (Lohfink & Paulsen, 2005). On the other hand, some studies show no significant effect of Hispanic ethnicity (second- and higher generations) on associate’s degree attainment (Jepsen, 2008). Jepson (2008) finds that children of Hispanic immigrants are more likely than whites to complete a bachelor’s degree, after controlling for family background; however, children of native-born Hispanics were neither more nor less likely to complete.
Among both Latino and Asian students, second-generation Americans are more likely to be enrolled full-time than are immigrants. Second-generation Asian Americans are more likely than all undergraduates to be enrolled full-time, but Latino second-generation Americans are less likely than either their Asian counterparts, or all undergraduates, to be enrolled full-time (Staklis & Horn, 2012)
Family-Level Predictors Among the most important family-level predictors of PSC are measures of socio-economic status (SES). Studies showing a positive link between family socio-economic status and PSC include: Adelman (1999); Byun, Meece, and Irvin (2012); Ganderton and Santos(1995); and Rumberger (2010). However, the United States General Accounting Office (2003) found no effect after controlling for postsecondary behaviors such as attending part-time. Some studies identify parental education alone as a positive predictor of PSC (Boardman et al., 2012; Buchmann & DiPrete, 2006; Ganzach, 2000; Ross et al., 2012; United States General Accounting Office, 2003); but two studies (Kalogrides & Grodsky, 2011; Reisel, 2011) find this effect only if parents have less than a high school education, or a post-bachelor’s degree. Family income alone is a significant positive predictor of PSC in three studies using major national data sets (AFT Higher Education, 2003; Reisel, 2011; Ross et al., 2012).
First-generation college-goers. A distinct, though diverse group is students whose parents have a high school education or less. In the U.S., the highest level of first-generation college-students—nearly 50 percent—is found among Latinos (Bell & Bautsch, 2011). Among full-time students at four-year, non-profit institutions, DeAngelo and colleagues (2011) find that students who are first-generation college-goers are less likely to graduate from postsecondary institutions. As noted above, one study (Lohfink & Paulsen, 2005) finds female first-generation students more likely to complete college than their male counterparts. As noted below in the section on non-traditional students, the same study found that first-generation students who were married were less likely to complete a bachelor’s degree than were their non-married counterparts.

5
Social support. A family’s “social resources” (as reported by high-school students parents), which includes frequent church attendance and frequently discussing academics with parents, were found to be associated with increased likelihood of PSC; families of students from rural areas had, on average, greater social resources than those in urban or suburban areas (Byun et al., 2012).
Time spent with parents (student-reported) was a positive predictor of PSC among those students who attended college (Boardman et al., 2012). In other research, student-reported parental support was positively related to second-year persistence at four-year institutions, but the study had weak controls (Cabrera, Nora, Terenzini, Pascarella, & Hagedorn, 1999).
High levels of social support from friends and families (as reported by students) predicted less postsecondary dropout, but this study also had weak methodology (Gloria, Castellanos, Lopez, & Rosales, 2005). Mothers’ expectation that their child would finish college was positively associated with PSC (Ingels, Curtin, Kaufman, Alt, & Chen, 2002), as was the frequency of parents’ discussions about school with their eighth-graders (Kulkarni, 2010).
Studies have found that students from step- or single-parent families are less likely to complete a bachelor’s degree; however, some of these used inadequate controls for confounding variables (Sandefur & Wells, 1999; Ver Ploeg, 2002).
Health. Poor parental health during a student’s adolescence was negatively associated, and having parents who were older was positively associated with PSC, among those attending college. Additionally, having a parent smoker or obese parent in the household (both parent-reported) were negative predictors (Boardman et al., 2012).
Individual Behavior/Characteristics Non-traditional students. Non-traditional students are a heterogeneous group, though generally understood to be adults (often with spouses and/or families) with at least some postsecondary-school employment experience, who are either entering postsecondary education for the first time, or returning to it after an extended interruption. Some studies also include part-time or commuter students in the non-traditional category. Non-traditional students have lower persistence rates, and lower five-year graduation rates among those seeking associate’s or bachelor’s degrees (Choy, 2002).
Among non-traditional students, younger age and having a high-status occupation were both positively associated with bachelor’s degree completion (Taniguchi & Kaufman, 2005). Delayed entry into postsecondary education is identified as a negative predictor of PSC, though most of this effect can be accounted for by intervening factors such as marriage, childbearing, and employment (Roksa & Velez, 2012).
Students’ own marital status was examined in a few studies. Married or divorced students are often those who are “non-traditional” in other ways besides their marital status. Among a non-traditional sample, divorced students (especially men) were less likely to complete a bachelor’s degree, as were those (especially women) with young children (Taniguchi & Kaufman, 2005); among first-generation students, married students were less likely to persist into a second year at four-year institutions (Lohfink & Paulsen, 2005). Students who had a child before age 22 were less likely to graduate from four-year institutions (Adelman, 1999), as were those who were pregnant before age 20 (Hofferth, Reid, & Mott, 2001).
Among non-traditional students, part-time enrollment has been found to be a negative predictor (Taniguchi & Kaufman, 2005). Among this group, having enrolled in postsecondary education at some point in the past was a positive predictor (Taniguchi & Kaufman, 2005).
6
Individual characteristics measured at secondary or primary education levels. Other individual characteristics include intentions, commitment, and perceptions or beliefs. Among individual characteristics positively associated with PSC or persistence that were measured prior to postsecondary education, are internal locus of control at eighth grade (in a low-income sample)(Brown, Morning, & Watkins, 2005; Lee et al., 2008); middle-school aspirations to obtain a college degree (Kulkarni, 2010); anticipation of college completion (as measured at tenth and twelfth grades) (Adelman, 1999); high school experience using the Internet for research (DeAngelo et al., 2011); citing a campus visit as a reason for choosing a college (DeAngelo et al., 2011); and having academic goals, academic self-efficacy, or academic skills (Robbins et al., 2004). Additionally, studies found that various types of non-curricular activities increased likelihood of graduation, including participation in team sports at tenth grade (Eccles, Barber, Stone, & Hunt, 2003); twelfth-grade participation in school sports (Ross et al., 2012); participation in one or more clubs (Lozano, 2008) (non-Hispanics only ); twelfth-grade participation in clubs (Ross et al., 2012); participation in extracurricular activities; (Ingels et al., 2002)); and volunteering during high school (DeAngelo et al., 2011).
Some individual characteristics that were negatively associated with PSC or persistence include problem behavior in high school (among low SES students) (Lee et al., 2008); pregnancy before age 20 (Hofferth et al., 2001); poor health (Boardman et al., 2012); and more time after school spent alone (measured at eighth grade) (Kulkarni, 2010).
Individual characteristics measured at the postsecondary level. Several individual-level variables that are measured while students are enrolled in postsecondary education have been linked to PSC or persistence. Effects of participation in varsity sports interacted with race and gender in a study by Eide and Ronan (2001); such participation had mixed effects on PSC—positive for white females and black males, a negative effect for white males, and no effect for Hispanics or black females. Working greater hours while in college had negative effects on PSC (Bound & Turner, 2007; Ross et al., 2012). The United States General Accounting Office study (2003) also identified working more than 20 hours per week as a negative predictor of PSC. On the other hand, satisfaction with social life was found to be a positive predictor of second-year persistence among first-generation students (Lohfink & Paulsen, 2005).
In a comprehensive analysis by DeAngelo and colleagues (2011), positive predictors include the student’s openness to changing their choice of career, their drive to achieve, their emotional health, and their expectation to participate in student clubs or groups.
Their reasons for choosing the college they attended were also highly significant; relatives’ preferences, cost, wanting to live near home, a belief that graduates of the college get good jobs, size of the school, a pre-decision visit to campus, or being admitted through early action or early decision all increased the likelihood that they would graduate within six years. Likewise, selection of a school such that a student is able to live at home was found to be a significant positive predictor of second-year persistence among first-generation immigrants (Lohfink & Paulsen, 2005).
In contrast, basing school choice on having obtained information from a website, on the religious affiliation of the school, or on the college’s reputation for social activities had a negative effect on PSC. Other negative predictors were a student’s expectation for working full-time while enrolled, and living off-campus. Cabrera and colleagues (1999) studied students’ commitment to PSC, and their commitment to their own postsecondary institution; only the latter was a significantly positive predictor of persistence into the second year; however, this study did not use controls for SES. Institutional commitment was also identified as a positive predictor in a meta-analysis by Robbins et al. (2004). For minority students, but not for non-minorities, desire to finish college was a positive predictor of continuation into the second year (Allen, 1999).

7
Higher levels of “directedness” (defined by enrollment in a formal degree program, declared intention to complete a degree, and full-time attendance) were associated with attainment of an associate’s degree or transfer to a four-year institution (Horn & Weko, 2009). Students who had not earned sufficient credits to graduate at four years were more likely to drop out of four-year institutions (Pfeffer & Goldrick-Rab, 2011). Among community college students seeking an associate’s degree or higher, selection of an “occupational” (i.e., vocational) major was negatively associated with attaining the degree or transferring to a four-year program within five years (Alfonso, Bailey, & Scott, 2005).
Full-time enrollment at the postsecondary level is associated with higher rates of completion (Ross et al., 2012; United States General Accounting Office, 2003). Full-time enrollment, by age 26, in a two-year college, or full- or part-time enrollment in a four-year college, were, in contrast to “not enrolled” by age 26, positively related to bachelor’s degree attainment by age 32 (Feliciano & Ashtiani, 2012).
Students who had fewer than two “stop-out” periods within five years of postsecondary education had higher rates of PSC than their counterparts with two or more “stop-outs” (Ross et al., 2012). Continuous enrollment among students attending four-year institutions was a significant predictor of six-year graduation rates (United States General Accounting Office, 2003), and discontinuous attendance was negatively associated with completion of a bachelor’s degree (Ganderton & Santos, 1995).
Starting college at full-time status, and planning on receiving a bachelor’s degree were both positive predictors of PSC (AFT Higher Education, 2003). Among Latinos attending urban commuter colleges, their intention to persist was significantly predicted by their institutional commitment. The effect was mediated by academic integration and by the level of encouragement students experienced; in turn, positively associated with these were satisfaction with faculty, cultural affinity, and (for encouragement) academic difficulty (Torres, 2006).
Lohfink and colleagues (2005) examined an “academic integration index,” composed of frequency of freshmen’s self-reported interactions with faculty, academic advisors, and study groups. Scores on this index, as well as first-year GPA, were positively related to second-year persistence among first-generation immigrant students at four-year institutions. Similarly, “comfort” (student-reported) with the university environment was associated with completion among Latino students, though this was a study at a single institution only, and lacked some important controls, such as year of schooling (Gloria et al., 2005). Meeting with a college advisor at least “sometimes” was associated positively with PSC (Ross et al., 2012).
Transferring to another school was negatively associated with six-year graduation rates from four-year institutions (United States General Accounting Office, 2003). Two or more transfers during one’s postsecondary education was negatively associated with PSC in the study by Ross and colleagues (2012). Even the expectation of transfer to another school was found to negatively predict PSC (DeAngelo et al., 2011). However, it should be noted that it may be that many credits fail to transfer with the student, so it is takes students longer than six years to graduate, rather than transfers preventing graduation entirely.
Receipt of financial aid for postsecondary education appears to bear a complicated relationship to PSC, because, on the one hand, it generally marks a lower level of economic resources; on the other hand, it may also mark positive personal characteristics that entered into the award decision, and/or it may provide additional incentives (both financial and otherwise) for a student to successfully complete his or her education. In one study, a student’s receipt of financial aid for college (loan or grant) was shown to be a positive predictor of PSC (Hu & St. John, 2001). In another study, need-based eligibility for financial aid was a negative predictor; however, the amount of financial aid (where need-based) positively predicted PSC (Alon, 2007). In yet another study, having debt up to $12,000 was a positive predictor of

8
PSC at all universities, while any level of debt predicted PSC at private universities. Greater amount of debt at public universities was a negative predictor of PSC, possibly because high debt burdens encourage students to work full time while they are students (Dwyer, McCloud, & Hodson, 2012).
Academic Behavior/Performance Predictors Primary/secondary school. An area of some of the strongest predictors of PSC is students’ academic performance in high school or earlier. One study identifies math test scores in the primary grades (and even pre-kindergarten) as significantly modeling PSC (J. Lee, 2012).
Several studies, using either school administrative data (Lichtenberger & Dietrich, 2012; Nagaoka, Roderick, & Coca, 2009), or large national surveys (Boardman et al., 2012; Cabrera et al., 1999; DeAngelo et al., 2011; Feliciano & Ashtiani, 2012; Ganderton & Santos, 1995; United States General Accounting Office, 2003), have identified grade-point average (GPA) as significantly associated with successful completion of postsecondary education. However, the conclusions of some of these studies are weakened by a reliance on students’ self-report of grades (Cabrera et al., 1999; DeAngelo et al., 2011), and/or lack of adequate controls (Cabrera et al., 1999; Nagaoka et al., 2009).
GPA or class rank, while highly confounded with cognitive testing scores, may be better predictors than those test scores, as they encompass -academic behaviors, such as study and organization skills (Nagaoka et al., 2009). High school test scores were a positive predictor of four-year PSC (among those attending) (Albrecht & Albrecht, 2010; Bound & Turner, 2007; Ganderton & Santos, 1995; Hauser, 1972; Lee et al., 2008; Taniguchi & Kaufman, 2005). Ross and colleagues (2012) found that simply taking either the SAT or the ACT was positively associated with PSC, as was earning college-level credits while in high school.
Other studies examine high school academic performance in terms of specific subject content. With a sample of low-income students, Lee and colleagues (2008), using categorical regression, identified tenth-grade performance in both math and reading as positively associated with PSC. High achievement in high school math, as well as having completed an advanced math course, was also identified by Ingels and colleagues (2002) as a significant predictor of educational attainment by age 26. Bound and colleagues (2007), examining historical changes in time-to-PSC, found that students’ scores on math and reading tests were significantly related to graduating from college within eight years. Being “on track” for college (based on completion of high school math courses) also was positively associated with PSC (Feliciano & Ashtiani, 2012). Lichtenberger and colleagues (2012) used ACT scores as measure of college readiness among African American and Hispanic Illinois public high school students. English and math ACT sores had a significant relationship with bachelor’s degree completion within six years; the contribution of science and social studies scores was minimal after controlling for math and English performance.
Completing advanced courses in high school, especially mathematics beyond Algebra II, is associated with higher rates of bachelor’s degree completion. Ross and colleagues (2012) found that taking pre-calculus or calculus was associated positively with PSC. A United States General Accounting Office study (2003) positively linked having taken a rigorous curriculum with graduation from a four-year institution within six years. Rigor was based on the number and level of courses completed. A Florida study also linked the taking of rigorous courses (i.e., honors, Advanced Placement [AP], and other upper-level courses) with earning a bachelor’s degree within six years (Long, Conger, & Latarola, 2012). Another study found that participation in AP courses (specifically, taking and passing an AP exam) was a significant predictor of five-year graduation rates from Texas postsecondary institutions (Dougherty, Mellor, & Jian, 2006). The “intensity” and “quality” of a student’s high school curriculum was found to
9
be a significant predictor of graduation from a four-year postsecondary institution by age 30 (Adelman, 1999).
Still other studies identified less concrete aspects of students’ high school academic experience. In a multivariate analysis, “hours per week on homework” was positively related, and a pattern of coming late to class was negatively related, to PSC (DeAngelo et al., 2011). However, time spent on homework was not a significant predictor in a study of low-income students’ PSC (Lee et al., 2008). How well students were prepared for class (self-reported) was a significant predictor of PSC in a study using a low-income sample (Lee et al., 2008), while students whose teachers said they were “hardworking” or “often finish their homework” obtained more years of education than their peers (Lleras, 2008).
Postsecondary level. As one would expect, academic performance at the postsecondary level is generally related to PSC. Freshman GPA was positively associated with second-year persistence among full-time students younger than 20 at a mid-size public university (Allen, 1999), among students in four-year institutions (Cabrera et al., 1999), and at a single large public university (though not for minority students) (Eimers & Pike, 1997). College career GPA was a significant predictor differentiating male and female rates of PSC (Buchmann & DiPrete, 2006). Among non-traditional students, high scores (age-adjusted) on a test of cognitive ability administered in high school (the Armed Forces Qualification Test, AFQT) were positively related to PSC (Taniguchi & Kaufman, 2005).
The degree of congruence between a student’s cognitive ability (as measured by the AFQT) and college selectivity (in terms of SAT scores of admitted students) was found to be a positive predictor of PSC at four-year colleges (Light & Strayer, 2000), meaning that strong students did better in more selective schools, while weak students did better in less selective schools.
Students who declared a major during their freshman year were more likely to obtain bachelor’s or associate’s degrees (Ross et al., 2012).
In general, students who take remedial courses in college are less likely to attain degrees than students not taking such courses (Ross et al., 2012). Among first-time postsecondary students in 2003-04, Latinos had the highest percentage—62 percent—taking remedial courses (National Center for Education Statistics, 2012). A greater proportion of immigrant Latino students report taking remedial courses at the postsecondary level than do Asian immigrants, and all undergraduates (Staklis & Horn, 2012). In a study by Attewell and colleagues (2006), remedial course-taking (one or more, in reading or writing) was positively associated with PSC at two-year, but negatively associated (reading) or non-significant (writing) at four-year institutions. Taking two or more remedial math courses was negatively related to PSC at two-year colleges only. A record of three or more remedial courses (any subject) was associated negatively with PSC at four-year colleges, but unrelated to PSC at two-year colleges. However, passing all remedial courses in reading, and passing all in writing, were each positively associated with graduating within eight years from a two-year institution.
Institutional Predictors: Secondary Multiple characteristics of a student’s secondary school have been associated with PSC. Reisel (2011) finds attending a school with a “college preparatory” program, as opposed to a “general” high school, is associated with bachelor’s degree attainment within 11 years of 10th grade. In a Texas study, students attending schools with high rates of participation in AP courses were more likely to graduate in five years from public Texas postsecondary institutions (Dougherty et al., 2006). Other school features positively associated with PSC or higher postsecondary educational attainment are higher average ACT scores (Asmussen, 2011); private status (Ingels et al., 2002); and (among black students from urban public schools) schools’ “value-added” scores, a measure of teaching quality based on their students’ improvement on test scores (Rivkin, 2000). Enrollment in a vocational high school was a negative

10
predictor of college graduation in one study (Reisel, 2011). In another study, a higher proportion of students (at the middle school level) receiving free school lunches was negatively associated with PSC (Kulkarni, 2010).
A high proportion of African American or Latino students in the school was associated with lower rates of PSC (Goldsmith, 2009), though a study of just Asian Americans found the opposite to be true (Lai & Orsuwan, 2008).
Institutional Predictors: Postsecondary In general, research finds that institutional variables have weaker associations with PSC than do individual-level predictors, especially for students in the later years of their postsecondary education (Schreiner, 2009). However, they may be more amenable to change.
Structural predictors. High proportions of part-time faculty and a large student population were negative predictors of PSC in community colleges (Calcago, Bailey, Jenkins, Kienzl, & Leinbach, 2008; Jacoby, 2006). Low availability of student housing was also found to negatively predict PSC of full-time students at all institution types, after adjustment for individual characteristics (Asmussen, 2011).
While higher tuition (which is partially confounded with school selectivity) is associated with postsecondary persistence (Schreiner, 2009), the aggregate value of grants aid was a positive predictor of second-year persistence among first-generation students (Lohfink & Paulsen, 2005).
Selectivity. Selectivity of the institution is positively associated with postsecondary persistence (Schreiner, 2009) and graduation (Kalogrides & Grodsky, 2011). In fact, one study of black students at elite universities found that selectivity was the only significant institutional predictor of PSC while the institution’s wealth, racial composition, and expenditure on student services were not significant predictors. Selectivity improves graduation rates for black students more than for white students (Small & Winship, 2007). At the same time, it is important that a student’s academic ability and the institution’s selectivity are matched. One study found that less prepared students actually did better at less selective schools (Light & Strayer, 2000). The percentage of community college credentials awarded that are vocational certificates was a negative predictor of PSC with an associate’s degree, but not of transferring or graduating with a bachelor’s degree (Roksa, 2006).
Institution type. Students who begin their college career at a community college have a lower likelihood of receiving a bachelor’s degree, even students who initially plan to transfer (Doyle, 2010; Ganderton & Santos, 1995; Sandy, Gonzalez, & Hilmer, 2006). Enrolling in a community college, for low-SES students, was found to be positively related to bachelor’s degree attainment within six years; however, for high-SES students, it was negatively related (Brand, Pfeffer, & Goldrick-Rab, 2012).
Attending a two-year private (rather than public) college was positively related to PSC, as was attending a four-year public compared with two-year public institution (Ross et al., 2012; Stephan, Rosenbaum, & Person, 2009). Starting at a private for-profit institution was associated negatively with PSC (Ross et al., 2012), though another study found that students at for-profit schools were more likely to graduate within three years with some credential than were students at two-year public colleges (Berkner, Horn, Clune, & Carroll, 2000). One study found that private universities have higher six-year PSC rates than public colleges, but when the composition of the entering class is taken into account, public colleges outpace private universities (DeAngelo et al., 2011).
Student-body composition. With regard to gender, two studies find that a balanced student body is predictive of postsecondary persistence and completion (Alon & Gelbgiser, 2011; Schreiner, 2009). The ratio of male to female students in a given major was a significant predictor of PSC, with both males and

11
females more likely to graduate if females comprise 40 to 60 percent of students, though the effect was stronger for females (Alon & Gelbgiser, 2011).
Having a high proportion of part-time students is negatively associated with PSC (Asmussen, 2011). Specifically in community colleges, high proportions of minority students is also a negative predictor of PSC (Calcago et al., 2008; Jacoby, 2006). Conversely, for non-graduating seniors at four year institutions, a high proportion of white students was a disincentive to return to school (Schreiner, 2009). Postsecondary institution climate. Students of all races are more likely to persist at a postsecondary institution when they perceive low levels of racism and discrimination (Brown et al., 2005; Cabrera et al., 1999; Eimers & Pike, 1997). In a review of the literature, Jensen (2011) also suggests that students, minority students especially, are more likely to persist at postsecondary institutions when they feel academically, socially, and culturally integrated as part of the institution. Students report that integration is more likely at smaller institutions, and when students have the opportunity join clubs and perform research with a professor.
A national study of four year institutions found that satisfaction with campus climate is the most important predictor of postsecondary persistence, especially among first-year students. Also important for freshman is their satisfaction with the availability of their advisors, a sense of belonging, feeling safe on campus, and believing that the institution is wisely using their student fees (Schreiner, 2009). As students progress through their education, different elements of school climate, as well as GPA, gain importance in their likelihood to persist. For sophomores, satisfaction with the selection of offered courses, the effectiveness of instruction and advising, a sense of belonging, fair faculty, and career services are related to persistence. For juniors, satisfaction with advisors, available faculty, the ability to intellectually grow, and familiarity with graduation requirements become more important. Upperclassman reporting they have a comfortable spot to pass time between classes are also more likely to persist in their education (Schreiner, 2009). Another study found no significant relationship between perceptions of various elements of school climate (perceptions of classroom experiences, faculty and staff interactions, student support services, peer interaction, student effort, and goal commitment) and PSC (Brown et al., 2005). Perceived social support was identified in a meta-analysis as a positive predictor of postsecondary retention (Robbins et al., 2004). Student-reported positive academic experiences or interactions were positive predictors (Cabrera et al., 1999). Perceived quality of the institution was a positive predictor for minority students only (Eimers & Pike, 1997).
To summarize, demographic, family-level, individual non-academic and academic behaviors, and institutional characteristics at both the secondary and postsecondary level, are among the factors that have been studied in previous research on PSC. Within these categories, evidence seems particularly strong for the following predictors of PSC: female gender, parental socio-economic status, and academic performance in high school and college (all positively associated with PSC); and first-generation college-going status, non-traditional student status, and community college attendance (all negatively associated). However, taken as a whole, there are ambiguities related to diverse study designs, sample characteristics, and measures. Our analysis plan is aimed at clarifying this picture.

12
Analysis Plan Our analysis plan has been designed to answer the following research questions:
1. What social indicators predict postsecondary enrollment among high school completers? 2. What social indicators predict postsecondary completion among high school completers? 3. What social indicators predict postsecondary completion among postsecondary enrollees? 4. How do these predictions vary by postsecondary institution/degree/certificate type (four-year,
two-year, or less than two-year)? 5. Can a combination of social and academic indicators predict four-year completion with high
levels of accuracy?
For our purposes, social indicators include: family education levels and educational expectations; individual psychosocial factors, such as educational commitment, general self-concept, and locus of control; high school experiences, school climate, and institutional characteristics; and postsecondary experiences, school climate, and characteristics.
Academic ability and success at the secondary and postsecondary level, while not considered social indicators for this project, are important predictor variables included in our analyses since they are intrinsic to the outcomes of interest. Similarly, we control for demographic characteristics, such as gender, race/ethnicity, and income, which have well-known relationships to the postsecondary outcomes of interest.
Methods
Data sources No longitudinal dataset exists that contains enough information on student, school, and postsecondary institutional characteristics to test our complete conceptual model of the factors that address postsecondary enrollment and completion. Consequently, we have tested various key components of our conceptual model by developing analytical models that take advantage of the strengths of multiple extant datasets.
One set of analytical models has been generated using the National Educational Longitudinal Study of 1988 restricted-use data files (NELS:88, hereafter referred to as NELS), while another set is based on restricted-use data from the Beginning Postsecondary Study of 2003-04 to 2008-09 (BPS:04/09, hereafter referred to as BPS). These datasets share certain key strengths. They are both longitudinal studies that collected nationally representative data on a large sample of individual students from a single-grade cohort of students over time. They both also captured postsecondary completion information accurately with the help of transcript data. BPS followed up with students six years after their initial entry to postsecondary education. NELS followed students 12 years after their completion of eighth grade (seven years after they would have entered postsecondary education, if they had graduated high school on-time and enrolled in a postsecondary institution in the first fall semester thereafter).
Furthermore, pursuing analyses with both NELS and BPS data allowed us to balance out particular weaknesses of each survey with the other’s specific strengths. For our purposes, a primary weakness of NELS is that the data are old, with the most recent data collection from 2000, from students who graduated high school and 4-year college “on-time” in 1996. Another primary weakness is that NELS contains limited data on postsecondary climate—the extent to which the institution supports students’ academic success, institutional engagement, safety, and physical and mental health. In contrast to NELS

13
data, BPS data are the most recent nationally representative information available on postsecondary completion, and they include information on postsecondary climate.
A major weakness of BPS is that its cohort includes only students who enroll in postsecondary education. Because of this, BPS can tell us nothing about whether or not students enroll in postsecondary education in the first place. Furthermore, the data collected by BPS are limited in other ways. The study collected little information on family relationships and postsecondary experiences outside of academics; no information on family educational expectations, high school climate, or high school characteristics; and no information on psychosocial factors outside of educational commitment and expectations. Conversely, NELS, because it tracked students before and after their enrollment in postsecondary education, has a substantial amount to tell us regarding postsecondary enrollment. Furthermore, NELS collected data on more topics relevant to our conceptual framework (including psychosocial factors) than any other study, including those topics not covered by BPS.
Table A presents a summary of the strengths and weaknesses of BPS and NELS, as well as other nationally representative datasets that were investigated as potential data sources for our analysis: the Education Longitudinal Study of 2002 (ELS), the National Longitudinal Study of Adolescent Health (Add Health), and the National Longitudinal Survey of Youth (NLSY).
We decided against using ELS, because data on postsecondary completion were not available at the time of analysis. However, ELS would be a perfect candidate for follow-up analyses to our NELS analyses, given the similarities between the two data collections, and the recency of the ELS data. Add Health, while promising, would require more complex analyses than our budget allows, given its multi-age cohort, and it contains no data on educational commitment and limited data on academic discipline, self-confidence, emotional control, high school experience, and postsecondary academics. NLSY’s small sample size, lack of transcript data, and limited data collection relevant to our conceptual model make it a poor choice for our purposes. Table B presents details on the topics relevant to our conceptual framework that are covered by each survey. The psychosocial topic areas listed were drawn from Robbins, et al. (2004).

14
Table A. Summary of dataset strengths and weaknesses. Dataset Strengths Weaknesses Beginning Postsecondary Students (BPS)
• Most recent data (2008-09 data collection for on-time BA cohort 2006-07)
• Large sample size, single-class cohort • Includes postsecondary transcript data • Includes a moderate amount of
information on postsecondary school climate
• Can compare to previous cohorts (on-time BA cohorts 1994 and 2000)
• Includes only students who enroll in postsecondary education
• Limited information on family relationships and postsecondary experience outside of academics
• No information on family educational expectations, high school climate or characteristics
• No information on psychosocial factors outside of educational commitment and expectations
Education Longitudinal Study of 2002 (ELS:2002)
• Would be most recent data (2013 data collection for on-time BA cohort 2008) Large sample size, single-class cohort
• Low attrition rate • Includes high school transcript data • Includes variables of interest across most
categories (on par with NELS:88) • Substantial information on psychosocial
factors • Similarities with NELS: 88 allows for
comparison with previous cohort. • Includes some information on general
determination, problem-solving, and postsecondary school climate
• Data on college completion not yet available (due to be released end of 2013, detailed transcript data may take longer)
• No data on general self concept or emotional control.
National Education Longitudinal Study of 1988 (NELS:88)
• Large sample size, single-class cohort • Includes high school and postsecondary
transcript data • Includes more variables of interest across
more categories than any other data set • Can link to other datasets for information
on basic postsecondary characteristics
• Oldest data (2000 data collection for on-time BA of 1996)
• No information on individuals’ problem-solving ability
• No data on postsecondary climate
National Longitudinal Study of Adolescent Health (Add Health)
• Large sample size • Includes high school and postsecondary
transcript data • Includes substantial numbers of variables
of interest, including psychosocial factors
• No data on educational commitment • Limited data on academic discipline,
self-confidence, emotional control, high school experience, and postsecondary academics
• Multi-age cohort • No data on postsecondary climate
National Longitudinal Survey of Youth (NLSY97)
• Most recent college completion data that includes data collection during high school years (2009-10 data collection for on-time BA 1998-2004)
• Data collected annually
• Small sample size • No postsecondary transcript data • No information on psychosocial factors
outside of locus of control and communication skills
• Multi-age cohort • No data on postsecondary climate

15
Table B. Topics covered various data sources
Category Description ELS NELS Add Health
NLSY BPS
Demographics Includes variables: gender, race/ethnicity, family composition, family income, and parent education level *** *** *** *** ***
Psychosocial
General determination
Reflects the extent to which a student strives to follow through on commitments and obligations * — — — —
Educational Commitment Reflects a student’s commitment to getting a degree * * — — *
Educational Expectation
Reflects a student’s expectations about his or her future education ** *** ** — *
Academic discipline
Reflects the amount of effort a student puts into schoolwork and the degree to which he or she sees himself or herself as hardworking and conscientious
*** *** * — —
Academic self-confidence
Reflects the extent to which a student believes he or she can perform well in school *** *** * — —
Problem solving Reflects a student’s ability to solve problems * — *** — —
Locus of control/future orientation
Reflects a student’s feelings about who or what controls the future *** *** ** *** —
General self-concept Reflects how a student feels about his or herself — *** *** — —
Emotional Control Reflects how a student responds to strong feelings and how he or she manages those feelings — * * — —
Communication Skills
Reflects how attentive a student is to others’ feelings, how flexible he or she is in resolving conflicts with others, and how comfortable he or she feels meeting and interacting with other people
* ** *** * —
Family Relationships Includes variable such as: parental support, communication with parents, time spent with parents, and parental educational expectations
*** *** *** *** *
High School Academics
Includes variables such as high school GPA, ACT or SAT score, courses taken in high school, and AP course taking *** *** ** *** ***
High School Experience
Includes variables related to involvement in extracurricular activities, discipline issues, and hours spent working *** *** * * —
High School Characteristics
Includes variables such as type of institution, average ACT or SAT scores for the school, AP course taking for whole school *** *** ** *** *
High School Climate Includes variables such as student’s sense of feeling safe, relationship with teachers, and belongingness *** *** *** *** —

16
Category Description ELS NELS Add Health
NLSY BPS
Postsecondary Academics
Includes variables such as college GPA and remedial course taking *** *** * *** ***
Postsecondary Experience
Includes variables such as employment status, marital status, number of children, financial aid or loans, and involvement in extracurricular activities.
*** *** ** *** *
Postsecondary Characteristics
Includes variables such as type of institution (i.e. public or private), student-teacher ratio, school size, commuter school, school selectivity, and tuition
** ** ** *** ***
Postsecondary School Climate
Includes variables such as student’s sense of belongingness, feeling safe, and relationship with teachers * — — — **
Dataset has many variables for this concept
Dataset has some variables for this concept
Dataset has only a few variables for this concept
Dataset has no variables for this concept
Analysis Using NELS, we created analytic models for postsecondary enrollment and completion. Using BPS, we created analytic models for postsecondary completion (Table C). Appendix B provides details on all variables created and used in the NELS and BPS analyses.
Our NELS outcome variables of interest were postsecondary enrollment and completion.3
Because of the large number of candidate variables for NELS and different patterns of missing data across multiple variables, we ran a series of logistic regressions. Each model predicted postsecondary enrollment or completion as a function of demographic variables and one variable of interest. This approach provided information on the effect of each variable of interest controlling for demographics, but not for any other variables. Across the models, sample sizes ranged from 1,880 to 7,390 students, representing about 444,000 to 1,783,000 students nationwide. More specifically, the population of interest was limited to those 1988 eighth graders who earned a high school diploma or alternative certificate such as a General Educational Development (GED) certificate by June 1994, approximately two years after they should have graduated high school on-time.
Predictor variables include psychosocial and study skills, high school academic performance and experiences, family relationships and educational expectations, high school climate and characteristics, and student engagement with school. Specific psychosocial factors covered include: educational commitment and expectations, academic discipline and self-confidence, locus of control, general self-concept, emotional control, and communication skills. Student demographic variables were used as controls.
4
Our BPS postsecondary completion models also use logistic regression to analyze completion as a function of student demographics, family relationships, high school academic performance and institutional characteristics, educational expectations, postsecondary academics and experience, and
3 Our NELS analyses did not explore differences by postsecondary institution type because of limited resources. This decision enabled us to pursue separate BPS analyses, described below, which do examine completion by postsecondary institution type using more recent data. 4 The rationale for this cut-off is that about 96 percent of all students who complete a high school credential do so within two years of their expected graduation (Hurst, Kelly, & Princiotta, 2004). Also, we would like the NELS enrollment and completion models to have the same population of interest. Graduating high school by 1994 provides six years for students to enroll in and complete their postsecondary education.
***
**
*
—

17
postsecondary institutional characteristics. Our outcomes of interest are any postsecondary completion (Model A), four-year college completion (Model B), two-year college completion (Model C), and less-than-two-year college completion (Model D). The populations for these models are limited to 2003-04 first-time beginners at a relevant postsecondary institution. For example, Model C considers completion of at least two years among 2003-04 first-time beginners at any two-year institution.
Model A is based on an analysis of data from 12,750 beginning postsecondary students, which, when weighted appropriately, represent approximately 2,739,000 students nationwide. Model B is based on an analysis of data for 7,890 beginning postsecondary students initially enrolled in four-year institutions, representing approximately 1,460,000 students in the United States. Model C is based on data from 4,270 beginning postsecondary students initially enrolled in two-year institutions, representing approximately 1,154,000 students nationally. Model D is based on data from 1,380 beginning postsecondary students initially enrolled in less-than-two-year institutions, representing about 286,000 students across the United States. All BPS models utilized the WTB000 weight (which is the suggested weight for analyses involving participants from all three waves).
For each BPS model, we developed a series of sub-models that include different sets of variables. We first model completion as a function of demographic variables only, and then sequentially add in additional sets of variables: high school variables (e.g., SAT/ACT score and GPA), postsecondary pre-enrollment variables (e.g., number of schools applied to and delayed enrollment), and postsecondary post-enrollment variables (e.g., remedial course- taking). By adding these variables sequentially to the model, we can get a better understanding of how the predictive power of earlier-measured variables changes after controlling for subsequent behaviors or experiences. For example, we can determine whether there is any predictive power to high school GPA in general, and after controlling for postsecondary GPA.5 We also ran Models A, B, and C (the full models; i.e., those with the most variables) separately for key subgroups of interest, namely, white, black, and Hispanic students and traditional and non-traditional students.6
It is important to keep in mind that not all BPS survey respondents were asked all survey questions. Some variables, such as the selectivity of the postsecondary institution, student-faculty interactions, and social integration items, were only asked of students attending certain types of institutions. For more details, see the variable descriptions in Appendix B.
Interpreting odds ratios We present results from our models in the form of odds ratios. An odds ratio of one means there is no independent effect of predictor variable on the outcome variable.
An odds ratio statistically significantly higher than one signifies a positive effect of a predictor on an outcome. Imagine, for example that 75 percent of females complete college, and 50 percent of males do. That would mean females’ odds of completing were 3:1 (three complete for every one that does not), and males were 1:1 (one completes for every one that does not). So, in our hypothetical example, the college completion odds ratio for being female compared with being male would be 3:1/1:1, which equals three. In other words, the (hypothetical) odds that a female will complete college are three times
5 Note that, as discussed in Mood (2010), unobserved heterogeneity unrelated to independent variables in logistic regression models biases estimates toward smaller effects. As a result, adding explanatory variables will, all else being equal, lead to larger odds ratios. 6 We define non-traditional students as students who have delayed enrollment, are part-time, work full-time, are financially independent, have dependents, or do not have a high school diploma.

18
the odds that a male will do so. This could also be stated as follows: the odds of a female completing college are 300 percent that of a male, or 200 percent higher than a male’s.
An odds ratio below one signifies a negative effect. To continue our hypothetical example, the effect on college completion of being male, relative to being female, would be 1:1/3:1, which equals 0.33. This could be stated as the odds of a male completing college are one-third that of a female, or that the odds for males are 33 percent of those for females, or that the odds for males are 67 percent less than that of females.
Odds ratios below one are generally harder for readers to interpret. Furthermore comparing the magnitude of negative and positive effects is tricky. This is partially the result of odds ratios for negative effects being bound between 0 and 1, while positive effects range from just above one to infinity. As a result, it is difficult for readers to compare the magnitude of a negative effect to that of a positive effect.
Table C. Information models by dataset, outcomes of interest, populations of interest and modeling method. Data-set
Outcome of interest Population of interest Method (model)
NELS
Postsecondary enrollment
• Any postsecondary enrollment
• 1988 eighth graders who earned a high school credential by 1994
• Logit
Postsecondary completion
• Any postsecondary completion
• 1988 eighth graders who earned a high school credential by 1994
• Logit
BPS Postsecondary completion
• Any postsecondary completion
• 2003-04 first-time beginners at any college
• Logit (A)
• Four-year postsecondary completion
• 2003-04 first-time beginners at a four-year institution
• Logit (B)
• At least two-year postsecondary completion
• 2003-04 first-time beginners any two-year institution
• Logit (C)
• Less than two-year postsecondary completion
• 2003-04 first-time beginners at less-than-two-year institutions
• Logit (D)
To facilitate comparisons between effect sizes of variables that are negatively related with completion, and those of variables that are positively related with completion, we have inverted odds ratios that are less than one. Thus, any odds ratio presented to the power of negative one represents a negative effect. For example, in our hypothetical example, an odds ratio of 0.33 for being male is equivalent to 3-1. This makes it clear that (hypothetically) being a male triples the odds of non-completion, while being a female (an odds ratio of 3), triples the odds of completion. It is clear that the effects are equal and opposite.

19
The sex example above uses a categorical variable. Note that the effects of continuous variables explored in our logistic regressions are also presented as odds ratios. In these cases, a ratio is between the odds of, for example, completing college at value X on the continuous variable’s scale, and the odds of completing college at value X minus one. This points toward another difficulty in interpreting odds ratios as measures of effect sizes. In any study where scales vary (e.g., a $1 increase in income is not equivalent to a 1-point increase on a 5-point Likert scale), the interpretation of odds ratios as an effect size for continuous variables varies as well. To facilitate comparison of continuous variables’ odds ratios in the present study, odds ratios were standardized. This means that, although the underlying scales of variables may differ, the odds ratios are based on a one standard deviation increase in the scale. For example, an odd ratio of 2 for family income would mean that for a one standard deviation increase in income, the odds of completion would increase by 100%.
Interpreting statistical significance Odds ratios are listed as statistically significant at the p<.05, p<.01, and p<.001 levels in the tables. These levels are demarcated by one, two, or three asterisks, respectively. Results are only discussed in the text if they reach the p<.05 threshold. This means that results are only discussed if the probability that they are due to chance from sampling error is less than one in 20.
Results
NELS Here we present results from models predicting postsecondary completion. Results from the models predicting postsecondary enrollment are similar, though not identical. To view the results of models predicting postsecondary enrollment, see Table 2.
Table 3 presents only significant variables from models predicting postsecondary completion according to the magnitude of their odds ratios, in rank order. Note that this rank ordering is based on estimates of effects, and does not indicate whether the magnitudes of odds ratios are significantly different from one another. Variables with an inverse odds ratio predict lower odds of completion while variables with an odds ratio greater than one predict higher odds of completion.
Psychosocial characteristics The psychosocial characteristics tested included students’ self-concept, locus of control, educational commitment, feelings towards the importance of good grades, educational expectations, social ability, academic self-concept, and conscientiousness. Also included were 10th grade teacher ratings of students’ diligence, ability to relate well to others, likelihood of going to college, and classroom behavior. Of the 30 psychosocial characteristics tested, 21 increased the odds of postsecondary completion, and one lowered the odds: students’ cutting or skipping class (OR=1.39-1
The top five characteristics in terms of effect sizes, which increased the odds of postsecondary completion, were teacher ratings of students in 10
, p<.01).
th
Student characteristics (also increasing the odds of postsecondary completion) with the next largest effect sizes were, from largest to smallest effect size, the following: student believes it is okay to help others with school work in 10
grade. Teachers rated students on their work ethic (OR=3.14, p<.001), the likelihood they would go to college (OR=3.03, p<.001), the frequency with which students did homework (OR=1.88, p<.001), students’ ability to relate well to others (OR=1.85, p<.001), and students’ attentiveness in class (OR=1.81, p<.001).
th grade (OR=1.71, p<.01), student plans to attend college sometime after high school as reported in 10th grade (OR=1.67, p<.01), student believes it is okay to solve problems

20
using new ideas in 10th grade (OR=1.63, p<.01), student is rarely tardy (10th grade teacher rating) (OR=1.45, p<.001), student is not disruptive in class (10th grade teacher rating) (OR=1.43, p<.001), good grades are important to the student in 10th grade (OR=1.39, p<.001), student’s certainty of going farther than high school for education as reported in 8th grade (OR=1.33, p<.001), student believes it is okay to ask challenging questions in 10th grade (OR=1.32, p<.05), student comes to class prepared in 8th grade (OR=1.11, p<.001), student’s 8th grade educational commitment (OR=1.07, p<.001), student’s academic self-concept in 8th and 10th grades (OR=1.07, p<.001), student’s locus of control in 8th grade (OR=1.06, p<.001), the average amount of time spent studying per week in 8th grade (OR=1.05, p<.01), student’s self-concept in 8th grade (OR=1.04, p<.001), student’s opinion of his or herself as a good student in 12th grade (OR=1.04, p<.001), and student’s social ability in 10th
Family-related variables
grade (OR=1.02, p<.05).
Family-related variables included measures of parents’ educational involvement, educational expectations, and parent-student relationships. Of the 18 eighth-grade family-related variables investigated, eight were significantly related to postsecondary completion after controlling for student and family demographic characteristics.
In order of largest to smallest effect size, the family-related variables which increased the odds of students completing postsecondary education were as follows: parents’ expectation that their child will receive a doctoral or professional degree (OR=10.60, p<.05) or a Master’s degree (OR=7.43, p<.05) compared with expecting less than a high school diploma.7
The odds of students completing any postsecondary education were lower if their parents had rules about homework, GPA, and chores (OR=1.17
The next largest, positive effects were parents attending parent-teacher organization meetings (OR=1.29, p<.01), parents’ volunteering or fundraising for school (OR=1.14, p<.05), and parents’ discussing school with their children (OR=1.09, p<.001).
-1, p<.01) and if the parents contacted the child’s school about academics (OR=1.07-1
High school academics
, p<.05).
Predictors related to high school academics included: students’ course-taking patterns, course performance, and academic achievement. Ever taking an AP course, higher tenth grade GPAs, and higher ACT/SAT scores increased the odds of completing any postsecondary degree (OR=2.01, OR=1.52, and OR=1.02, respectively, p<.001). Compared with following a rigorous academic track during high school, other course enrollment patterns were linked to poorer odds of enrolling in college, completing college, or both. With respect to the odds of completing a postsecondary degree, a purely vocational track had the worst odds (OR=3.95-1, p<.001), followed by other tracks, which had odds ratios ranging from 1.91-1 to 2.01-1 (p<.05). Ever taking remedial courses in mathematics or English in high school (OR=1.72-1
High school experience
, p<.001) was also negatively related to postsecondary completion.
Variables relating to a student’s high school experience include measures of risk factors, such as being in disciplinary trouble, being arrested, and drug use, as well as more positive measures, such as positive peer academic influence and time spent on extracurricular activities. Of the 17 measures, assessed in
7 Expecting a high school degree, some college, a two-year degree, and a 4-year degree were not statistically significantly different than expecting a high school degree. The pattern of odds ratios (increasing with additional expectations) suggests that including parental educational expectations as a continuous variable would have been more appropriate.
21
10th or 12th
Behavioral predictors had the largest effects on the odds of completing any postsecondary degree, compared with other types of predictors. From largest to smallest effect size, they are: spending five or more hours per week (OR=2.24, p<.001) or up to four hours per week (OR=1.89, p<.001) on extracurricular activities in 12
grade, 13 were significantly related to postsecondary completion after controlling for demographic characteristics.
th grade (compared with zero hours) and spending five or more hours per week (OR=1.59, p<.001) and spending up to four per week (OR=1.25, p<.05) on extracurricular activities in 10th
Students who were married in 12
grade (compared with zero hours). Having friends in tenth grade who think that education is important (based on students’ perception of how important attending class, studying, getting good grades, finishing high school, and continuing education are to their friends) also increased the odds of completing any postsecondary degree (OR=1.08, p<.001).
th grade (OR=3.18-1, p<.001), having or expecting a child in 12th grade (OR=1.93-1 p<.01), working 21 or more hours per week during the 12th grade school year (OR=1.52-1, p<.01), or transferred schools (OR=1.49-1, p<.01) had lower odds of completing any postsecondary degree. In addition, students who got into disciplinary trouble in 10th or 12th grades, (measured by whether or not students had ever experienced any of the following: ever in trouble for not following rules, suspension, probation, or transfer to another school for disciplinary reasons) (10th grade: OR=1.34-
1, p<.001; 12th grade: OR=1.24-1, p<.05 ) as well as a higher frequency of disciplinary infractions (10th grade: OR=1.16-1, p<.001; 12th grade: OR=1.14-1
High school climate
, p<.001) had lower odds of completing a postsecondary degree.
Three areas of high school climate in 10th
High school characteristics
grade were examined: school safety, school environment, and school engagement. Based on the Safe Supportive Schools model (U.S. Department of Education, 2013), school safety was measured by an index based on items about students’ perceived emotional and physical safety at school. School environment is an index based on the student’s perceived disciplinary environment and student disruptions. School engagement is an index based on the student’s perceived relationships between students, connectedness with teachers, and respect for diversity. Students who perceived a positive school climate in each domain had higher odds of any postsecondary completion (school safety: OR=1.10, p<.01, school environment: OR=1.06, p<.01, and school engagement: OR=1.05, p<.01).
High school characteristics were tested with the following variables: school type (i.e. public or private) and size, school-level student demographics, the percentage of students at that school that go on to various types of postsecondary education, school-level parental involvement, the presence of college-going support services, school-level remedial class taking, average 12th grade attendance, and course taking patterns. Of the 39 variables, just 10 were related to postsecondary completion. All measures were assessed using school-level data from the student’s high school during 12th
Students had higher odds of completing a postsecondary degree (in order from the largest to smallest effect size) if they attended: schools where 75-100 percent of 1990-91 graduates attended a four-year college (OR=4.02, p<.05), private high schools (OR=1.54, p<.05), schools with higher percentages of 12
grade.
th grade students using college preparation programs at school (e.g., programs on financial aid or SAT/ACT courses, OR=1.04, p<.001), schools with higher levels of overall parental involvement (OR=1.02, p<.05), and schools with higher percentages of 12th
Students attending high schools with the following characteristics had lower odds of postsecondary completion (from largest to smallest effect size): a large high school (400+ students) OR=1.30
grade students in college prep programs (OR=1.01, p<.001).
-1, p<.05),

22
schools with higher 12th grade dropout rates (OR=1.03-1, p<.01), schools with a higher percentage of 12th graders that were American Indian or Alaskan Native (OR=1.02-1, p<.05), and schools with a higher percentage of students who received remedial math (OR=1.02-1,p<.01) or remedial reading (OR=1.01-1
Transition to postsecondary education
, p<.01) in high school.
Students and their parents can take steps to prepare for postsecondary education that will increase their odds of completion. This section reports the results of tests of the effect of these activities on postsecondary completion, including : applying to school(s), visiting school(s) with parents, parent knowledge about financial aid, and discussions between parents and students about postsecondary education. Of the 14 variables examined, 11 increase the odds of postsecondary completion.
The steps that increase the odds of postsecondary completion are: applying to postsecondary institutions (see details below), visiting postsecondary institutions (see details below), applying for financial aid (p=1.92, p<.001), parents reading about or discussing financial aid with others to learn more about it (OR=1.74, p<.001), parents being familiar with loan programs (OR=1.19, p<.001), parents taking steps to learn about financial aid (OR=1.11, p<.001), and parents being financially prepared for their teen’s college expenses (OR=1.08, p<.01).
Applying to five or more postsecondary institutions was associated with increased odds of completing college, relative to applying to two to four schools (OR=2.02), one school (OR=2.70), or zero schools (OR=5.89, p<.001). Compared with not applying to any schools, applying to five or more postsecondary institutions applying to two to four postsecondary institutions (OR=2.92, p<.001), and applying to one postsecondary institution (OR=2.18, p<.001) are positively related to postsecondary completion.
Compared with not visiting any schools, visiting five or more schools with a parent (OR=2.89, p<.001), visiting three or four schools with a parent (OR=1.81, p<.001), and visiting two schools with a parent (OR=1.51 p<.001) increase the odds of postsecondary completion.
Postsecondary variables Students’ experiences during their postsecondary education were tested, including: level of institution attended (four-year, two- or three-year, etc.), enrollment intensity (e.g. part-time), enrollment continuity (e.g. taking time off from school), transferring course credit to another post secondary institution, remedial class taking and tutoring, changing majors, participation in extracurricular activities and volunteering, significant life events, and the amount of money borrowed in order to attend school. Of the 25 postsecondary variables, 21 are related to completion.
Participation in extracurricular activities and receiving formal tutoring increase the odds of postsecondary completion. From largest to smallest effect size, the experiences that mattered were: volunteer service to other students (OR=2.93, p<.001), or community groups (OR=2.57, p<.001); participating in social clubs, fraternities, or sororities (OR=2.17, p<.001), participating in intramural athletics (OR=1.95, p<.001), college newspaper or radio station (OR=1.87, p<.01), student government or political groups (OR=1.77, p<.001 non-varsity intercollegiate athletics (OR=1.74, p<.001); postsecondary GPA (OR=1.59, p<.001); receiving formal tutoring (OR=1.42, p<.001); more participation in extracurricular activities (OR=1.42, p<.001); and participation in varsity athletics (OR=1.35, p<.05), or performing arts (OR=1.29, p<.05).
The total amount borrowed for education was also positively related to completion (OR=1.013, p<.001).
The experiences which lowered the odds of postsecondary completion were, from largest to smallest effect size, ever taking time off from school (OR=3.57-1,p<.001), ever attending school part-time (OR=3.13-1,p<.001), attending a two- or three-year school as opposed to a less-than-two year school

23
(OR=2.22-1,p<.05), having a child while enrolled (OR=1.78-1,p<.001), ever transferring credits (OR=1.43-
1,p<.05), taking a remedial math or English class (OR=1.35-1,p<.05), being married while enrolled (OR=1.19-1,p<.05), and hours per week spent volunteering (OR=1.02-1
BPS
,p<.001).
Using BPS, we looked at postsecondary completion by 2008-09 among students who began their postsecondary careers in the 2003-04 school year. We present an overall model, predicting postsecondary completion of any time among all students as well as models specific to students who started at different kinds of institutions (four-year institutions, two-year institutions, and less-than-two-year institutions). With each model we also present sub-models that include different sets of variables, as discussed above.
Predicting any postsecondary completion Models A-1 through A-5 analyzed postsecondary completion by 2008-09 as a function of demographic, high school, and postsecondary variables (Table 5). We defined postsecondary completion as receipt of a postsecondary certificate, a two-year degree, or a four-year degree. For these models, the population of interest was high school diploma recipients who began postsecondary education before age 24 in 2003-04.
Model A-1 included only demographic variables as predictors. Controlling statistically for all other demographic variables, being female (OR=1.66, p<.001), having greater family income (OR=1.26, P<.001), having parents with a bachelor’s degree or higher (in comparison with less than a bachelor’s degree; OR 1.66, p<.001), and having married parents (OR=1.46, p<.001) were all associated with higher odds of completing any postsecondary education. Relative to white students, black students (OR=1.67-1, p<.001) and Hispanic students (OR=1.45-1
Model A-2 added high school achievement variables as additional predictors. High school GPA (OR=2.01, p<.001), SAT/ACT score (OR=1.44, p<.001), and highest math class taken in high school (OR=1.26, p<.001) were all associated with improved odds of completing any postsecondary education. Earning college credit during high school or earning AP credits in high school were not significantly related to completing any postsecondary education. All demographic variables significant in Model A-1 remained significant in Model A-2 with all effects in the same direction; however, the magnitude of the effect of having a parent with a bachelor’s degree decreased significantly from an odds ratio of 1.66 to 1.24.
, p<.001) had lower odds of completing any postsecondary education.
Model A-3 included additional information on the postsecondary institution application process, postsecondary institutional characteristics, and timing and type of initial enrollment. Student cost (the amount of money left when all student aid was subtracted from tuition and fees for the 2003-04 school year) increased the odds of any postsecondary completion (OR=1.32, p<.001), whereas delaying enrollment (OR=1.71-1, p<.001) and initially enrolling as a part-time student (OR=1.46-1
In Model A-4, we introduced predictors based on information from the first year of postsecondary education. These predictors included academic factors: GPA, whether a major was selected in the first year, whether students took remedial coursework, and highest degree the student expected to earn. Experiential factors included whether a student was married or had a child during their first year of postsecondary enrollment, whether they volunteered, and the extent to which they worked. A higher
, p<.001) were negatively related to any postsecondary completion. The statistical significance and direction of other effects remained generally the same, with the notable exception of parental receipt of a BA, which decreased further in influence from the initial models, and no longer attained statistical significance (parental education, OR=1.09, p=.22).
24
postsecondary GPA (OR=2.03, p<.001) and selecting a major in the first year of postsecondary education (OR=1.23, p<.05) increased the odds of postsecondary completion, whereas having a child during the first year of postsecondary enrollment (OR=1.92-1, p<.05) and working more than 20 hours per week, compared with working no hours per week, (OR=1.32-1
We introduced interim outcomes into Model A-5: the student’s satisfaction with their major and postsecondary institution (as reported in 2009), the number of times a student transferred, and whether a student was ever enrolled part-time. Each of these indicators made a statistically significant contribution to predicting whether or not a student would complete any postsecondary education; satisfaction with major (OR=1.26, p<.05) and institution (OR=1.95, p<.001) increased the odds of any postsecondary completion, while transferring (OR=1.28
, p<.01) lowered the odds of postsecondary completion. After including postsecondary GPA and other predictors from the first year of postsecondary education in model A-4, SAT/ACT were no longer statistically significant (OR=1.11, p=0.35) whereas the number of schools to which the student applied became significant (OR=1.15, p<.05).
-1, p<.01) and ever being a part-time student (OR=2.57-1
Predictors ranked according to size of odds ratios, regardless of direction
, p<.001) decreased the odds of postsecondary completion. After introducing ever having been a part-time student into the model, the effect of beginning as a part-time student flipped (OR=1.30, p<.05). Because the magnitude of the effect of starting as a part-time student was smaller than that of ever having been a part-time student, this implies that, although starting as a part-time student decreases the odds of completing any postsecondary credential, becoming a part-time student after starting full-time is substantially worse.
In order to find indicators, it is important to look at absolute effect sizes, regardless of the direction of the effect. Because all other variables that were significant in Model A-4 remained significant in Model A-5 with the same direction of effect, we used the results of Model A-5 to compare the relative size of the relationships between our predictor variables and any college completion. Table 6 presents significant variables from model A-5 according to the magnitude of their odds ratios, in rank order. Race and gender variables are excluded, given that they are non-malleable. Note that this rank ordering is based on our best estimates of effects and does not indicate whether the magnitudes of odds ratios are significantly different from one another. Variables with an inverse odds ratio predict lower odds of completion while variables with an odds ratio greater than one predict higher odds of completion.
In rank order, ever being a part-time student was the largest effect (OR=2.57-1, p<.001), followed by having a child during the first year of postsecondary enrollment (OR=2.01-1, p<.05), first-year postsecondary GPA (OR=1.96, p<.001), satisfaction with institution (OR=1.95, p<.001), delayed enrollment (OR=1.74-1, p<.001), high school GPA (OR=1.63, p<.001), income (OR=1.41, p<.001), starting as a part-time student (OR=1.30, p<.05), number of times transferring (OR=1.28-1, p<.01), satisfaction with major (OR=1.26, p<.05), student cost (OR=1.26, p<.001), working more than 20 hours per week (compared with working no hours per week, OR=1.23-1
Subgroup analyses by race/ethnicity
, p<.05), selecting a major in the first year of postsecondary education (OR=1.21, p<.05), number of schools to which the student applied (OR=1.15, p<.05), and highest mathematics class taken in high school (OR=1.14, p<.05)
We ran versions of Model A-4 for specific race/ethnicity sub-populations looking at postsecondary completion by 2008-09 as a function of demographic, high school, and postsecondary variables (i.e., white, black, and Hispanic) (Table 19). 8
8 Some variables were excluded from this analysis due to small cell sizes.
This enabled us to investigate the extent to which predictors of college completion vary by race/ethnicity. It is important to note that the black and Hispanic student
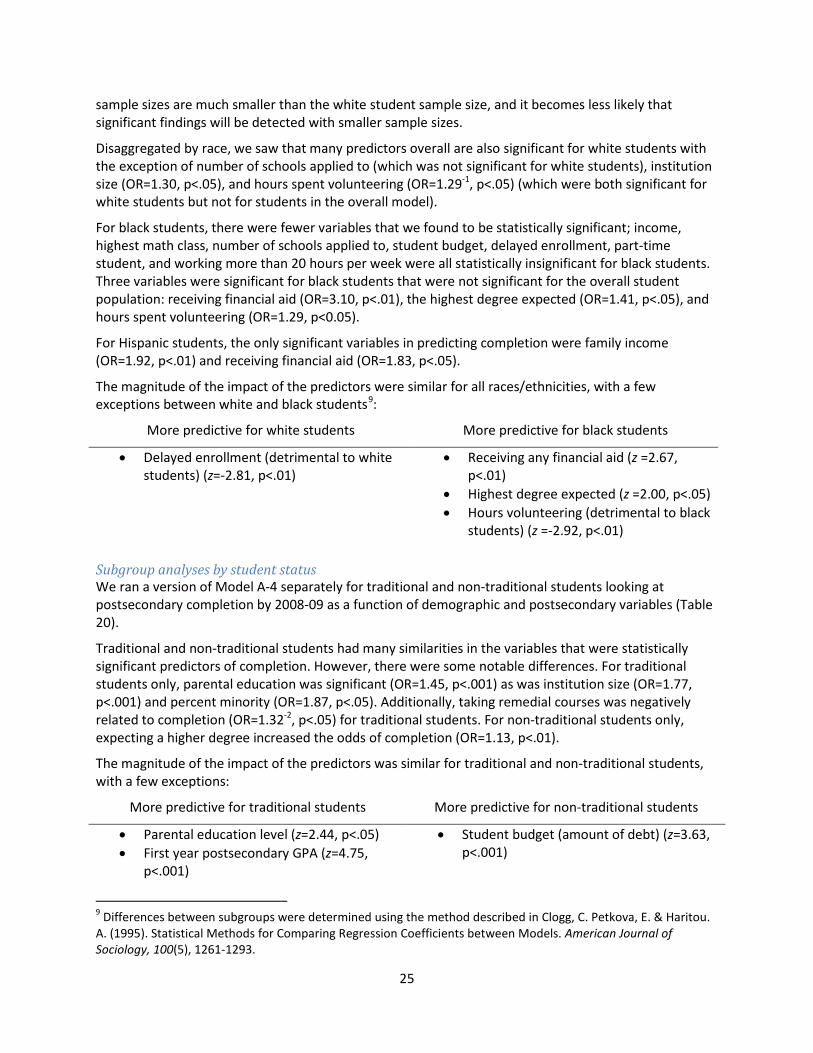
25
sample sizes are much smaller than the white student sample size, and it becomes less likely that significant findings will be detected with smaller sample sizes.
Disaggregated by race, we saw that many predictors overall are also significant for white students with the exception of number of schools applied to (which was not significant for white students), institution size (OR=1.30, p<.05), and hours spent volunteering (OR=1.29-1
For black students, there were fewer variables that we found to be statistically significant; income, highest math class, number of schools applied to, student budget, delayed enrollment, part-time student, and working more than 20 hours per week were all statistically insignificant for black students. Three variables were significant for black students that were not significant for the overall student population: receiving financial aid (OR=3.10, p<.01), the highest degree expected (OR=1.41, p<.05), and hours spent volunteering (OR=1.29, p<0.05).
, p<.05) (which were both significant for white students but not for students in the overall model).
For Hispanic students, the only significant variables in predicting completion were family income (OR=1.92, p<.01) and receiving financial aid (OR=1.83, p<.05).
The magnitude of the impact of the predictors were similar for all races/ethnicities, with a few exceptions between white and black students9
More predictive for white students
:
More predictive for black students
• Delayed enrollment (detrimental to white students) (z=-2.81, p<.01)
• Receiving any financial aid (z =2.67, p<.01)
• Highest degree expected (z =2.00, p<.05) • Hours volunteering (detrimental to black
students) (z =-2.92, p<.01)
Subgroup analyses by student status We ran a version of Model A-4 separately for traditional and non-traditional students looking at postsecondary completion by 2008-09 as a function of demographic and postsecondary variables (Table 20).
Traditional and non-traditional students had many similarities in the variables that were statistically significant predictors of completion. However, there were some notable differences. For traditional students only, parental education was significant (OR=1.45, p<.001) as was institution size (OR=1.77, p<.001) and percent minority (OR=1.87, p<.05). Additionally, taking remedial courses was negatively related to completion (OR=1.32-2
The magnitude of the impact of the predictors was similar for traditional and non-traditional students, with a few exceptions:
, p<.05) for traditional students. For non-traditional students only, expecting a higher degree increased the odds of completion (OR=1.13, p<.01).
More predictive for traditional students More predictive for non-traditional students
• Parental education level (z=2.44, p<.05) • First year postsecondary GPA (z=4.75,
p<.001)
• Student budget (amount of debt) (z=3.63, p<.001)
9 Differences between subgroups were determined using the method described in Clogg, C. Petkova, E. & Haritou. A. (1995). Statistical Methods for Comparing Regression Coefficients between Models. American Journal of Sociology, 100(5), 1261-1293.
26
• Remedial course taking (detrimental for traditional students) (z=-2.01, p<.05)
• Institution size (z=4.34, p<.001)
Predicting completion at four-year institutions Models B-1 through B-6 analyzed four-year college completion as a function of demographic, high school, and postsecondary variables (Table 8). For these models, the population of interest was high school diploma recipients under age 24 who enrolled in a four-year college as their first postsecondary institution in 2003-04.
Model B-1 included only demographic variables as predictors. Controlling statistically for all other demographic variables, being female (OR=1.56, p<.001), having greater family income (OR=1.58, P<.001), having parents with a bachelor’s degree or higher (OR 1.88, p<.001), and having married parents (OR=1.43, p<.001) were all associated with higher odds of completing a four-year college degree. Relative to white students, black students (OR=1.43-1, p<.05) and Hispanic students (OR=1.77-1
Model B-2 added variables on high school achievement, postsecondary institution application process, postsecondary institutional characteristics, and timing and type of initial enrollment as additional predictors. High school GPA (OR=1.96, p<.001), SAT/ACT score (OR=1.68, p<.001), and higher math classes taken in high school (OR=1.37, p<.01) were all associated with improved odds of completing a four-year college degree. Earning college credit during high school and earning AP credits in high school were not significantly related to completion at a four-year college. Student cost (OR=1.28, p<.001) and institutional selectivity (OR=4.16, p<.001) were both positively related to any postsecondary completion whereas delayed enrollment (OR=1.93
, p<.001) had lower odds of completing a four-year college degree.
-1, p<.05) and initially enrolling as a part-time student (OR=1.68-1
In Model B-3, we introduced predictors based on information from the first year of postsecondary education. These predictors included academic, experiential, and social factors. Postsecondary GPA (OR=5.55, p<.001), participating in school clubs (OR=1.16, p<.01), and participating in study groups (OR=1.17, p<.05) each increased the odds of postsecondary completion. Compared with not working, working more than 20 hours per week lowered the odds of four-year college completion (OR=1.40
, p<.001) were negatively related to any postsecondary completion. The race variables that were significant in Model B-1 were no longer significant in Model B-2. Furthermore, the magnitude of the effect of having a parent with a bachelor’s degree decreased from 1.88 to 1.23 and lost significance. The effects of parental marital status remained similar in the two models.
-1, p<.01). In addition, each hour of volunteering was associated with a small decrease in the odds of four-year college completion (OR=1.19-1
Model B-4 included several additional predictors that cut across all years of enrollment: whether the student ever married or had a child while enrolled, or whether the student became a part-time student after the first year. Note that the student population for this model is slightly different than in models B-1 through B-3, which included only students who were considered dependent children for FAFSA purposes. This allowed us to include parents’ marital status as a demographic predictor. In the current model (B-4), parents’ marital status was excluded as a predictor, as this information was not asked of students who were married or had a child. Both having a child while enrolled (OR=2.87
, p<.01). After including postsecondary GPA and other predictors from the first year of postsecondary education, SAT/ACT score (OR=1.24, p=0.14) and student cost (OR=1.16, p=.07) were no longer significant.
-1, p<.001) and becoming a part-time student after the first year (OR=3.61-1, p<.001) were negatively associated with completion at a four -year institution.

27
In Model B-5, we introduced additional postsecondary experience variables from the year 2006, this time incorporating two time points of information on social integration, student-faculty relationships, and hours volunteering. In so doing, the significance of several variables in prior models disappeared: delayed enrollment, working more than 20 hours per week in 2004, participating in school clubs in 2004, and participating in study groups in 2004. In 2006, participating in school clubs (OR=1.22, P<.01) or school sports (OR=1.17, p<.05), talking with faculty outside of class (OR=1.20, p<.05), and meeting with an academic advisor (OR=1.26, p<.01) all increased the odds of completion at a four -year institution. Hours spent volunteering in 2006 decreased the odds of completion at a four-year institution (OR=1.07-
1
We introduced interim outcomes into Model B-6: the students’ satisfaction with their major and postsecondary institution (as reported in 2009), and the number of times a student transferred. Each of these indicators made a statistically significant contribution to predicting whether or not a student would complete at a four-year institution, with satisfaction with major (OR=1.36, p<.05) and with institution (OR=1.93, p<.001) increasing the odds of four -year completion, and transferring (OR=2.87
, p<.001).
-1
Predictors ranked according to size of odds ratios, regardless of direction
, p<.001) decreasing the odds of postsecondary completion. The number of schools to which the student applied reached significance (OR=1.28, p<.05), while three variables that had been significant in prior models lost their significance: highest high school mathematics class, hours spent volunteering in 2006, and participation in school sports in 2006.
We used the results of Model B-6 to compare the relative size of the relationships between our predictor variables and any college completion. Table 9 presents significant variables from Model B-6 according to the magnitude of their odds ratios, in rank order. Race and gender variables are excluded, given that they are non-malleable. Note that this rank ordering is based on estimates of effects and does not indicate whether the odds ratios are significantly different from one another. Variables with an inverse odds ratio predict lower odds of completion while variables with an odds ratio greater than one predict higher odds of completion. First-year postsecondary GPA (OR=3.76, p<.001) was the largest effect, followed by selectivity of institution (OR=3.65, p<.001), becoming a part-time student after the first year (OR=3.24-1, p<.001), number of transfers (OR=2.87-1, p<.001), having a child while in school (OR=2.29-1, p<.001), student’s satisfaction with their institution in 2009 (OR=1.93, p<.001), starting as a part-time student (OR=1.90-1, p<.001), high school GPA (OR=1.56, p<.001), making an additional $10,000 in family income (OR=1.38, p<.01), the student’s satisfaction with their major as reported in 2009 (OR=1.36, p<.05), the number of schools applied to (OR=1.28, p<.05), having a parent with a Bachelor’s degree or higher (OR=1.26, p<.05), meeting with an academic advisor (OR=1.23, p<.05), , speaking with faculty outside of class (OR=1.19, p<.05), volunteering an additional hour in 2004 (OR=1.17-1
Subgroup analyses by race/ethnicity
, p<.01), and being in school clubs in 2006 (OR=1.14, p<.05).
We ran a version of Model B-5 separately for different race/ethnicity sub-populations (i.e., white, black, and Hispanic) looking at four-year college completion as a function of demographic, high school, and postsecondary variables (Table 21). 10
For white students, family income (OR=1.29, P<.05), parental education (OR=1.46, p<.01), high school GPA (OR=1.45, p<.01), the highest math class taken in high school (OR=1.32, p<.05), postsecondary selectivity (OR=4.61, p<.001), and first year postsecondary GPA (OR=5.67, p<.001) were significantly related to completion. Additionally, many social integration and faculty relationship predictors from
10 Some variables were excluded from this analysis due to small cell sizes.

28
2006 were significantly related to completion including, participation in school clubs (OR=1.25, p<.01), participation in school sports (OR=1.22, p<.01), participation in study groups (OR=1.19, p<.05), frequency of talking with faculty outside of class (OR=1.22, p<.05), and frequency of meeting with an academic advisor (OR=1.42, p<.001).Beginning as a part-time student (OR=2.19-1, p<.001), having a child while enrolled (OR=2.75-1, p<.001), and becoming a part-time student after the first year (OR=4.35-1
For black students only two predictors were significantly related to completion. First year postsecondary GPA (OR=4.91, p<.05) was associated with completion, whereas becoming part-time after the first year (OR=4.10
, p<.001) were negatively related to completion.
-1
For Hispanic students, only first year postsecondary GPA was a significant predictor of completion (OR=4.77, p<.05).
, p<.05) was associated with non-completion.
The magnitude of the coefficients for the predictors were similar for all races/ethnicities. As mentioned above, the lack of significant predictors is likely because of small sample sizes for black and Hispanic students.
Subgroup analyses by student status We ran a version of Model B-5 separately for traditional and non-traditional student sub-populations looking at four-year college completion as a function of demographic postsecondary variables (Table 22).
Many predictors were significant for both traditional and non-traditional students including institution selectivity, first year postsecondary GPA, having a child while enrolled, becoming part-time after the first year, and frequency of talking to faculty outside of class.
For traditional students only, gender (OR=1.36, p<.01), family income (OR=1.40, p<.01), parental education (OR=1.39, p<.01), number of schools applied to (OR=1.23, p<.05), participating in school clubs in 2006 (OR=1.25, p<.001), and participating in school sports in 2006 (OR=1.24, p<.01) were positively related to completion, whereas hours volunteering in 2004 (OR=1.17-1, p<.01) and becoming married while enrolled (OR=2.07-1
For non-traditional students only, the highest degree expected (OR=1.56, p<.05) and frequency of meeting with an academic advisor (OR=1.41, p<.05) were positively related to completion.
, p<.01) were negatively related to completion.
The magnitude of the impact of the predictors was similar for traditional and non-traditional students, with the exception of first year postsecondary GPA (more important for traditional students, p=3.32, p<.001) and educational expectations (more important for non-traditional students, z=2.20, p<.05).
Predicting completion at two-year institutions Models C-1 through C-5 analyzed postsecondary completion of at least a two -year degree as a function of demographic, high school, and postsecondary variables (Table 11). For these models, the population of interest is high school diploma recipients under age 24 who enrolled in a two-year institution as their first postsecondary institution in 2003-04.
Model C-1 included only demographic variables as predictors. Controlling statistically for all other demographic variables, being female (OR=1.62, p<.001) and having parents with a bachelor’s degree or higher (OR 1.26, p<.05) were associated with higher odds of completing at least a two -year degree. Income and parent’s marital status were not related to the outcome. Relative to white students, black students (OR=2.27-1, p<.001) and Hispanic students (OR=1.43-1, p<.05) had lower odds of completing at least a two-year degree.

29
Model C-2 added variables on high school achievement, the postsecondary institution application process, postsecondary institutional characteristics, and the timing and type of initial enrollment. High school GPA (OR=2.16, p<.001) and earning college credit during high school (OR=1.73, p<.01) increased the odds of completing at least a two-year degree. Meanwhile, other high school academic indicators such as SAT score, highest math class taken, and earning AP credit during high school were not related. Student cost (OR=1.64, p<.01) increased the odds of completing at least a two -year degree, whereas initially enrolling as a part-time student (OR=1.46-1
In Model C-3, we introduced academic, experiential, and social predictors based on information from the first year of postsecondary education. Postsecondary GPA (OR=2.09, p<.001), selecting a major in the first year (OR=1.35, p<.05), hours spent volunteering (OR=1.22, p<.05), and talking with faculty outside of class (OR=1.61, p<.01) each increased the odds of postsecondary completion among students who started at two-year institutions. Taking remedial classes (OR=1.32
, p<.05) decreased the odds of completion. While gender and being black remained significant in Model C-2, being Hispanic and parental education were no longer significant.
-1, p<.05) decreased the odds of completing at least a two-year degree. Including GPA and other predictors from the first year of postsecondary education resulted in gender (OR=1.26, p=.17) and beginning as a part-time student (OR=1.35-1, p=.11) becoming non-significant. Additionally, being Hispanic (compared with white) (OR=1.60-1
Model C-4 included additional information on student’s experiences throughout their postsecondary careers: ever having a child or being married while enrolled, and becoming a part-time student after the first year. Note that the student population for this model is slightly different from that in models C-1 through C-3, which included only dependent children. Parental marital status was excluded as a predictor in this model, as this information was not asked of students who were married or had a child. Having a child while enrolled (OR=1.67
, p<.05) became significant again and was associated with decreased odds of completion.
-1, p<.05) and becoming a part-time student after the first year (OR=1.56-1, p<.05) were significantly and negatively related to completion of at least a two -year degree. When these additional predictors were introduced, income (OR=1.58, p<.05) and beginning as a part-time student to became significant (OR=1.81-1, p<.01), and taking remedial classes (OR=1.29-1
We introduced interim outcomes into Model C-5: satisfaction with major and postsecondary institution (as reported in 2009) and number of times a student transferred throughout their postsecondary career (whether to another two-year school or to a four-year school through 2008-09). Of these new variables, only number of transfers was significantly related to completion—in a positive direction (OR=2.42, p<.001). After introducing these interim outcomes into the model, earning college credit in high school (OR=1.44, p=.06) and volunteering (OR=1.18, p=.11) were no longer significant.
, p=.05) and being Hispanic (OR=1.42, p=.10) were no longer statistically significant.
Predictors ranked according to size of odds ratios, regardless of direction We used the results of Model C-5 to compare the relative size of the effects of our predictor variables and the odds of completion of at least a two-year degree. To facilitate comparisons between the effects of variables that are negatively related with completion and variables that are positively related with completion, we have inverted odds ratios that are less than one.
Table 12 presents variables significant in Model C-5 according to the magnitude of their odds ratios, in rank order—regardless of the direction of the effect. Race and gender variables are excluded, given that they are non-malleable. Note that this rank ordering is based on estimates of effects and does not indicate whether the odds ratios are significantly different from one another. In rank order, the significant predictors were number of times transferring (OR=2.42, p<.001), first-year postsecondary GPA (OR=2.10, p<.001), starting as a part-time student (OR=1.81-1, p<.01), talking to faculty outside of

30
class (OR=1.73, p<.001), ever having a child while enrolled (OR=1.66-1, p<.05), high school GPA (OR=1.61, p<.05), becoming a part-time student after the first year (OR=1.61-1
Subgroup analyses by race/ethnicity
, p<.05), income (OR=1.56, p<.05), selecting a major in the first year of postsecondary education (OR=1.53, p<.01), and student cost (OR=1.43, p<.05).
We ran a version of Model C-4 separately for white, black, and Hispanic student subgroups looking at postsecondary completion of at least a two -year degree as a function of demographic, high school, and postsecondary variables (Table 23).11
For these analyses, only predictors for white students were statistically significant, including high school GPA (OR=2.15, p<.05), student budget (OR=1.69, p<.05), beginning as a part-time student (OR=1.89
-1, p<.05), first year postsecondary GPA (OR=2.34, p<.001), selecting a major in the first year (OR=1.40, p<.05), working up to 20 hours per week (OR=1.97, p<.01), frequency of talking to faculty outside of class (OR=1.94, p<.001), and becoming a part-time student after the first year (1.77-1
The magnitude of the impact of the predictors was similar for all races/ethnicities, with the exception of working up to 20 hours per week which contributed to completion for white students, but, although not significant, had a negative odds ratio (indicating if it were significant it would be detrimental to Hispanic students, z=2.37, p<.05).
, p<.05). The lack of significant predictors for black and Hispanic students is most likely due to the small sample size for these populations. For both black and Hispanic students, most predictors were in the same direction and had similar magnitudes to those for white students, even though they did not meet statistical significance.
Subgroup analyses by student status We ran a version of Model C-4 separately for traditional and non-traditional students looking at postsecondary completion of at least a two -year degree as a function of demographic and postsecondary variables (Table 24). 12
Unlike the other student status subgroup models, there were more non-traditional students in this model (students who started at a 2-year postsecondary institution). Perhaps because of this, there were more significant predictors for non-traditional students than traditional students, and only one predictor that was significant for both groups; first year postsecondary GPA.
For traditional students only, participation in fine arts activities (OR=1.21-1, p<.05) and becoming a part-time student after the first year (OR=1.75-1
For non-traditional students only, being black compared with white (OR=1.84
, p<.001) were negatively associated with completion, and frequency of talking to faculty outside of class (OR=1.46, p<.05) was positively related to completion.
-1, p<.05) and having a child while enrolled (OR=2.16-1
The magnitude of the impact of the predictors was similar for traditional and non-traditional students, with the exception of participation in fine arts activities (z=-2.50, p<.05) and becoming part-time after
, p<.001) were related to decreased odds of completion. Being female compared to male (OR=1.65, p<.001), family income (OR=1.63, p<.05), the number of school applied to (OR=1.23, p<.05), student budget (OR=1.75, p<.001), selecting a major in the first year (OR=1.66, p<.001), and high degree expectations (OR=1.61, p<.001) were associated with increased odds of completion.
11 Some variables were excluded from this analysis because of small cell sizes. 12 There were a number of variables that were excluded from this Model because they were used to identify student status (e.g., being part-time or working full-time).
31
the first year (z=-3.04, p<.01); both demonstrated a larger negative relationship with the odds of completion for traditional students than for non-traditional students.
Predicting completion at less-than-two-year institutions Models D-1 through D-4 examined any postsecondary completion among students who started at a less-than-two-year-institution, as a function of demographic and postsecondary variables (Table 14). Any type of completion (certificate, two -year degree, four-year degree, etc.) is counted as completion in this model, whether it was obtained at the student’s original institution or an institution to which they transferred. We did not further limit the sample by age or type of high school diploma (as in other models) because non-traditional students are more likely to attend less-than-two-year-institutions. Because we include all beginners, we are not able to look at high school variables, as those variables are collected only from respondents under 24 years of age with traditional high school diplomas.
Model D-1 included only demographic variables as predictors. Simultaneously controlling statistically for all other demographic variables, the only significant variable was Hispanic origin. Relative to white students, Hispanic students starting at less than two year institutions are more likely to complete any postsecondary education (OR=1.89, p<0.001). There were no differences between other racial/ethnic groups.
Model D-2 added additional information on the postsecondary institution application process, postsecondary institutional characteristics, and timing and type of initial enrollment. Student cost was positively related to completion at less-than-two-year institutions (OR=1.63, p<.01), whereas delayed enrollment was negatively related to completion at less-than-two-year institutions (OR=1.51-1
Model D-3 introduced predictors based on information from the first year of postsecondary education. These predictors included academic, experiential, and social factors. Postsecondary GPA (OR=1.49, p<.05) and being married during the first year of postsecondary enrollment (OR=1.72, p<.05) both increased the odds of completion whereas selecting a major in the first year (OR=1.65
, p<.05). The statistical significance and direction of Hispanic origin remained the same.
-1, p<.01) and educational expectations (OR=1.27-1
In Model D-4, we introduced the interim outcomes of number of transfers and satisfaction with major and postsecondary institution. None of these three additional variables were significant and the significance and direction of other variables in the model did not change from Model D-3.
, p<.05) decreased the odds of completion. The statistical significance and direction of variables included in previous models remained the same.
Predictors ranked according to size of odds ratios, regardless of direction Table 15 presents significant variables from Model D-4 according to the magnitude of their odds ratios, in rank order. Race and gender variables are excluded, given that they are non-malleable. Note that this rank ordering is based on estimates of effects and does not indicate whether the odds ratios are significantly different from one another. Variables with an inverse odds ratio predict lower odds of completion while variables with an odds ratio greater than one predict higher odds of completion. In rank order, the following variables are associated with odds of completing any type of postsecondary education for students who start off at a less-than-two-year institution: delaying postsecondary enrollment (OR=1.75-1, p<.05), being married during the first year of postsecondary enrollment (OR=1.71, p<.05), student cost (OR=1.66, p<.01), selecting a major in the first year of postsecondary education (OR=1.66-1, p<.01), first-year postsecondary GPA (OR=1.50, p<.05), and highest degree expected (OR=1.29-1, p< .05).
32
Predicting non-completion at four-year institutions simply As a supplementary analysis, we looked at the seven post-high-school predictors of four-year college completion with the highest predictive power, as ranked by odds ratios, and examined, for each value of the predictor, the percentage of students who did not complete.
For each of the categorical predictors (had a child, was not satisfied with undergraduate education, became part-time, started part-time), more than half of the students exhibiting the predictor failed to complete a four-year degree. The non-completion rate was 77 percent for students who had a child prior to postsecondary enrollment or during postsecondary attendance, 62 percent for those not satisfied with their undergraduate education, 59 percent for students who started full-time but became part-time, and 58 percent for students starting part-time (Table 17). In comparison, the non-completion rate for the total population of first-time beginners at four-year institutions was 36 percent.
For each of the continuous predictors (first-year GPA, number of transfers, school selectivity), we looked for reasonable cut-points for predicting non-completion. For number of transfers and school selectivity, the number of responses was small, so we examined, for each value of the predictor, the percentage of students who did not complete. Because first-year postsecondary GPA was a continuous variable with many possible responses, we created a categorical first-year postsecondary GPA variable, with categories corresponding to of 0 to 1, 1 to 1.99, 2 to 2.99, and 3 to 4.
On empirical grounds (looking at simple cross-tabulations between the predictors and 4-year college completion), we then selected cut-points on the scales that separated students with relatively low risks of non-completion from those with relatively high risks of non-completion. We identified the following as risky: having less than a C average, transferring one or more times, and attending a non-selective school (a school with the lowest rank on the selectivity index).
Again, for these predictors, more than half of the students exhibiting the predictor failed to complete a four-year degree. The non-completion rate among students starting at a four-year institution was 69 percent for those who transferred, 71 percent for those attending a non-selective school, and 78 percent for those with a GPA below a C average.
Next, we examined non-completion rates among students attending four-year institutions by the number of risks they demonstrated (zero to seven). We chose having two or more risks as being a strong overall indicator of risk, because three quarters of those students with two or more risks (76 percent) failed to complete a four-year degree or higher.
Furthermore, this overall risk indicator identified more than half of those students who did not complete a four-year degree (Table 18).
As with any indicator, there were both false negatives and false positives (Tables 17 and 18). Regarding false negatives, 22 percent of students who were not flagged as risky by the overall risk indicator failed to complete; this corresponds to 47 percent of the total population of non-completers. With respect to false positives, 24 percent of students who were flagged as risky completed a four-year degree; this corresponds to 9 percent of the total population of four-year completers.
33
Discussion This study identified a number of social indicators that predicted postsecondary completion among high school completers and postsecondary enrollees.
The predictive power of social indicators One goal of this study was to determine which social indicators have the greatest predictive power, alone or in combination. We presented ranked lists of odds ratios as measures of effect size, and we present recommendations for social indicators based in large part on these effect sizes, below. The rule of thumb for odds ratios is that a small effect is 1.44 to 2.47, a medium effect is 2.48 to 4.25, and a large effect is 4.26 and above (Chinn, 2000).13
One thing to keep in mind when interpreting odds ratios, is that, for continuous variables, effects are multiplicative as you move up (or down) the scale. For example, in our NELS analyses, we saw that ACT/SAT score had an odds ratio of 1.02 per 10 point increase on the SAT scale. This would seem trivial, according to the rule of thumb. However, a 200 point increase would boost the odds of completion by 1.02 raised to the power of 20—or 1.48—a substantive, albeit still small, effect. In informing our discussion, we generated odds ratios for a one standard deviation increase on each scale (we present odds ratios for standardized continuous variables in tables and text for our BPS analyses, but not for our NELS analyses). This helped us determine whether an apparently small or trivial effect, might actually be meaningful.
In general, as with most social indicators, most effects in this study were trivial or small, with a few medium effects.
14
Importantly, social indicators with small effect sizes can still have substantial predictive power when grouped together (both alone, and in combination with academic indicators). Our exploratory analysis of a simple approach to identifying four-year college students highly likely to not complete underscores the power of combining social indicators with academic indicators. With data from a national survey, we have condensed seven simple variables into an even simpler risk indicator that allow us to identify more than half of the students who drop out with 76 percent precision.
15
Although this risk indicator is not a full-fledged early warning indicator for identifying students likely to not complete college, it points the way for how to develop one using more granular information, collected on a semester-by-semester basis.
16
13 By taking the natural log of an odds ratio and dividing by 1.81, one can convert the odds ratio to the same scale as Cohen’s d, a typical measure of effect size, for which a value of 0.2 is generally considered small, 0.5 is generally considered medium, and 0.8 is generally considered large (Chinn, 2000).
Frequently updated information such as semester GPA,
14 This also made effect sizes for variables on different scales (say income in thousands of dollars versus one point on a seven point scale) somewhat more comparable. 15 BPS data has a “risk index” variable. Although it includes two similar variables to our risk indicator (part-time enrollment and having a child/dependents), the other variables are quite different from our indicator. The BPS risk index includes delayed enrollment, no high school diploma, part-time enrollment, financially independent, having dependents, single parent status, and working full-time while enrolled. 16 One problem with our non-completion risk indicator is that the information it incorporates on satisfaction with undergraduate education is retrospective, collected at the last time-point in the BPS. The extent to which post-hoc satisfaction is related to satisfaction during schooling (and prior to dropping out) is an empirical question that cannot be answered with the BPS data. We hypothesize that dropping out would be preceded by lower satisfaction.

34
enrollment status, satisfaction, and child bearing could be used to identify and track at-risk students and target services to those most likely to become non-completers.
Predicting postsecondary completion among high school completers In addition to the traditional academic predictors of postsecondary success, such as GPA, SAT scores, and academic track, numerous social indicators collected in 8th, 10th, and 12th
This implies two things. First, there are changes that can be made as early as eighth grade—and most likely before then—that can positively influence the odds of students completing college. Second, although academic performance and student achievement are important predictors of postsecondary success, there are many non-academic predictors tied to college completion.
grade were significantly related to postsecondary completion. These included 22 of the psychosocial factors that we investigated, 8 of the family variables, 13 high school experience variables, 3 school climate variables, 10 variables on high school characteristics, 11 variables on transition, and 20 variables on postsecondary characteristics. Of course, the number of candidate variables in each set varied, so readers should not consider a greater number of significant variables in a particular category as being indicative of that category’s importance relative to another. Suffice it to say that, in each domain we examined there were numerous significant indicators of completion.
Because our NELS analyses looked at predictors individually (controlling for confounding demographic variables, but not for other possible predictors), the NELS analyses should be considered exploratory in nature. After all, some predictors that are significant may not be significant in a model that controlled for other predictors. The case for a more in-depth analysis using NELS (or, even better, ELS) is strong. However, our initial analysis points to potential social indicators within each category of predictor variables that would be worth exploring further. A recommended list of potential indicators is presented in Table D, along with potential data sources.
Regarding psychosocial indicators, some of the largest effects were teacher ratings of student school engagement behaviors. One psychosocial indicator could be an educational engagement behavior index, made up of teacher ratings of how often a student does homework, how likely they are to go to college, how often they work hard, and how attentive they are in class. Other relatively large effects could be combined into a student belief index, made up of whether students believe it is okay to help others with schoolwork, plan to attend college, believe it is okay to solve problems using new ideas, believe it is okay to ask challenging questions, and believe in their academic ability (academic self concept).
Regarding family relationship indicators, the largest effects were tied to parental educational attainment expectations. Specifically, the effects for expecting a child to earn an MA or PhD or MD (as opposed to less than a high school diploma) were large. In retrospect, including parental educational attainment expectations as a continuous indicator would have made more sense, given the pattern and significance of the odds ratios. A parent educational expectations index is worth further investigation. Although numerous parent and family involvement in education predictors were significant, their effect sizes were very small or trivial.
With respect to high school experience, being married in the 12th grade has a medium-sized effect on completion, boosting the odds of non-completion by 218 percent. Although this is a substantial effect, just 2 percent of all students were married in 12th grade in the NELS cohort. Similarly, having children or expecting a child in 12th grade increased the odds of non-completion by 93 percent (a small but substantial effect), but just 3 percent of all students had children or were expecting in 12th grade. In comparison, 19 percent of 12th graders participated in zero hours of extracurricular activities per week, and 25 percent worked more than 21 hours per week. Both of these predictors were associated with a small but substantive decrease in odds of completion. We recommend that the percentage of 12th-

35
graders married or with child be investigated as a possible social indicator, along with the percentage of 12th-graders participating in extracurricular activities, and percentage of 12th
Several indicators of high school climate and characteristics are also promising: The percentage of students attending a high school where at least 75 percent of the last graduating class enrolled in a four-year college; the percentage of students who receive remedial math or reading in high school; and the percentage of students in college prep programs all have small but significant impacts on the odds of postsecondary completion. We recommend using the percentage of students attending a high school where at least 75 percent of the last graduating class enrolled in a four-year college as an indicator of college-going school climate.
-graders working more than 20 hours per week. Another possible indicator would be percentage of high school students who transferred schools.
Several indicators tied to postsecondary transition are also worthy of additional investigation. Applying to more schools, visiting schools with parents, applying for financial aid, and parents reading about or discussing financial aid with others to learn about it and parents reporting familiarity with loan programs have substantive relationships with completion. We recommend percentage of students applying to six or more schools and a financial aid activity index as possible social indicators.17
Regarding postsecondary experiences, the largest effect sizes (of medium magnitude) are found for ever taking time off of school and ever attending school part-time, which decrease the odds of completion; and being part of a volunteer group, and ever serving fellow students or community members, which increase the odds of completion. Five different types of participation in extracurricular activities had a small effect on postsecondary completion, as did having a child while enrolled. For indicators, we recommend the, percentage of students enrolled full-time, continuous enrollment, having a child while enrolled, and the overall level of participation in extracurricular activities, including social clubs.
Predicting postsecondary completion among postsecondary education attendees Predictors of postsecondary completion varied substantially across four-year, two-year, and less-than-two-year institutions. In fact, aside from postsecondary GPA, there were no predictors that were significantly related to completion across each institution type. Mostly, this reflected the finding that predictors for less-than-two-year institutions were different from those in two- or four-year institutions. There was, in fact, a substantial amount of concordance between predictors of college completion across two- and four-year institutions. Among the 16 statistically significant predictors of four-year completion and the 10 statistically significant predictors of completion at two-year institutions, eight overlapped—although the direction of the effect of number of transfers varied across the two types of institutions. Transferring from a two-year school is positively associated with completion, while transferring from a four-year school is negatively associated with completion (Figure 1).
In addition to predictors of postsecondary completion varying by institution type, predictors vary by subgroup. Some predictors appear to be more important for different student subgroups. We explored differences by race and ethnicity, and for traditional and non-traditional students.
Overall, for any completion at any institution, delaying enrollment seems to be more detrimental for white students compared to black students whereas receiving financial aid and having high expectations
17 Further analysis is required to determine if this is the most appropriate cut-point. An alternative would be to look at the average number of schools to which students apply.

36
related to degree attainment seems to be more important for black students compared to white students.
Parental education and size of the institution matter only for traditional students. Although important for all students, first year GPA has a larger influence on graduation for traditional students than non-traditional students. At the same time, taking remedial courses lowers the probability of graduation for traditional students, but not for non-traditional students. This has important implications for retention policies and course offerings.
Among students at four-year institutions, having high expectations is especially important for non-traditional students, and this is certainly a malleable mindset. First year GPA is more important for traditional students, so non-traditional students should not be discouraged in their first year, regardless of their performance.
For two-year completion, part-time status after the first year is detrimental for traditional students, but does not matter for non-traditional students, which is a good thing, since many of them are working. Additionally, working up to 20 hours a week is beneficial for white students only. However, working is not a significant predictor for black and Hispanic students, but a negative relationship is suggested (but not confirmed) by the data.
These findings have important implications, in that a one-size fits all approach to promoting postsecondary completion will not be as effective as one that targets the risk and promotive factors related to completion for each subgroup.
Figure 1. Predictors of postsecondary completion across four-year, two-year, and less-than-two-year institutions.
Note: Predictors with red text indicate the predictor is negatively related to postsecondary completion and predictors with white text indicate the predictor has a different relationship
Postsecondary GPA
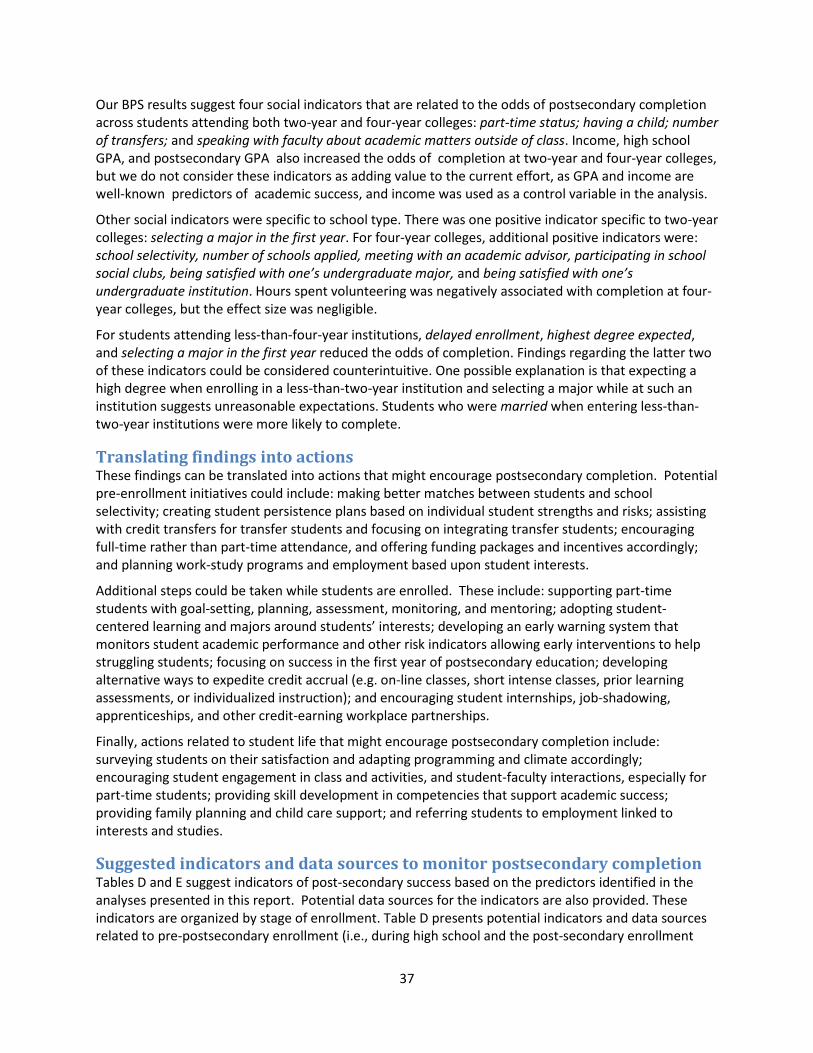
37
Our BPS results suggest four social indicators that are related to the odds of postsecondary completion across students attending both two-year and four-year colleges: part-time status; having a child; number of transfers; and speaking with faculty about academic matters outside of class. Income, high school GPA, and postsecondary GPA also increased the odds of completion at two-year and four-year colleges, but we do not consider these indicators as adding value to the current effort, as GPA and income are well-known predictors of academic success, and income was used as a control variable in the analysis.
Other social indicators were specific to school type. There was one positive indicator specific to two-year colleges: selecting a major in the first year. For four-year colleges, additional positive indicators were: school selectivity, number of schools applied, meeting with an academic advisor, participating in school social clubs, being satisfied with one’s undergraduate major, and being satisfied with one’s undergraduate institution. Hours spent volunteering was negatively associated with completion at four-year colleges, but the effect size was negligible.
For students attending less-than-four-year institutions, delayed enrollment, highest degree expected, and selecting a major in the first year reduced the odds of completion. Findings regarding the latter two of these indicators could be considered counterintuitive. One possible explanation is that expecting a high degree when enrolling in a less-than-two-year institution and selecting a major while at such an institution suggests unreasonable expectations. Students who were married when entering less-than-two-year institutions were more likely to complete.
Translating findings into actions These findings can be translated into actions that might encourage postsecondary completion. Potential pre-enrollment initiatives could include: making better matches between students and school selectivity; creating student persistence plans based on individual student strengths and risks; assisting with credit transfers for transfer students and focusing on integrating transfer students; encouraging full-time rather than part-time attendance, and offering funding packages and incentives accordingly; and planning work-study programs and employment based upon student interests.
Additional steps could be taken while students are enrolled. These include: supporting part-time students with goal-setting, planning, assessment, monitoring, and mentoring; adopting student-centered learning and majors around students’ interests; developing an early warning system that monitors student academic performance and other risk indicators allowing early interventions to help struggling students; focusing on success in the first year of postsecondary education; developing alternative ways to expedite credit accrual (e.g. on-line classes, short intense classes, prior learning assessments, or individualized instruction); and encouraging student internships, job-shadowing, apprenticeships, and other credit-earning workplace partnerships.
Finally, actions related to student life that might encourage postsecondary completion include: surveying students on their satisfaction and adapting programming and climate accordingly; encouraging student engagement in class and activities, and student-faculty interactions, especially for part-time students; providing skill development in competencies that support academic success; providing family planning and child care support; and referring students to employment linked to interests and studies.
Suggested indicators and data sources to monitor postsecondary completion Tables D and E suggest indicators of post-secondary success based on the predictors identified in the analyses presented in this report. Potential data sources for the indicators are also provided. These indicators are organized by stage of enrollment. Table D presents potential indicators and data sources related to pre-postsecondary enrollment (i.e., during high school and the post-secondary enrollment

38
process) and Table E presents post-enrollment indicators and data sources (i.e., while the student is enrolled).
Table D. Recommended pre-postsecondary enrollment indicators, definitions, and potential data sources. Indicator Ideal Definition Potential Source(s) (frequency)
Before postsecondary enrollment
1 Student belief index % of students who meet a threshold of believing in their own abilities in 8th
Monitoring the Future (annual)
grade
2 Parent educational expectations
% of students whose parents expect them to complete various levels of education (measured when the student is in 8th
NHES Parent and Family Involvement component (every 4 years)
grade)
3 Educational engagement behavior index
% of students who meet a threshold of educational engagement behaviors in 8th
Monitoring the Future (annual)
grade
4 Participation in extracurricular activities in high school
% of 12th Monitoring the Future (annual) graders who participate in any extracurricular activities
5 Working in high school % of students who work more than 20 hours per week in 12th
Monitoring the Future (annual)
grade
6 Early marriage and parenthood
% of 12th Monitoring the Future (annual) graders that are married, have a child, or have a child on the way
7 College-going school climate
% of 12th graders who attend a high school where at least 75% of the last graduating class enrolled in a four-year college
National Student Clearinghouse
8
Number of schools student applied to
% of students applying to six or more schools
National Association for College Admission Counseling’s State of College Admission Report (annual)
BPS (every 4 years)
9 Transferring % of students who transfer between high schools
State-level administrative data
10 Financial aid activity index % of students who apply for financial aid, parents
TBD

39
Indicator Ideal Definition Potential Source(s) (frequency)
Before postsecondary enrollment
familiarity with aid programs, and parent information seeking
11 School selectivity % of students who attend Very selective, moderately selective, minimally selective, and open admission institutions
IPEDS (annual) has institution-level selectivity and enrollment
BPS (every 4 years)
Table E. Recommended post-postsecondary enrollment indicators, definitions, and potential data sources.
Indicator Ideal Definition Potential Source(s) (frequency)
After postsecondary enrollment
1 Transferring % of students who transfer between postsecondary institutions, by level of first institution
IPEDS (annual) has information on school-level transfer-out rates
BPS (every 4 years)
2 Percentage of students enrolled full-time
% of students who attend postsecondary institutions full-time
IPEDS (annual)
CPS (annual school enrollment supplement) by race and gender
BPS (every 4 years)
3 Continuous enrollment % of students who attend discontinuously
BPS (every 4 years)
4 Having a child while
enrolled
% of students with a child BPS (every 4 years)
CPS (annual school enrollment supplement) by race and gender
ACS (annual)
5 Speaking with faculty outside of class about academics
% of students who report speaking with a faculty member about academics outside of class at varying frequencies
BPS (every 4 years)
National Survey of Student Engagement (annual) proxy by gender
6 Selecting a major in the
first year of enrollment
% of students who select a major within their first year of postsecondary enrollment
BPS (every 4 years)

40
Indicator Ideal Definition Potential Source(s) (frequency)
After postsecondary enrollment
7 Satisfaction with postsecondary institution
% of students who express satisfaction with their institution
Noel-Levitz National Satisfaction and Priorities Report (annual)
National Survey of Student Engagement (annual)
BPS (every 4 years)
8 Satisfaction with major % of students who express satisfaction with their major
BPS (every 4 years)
9 Meeting with academic advisor
% of students who meet with their academic advisor at varying frequencies
BPS (every 4 years)
10 Level of participation in extracurricular activities
% of students who report participating in various numbers of extracurricular activities and social clubs
BPS (every 4 years)
Limitations of the study There were a number of limitations. One limitation involves variables excluded from the analysis. For example, although we controlled for demographics including household income, we did not control for poverty, which takes into account household size, or receipt of particular government benefits, such as welfare or benefits from the Supplemental Nutrition Assistance Program. Furthermore, we did not include a variable that identified what degree a student was seeking. Based on the literature, we know that some students enrolled in four-year colleges, for example, are not pursuing a four-year degree, and we might expect that group to complete at a much lower rate than those who initially enter in pursuit of a degree. That said, omitted variable bias is a limitation in any non-experimental study, and there were numerous statistical controls in our model.
In both datasets, the measurement of some variables is somewhat crude and undiscriminating. For example, in the NELS dataset, several psychosocial, family relationships, high school academics, high school experience, transition, and postsecondary characteristics variables are measured using a simple “yes/no” scale. In the BPS dataset, a number of postsecondary post-enrollment variables are measured on a scale of “never”, “sometimes”, or “often,” which can have different meanings to different individuals. Thus, some of the measures may have lacked the sensitivity need to pick up on important or meaningful differences on levels of these variables.
Sample sizes in both datasets are large enough that attaining statistical significance is possible even for very small effect sizes; thus, it is important to consider not only statistical significant, but whether there is a meaningful relationship between the variables.
As stated above, the NELS dataset is older, and somewhat outdated. Recent policy-related changes at the local, state, and national level that affect postsecondary attainment could potentially impact results for students today, and those would not be captured in the current study.
Unlike the BPS analysis, the NELS analyses were more exploratory because not all of the variables were examined in the same model. Thus it is difficult to know which variables can explain more of the

41
variance in the outcome, and whether some variables may mediate the effect of others. Further analyses of NELS that are more targeted are needed to inform Lumina of best bets for indicators that will help meet Lumina’s postsecondary completion goals.
Future directions for research Having executed this study, we see several fruitful directions for future research. First, with additional resources, we could build a model using NELS or ELS data that includes numerous social indicators simultaneously, so that we can better understand the interplay of different indicators to further explore the relative strengths of the indicators in predicting postsecondary completion. Also, in addition to looking at whether or not a student completed any postsecondary education, we could investigate what predicts the individual’s highest level of postsecondary completion, as well as postsecondary enrollment. Although analyses on enrollment were conducted, the findings were considered secondary for this report, and although presented in Table 2, results for enrollment were not fleshed out in the text or compared with those for postsecondary completion.
The important findings for population subgroups from the BPS analyses suggest the value of conducting additional NELS analyses, or preferably ELS analyses now that the postsecondary completion data have been released for that cohort, that could focus on specific populations of interest, such as first-generation college students, males, Latino students, black students, or students living in poverty or with low incomes. Alternatively, models could focus on students enrolling in particular types of colleges.
Based on the presented analyses, we have recommended some potential indicators with preliminary data sources in Table D. Additional NELS or ELS analyses would help to further inform the value of these indicators for particular subgroups of students. While we made suggestions for data sources for each indicator, next steps would also include working with the suggested data source to develop the indicators, along with sub-group analyses by gender, race/ethnicity, income, and the like, and writing summary text describing the indicators’ importance and trends. Please see our databank for examples of how an indicator, fully fleshed out, might look: www.childtrends.org/databank. Furthermore, we could inform the foundation further on the periodicity and future plans for data collections, and the need for additional data source development in order to monitor recommended indicators over time.
Another potential direction for future research would involve a fine-grained educational pipeline analysis. In this case, we would examine what proportion of students meet key milestones on the path to college enrollment and completion. For example, before enrolling in a selective four-year college, a student must meet certain academic requirements, score at an appropriate level on college entrance exams, apply to schools, be accepted, and, typically, apply for financial aid. After identifying those spots where the most students fall off-track (leaks in the educational pipeline), we could run additional models using the same explanatory variables, but use as our outcome of interest whether or not a student successfully makes it past a particular leaky spot in the educational pipeline. This approach could provide us with a more detailed understanding of how social indicators are tied to students’ educational trajectories. Furthermore, this approach could help provide for the development of early warning indicators that could be used to identify—and craft interventions for—students who are falling off the college track.
Each of these future research directions would provide the Lumina Foundation with a more nuanced understanding of the indicators that are related to each category of postsecondary education, and a stronger basis upon which to choose indicators to monitor progress toward its goal of 60 percent of Americans completing a postsecondary degree or certificate by the year 2025.

42
References Adelman, C. (1999). Answers in the tool box: Academic intensity, attendance patterns, and bachelor's
degree attainment. Retrieved from http://www2.ed.gov/pubs/Toolbox/index.html. AFT Higher Education. (2003). Student persistence in college: More than counting caps and gowns: AFT
Higher Education. Albrecht, C. M., & Albrecht, D. E. (2010). Social status, adolescent behavior, and educational attainment.
Sociological Spectrum: Mid-South Sociological Association, 31(1), 114-137. Alfonso, M., Bailey, T. R., & Scott, M. (2005). The educational outcomes of occupational sub-
baccalaureate students: Evidence from the 1990s. Economics of Education Review, 24, 197-212. Allen, D. (1999). Desire to finish college: An empirical link between motivation and persistence. Research
in Higher Education, 40(4), 461-485. Alon, S. (2007). The influence of financial aid in leveling group differences in graduating from elite
institutions. Economics of Education Review, 26, 296-311. Alon, S., Domina, T., & Tienda, M. (2010). Stymied mobility or temporary lull? The puzzle of lagging
Hispanic college degree attainment. Social Forces, 88, 1807-1832. Alon, S., & Gelbgiser, D. (2011). The female advantage in college academic achievements and horizontal
sex segregation. Social Science Research, 40, 107-119. Asmussen, J. G. (2011). How might governors improve college graduation rates? Paper presented at the
Annual Meeting of the American Educational Research Association. Attewell, P., Lavin, D., Domina, T., & Levey, T. (2006). New evidence on college remediation. The Journal
of Higher Education, 77(5), 886-924. Aud, S., Hussar, W., Johnson, F., Kena, G., Roth, E., Manning, E., et al. (2012). The condition of education
2012. Washington, DC: U.S. Department of Education, National Center for Education Statistics. Bell, J. D., & Bautsch, B. (2011). Improving Latino college completion: What state legislators should
know. Washington, D. C.: National Conference of State Legislatures. Berkner, L., Horn, L., Clune, M., & Carroll, C. D. (2000). Descriptive summary of 1995-96 Beginning
Postsecondary Students: Three years later. Retrieved. from. Boardman, J. D., Alexander, K. B., Miech, R. A., MacMillan, R., & Shanahan, M. J. (2012). The association
between parent's health and the educational attainment of their children. Social Science & Medicine, 75, 932-939.
Bound, J. L., Michael, & Turner, S. (2007). Understanding the decrease in college completion rates and the increased time to the baccalaureate degree (No. 07-626): Population Studies Center: University of Michigan Institute for Social Research.
Bradley, P. A., & Blanco, C. (2010). Promoting a culture of student success: How colleges and universities are improving degree completion: Southern Regional Education Board.
Brand, J. E., Pfeffer, F. T., & Goldrick-Rab, S. (2012). Interpreting community college effects in the presence of heterogeneity and complex counterfactuals. Unpublished Working Paper. WISCAPE.
Brown, A. R., Morning, C., & Watkins, C. (2005). Influence of African American engineering student perceptions of campus climate on graduation rates. Journal of Engineering Education, 263-271.
Brunn, R., & Kao, G. (2008). Where are all the boys? Examining the black-white gender gap in postsecondary attainment. Du Bois Review, 5(1), 137-160.
Buchmann, C., & DiPrete, T. A. (2006). The growing female advantage in college completion: The role of family background and academic achievement. American Sociological Review, 71(4), 515-541.
Byun, S.-y., Meece, J. L., & Irvin, M. J. (2012). Rural-nonrural disparities in postsecondary educational attainment revisited. American Educational Research Journal, 49, 412-437.
Cabrera, A. F., Nora, A., Terenzini, P. T., Pascarella, E., & Hagedorn, L. S. (1999). Campus racial climate and the adjustment of students to college: A comparison between white students and African American students. The Journal of Higher Education, 70(2), 134-160.

43
Calcago, J. C., Bailey, T. R., Jenkins, D., Kienzl, G., & Leinbach, T. (2008). Community college student success: What institutional characteristics make a difference. Economics of Education Review, 27, 632-645.
Carnevale, A. P., Jayasundera, T., & Hanson, A. R. (2012). Career and technical education: Five ways that pay. Washington, D. C.: Georgetown University Center on Education and the Workforce.
Carter, C. (2007). Top 10 reasons students struggle and drop out freshman year- and what you can do about it. Recruitment & Retention, July 2007.
Chinn, S. (2000). A simple method for converting an odds ratio to effect size for use in meta-analysis. Statistics in Medicine, 19, 3127-3131.
Choy, S. (2002). Nontraditional undergraduates. Washington, D. C.: National Center for Education Statistics, U. S. Department of Education, Office of Educational Research and Improvement.
Clogg, C. Petkova, E. & Haritou. A. (1995). Statistical Methods for Comparing Regression Coefficients between Models. American Journal of Sociology, 100(5), 1261-1293.
Complete College America. (2011). Time is the enemy. Washington, D. C.: Complete College America. Conger, D., & Long, M. C. (2010). Why are men falling behind? Gender gaps in college performance and
persistance. The Annals of the American Academy of Political and Social Science, 627(1), 184-214.
DeAngelo, L., Franke, R., Hurtado, S., Pryor, J. H., & Tran, S. (2011). Completing college: Assessing graduation rates at four-year institutions. Los Angeles, CA: Higher Education Research Institute, UCLA.
Desimone, L. (1999). Linking parent involvement with student achievement: Do race and income matter? The Journal of Education Research, 93(1), 11-30.
Dorans, N. J. (1999). Correspondences between ACT™ and SAT® I scores. Dougherty, C., Mellor, L., & Jian, S. (2006). The relationship between advanced placement and college
graduation (No. 1): National Center for Educational Accountability. Doyle, W. R. (2010). The effect of community college enrollment on bachelor's degree completion
Economics of Education Review, 28, 199-206. Dwyer, R. E., McCloud, L., & Hodson, R. (2012). Debt and graduation from American universities. Social
Forces, 90(4), 1133-1155. Eccles, J. S., Barber, B. L., Stone, M. R., & Hunt, J. (2003). Extracurricular activities and adolescent
development. Journal of Social Issues, 59(4), 865-889. Eide, E. R., & Ronan, N. (2001). Is participation in high school athletics an investment or a consumption
good? Evidence from high school and beyond. Economics of Education Review, 20, 431-442. Eimers, M. T., & Pike, G. R. (1997). Minority and nonminority adjustment to college: Differences or
similarities? Research in Higher Education, 38(1), 77-97. Feliciano, C., & Ashtiani, M. (2012). How low-income origins affect postsecondary entry and degree
completion. International Journal of Sociology of Education, 1(2), 123-156. Foley, E., Mishook, J., & Lee, J. (2013). Developing college readiness within and across school districts:
The Federal role. Voices in Urban Education, 36, 7-17. Fry, R., & Lopez, M. H. (2012). Hispanic Student enrollments reach new highs in 2011. Washington, D. C.:
Pew Research Center, Pew Hispanic Center. Ganderton, P. T., & Santos, R. (1995). Hispanic college attendance and completion: Evidence from the
High School and Beyond surveys. Economics of Education Review, 14(1), 35-46. Ganzach, Y. (2000). Parents' education, cognitive ability, educational expectations and educational
attainment: Interactive effects. British Journal of Educational Psychology, 70, 419-441. Gloria, A., Castellanos, J., Lopez, A., & Rosales, R. (2005). An examination of academic nonpersistence
decisions of Latino undergraduates. Hispanic Journal of Behavioral Sciences, 27(2), 202-223.

44
Goldin, C., Katz, L. F., & Kuziemko, I. (2006). The homecoming of American college women: The reversal of the college gender gap. Unpublished working paper. National Bureau of Economic Research.
Goldsmith, P. R. (2009). Schools or neighborhoods or both? Race and ethnic segregation and educational attainment. Social Forces, 87(4), 1913-1941.
Haggerty, C., Dugoni, B., Reed, L., Cederlund, A., & Taylor, J. (1996). National Education Longitudinal Study: 1988-1994 Methodology Report (NCES 96-174). National Center for Education Statistics, Institute of Education Sciences, U.S. Department of Education. Washington, DC. Retrieved June 20, 2013, from http://nces.ed.gov/pubs/96174.pdf
Harper, S. R., & Harris, F. I. (2012). Men of color: A role for policymakers in improving the status of black male students in U.S. higher education: Institute for Higher Education Policy, The Pathways to College Network, The Center for the Study of Race and Equity in Education.
Hauser, R. M. (1972). Disaggregating a social-psychological model of educational attainment. Social Science Research, 1, 159-188.
Hofferth, S. L., Reid, L., & Mott, F. L. (2001). The effects of early childbearing on schooling over time. Family Planning Perspectives, 33(6), 259-267.
Horn, L., & Weko, T. (2009). On track to complete: A taxonomy of beginning community college students and their outcomes 3 years after enrolling: 2003-04 through 2006 (No. 2009-152). Washington, D. C.: National Center of Education Statistics, U. S. Department of Education.
Horn, L., Xiaojie, L., & Weko, T. (2009). Changes in postsecondary awards below the bachelor's degree: 1997 to 2007. Washington, DC: U.S. Department of Education, Institute of Education Sciences, National Center for Education Statistics.
Hu, S., & St. John, E. P. (2001). Student persistence in public higher education system: Understanding racial and ethnic differences. The Journal of Higher Education, 72(3), 265-286.
Ingels, S. J., Curtin, T. R., Kaufman, P., Alt, M. N., & Chen, X. (2002). Coming of age in the 1990s: The eighth grade class of 1988 12 years later: National Center for Education Statistics, U. S. Department of Education, Office of Educational Research and Improvement.
Jacoby, D. (2006). Effects of part-time faculty employment on community college graduation rates. The Journal of Higher Education, 77(6), 1081-1103.
Jensen, U. (2011). Factors Influencing Student Retention in Higher Education. Summary of Influential Factors in Degree Attainment and Persistence to Career or Further Education for At-Risk/High Educational Need Students. Honolulu, HI: Pacific Policy Research Center. Kamehameha Schools–Research & Evaluation Division.
Jepsen, C. (2008). Multinomial probit estimates of college completion at 2-year and 4-year schools. Economics Letters, 98, 155-160.
Kalogrides, D., & Grodsky, E. (2011). Something to fall back on: Community colleges as safety net. Social Forces, 89(3), 853-877.
Knapp, L. G., Kelly-Reid, J. E., & Ginder, S. A. (2012). Enrollment in postsecondary institutions, Fall 2011; Financial statistics, Fiscal year 2011; and graduation rates, selected cohorts, 2003-2008: First look (provisional data). Washington, DC: National Center for Educational Statistics.
Kulkarni, S. (2010). Academic aspiration and postsecondary attainment: Evidence from the National Educational Longitudinal Study of 1988 (NELS:88).
Lai, M. S., & Orsuwan, M. (2008). Examining longer-term teacher effects on Asian American student achievement: A national study. Asian American Policy Review, 27-41.
Lee, Daniels, M. H., Puig, A., Newgent, R. A., & Nam, S. K. (2008). A data-based model to predict postsecondary educational attainment of low-socioeconomic-status students. Professional School Counseling, 11(5).
Lee, J. (2012). College for all: Gaps between desirable and actual P-12 math achievement trajectories for college readiness. Educational Research, 41, 43-55.

45
Lichtenberger, E. J., & Dietrich, C. (2012). College readiness and the postsecondary outcomes of Illinois high school students (No. IERC 2012-1): Illinois Education Research Council.
Light, A., & Strayer, W. (2000). Determinants of college completion: School quality or student ability? The Journal of Human Resources, 35(2), 299-332.
Liu, M. C. (2012). Ensuring Latino success in college and the workforce. Washington D. C. and Denver, CO: National Conference of State Legislators.
Lleras, C. (2008). Do skills and behaviors in high school matter? The contribution of noncognitive factors in explaining differences in educational attainment and earnings. Social Science Research, 37, 888-902.
Lohfink, M. M., & Paulsen, M. B. (2005). Comparing the determinants of persistence for first-generation and continuing-generation students. Journal of College Student Development, 46(4), 409-428.
Long, M. C., Conger, D., & Latarola, P. (2012). Effects of high school course-taking on secondary and postsecondary success. American Educational Research Journal, 49(2), 285-322.
Lozano, F. A. (2008). Language, high school leadership and the postsecondary outcomes of Hispanic students. Economics of Education Review, 27, 342-353.
Lumina Foundation. (2013). Strategic Plan 2013 to 2016: Lumina Foundation. Mood, C. (2010). Logistic regression: Why we cannot do what we think we can do, and what we can do
about it. European Sociological Review, 26(1), 67-82. Nagaoka, J., Roderick, M., & Coca, V. (2009). Barriers to college attainment: Lessons from Chicago:
Center for American Progress. National Center for Education Statistics. (2012). An overview of classes taken and credits earned by
beginning postsecondary students. Washington, D. C.: National Center for Education Statistics, U. S. Department of Education.
Pfeffer, F. T., & Goldrick-Rab, S. (2011). Unequal pathways through American universities. Institute for Research on Poverty.
Prince, H., & Choitz, V. (2012). The credential differential: The public return to increasing postsecondary credential attainment. Washington, DC: CLASP.
Reisel, L. (2011). Two paths to inequality in educational outcomes: Family background and educational selection in the United States and Norway. Sociology of Education, 84(4), 261-280.
Rivkin, S. G. (2000). School desegregation, academic attainment, and earnings. The Journal of Human Resources, 32(2), 333-346.
Robbins, S. B., Lauver, K., Le, H., Davis, D., Langley, R., & Carlstrom, A. (2004). Do psychosocial and study skill factors predict college outcomes? A meta-analysis. Psychological Bulletin, 130(2), 261-288.
Roksa, J. (2006). Does the vocational focus of community college hinder students' educational attainment? The Review of Higher Education, 29(4), 499-526.
Roksa, J., & Velez, M. (2012). A late start: Delayed entry, life course transitions and bachelor's degree completion. Social Forces, 90(3), 769-794.
Ross, T., Kena, G., Rathbun, A., KewalRamani, A., Zhang, J., Kristapovich, P., et al. (2012). Higher Education: Gaps in Access and Persistence Study. Washington, DC: : Government Printing Office.
Rumberger, R. W. (2010). Education and the reproduction of economic inequality in the United States: An empirical investigation. Economics of Education Review, 29, 246-254.
Sandefur, G. D., & Wells, T. (1999). Does family structure really influence educational attainment? Social Science Research, 28(4), 331-357.
Sandy, J., Gonzalez, A., & Hilmer, M. J. (2006). Alternative paths to college completion: Effect of attending a 2-year school on the probability of completing a 4-year degree. Economics of Education Review, 25, 463-471.
Santiago, D., & Callan, P. (2010). Ensuring America's future: Benchmarking Latino college completion to meet national goals: 2010 to 2020: Excellence in Education.

46
Schreiner, L. A. (2009). Linking student satisfaction and retention. Coralville, IA: Noel-Levitz. Small, M. L., & Winship, C. (2007). Black students' graduation from elite colleges: Institutional
characteristics and between-institution differences. Social Science Research, 36(3), 1257-1275. Snyder, T. D., & Dillow, S. A. (2012). Digest of education statistics 2011 (No. NCES 2012-001). National
Center for Education Statistics, Institute of Education Sciences, U.S. Department of Education: Washington, DC.
Staklis, S., & Horn, L. (2012). New Americans in postsecondary education: A profile of immigrant and second-generation American undergraduates. Washington, D. C.: National Center for Education Statistics, U.S. Department of Education.
Stephan, J. L., Rosenbaum, J. E., & Person, A. E. (2009). Stratification in college entry and completion. Social Science Research, 38, 572-593.
Taniguchi, H., & Kaufman, G. (2005). Degree completion among nontraditional students. Social Science Quarterly, 86(4), 912-927.
Torres, V. (2006). A mixed method study testing data-model fit of a retention model for Latino/a students at urban universities. Journal of College Student Development, 74(3), 299-318.
U.S. Department of Education. (2011). Six-year attainment, persistence, transfer, retention, and withdrawal rates of students who began postsecondary education in 2003-04. Washington, DC: National Center for Education Statistics.
United States Census Bureau. (2012). Educational Attainment in the United States: 2012-Detailed Tables. 2013, from http://www.census.gov/hhes/socdemo/education/data/cps/2012/tables.html
United States General Accounting Office. (2003). College completion: Additional efforts could help education with its completion goals. Retrieved from www.gao.gov/cgi-bin/getrpt?GAO-03-568.
US Department of Education. (2013). Safe Supportive Learning: Topics and Research. Retrieved June 20, 2013, from http://safesupportiveschools.ed.gov/index.php?id=33
Venezia, A., Kirst, M. W., & Antonio, A. L. (2003). Betraying the college dream: How disconnected k-12 and postsecondary education systems undermine student aspirations. Stanford, CA: The Stanford Institute for Higher Education Research.
Ver Ploeg, M. (2002). Children from disrupted families as adults: Family structure, college attendance and college completion. Economics of Education Review, 21, 171-184.
Wine, J., Janson, N., & Wheeless, S. (2011). 2004/09 Beginning Postsecondary Students Longitudinal Study (BPS: 04/09) Full-scale Methodology Report (NCES 2012-246). National Center for Education Statistics, Institute of Education Sciences, U.S. Department of Education. Washington, DC. Retrieved June 20, 2013, from http://nces.ed.gov/pubs2012/2012246.pdf
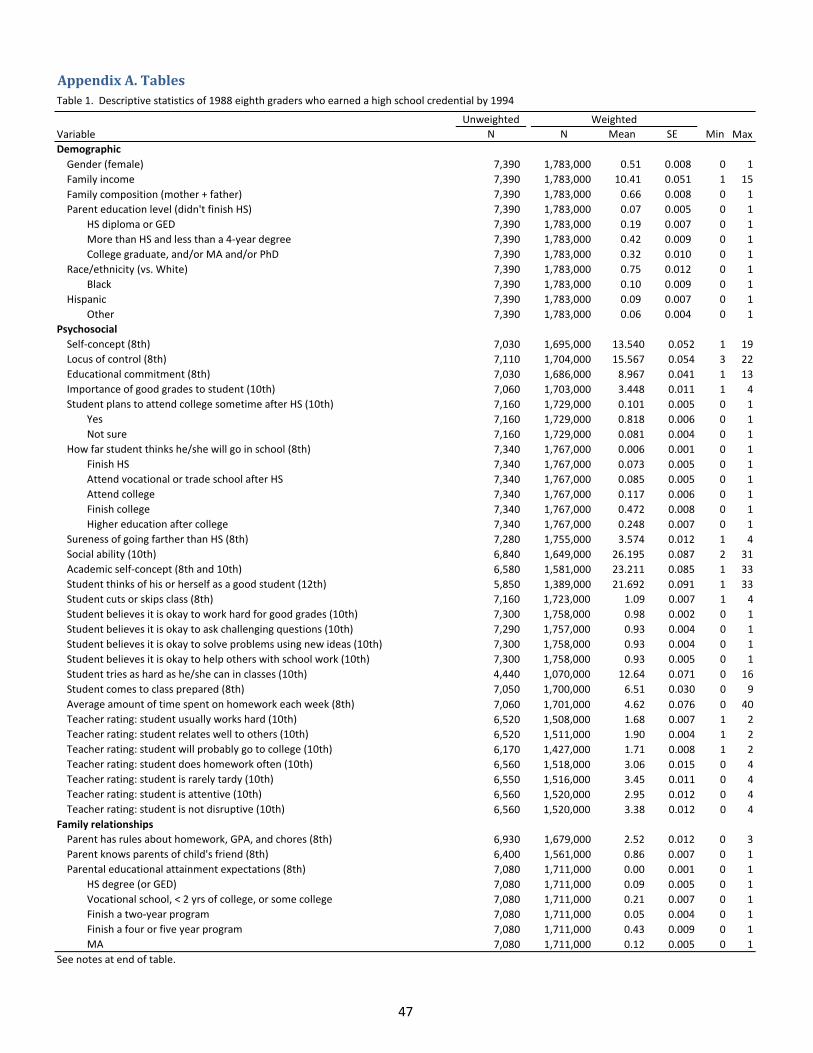
UnweightedVariable N N Mean SE Min MaxDemographic
Gender (female) 7,390 1,783,000 0.51 0.008 0 1Family income 7,390 1,783,000 10.41 0.051 1 15Family composition (mother + father) 7,390 1,783,000 0.66 0.008 0 1Parent education level (didn't finish HS) 7,390 1,783,000 0.07 0.005 0 1
HS diploma or GED 7,390 1,783,000 0.19 0.007 0 1More than HS and less than a 4-year degree 7,390 1,783,000 0.42 0.009 0 1College graduate, and/or MA and/or PhD 7,390 1,783,000 0.32 0.010 0 1
Race/ethnicity (vs. White) 7,390 1,783,000 0.75 0.012 0 1Black 7,390 1,783,000 0.10 0.009 0 1
Hispanic 7,390 1,783,000 0.09 0.007 0 1Other 7,390 1,783,000 0.06 0.004 0 1
PsychosocialSelf-concept (8th) 7,030 1,695,000 13.540 0.052 1 19Locus of control (8th) 7,110 1,704,000 15.567 0.054 3 22Educational commitment (8th) 7,030 1,686,000 8.967 0.041 1 13Importance of good grades to student (10th) 7,060 1,703,000 3.448 0.011 1 4Student plans to attend college sometime after HS (10th) 7,160 1,729,000 0.101 0.005 0 1
Yes 7,160 1,729,000 0.818 0.006 0 1Not sure 7,160 1,729,000 0.081 0.004 0 1
How far student thinks he/she will go in school (8th) 7,340 1,767,000 0.006 0.001 0 1Finish HS 7,340 1,767,000 0.073 0.005 0 1Attend vocational or trade school after HS 7,340 1,767,000 0.085 0.005 0 1Attend college 7,340 1,767,000 0.117 0.006 0 1Finish college 7,340 1,767,000 0.472 0.008 0 1Higher education after college 7,340 1,767,000 0.248 0.007 0 1
Sureness of going farther than HS (8th) 7,280 1,755,000 3.574 0.012 1 4Social ability (10th) 6,840 1,649,000 26.195 0.087 2 31Academic self-concept (8th and 10th) 6,580 1,581,000 23.211 0.085 1 33Student thinks of his or herself as a good student (12th) 5,850 1,389,000 21.692 0.091 1 33Student cuts or skips class (8th) 7,160 1,723,000 1.09 0.007 1 4Student believes it is okay to work hard for good grades (10th) 7,300 1,758,000 0.98 0.002 0 1Student believes it is okay to ask challenging questions (10th) 7,290 1,757,000 0.93 0.004 0 1Student believes it is okay to solve problems using new ideas (10th) 7,300 1,758,000 0.93 0.004 0 1Student believes it is okay to help others with school work (10th) 7,300 1,758,000 0.93 0.005 0 1Student tries as hard as he/she can in classes (10th) 4,440 1,070,000 12.64 0.071 0 16Student comes to class prepared (8th) 7,050 1,700,000 6.51 0.030 0 9Average amount of time spent on homework each week (8th) 7,060 1,701,000 4.62 0.076 0 40Teacher rating: student usually works hard (10th) 6,520 1,508,000 1.68 0.007 1 2Teacher rating: student relates well to others (10th) 6,520 1,511,000 1.90 0.004 1 2Teacher rating: student will probably go to college (10th) 6,170 1,427,000 1.71 0.008 1 2Teacher rating: student does homework often (10th) 6,560 1,518,000 3.06 0.015 0 4Teacher rating: student is rarely tardy (10th) 6,550 1,516,000 3.45 0.011 0 4Teacher rating: student is attentive (10th) 6,560 1,520,000 2.95 0.012 0 4Teacher rating: student is not disruptive (10th) 6,560 1,520,000 3.38 0.012 0 4
Family relationshipsParent has rules about homework, GPA, and chores (8th) 6,930 1,679,000 2.52 0.012 0 3Parent knows parents of child's friend (8th) 6,400 1,561,000 0.86 0.007 0 1Parental educational attainment expectations (8th) 7,080 1,711,000 0.00 0.001 0 1
HS degree (or GED) 7,080 1,711,000 0.09 0.005 0 1Vocational school, < 2 yrs of college, or some college 7,080 1,711,000 0.21 0.007 0 1Finish a two-year program 7,080 1,711,000 0.05 0.004 0 1Finish a four or five year program 7,080 1,711,000 0.43 0.009 0 1MA 7,080 1,711,000 0.12 0.005 0 1
Appendix A. TablesTable 1. Descriptive statistics of 1988 eighth graders who earned a high school credential by 1994
Weighted
See notes at end of table.
47

UnweightedVariable N N Mean SE Min Max
PhD, MD 7,080 1,711,000 0.10 0.005 0 1Parent has discussions with child about HS (8th) 6,990 1,690,000 5.17 0.016 0 6Parent talks to child often about post-HS plans (8th) 7,100 1,716,000 3.24 0.012 1 4Parent volunteers and fundraises for school (8th) 6,690 1,617,000 0.44 0.013 0 2Parent is involved in parent teacher organization (8th) 6,870 1,666,000 0.65 0.018 0 2Parent attends parent-teacher organization meetings (8th) 6,920 1,677,000 0.37 0.010 0 1Student perception about rules about TV, friends, and chores (8th) 7,310 1,757,000 5.84 0.030 0 9Student reports parent checks his/her homework (8th) 7,350 1,768,000 2.09 0.016 0 3Parent contacts school about academics (8th) 6,910 1,669,000 1.31 0.026 0 6Student has discussions with parents about school (8th) 7,200 1,735,000 5.75 0.035 0 8Student talks to father about planning for HS program (8th) 7,230 1,744,000 1.10 0.013 0 2
High school academicsGPA (10th) 5,750 1,369,000 5.93 0.027 1 8ACT/SAT score (12th) 4,350 1,012,000 94.43 0.500 42 152Ever took remedial courses in math or English in high school (12th) 6,960 1,655,000 0.23 0.008 0 1Ever took AP course (12th) 6,970 1,657,000 0.40 0.009 0 1High school program¹ (vs. to rig academic) (12th) 6,260 1,471,000 0.27 0.010 0 1
Academic 6,260 1,471,000 0.58 0.011 0 1Vocational 6,260 1,471,000 0.06 0.004 0 1Vocational + rigorous academic 6,260 1,471,000 0.01 0.001 0 1Vocational + academic 6,260 1,471,000 0.08 0.005 0 1
High school experiencePositive peer academic influence (10th) 6,930 1,677,000 8.59 0.039 1 11Change in family situation (i.e. parent divorce, death in family) (10th) 7,190 1,723,000 0.37 0.011 0 10Hours worked per week during school year (vs. 0 hours/week) (12th ) 5,840 1,400,000 0.19 0.007 0 1
20 or less 5,840 1,400,000 0.56 0.009 0 121 or more 5,840 1,400,000 0.25 0.008 0 1
Having been in any disciplinary trouble (10th grade) 7,290 1,751,000 0.43 0.008 0 1Having been in any disciplinary trouble (12th grade) 7,080 1,684,000 0.35 0.008 0 1Married in 12th grade 6,550 1,558,000 0.02 0.002 0 1Have children or expecting in 12th grade 7,100 1,693,000 0.03 0.003 0 1Transferred schools (12th) 6,340 1,526,000 0.14 0.008 0 1Used a drug within last 30 days (10th) 6,120 1,480,000 0.40 0.009 0 1Time (hrs per week) spent on extracurricular activities (10th) 7,220 1,741,000 0.19 0.007 0 1
More than zero, but less than four 7,220 1,741,000 0.56 0.009 0 1Five or more 7,220 1,741,000 0.25 0.008 0 1
Time (hrs per week) spent on extracurricular activities (12th) 7,040 1,676,000 0.34 0.009 0 1More than zero, but less than four 7,040 1,676,000 0.38 0.008 0 1Five or more 7,040 1,676,000 0.28 0.008 0 1
Student has experienced disciplinary issues (10th grade) 7,290 1,751,000 0.76 0.020 0 16Student has experienced disciplinary issues (12th grade) 7,080 1,684,000 0.66 0.023 0 20Student has been arrested (12th) 7,090 1,687,000 0.03 0.004 0 1
Student perception of high school climateSchool engagement (10th) 7,110 1,708,000 14.08 0.058 1 22School environment (10th) 7,070 1,702,000 10.65 0.046 1 19School safety (10th) 7,170 1,722,000 5.39 0.020 1 7
High school characteristicsSchool level college encouragement and staff help (12th) 6,440 1,509,000 14.14 0.083 1 16Overall parent involvement (12th) 5,290 1,239,000 9.38 0.227 1 29Percent college help programs are used at school (12th) 5,100 1,207,000 12.13 0.177 1 21
Table 1. Descriptive statistics of 1988 eighth graders who earned a high school credential by 1994—Continued
Weighted
See notes at end of table.
48

UnweightedVariable N N Mean SE Min Max
Percent of 1990-91 graduates in a 2-year college (12th) 6,300 1,475,000 0.02 0.004 0 11-10% 6,300 1,475,000 0.28 0.018 0 111-24% 6,300 1,475,000 0.39 0.020 0 125-49% 6,300 1,475,000 0.27 0.018 0 150-74% 6,300 1,475,000 0.04 0.008 0 175-100% 6,300 1,475,000 0.00 0.002 0 1
Percent of 1990-91 graduates in a four-year college (12th) 6,420 1,495,000 0.00 0.002 0 11-10% 6,420 1,495,000 0.05 0.007 0 111-24% 6,420 1,495,000 0.17 0.014 0 125-49% 6,420 1,495,000 0.41 0.019 0 150-74% 6,420 1,495,000 0.25 0.018 0 175-100% 6,420 1,495,000 0.11 0.011 0 1
Percent of 1990-91 graduates in a vocational/tech school (12th) 6,150 1,441,000 0.09 0.010 0 11-10% 6,150 1,441,000 0.68 0.018 0 111-24% 6,150 1,441,000 0.19 0.015 0 125-74% 6,150 1,441,000 0.04 0.009 0 1
12th grade enrollment (vs. 1-99 students in 12th grade class) 7,050 1,670,000 0.18 0.014 0 1100-199 7,050 1,670,000 0.24 0.016 0 1200-299 7,050 1,670,000 0.23 0.016 0 1300-399 7,050 1,670,000 0.15 0.013 0 1400+ 7,050 1,670,000 0.21 0.015 0 1
School classification (vs. public schools) (12th) 7,270 1,744,000 1.09 0.007 0 1Percent of students in single parent homes (12th) 6,520 1,531,000 0.10 0.011 0 1
11-24% 6,520 1,531,000 0.37 0.019 0 125-49% 6,520 1,531,000 0.44 0.019 0 150-74% 6,520 1,531,000 0.09 0.011 0 175-100% 6,520 1,531,000 0.005 0.002 0 1
Percent 12th grade language minority students 6,950 1,638,000 0.44 0.018 0 1Less than 10% 6,950 1,638,000 0.46 0.019 0 110-49% 6,950 1,638,000 0.09 0.009 0 1
Percent Asian/pacific Islander 12th graders 6,910 1,634,000 3.18 0.221 0 91Percent Hispanic 12th graders 6,910 1,635,000 8.19 0.650 0 100Percent Black (non-Hispanic) 12th graders 6,910 1,635,000 12.05 0.834 0 100Percent White (non-Hispanic) 12th graders 6,910 1,633,000 74.79 1.109 0 100Percent American Indian or Alaskan 12th graders 6,910 1,634,000 1.20 0.270 0 98Percent of students who receive FRPM (12th) 6,850 1,623,000 20.20 0.732 0 100Average 12th grade attendance rate 6,560 1,558,000 92.74 0.201 40 100Number of 12th grade students in AP courses 6,640 1,569,000 20.08 0.696 0 100Percent 12th graders dropout before graduation 6,790 1,600,000 3.58 0.157 0 50Percent of 12th grade students in college prep programs 6,460 1,523,000 48.78 0.984 0 100Percent of students that receive remedial reading (12th) 6,890 1,628,000 7.39 0.358 0 100Percent of students that receive remedial math (12th) 6,880 1,626,000 7.70 0.342 0 75
TransitionParent involved in providing teen with information about college (12th) 5,620 1,330,000 2.43 0.018 0 3Number of schools student applied to (12th) 6,930 1,646,000 0.32 0.009 0 1
One 6,930 1,646,000 0.26 0.007 0 1Two-four 6,930 1,646,000 0.33 0.008 0 1Five or more 6,930 1,646,000 0.09 0.006 0 1
Number of schools parent visited with teen (12th) 5,640 1,338,000 0.29 0.009 0 1One 5,640 1,338,000 0.21 0.008 0 1Two 5,640 1,338,000 0.21 0.007 0 1Three-four 5,640 1,338,000 0.21 0.008 0 1Five or more 5,640 1,338,000 0.08 0.005 0 1
Table 1. Descriptive statistics of 1988 eighth graders who earned a high school credential by 1994—Continued
Weighted
See notes at end of table.
49

UnweightedVariable N N Mean SE Min Max
Parent talked to teen about applying for college (12th) 7,370 1,778,000 2.72 0.010 0 3Parent is financially prepared for teen's college (12th) 6,810 1,636,000 2.98 0.036 0 10Parents took steps to learn about financial aid (12th) 4,940 1,197,000 3.61 0.032 0 7Parent is familiar with loan programs (12th) 6,770 1,627,000 2.20 0.028 0 4
Parents read about or discussed financial aid with others to learn about it (12th) 6,920 1,662,000 0.75 0.008 0 1Parent says teen has applied for financial aid (12th) 6,890 1,652,000 0.48 0.008 0 1
Postsecondary CharacteristicsLevel of enrollment (<2 year school) 5,390 1,265,000 0.01 0.002 0 1
2-3 year school 5,390 1,265,000 0.35 0.011 0 14 year school 5,390 1,265,000 0.63 0.011 0 1
Took a remedial math or English class 4,790 1,117,000 0.23 0.008 0 1Ever had a child while enrolled 6,360 1,525,000 0.12 0.005 0 1Ever married while enrolled 7,390 1,783,000 0.36 0.008 0 1Ever took time off 6,350 1,520,000 0.25 0.008 0 1Ever went part-time 6,350 1,520,000 0.37 0.009 0 1Ever changed majors 6,350 1,519,000 0.32 0.008 0 1Ever transferred credits 3,260 769,000 0.66 0.012 0 1Participated in varsity athletics 4,800 1,120,000 0.87 0.006 0 1Participated in non-varsity intercollegiate athletics 4,800 1,120,000 0.93 0.004 0 1Participated in intramural athletics 4,800 1,120,000 0.67 0.009 0 1Participated in performing arts 4,800 1,119,000 0.87 0.006 0 1Participated in college newspaper or radio station 4,800 1,119,000 0.94 0.005 0 1Participated in student government or political groups 4,800 1,119,000 0.88 0.006 0 1Participated in social clubs, fraternities/sororities 4,800 1,119,000 0.74 0.008 0 1Volunteer service to fellow students 4,800 1,119,000 0.78 0.008 0 1Volunteer services to community groups 4,800 1,119,000 0.69 0.009 0 1Received formal tutoring 4,690 1,096,000 0.26 0.008 0 1Received special instruction in English or math 4,530 1,056,000 0.20 0.008 0 1Level of participation in extracurricular activities 5,750 1,366,000 5.29 0.021 1 7Postsecondary GPA 7,350 1,774,000 0.99 0.017 0 4Occurrence of significant life event 4,800 1,118,000 1.63 0.034 0 9Hours/week volunteering 2,970 706,000 5.71 0.203 0 100Total amount borrowed for education 1,880 444,000 4.21 0.151 0 52
Outcome variablesAny post-secondary enrollment 7,390 1,783,000 0.86 0.007 0 1Any post-secondary completion 6,300 1,509,000 0.63 0.009 0 1
SOURCE: 1988/2000 National Education Longitudinal Study (NELS) Restricted Use Data Files, National Center for Education Statistics, Institute of Education Sciences, U.S. Department of Education.
Table 1. Descriptive statistics of 1988 eighth graders who earned a high school credential by 1994—Continued
Weighted
50
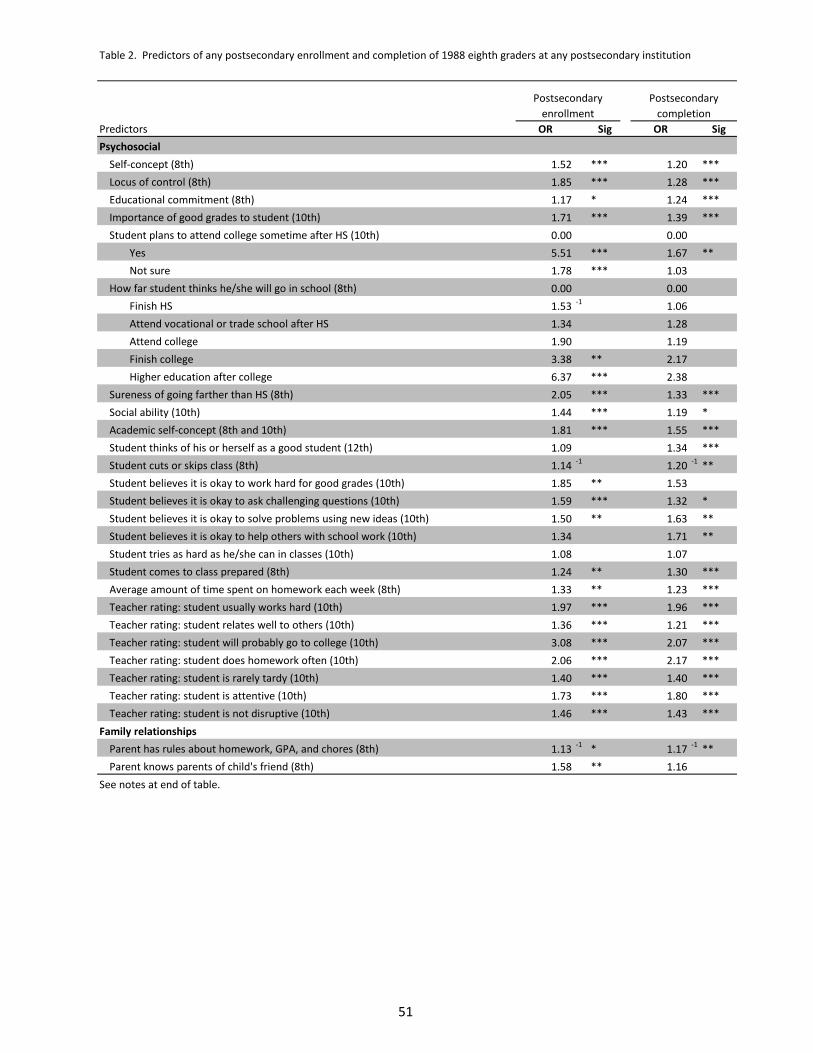
Predictors OR Sig OR SigPsychosocial
Self-concept (8th) 1.52 *** 1.20 ***Locus of control (8th) 1.85 *** 1.28 ***Educational commitment (8th) 1.17 * 1.24 ***Importance of good grades to student (10th) 1.71 *** 1.39 ***Student plans to attend college sometime after HS (10th) 0.00 0.00
Yes 5.51 *** 1.67 **Not sure 1.78 *** 1.03
How far student thinks he/she will go in school (8th) 0.00 0.00Finish HS 1.53 -1 1.06
Attend vocational or trade school after HS 1.34 1.28
Attend college 1.90 1.19
Finish college 3.38 ** 2.17
Higher education after college 6.37 *** 2.38
Sureness of going farther than HS (8th) 2.05 *** 1.33 ***Social ability (10th) 1.44 *** 1.19 *Academic self-concept (8th and 10th) 1.81 *** 1.55 ***Student thinks of his or herself as a good student (12th) 1.09 1.34 ***Student cuts or skips class (8th) 1.14 -1 1.20 -1 **Student believes it is okay to work hard for good grades (10th) 1.85 ** 1.53
Student believes it is okay to ask challenging questions (10th) 1.59 *** 1.32 *Student believes it is okay to solve problems using new ideas (10th) 1.50 ** 1.63 **Student believes it is okay to help others with school work (10th) 1.34 1.71 **Student tries as hard as he/she can in classes (10th) 1.08 1.07
Student comes to class prepared (8th) 1.24 ** 1.30 ***Average amount of time spent on homework each week (8th) 1.33 ** 1.23 ***Teacher rating: student usually works hard (10th) 1.97 *** 1.96 ***Teacher rating: student relates well to others (10th) 1.36 *** 1.21 ***Teacher rating: student will probably go to college (10th) 3.08 *** 2.07 ***Teacher rating: student does homework often (10th) 2.06 *** 2.17 ***Teacher rating: student is rarely tardy (10th) 1.40 *** 1.40 ***Teacher rating: student is attentive (10th) 1.73 *** 1.80 ***Teacher rating: student is not disruptive (10th) 1.46 *** 1.43 ***
Family relationshipsParent has rules about homework, GPA, and chores (8th) 1.13 -1 * 1.17 -1 **Parent knows parents of child's friend (8th) 1.58 ** 1.16
Table 2. Predictors of any postsecondary enrollment and completion of 1988 eighth graders at any postsecondary institution
See notes at end of table.
Postsecondary enrollment
Postsecondary completion
51
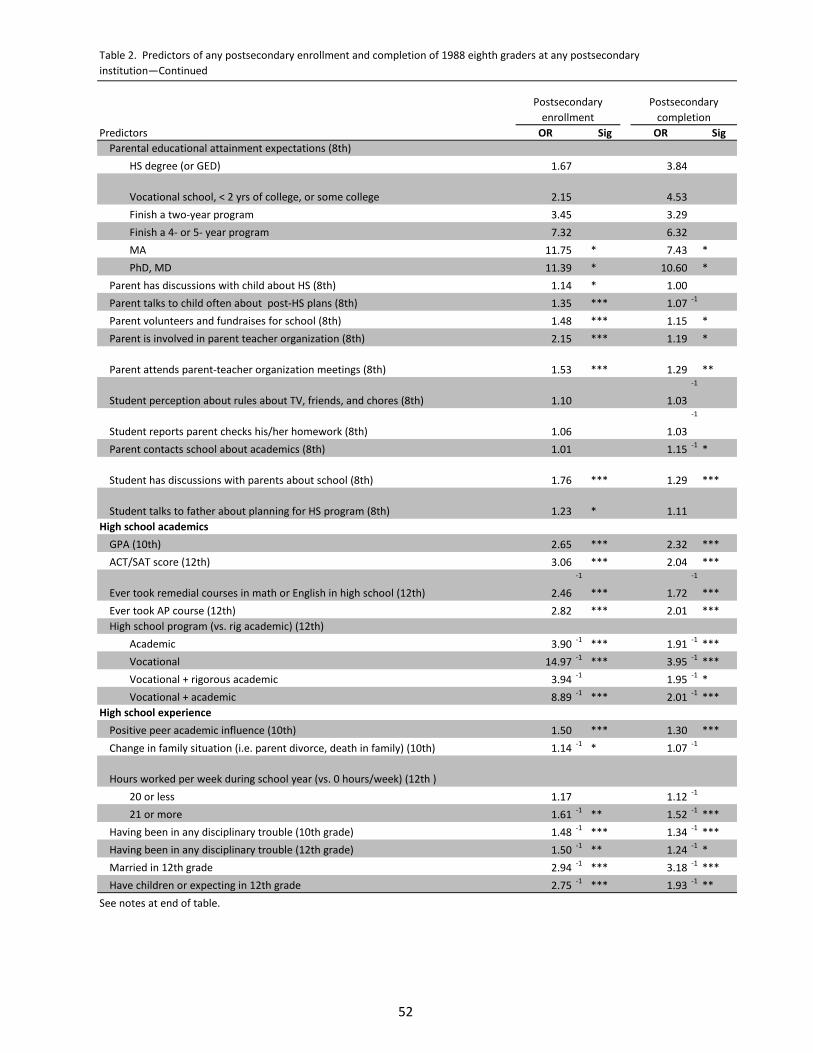
Predictors OR Sig OR SigParental educational attainment expectations (8th)
HS degree (or GED) 1.67 3.84
Vocational school, < 2 yrs of college, or some college 2.15
4.53
Finish a two-year program 3.45 3.29
Finish a 4- or 5- year program 7.32 6.32
MA 11.75 * 7.43 *PhD, MD 11.39 * 10.60 *
Parent has discussions with child about HS (8th) 1.14 * 1.00
Parent talks to child often about post-HS plans (8th) 1.35 *** 1.07 -1
Parent volunteers and fundraises for school (8th) 1.48 *** 1.15 *Parent is involved in parent teacher organization (8th) 2.15 *** 1.19 *
Parent attends parent-teacher organization meetings (8th) 1.53
*** 1.29
**
Student perception about rules about TV, friends, and chores (8th) 1.10
1.03
-1
Student reports parent checks his/her homework (8th) 1.06
1.03
-1
Parent contacts school about academics (8th) 1.01 1.15 -1 *
Student has discussions with parents about school (8th) 1.76
*** 1.29
***
Student talks to father about planning for HS program (8th) 1.23
* 1.11
High school academicsGPA (10th) 2.65 *** 2.32 ***ACT/SAT score (12th) 3.06 *** 2.04 ***
Ever took remedial courses in math or English in high school (12th) 2.46
-1
*** 1.72
-1
***Ever took AP course (12th) 2.82 *** 2.01 ***High school program (vs. rig academic) (12th)
Academic 3.90 -1 *** 1.91 -1 ***Vocational 14.97 -1 *** 3.95 -1 ***Vocational + rigorous academic 3.94 -1 1.95 -1 *Vocational + academic 8.89 -1 *** 2.01 -1 ***
High school experiencePositive peer academic influence (10th) 1.50 *** 1.30 ***Change in family situation (i.e. parent divorce, death in family) (10th) 1.14 -1 * 1.07 -1
Hours worked per week during school year (vs. 0 hours/week) (12th ) 20 or less 1.17 1.12 -1
21 or more 1.61 -1 ** 1.52 -1 ***Having been in any disciplinary trouble (10th grade) 1.48 -1 *** 1.34 -1 ***Having been in any disciplinary trouble (12th grade) 1.50 -1 ** 1.24 -1 *Married in 12th grade 2.94 -1 *** 3.18 -1 ***Have children or expecting in 12th grade 2.75 -1 *** 1.93 -1 **
Table 2. Predictors of any postsecondary enrollment and completion of 1988 eighth graders at any postsecondary institution—Continued
Postsecondary enrollment
Postsecondary completion
See notes at end of table.
52
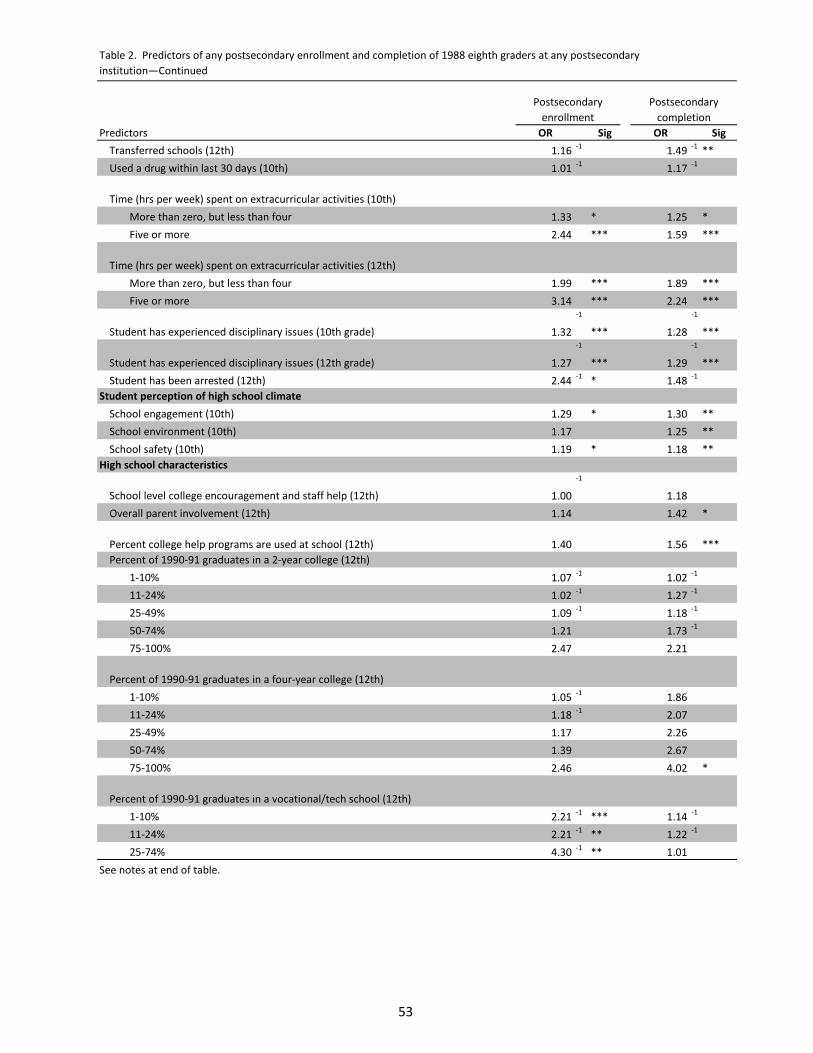
Predictors OR Sig OR SigTransferred schools (12th) 1.16 -1 1.49 -1 **Used a drug within last 30 days (10th) 1.01 -1 1.17 -1
Time (hrs per week) spent on extracurricular activities (10th) More than zero, but less than four 1.33 * 1.25 *Five or more 2.44 *** 1.59 ***
Time (hrs per week) spent on extracurricular activities (12th) More than zero, but less than four 1.99 *** 1.89 ***Five or more 3.14 *** 2.24 ***
Student has experienced disciplinary issues (10th grade) 1.32
-1
*** 1.28
-1
***
Student has experienced disciplinary issues (12th grade) 1.27
-1
*** 1.29
-1
***Student has been arrested (12th) 2.44 -1 * 1.48 -1
Student perception of high school climateSchool engagement (10th) 1.29 * 1.30 **School environment (10th) 1.17 1.25 **School safety (10th) 1.19 * 1.18 **
High school characteristics
School level college encouragement and staff help (12th) 1.00
-1
1.18
Overall parent involvement (12th) 1.14 1.42 *
Percent college help programs are used at school (12th) 1.40
1.56
***Percent of 1990-91 graduates in a 2-year college (12th)
1-10% 1.07 -1 1.02 -1
11-24% 1.02 -1 1.27 -1
25-49% 1.09 -1 1.18 -1
50-74% 1.21 1.73 -1
75-100% 2.47 2.21
Percent of 1990-91 graduates in a four-year college (12th)1-10% 1.05 -1 1.86
11-24% 1.18 -1 2.07
25-49% 1.17 2.26
50-74% 1.39 2.67
75-100% 2.46 4.02 *
Percent of 1990-91 graduates in a vocational/tech school (12th)1-10% 2.21 -1 *** 1.14 -1
11-24% 2.21 -1 ** 1.22 -1
25-74% 4.30 -1 ** 1.01
Table 2. Predictors of any postsecondary enrollment and completion of 1988 eighth graders at any postsecondary institution—Continued
Postsecondary enrollment
Postsecondary completion
See notes at end of table.
53

Predictors OR Sig OR Sig
12th grade enrollment (vs. 1-99 students in 12th grade class)100-199 1.04 1.03 -1
200-299 1.25 1.13 -1
300-399 1.37 -1 1.27 -1
400+ 1.27 1.30 -1 *School classification (vs. public schools) (12th)
Private 5.69 *** 1.54 *Percent of students in single parent homes (12th) 0.00 0.00
11-24% 1.19 1.11
25-49% 1.13 -1 1.01
50-74% 1.26 -1 1.17 -1
75-100% 1.99 1.77 -1
Percent 12th grade language minority studentsLess than 10% 1.00 -1 1.09 -1
10-49% 1.45 * 1.25 -1
Percent Asian/pacific Islander 12th graders 1.68 * 1.06
Percent Hispanic 12th graders 1.22 1.17 -1
Percent Black (non-Hispanic) 12th graders 1.25 -1 1.11
Percent White (non-Hispanic) 12th graders 1.21 -1 1.16
Percent American Indian or Alaskan 12th graders 1.43 1.68 -1 *Percent of students who receive FRPM (12th) 1.04 -1 1.14 -1
Average 12th grade attendance rate 1.48 * 1.12
Number of 12th grade students in AP courses 1.17 ** 1.09
Percent 12th graders dropout before graduation 1.04 -1 1.38 -1 **
Percent of 12th grade students in college prep programs 2.61
*** 1.50
***
Percent of students who receive remedial reading (12th) 1.01
-1
1.49
-1
**Percent of students who receive remedial math (12th) 1.03 1.58 -1 **
Transition
Parent involved in providing teen with information about college (12th) 1.32
* 1.15
Number of schools student applied to (12th)One 4.60 *** 2.18 ***Two-four 9.27 *** 2.92 ***Five or more 18.89 *** 5.89 ***
Number of schools parent visited with teen (12th)One 1.09 1.26
Two 2.18 ** 1.51 ***Three-four 2.73 *** 1.81 ***Five or more 4.24 * 2.89 ***
See notes at end of table.
Table 2. Predictors of any postsecondary enrollment and completion of 1988 eighth graders at any postsecondary institution—Continued
Postsecondary enrollment
Postsecondary completion
54

Predictors OR Sig OR Sig
Parent talked to teen about applying for college (12th) 1.71
*** 1.12
Parent is financially prepared for teen's college (12th) 1.47 *** 1.25 **Parents took steps to learn about financial aid (12th) 1.52 *** 1.27 ***Parent is familiar with loan programs (12th) 1.96 *** 1.48 ***
Parents read about or discussed financial aid with others to learn about it (12th) 2.78
*** 1.74
***Parent says teen has applied for financial aid (12th) 8.05 *** 1.92 ***
Postsecondary CharacteristicsLevel of enrollment (<2 year school) 2-3 year school 2.22 -1 ** 4 year school 1.17
Took a remedial math or English class 1.35 -1 **Ever had a child while enrolled 1.78 -1 ***Ever married while enrolled 1.19 -1 *Ever took time off 3.57 -1 ***Ever went part-time 3.13 -1 ***Ever changed majors 1.03 -1
Ever transferred credits 1.43 -1 **Participated in varsity athletics 1.35 *Participated in non-varsity intercollegiate athletics 1.74 ***Participated in intramural athletics 1.95 ***Participated in performing arts 1.29 *Participated in college newspaper or radio station 1.87 **Participated in student government or political groups 1.77 ***Participated in social clubs, fraternities/sororities 2.17 ***Volunteer service to fellow students 2.93 ***Volunteer services to community groups 2.57 ***Received formal tutoring 1.42 ***Received special instruction in English or math 1.23 -1
Level of participation in extracurricular activities 1.73 ***Postsecondary GPA 1.95 ***Occurrence of significant life event 1.14 -1
Hours/week volunteering 1.30 -1 ***Total amount borrowed for education 2.20 ***
* p<.05 ** p<.01 *** p<.001Note: Includes participants who received a high school degree (or GED) by June 1994. For sample sizes (N) see Table 1.SOURCE: 1988/2000 National Education Longitudinal Study (NELS) Restricted Use Data Files, National Center for Education Statistics, Institute of Education Sciences, U.S. Department of Education.
Table 2. Predictors of any postsecondary enrollment and completion of 1988 eighth graders at any postsecondary institution—Continued
Postsecondary enrollment
Postsecondary completion
55

Variable Sig pPsychosocial
Teacher rating: student usually works hard (10th) 3.14 *** 0.00Teacher rating: student will probably go to college (10th) 3.03 *** 0.00Teacher rating: student does homework often (10th) 1.88 *** 0.00Teacher rating: student relates well to others (10th) 1.85 *** 0.00Teacher rating: student is attentive (10th) 1.81 *** 0.00Student believes it is okay to help others with school work (10th) 1.71 ** 0.00Student plans to attend college sometime after HS (10th) 1.67 ** 0.01Student believes it is okay to solve problems using new ideas (10th) 1.63 ** 0.00Teacher rating: student is rarely tardy (10th) 1.45 *** 0.00Teacher rating: student is not disruptive (10th) 1.43 *** 0.00Student cuts or skips class (8th) 1.39 -1 ** 0.01Importance of good grades to student (10th) 1.39 *** 0.00Sureness of going farther than HS (8th) 1.33 *** 0.00Student believes it is okay to ask challenging questions (10th) 1.32 * 0.04Student comes to class prepared (8th) 1.11 *** 0.00Educational commitment (8th) 1.07 *** 0.00Academic self-concept (8th and 10th) 1.07 *** 0.00Locus of control (8th) 1.06 *** 0.00Self-concept (8th) 1.04 *** 0.00Student thinks of his or herself as a good student (12th) 1.04 *** 0.00Average amount of time spent on homework each week (8th) 1.03 *** 0.00Social ability (10th) 1.02 * 0.02
Family relationshipsParental educational attainment expectations (8th) MA 10.60 * 0.04Parental educational attainment expectations (8th) PhD, MD 7.43 * 0.04Parent attends parent-teacher organization meetings (8th) 1.29 ** 0.00Parent has rules about homework, GPA, and chores (8th) 1.17 -1 ** 0.00Parent volunteers and fundraises for school (8th) 1.14 * 0.02Parent is involved in parent teacher organization (8th) 1.12 * 0.03Student has discussions with parents about school (8th) 1.09 *** 0.00Parent contacts school about academics (8th) 1.07 -1 * 0.02
High School AcademicsHigh school program (12th): Vocational 3.95 -1 *** 0.00Ever took AP course (12th) 2.01 *** 0.00High school program (12th): Vocational + academic 2.01 -1 *** 0.00High school program (12th): Vocational + rigorous academic 1.95 -1 * 0.03High school program (12th): Academic 1.91 -1 *** 0.00Ever took remedial courses in math or English in high school (12th) 1.72 -1 *** 0.00GPA (10th) 1.52 *** 0.00ACT/SAT score (12th) 1.02 *** 0.00
Table 3. Rank-ordered significant odds ratios of predictors of any postsecondary enrollment and completion of 1988 eighth graders at any postsecondary institutions
Postsecondary completion
OR
See notes at end of table.
56

Variable Sig pHigh school experience
Married in 12th grade 3.18 -1 *** 0.00Time (hrs per week) spent on extracurricular activities (12th): five or more 2.24 *** 0.00Have children or expecting in 12th grade 1.93 -1 ** 0.01Time (hrs per week) spent on extracurricular activities (12th): more than zero, but less than four 1.89
*** 0.00Time (hrs per week) spent on extracurricular activities (10th): five or more 1.59 *** 0.00Hours worked per week during school year (12th ): 21 or more 1.52 -1 *** 0.00Transferred schools (12th) 1.49 -1 ** 0.01Having been in any disciplinary trouble (10th grade) 1.34 -1 *** 0.00Time (hrs per week) spent on extracurricular activities (10th): more than zero, but less than four 1.25
* 0.02Having been in any disciplinary trouble (12th grade) 1.24 -1 * 0.02Student has experienced disciplinary issues (10th grade) 1.16 -1 *** 0.00Student has experienced disciplinary issues (12th grade) 1.14 -1 *** 0.00Positive peer academic influence (10th) 1.08 *** 0.00
Student perception of high school climateSchool safety (10th) 1.10 ** 0.01School environment (10th) 1.06 ** 0.01School engagement (10th) 1.05 ** 0.00
High school characteristicsPercent of 1990-91 graduates in a four-year college (12th) 75-100% 4.02 * 0.03School classification private 1.54 * 0.0112th grade enrollment 400+ 1.30 -1 * 0.05Percent college help programs are used at school (12th) 1.04 *** 0.00Percent 12th graders dropout before graduation 1.03 -1 ** 0.00Percent American Indian or Alaskan 12th graders 1.02 -1 * 0.01Overall parent involvement (12th) 1.02 * 0.02Percent of students that receive remedial math (12th) 1.02 -1 ** 0.00Percent of students that receive remedial reading (12th) 1.01 -1 ** 0.01Percent of 12th grade students in college prep programs 1.01 *** 0.00
TransitionNumber of schools student applied to (12th): five or more 5.89 *** 0.00Number of schools student applied to (12th): two-four 2.92 *** 0.00Number of schools parent visited with teen (12th): five or more 2.89 *** 0.00Number of schools student applied to (12th): one 2.18 *** 0.00Parent says teen has applied for financial aid (12th) 1.92 *** 0.00Number of schools parent visited with teen (12th): three-four 1.81 *** 0.00
Parents read about or discussed financial aid with others to learn about it (12th) 1.74
*** 0.00Number of schools parent visited with teen (12th): two 1.51 *** 0.00Parent is familiar with loan programs (12th) 1.19 *** 0.00
Table 3. Rank-ordered significant odds ratios of predictors of any postsecondary enrollment and completion of 1988 eighth graders at any postsecondary institutions—Continued
Postsecondary completion
OR
See notes at end of table.
57

Variable Sig pParents took steps to learn about financial aid (12th) 1.11 *** 0.00Parent is financially prepared for teen's college (12th) 1.08 ** 0.00
Postsecondary characteristicsEver took time off 3.57 -1 *** 0.00Ever went part-time 3.13 -1 *** 0.00Volunteer service to fellow students 2.93 *** 0.00Volunteer services to community groups 2.57 *** 0.00
2-3 year school enrollment 2.22 -1 ** 0.00Participated in social clubs, fraternities/sororities 2.17 *** 0.00Participated in intramural athletics 1.95 *** 0.00Participated in college newspaper or radio station 1.87 ** 0.00Ever had a child while enrolled 1.78 -1 *** 0.00Participated in student government or political groups 1.77 *** 0.00Participated in non-varsity intercollegiate athletics 1.74 *** 0.00Postsecondary GPA 1.59 *** 0.00Ever transferred credits 1.43 -1 ** 0.00Received formal tutoring 1.42 *** 0.00Level of participation in extracurricular activities 1.42 *** 0.00Participated in varsity athletics 1.35 * 0.03Took a remedial math or English class 1.35 -1 ** 0.00Participated in performing arts 1.29 * 0.04Ever married while enrolled 1.19 -1 * 0.03Total amount borrowed for education 1.13 *** 0.00Hours/week volunteering 1.02 -1 *** 0.00
* p<.05 ** p<.01 *** p<.001Note: Includes participants who received a high school degree (or GED) by June 1994. For sample sizes (n) see Table 1.SOURCE: 1988/2000 National Education Longitudinal Study (NELS) Restricted Use Data Files, National Center for Education Statistics, Institute of Education Sciences, U.S. Department of Education.
Table 3. Rank-ordered significant odds ratios of predictors of any postsecondary enrollment and completion of 1988 eighth graders at any postsecondary institutions—Continued
Postsecondary completion
OR
58
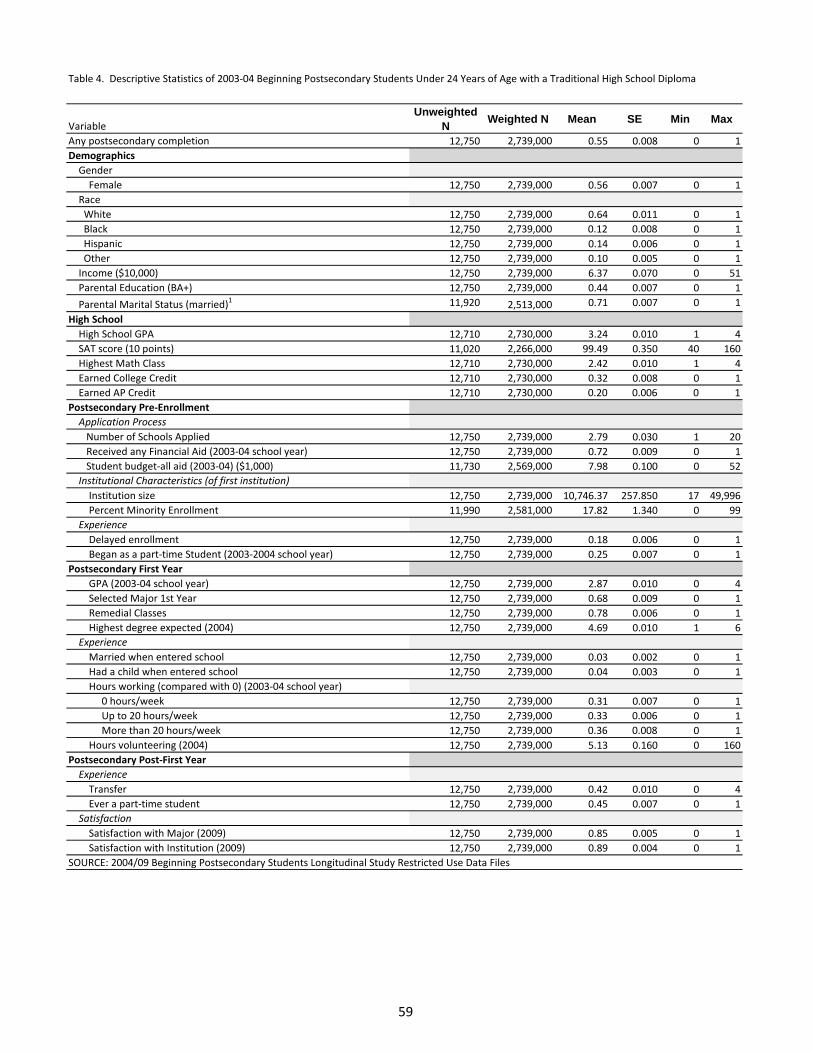
VariableUnweighted
N Weighted N Mean SE Min Max
Any postsecondary completion 12,750 2,739,000 0.55 0.008 0 1Demographics Gender Female 12,750 2,739,000 0.56 0.007 0 1 Race White 12,750 2,739,000 0.64 0.011 0 1 Black 12,750 2,739,000 0.12 0.008 0 1 Hispanic 12,750 2,739,000 0.14 0.006 0 1 Other 12,750 2,739,000 0.10 0.005 0 1 Income ($10,000) 12,750 2,739,000 6.37 0.070 0 51 Parental Education (BA+) 12,750 2,739,000 0.44 0.007 0 1 Parental Marital Status (married)1 11,920 2,513,000 0.71 0.007 0 1High School High School GPA 12,710 2,730,000 3.24 0.010 1 4 SAT score (10 points) 11,020 2,266,000 99.49 0.350 40 160 Highest Math Class 12,710 2,730,000 2.42 0.010 1 4 Earned College Credit 12,710 2,730,000 0.32 0.008 0 1 Earned AP Credit 12,710 2,730,000 0.20 0.006 0 1Postsecondary Pre-Enrollment Application Process Number of Schools Applied 12,750 2,739,000 2.79 0.030 1 20 Received any Financial Aid (2003-04 school year) 12,750 2,739,000 0.72 0.009 0 1 Student budget-all aid (2003-04) ($1,000) 11,730 2,569,000 7.98 0.100 0 52 Institutional Characteristics (of first institution) Institution size 12,750 2,739,000 10,746.37 257.850 17 49,996 Percent Minority Enrollment 11,990 2,581,000 17.82 1.340 0 99 Experience Delayed enrollment 12,750 2,739,000 0.18 0.006 0 1 Began as a part-time Student (2003-2004 school year) 12,750 2,739,000 0.25 0.007 0 1Postsecondary First Year GPA (2003-04 school year) 12,750 2,739,000 2.87 0.010 0 4 Selected Major 1st Year 12,750 2,739,000 0.68 0.009 0 1 Remedial Classes 12,750 2,739,000 0.78 0.006 0 1 Highest degree expected (2004) 12,750 2,739,000 4.69 0.010 1 6 Experience Married when entered school 12,750 2,739,000 0.03 0.002 0 1 Had a child when entered school 12,750 2,739,000 0.04 0.003 0 1 Hours working (compared with 0) (2003-04 school year) 0 hours/week 12,750 2,739,000 0.31 0.007 0 1 Up to 20 hours/week 12,750 2,739,000 0.33 0.006 0 1 More than 20 hours/week 12,750 2,739,000 0.36 0.008 0 1 Hours volunteering (2004) 12,750 2,739,000 5.13 0.160 0 160Postsecondary Post-First Year Experience Transfer 12,750 2,739,000 0.42 0.010 0 4 Ever a part-time student 12,750 2,739,000 0.45 0.007 0 1 Satisfaction Satisfaction with Major (2009) 12,750 2,739,000 0.85 0.005 0 1 Satisfaction with Institution (2009) 12,750 2,739,000 0.89 0.004 0 1
Table 4. Descriptive Statistics of 2003-04 Beginning Postsecondary Students Under 24 Years of Age with a Traditional High School Diploma
SOURCE: 2004/09 Beginning Postsecondary Students Longitudinal Study Restricted Use Data Files
59

Sig. p Sig. p Sig. p Sig. p Sig. pIntercept 1.79 -1 *** 0.00 50.00 -1 *** 0.00 50.86 -1 *** 0.00 101.91 -1 *** 0.00 119.52 -1 *** 0.00Demographics Gender (Being Female) 1.66 *** 0.00 1.49 *** 0.00 1.45 *** 0.00 1.30 ** 0.01 1.31 ** 0.01 Race (compared to White) Black 1.67 -1 *** 0.00 1.32 -1 * 0.01 1.38 -1 * 0.01 1.43 -1 ** 0.01 1.46 -1 ** 0.01 Hispanic 1.45 -1 *** 0.00 1.43 -1 * 0.01 1.47 -1 ** 0.01 1.46 -1 ** 0.01 1.43 -1 * 0.02 Other 1.14 -1 0.17 1.27 -1 * 0.03 1.14 -1 0.25 1.08 -1 0.53 1.03 -1 0.80 Income ($10,000) 1.26 *** 0.00 1.26 *** 0.00 1.29 *** 0.00 1.37 *** 0.00 1.41 *** 0.00 Parental Education (BA+) 1.66 *** 0.00 1.24 *** 0.00 1.09 0.22 1.11 0.15 1.12 0.14 Parental Marital Status (married)1 1.46 *** 0.00 1.32 ** 0.00 1.32 *** 0.00High School GPA 2.01 *** 0.00 2.02 *** 0.00 1.62 *** 0.00 1.63 *** 0.00 SAT score (10 points) 1.44 *** 0.00 1.37 ** 0.00 1.11 0.35 1.07 0.56 Highest Math Class 1.26 *** 0.00 1.19 ** 0.00 1.16 ** 0.01 1.14 * 0.01 Earned College Credit 1.16 0.12 1.18 0.13 1.11 0.35 1.11 0.36 Earned AP Credit 1.08 0.45 1.02 0.88 1.00 -1 0.99 1.03 -1 0.83Postsecondary Pre-Enrollment Application Process Number of Schools Applied 1.12 0.05 1.15 * 0.02 1.15 * 0.02 Received any Financial Aid 1.24 0.11 1.16 0.27 1.10 0.50 Student budget-all aid (2003-04) ($1,000) 1.32 *** 0.00 1.29 *** 0.00 1.26 *** 0.00 Institutional Characteristics Institution size 1.17 0.14 1.15 0.16 1.14 0.21 Percent Minority Enrollment 1.39 0.15 1.30 0.29 1.14 0.60 Experience Delayed enrollment 1.71 -1 *** 0.00 1.68 -1 *** 0.00 1.74 -1 *** 0.00 Part-time Student (2004) 1.46 -1 *** 0.00 1.41 -1 *** 0.00 1.30 * 0.03Postsecondary Post-Enrollment GPA (2004) 2.03 *** 0.00 1.96 *** 0.00 Selected Major 1st Year 1.23 * 0.01 1.21 * 0.02 Remedial Classes 1.07 -1 0.54 1.04 -1 0.70 Highest degree expected (2004) 1.09 0.10 1.09 0.12 Experience Married when entered school 1.13 0.82 1.11 0.83 Had a child when entered school 1.92 -1 * 0.04 2.01 -1 * 0.03 Hours working (compared with 0) (2004) Up to 20 hours/week 1.07 0.42 1.12 0.18 More than 20 hours/week 1.32 -1 ** 0.00 1.23 -1 * 0.04
Hours volunteering (2004) 1.02 0.75 1.04 0.41 Satisfaction with Major (2009) 1.26 * 0.02 Satisfaction with Institution (2009) 1.95 *** 0.00 Transferring (continuous) 1.28 -1 ** 0.00 Ever a part-time student 2.57 -1 *** 0.00* p<.05 ** p<.01 *** p<.001Notes:Includes beginning postsecondary students under 24 years old with traditional high school diplomas. 1 Parental marital status was only asked of dependent children. It was excluded from models 4-5 in order to include starting school while being married or having a child. All students included in models 1-3 are dependent. SOURCE: 2004/09 Beginning Postsecondary Students Longitudinal Study Restricted Use Data Files
N=9,800 R2=0.206342
N=12,600 R2=0.063521
N= 10,500 R2=0.128272
Std. OR Std. OR Std. OR Std. ORStd. OR
Table 5. Predictors of Any Postsecondary Completion of 2003-04 First Time Beginners at Any Postsecondary Institution
N=9,800 R2=0.164466
1-Demographics2-Demographics and
High School 3-Before enrollment4-1st year of enrollment
5-All years of enrollment
N= 9,800 R2=0.239603
60

Sig. p
Ever a part-time student 2.57 -1 *** 0.00
Had a child when entered school 2.01 -1 * 0.03
Postsecondary GPA (2004) 1.96 *** 0.00
Satisfaction with Institution (2009) 1.95 *** 0.00
Delayed enrollment 1.74 -1 *** 0.00
High school GPA 1.63
*** 0.00
Income ($10,000) 1.41
*** 0.00
Part-time student (2004) 1.30 * 0.03
Number of times transfered 1.28 -1 ** 0.00
Satisfaction with Major (2009) 1.26 * 0.02
Student budget-all aid (2003-04) ($1,000) 1.26 *** 0.00
Working more than 20 hours/week 1.23 -1 * 0.04
Selected major 1st year 1.21 * 0.02
Number of schools applied to 1.15 * 0.02
Highest math class 1.14
* 0.01
Std. OR
Table 6. Rank-Ordered Significant Odds Ratios of Predictors of Any Postsecondary Completion of 2003-04 First Time Beginners at Any Postsecondary Institution
* p<.05 ** p<.01 *** p<.001N= 9,800Notes:Includes beginning postsecondary students under 24 years old with traditional high school diplomas. Race and gender variables are excluded becasue they are non-malleable.SOURCE: 2004/09 Beginning Postsecondary Students Longitudinal Study Restricted Use Data Files
61

Variable Unweighted N Weighted N Mean SE Min Max
Completion of at least a four year degree 7,890 1,460,000 0.62 0.012 0 1Demographics Gender Female 7,890 1,460,000 0.56 0.009 0 1 Race White 7,890 1,460,000 0.70 0.013 0 1 Black 7,890 1,460,000 0.09 0.011 0 1 Hispanic 7,890 1,460,000 0.11 0.007 0 1 Other 7,890 1,460,000 0.10 0.006 0 1 Income ($10,000) 7,890 1,460,000 7.41 0.100 0 50 Parental Education (BA+) 7,890 1,460,000 0.56 0.010 0 1 Parental Marital Status (married)1 7,720 1,416,000 0.75 0.008 0 1High School High School GPA 7,880 1,457,000 3.45 0.010 1 4 SAT score (10 points) 7,650 1,407,000 105.70 0.490 40 160 Highest Math Class 7,880 1,457,000 2.76 0.020 1 4 Earned College Credit 7,880 1,457,000 0.41 0.010 0 1 Earned AP Credit 7,880 1,457,000 0.29 0.009 0 1Postsecondary Pre-Enrollment Application Process Number of Schools Applied 7,890 1,460,000 3.48 0.050 1 20 Received any Financial Aid (2003-04 school year) 7,890 1,460,000 0.82 0.006 0 1 Student budget-all aid (2003-04) ($1,000) 7,300 1,371,000 9.95 0.160 0 52 Institutional Characteristics (of first institution) Institution size 7,890 1,460,000 12,964.63 251.170 38 49,996 Percent Minority Enrollment 7,860 1,454,000 19.59 1.310 0 99 Selectivity 7,540 1,372,000 3.05 0.040 1 4 Experience Delayed enrollment 7,890 1,460,000 0.07 0.006 0 1 Began as a part-time Student (2003-2004 school year) 7,890 1,460,000 0.10 0.006 0 1Postsecondary First Year GPA (2003-04 school year) 7,890 1,460,000 2.90 0.020 0 4 Selected Major 1st Year 7,890 1,460,000 0.72 0.009 0 1 Remedial Classes 7,890 1,460,000 0.83 0.007 0 1 Highest degree expected (2004) 7,890 1,460,000 4.99 0.020 1 6 Experience Hours working (compared with 0) (2003-04 school year) 0 hours/week 7,890 1,460,000 0.40 0.009 0 1 Up to 20 hours/week 7,890 1,460,000 0.38 0.009 0 1 More than 20 hours/week 7,890 1,460,000 0.22 0.010 0 1 Hours volunteering (2004) 7,890 1,460,000 5.55 0.210 0 160 Social Integration (2004) Fine arts activities 7,890 1,460,000 0.65 0.010 0 2 School clubs 7,890 1,460,000 0.62 0.010 0 2 School sports 7,890 1,460,000 0.60 0.010 0 2 Study groups 7,890 1,460,000 0.84 0.010 0 2 Student-Faculty Relationship (2004) Faculty informal meeting 7,890 1,460,000 0.55 0.010 0 2 Faculty talk outside class 7,890 1,460,000 1.02 0.010 0 2 Meet academic advisor 7,890 1,460,000 1.06 0.010 0 2Postsecondary Post-First Year Experience Number of transfers 7,890 1,460,000 0.33 0.010 0 4 Ever married while enrolled 7,850 1,451,000 0.06 0.004 0 1 Ever had a child while enrolled 7,890 1,460,000 0.08 0.006 0 1 Became a part time student after first year 7,890 1,460,000 0.21 0.006 0 1 Hours volunteering (2006) 7,890 1,460,000 5.63 0.250 0 200 Social Integration (2006) Fine arts 7,560 1,379,000 0.68 0.010 0 2 School clubs 7,560 1,379,000 0.84 0.010 0 2 School sports 7,560 1,379,000 0.61 0.010 0 2 Study groups*not part of social integration index 7,560 1,379,000 0.91 0.010 0 2 Student-Faculty Relationship (2006) Faculty informal meeting 7,560 1,379,000 0.63 0.010 0 2 Faculty talk outside class 7,560 1,379,000 1.25 0.010 0 2 Meet academic advisor 7,560 1,379,000 1.12 0.010 0 2 Satisfaction Satisfaction with Major (2009) 7,890 1,460,000 0.85 0.006 0 1 Satisfaction with Institution (2009) 7,890 1,460,000 0.90 0.006 0 1
SOURCE: 2004/09 Beginning Postsecondary Students Longitudinal Study Restricted Use Data Files
Table 7. Descriptive Statistics of 2003-04 Beginning Postsecondary Students Under 24 Years of Age with a Traditional High School Diploma Who Started at 4-Year Institutions
62
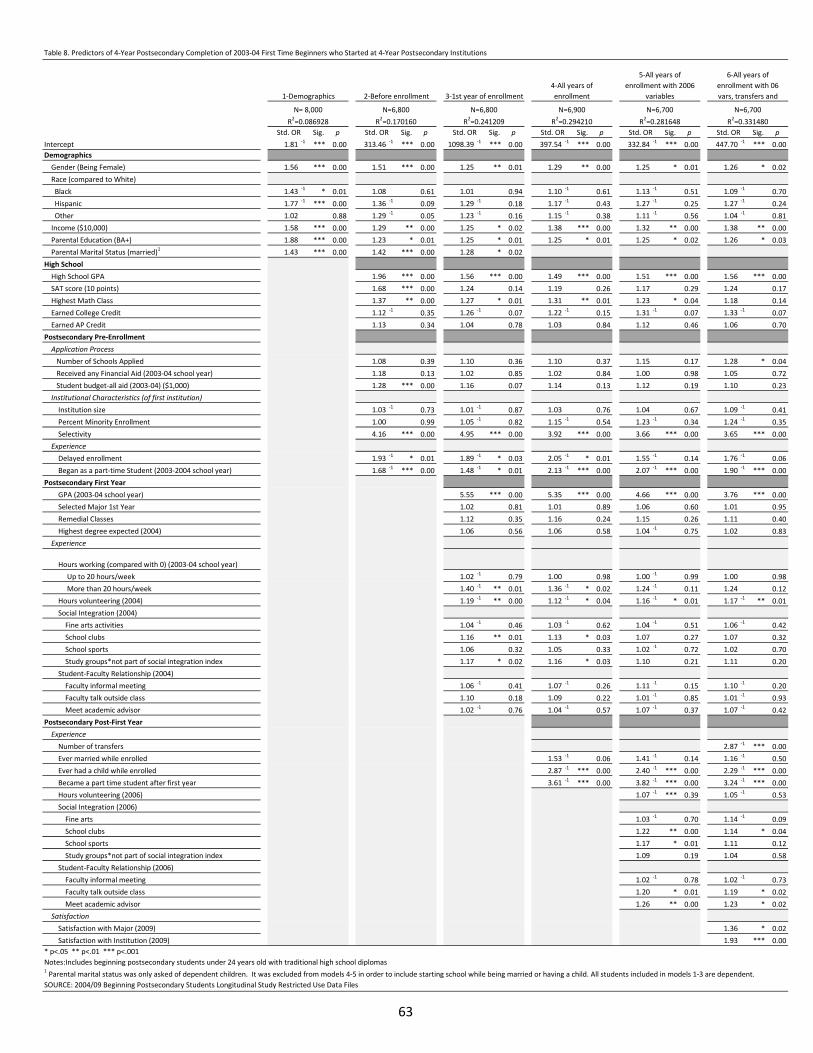
Sig. p Sig. p Sig. p Sig. p Sig. p Sig. pIntercept 1.81 -1 *** 0.00 313.46 -1 *** 0.00 1098.39 -1 *** 0.00 397.54 -1 *** 0.00 332.84 -1 *** 0.00 447.70 -1 *** 0.00Demographics Gender (Being Female) 1.56 *** 0.00 1.51 *** 0.00 1.25 ** 0.01 1.29 ** 0.00 1.25 * 0.01 1.26 * 0.02 Race (compared to White) Black 1.43 -1 * 0.01 1.08 0.61 1.01 0.94 1.10 -1 0.61 1.13 -1 0.51 1.09 -1 0.70 Hispanic 1.77 -1 *** 0.00 1.36 -1 0.09 1.29 -1 0.18 1.17 -1 0.43 1.27 -1 0.25 1.27 -1 0.24 Other 1.02 0.88 1.29 -1 0.05 1.23 -1 0.16 1.15 -1 0.38 1.11 -1 0.56 1.04 -1 0.81 Income ($10,000) 1.58 *** 0.00 1.29 ** 0.00 1.25 * 0.02 1.38 *** 0.00 1.32 ** 0.00 1.38 ** 0.00 Parental Education (BA+) 1.88 *** 0.00 1.23 * 0.01 1.25 * 0.01 1.25 * 0.01 1.25 * 0.02 1.26 * 0.03 Parental Marital Status (married)1 1.43 *** 0.00 1.42 *** 0.00 1.28 * 0.02High School High School GPA 1.96 *** 0.00 1.56 *** 0.00 1.49 *** 0.00 1.51 *** 0.00 1.56 *** 0.00 SAT score (10 points) 1.68 *** 0.00 1.24 0.14 1.19 0.26 1.17 0.29 1.24 0.17 Highest Math Class 1.37 ** 0.00 1.27 * 0.01 1.31 ** 0.01 1.23 * 0.04 1.18 0.14 Earned College Credit 1.12 -1 0.35 1.26 -1 0.07 1.22 -1 0.15 1.31 -1 0.07 1.33 -1 0.07 Earned AP Credit 1.13 0.34 1.04 0.78 1.03 0.84 1.12 0.46 1.06 0.70Postsecondary Pre-Enrollment Application Process Number of Schools Applied 1.08 0.39 1.10 0.36 1.10 0.37 1.15 0.17 1.28 * 0.04 Received any Financial Aid (2003-04 school year) 1.18 0.13 1.02 0.85 1.02 0.84 1.00 0.98 1.05 0.72 Student budget-all aid (2003-04) ($1,000) 1.28 *** 0.00 1.16 0.07 1.14 0.13 1.12 0.19 1.10 0.23 Institutional Characteristics (of first institution) Institution size 1.03 -1 0.73 1.01 -1 0.87 1.03 0.76 1.04 0.67 1.09 -1 0.41 Percent Minority Enrollment 1.00 0.99 1.05 -1 0.82 1.15 -1 0.54 1.23 -1 0.34 1.24 -1 0.35 Selectivity 4.16 *** 0.00 4.95 *** 0.00 3.92 *** 0.00 3.66 *** 0.00 3.65 *** 0.00 Experience Delayed enrollment 1.93 -1 * 0.01 1.89 -1 * 0.03 2.05 -1 * 0.01 1.55 -1 0.14 1.76 -1 0.06 Began as a part-time Student (2003-2004 school year) 1.68 -1 *** 0.00 1.48 -1 * 0.01 2.13 -1 *** 0.00 2.07 -1 *** 0.00 1.90 -1 *** 0.00Postsecondary First Year GPA (2003-04 school year) 5.55 *** 0.00 5.35 *** 0.00 4.66 *** 0.00 3.76 *** 0.00 Selected Major 1st Year 1.02 0.81 1.01 0.89 1.06 0.60 1.01 0.95 Remedial Classes 1.12 0.35 1.16 0.24 1.15 0.26 1.11 0.40 Highest degree expected (2004) 1.06 0.56 1.06 0.58 1.04 -1 0.75 1.02 0.83 Experience
Hours working (compared with 0) (2003-04 school year) Up to 20 hours/week 1.02 -1 0.79 1.00 0.98 1.00 -1 0.99 1.00 0.98 More than 20 hours/week 1.40 -1 ** 0.01 1.36 -1 * 0.02 1.24 -1 0.11 1.24 0.12 Hours volunteering (2004) 1.19 -1 ** 0.00 1.12 -1 * 0.04 1.16 -1 * 0.01 1.17 -1 ** 0.01 Social Integration (2004) Fine arts activities 1.04 -1 0.46 1.03 -1 0.62 1.04 -1 0.51 1.06 -1 0.42 School clubs 1.16 ** 0.01 1.13 * 0.03 1.07 0.27 1.07 0.32 School sports 1.06 0.32 1.05 0.33 1.02 -1 0.72 1.02 0.70 Study groups*not part of social integration index 1.17 * 0.02 1.16 * 0.03 1.10 0.21 1.11 0.20 Student-Faculty Relationship (2004) Faculty informal meeting 1.06 -1 0.41 1.07 -1 0.26 1.11 -1 0.15 1.10 -1 0.20 Faculty talk outside class 1.10 0.18 1.09 0.22 1.01 -1 0.85 1.01 -1 0.93 Meet academic advisor 1.02 -1 0.76 1.04 -1 0.57 1.07 -1 0.37 1.07 -1 0.42Postsecondary Post-First Year Experience Number of transfers 2.87 -1 *** 0.00 Ever married while enrolled 1.53 -1 0.06 1.41 -1 0.14 1.16 -1 0.50 Ever had a child while enrolled 2.87 -1 *** 0.00 2.40 -1 *** 0.00 2.29 -1 *** 0.00 Became a part time student after first year 3.61 -1 *** 0.00 3.82 -1 *** 0.00 3.24 -1 *** 0.00 Hours volunteering (2006) 1.07 -1 *** 0.39 1.05 -1 0.53 Social Integration (2006) Fine arts 1.03 -1 0.70 1.14 -1 0.09 School clubs 1.22 ** 0.00 1.14 * 0.04 School sports 1.17 * 0.01 1.11 0.12 Study groups*not part of social integration index 1.09 0.19 1.04 0.58 Student-Faculty Relationship (2006) Faculty informal meeting 1.02 -1 0.78 1.02 -1 0.73 Faculty talk outside class 1.20 * 0.01 1.19 * 0.02 Meet academic advisor 1.26 ** 0.00 1.23 * 0.02 Satisfaction Satisfaction with Major (2009) 1.36 * 0.02 Satisfaction with Institution (2009) 1.93 *** 0.00
N=6,800R2=0.170160
3-1st year of enrollment
N=6,800R2=0.241209
* p<.05 ** p<.01 *** p<.001Notes:Includes beginning postsecondary students under 24 years old with traditional high school diplomas1 Parental marital status was only asked of dependent children. It was excluded from models 4-5 in order to include starting school while being married or having a child. All students included in models 1-3 are dependent. SOURCE: 2004/09 Beginning Postsecondary Students Longitudinal Study Restricted Use Data Files
Table 8. Predictors of 4-Year Postsecondary Completion of 2003-04 First Time Beginners who Started at 4-Year Postsecondary Institutions
Std. OR Std. OR Std. ORStd. ORStd. OR Std. OR
4-All years of enrollment
N=6,900R2=0.294210
5-All years of enrollment with 2006
variables
N=6,700R2=0.281648
6-All years of enrollment with 06 vars, transfers and
N=6,700R2=0.331480
1-Demographics
N= 8,000R2=0.086928
2-Before enrollment
63

Sig. p
Postsecondary GPA (2003-04 school year) 3.76 *** 0.00
Selectivity 3.65 *** 0.00
Became a part time student after first year 3.24 -1 *** 0.00
Number of transfers 2.87 -1 *** 0.00
Ever had a child while enrolled 2.29 -1 *** 0.00
Satisfaction with institution (2009) 1.93 *** 0.00
Began as a part-time student (2003-2004 school year) 1.90 -1 *** 0.00
High school GPA 1.56 *** 0.00
Income ($10,000) 1.38 ** 0.00
Satisfaction with major (2009) 1.36 * 0.02
Number of schools applied to 1.28 * 0.04
Parental education (BA+) 1.26 * 0.03
Meet academic advisor 1.23 * 0.02
Faculty talk outside class 1.19 * 0.02
Hours volunteering (2004) 1.17 -1 ** 0.01
School clubs 1.14 * 0.04
Std. OR
Table 9. Rank-Ordered Significant Odds Ratios of Predictors of 4-Year Postsecondary Completion of 2003-04 First Time Beginners who Started at 4-Year Postsecondary Institutions
* p<.05 ** p<.01 *** p<.001N= 6,700Notes:Includes beginning postsecondary students under 24 years old with traditional high school diplomas. Race and gender variables are excluded because they are considered non-malleable.SOURCE: 2004/09 Beginning Postsecondary Students Longitudinal Study Restricted Use Data Files
64

VariableUnweighted
NWeighted
NMean SE Min Max
Completion of at least a two year degree 4,270 1,154,000 0.31 0.012 0 1Demographics Gender Female 4,270 1,154,000 0.53 0.014 0 1 Race White 4,270 1,154,000 0.61 0.019 0 1 Black 4,270 1,154,000 0.14 0.011 0 1 Hispanic 4,270 1,154,000 0.16 0.012 0 1 Other 4,270 1,154,000 0.09 0.008 0 1 Income ($10,000) 4,270 1,154,000 5.47 0.150 0 51 Parental Education (BA+) 4,270 1,154,000 0.31 0.012 0 1 Parental Marital Status (married)1 3,800 1,014,000 0.68 0.014 0 1High School High School GPA 4,250 1,148,000 3.03 0.020 0 4 SAT score (10 points) 3,100 806,000 89.80 0.560 41 156 Highest Math Class 4,250 1,148,000 2.04 0.020 1 4 Earned College Credit 4,250 1,148,000 0.23 0.012 0 1 Earned AP Credit 4,250 1,148,000 0.11 0.008 0 1Postsecondary Pre-Enrollment Application Process Number of Schools Applied 4,270 1,154,000 2.03 0.040 1 20 Received any Financial Aid (2003-04 school year) 4,270 1,154,000 0.57 0.018 0 1 Student budget-all aid (2003-04) ($1,000) 3,870 1,078,000 5.51 0.130 0 39 Institutional Characteristics (of first institution) Institution size 4,270 1,154,000 9,028.66 523.310 17 47,952 Percent Minority Enrollment 4,110 1,123,000 15.51 2.430 1 99 Experience Delayed enrollment 4,270 1,154,000 0.28 0.013 0 1 Began as a part-time Student (2003-2004 school year) 4,270 1,154,000 0.43 0.012 0 1Postsecondary First Year GPA (2003-04 school year) 4,270 1,154,000 2.80 0.020 0 4 Selected Major 1st Year 4,270 1,154,000 0.62 0.018 0 1 Remedial Classes 4,270 1,154,000 0.69 0.011 0 1 Highest degree expected (2004) 4,270 1,154,000 4.42 0.030 1 6 Experience Hours working (compared with 0) (2003-04 school year) 0 hours 4,270 1,154,000 0.20 0.010 0 1 Up to 20 hours/week 4,270 1,154,000 0.28 0.009 0 1 More than 20 hours/week 4,270 1,154,000 0.53 0.013 0 1 Hours volunteering (2004) 4,270 1,154,000 4.57 0.270 0 160 Social Integration (2004) Fine arts activities 4,270 1,154,000 0.26 0.010 0 2 School clubs 4,270 1,154,000 0.19 0.010 0 2 School sports 4,270 1,154,000 0.15 0.010 0 2 Study groups 4,270 1,154,000 0.46 0.020 0 2 Student-Faculty Relationship (2004) Faculty informal meeting 4,270 1,154,000 0.36 0.010 0 2 Faculty talk outside class 4,270 1,154,000 0.79 0.020 0 2 Meet academic advisor 4,270 1,154,000 0.71 0.020 0 2Postsecondary Post-First Year Experience Transfer 4,270 1,154,000 0.53 0.020 0 4 Ever married while enrolled 4,220 1,140,000 0.11 0.008 0 1 Ever had a child while enrolled 4,270 1,154,000 0.22 0.010 0 1 Became a part time student after first year 4,270 1,154,000 0.21 0.010 0 1 Satisfaction Satisfaction with Major (2009) 4,270 1,154,000 0.85 0.009 0 1 Satisfaction with Institution (2009) 4,270 1,154,000 0.88 0.007 0 1
Table 10. Descriptive Statistics of 2003-04 Beginning Postsecondary Students Under 24 Years of Age with a Traditional High School Diploma who Started at 2-year Institutions
SOURCE: 2004/09 Beginning Postsecondary Students Longitudinal Study Restricted Use Data Files
65

Sig. p Sig. p Sig. p Sig. p Sig. p
Intercept 3.08-1
*** 0.00 22.35-1
*** 0.00 177.54-1
*** 0.00 128.26 -1 *** 0.00 179.53 -1 *** 0.00Demographics Gender (Being Female) 1.62 *** 0.00 1.44 * 0.02 1.26 0.17 1.39 0.06 1.38 0.07 Race (compared to White) Black 2.27 -1 *** 0.00 2.32 -1 ** 0.00 2.54 -1 ** 0.00 2.13 -1 * 0.01 2.09 -1 * 0.02 Hispanic 1.43 -1 * 0.02 1.50 -1 0.06 1.60 -1 * 0.04 1.42 -1 0.10 1.32 -1 0.21 Other 1.24 -1 0.24 1.04 -1 0.88 1.13 -1 0.60 1.08 -1 0.73 1.08 -1 0.76 Income ($10,000) 1.11 0.36 1.33 0.08 1.49 0.05 1.58 * 0.02 1.56 * 0.03 Parental Education (BA+) 1.26 * 0.01 1.06 -1 0.63 1.10 -1 0.49 1.07 -1 0.63 1.17 -1 0.28 Parental Marital Status (married)1 1.21 0.10 1.04 -1 0.82 1.16 -1 0.35High School High School GPA 2.16 *** 0.00 1.87 * 0.01 1.64 * 0.03 1.61 * 0.03 SAT score (10 points) 1.05 -1 0.76 1.17 -1 0.39 1.15 -1 0.40 1.16 -1 0.37 Highest Math Class 1.17 0.18 1.11 0.43 1.11 0.35 1.08 0.50 Earned College Credit 1.73 ** 0.00 1.54 * 0.03 1.46 * 0.05 1.44 0.06 Earned AP Credit 1.33 -1 0.24 1.36 -1 0.23 1.35 -1 0.22 1.40 -1 0.20Postsecondary Pre-Enrollment Application Process Number of Schools Applied 1.06 0.57 1.02 0.83 1.02 0.86 1.01 -1 0.91 Received any Financial Aid (2003-04 school year) 1.00 1.00 1.10 -1 0.66 1.13 -1 0.57 1.15 -1 0.50 Student budget-all aid (2003-04) ($1,000) 1.64 ** 0.00 1.53 ** 0.01 1.40 * 0.04 1.43 * 0.03 Institutional Characteristics (of first institution) Institution size 1.16 0.64 1.42 0.31 1.15 0.69 1.11 0.77 Percent Minority Enrollment 1.33 0.50 1.15 0.76 1.04 0.92 1.03 -1 0.94 Experience Delayed enrollment 1.44 -1 0.09 1.32 -1 0.20 1.32 -1 0.15 1.22 -1 0.31 Began as a part-time Student (2003-2004 school year) 1.46 -1 * 0.03 1.35 -1 0.11 1.81 -1 ** 0.01 1.81 -1 ** 0.01Postsecondary First Year GPA (2003-04 school year) 2.09 *** 0.00 2.15 *** 0.00 2.10 *** 0.00 Selected Major 1st Year 1.35 * 0.03 1.44 ** 0.01 1.53 ** 0.00 Remedial Classes 1.32 -1 * 0.04 1.29 -1 0.06 1.23 -1 0.14 Highest degree expected (2004) 1.37 0.06 1.36 0.05 1.16 0.39 Experience Hours working (compared with 0) (2003-04 school year) Up to 20 hours/week 1.26 0.27 1.27 0.25 1.19 0.39 More than 20 hours/week 1.00 -1 0.72 1.00 -1 0.82 1.00 0.95 Hours volunteering (2004) 1.22 * 0.02 1.20 * 0.05 1.18 0.11 Social Integration (2004) Fine arts activities 1.02 0.83 1.03 0.74 1.00 0.96 School clubs 1.17 0.12 1.15 0.14 1.15 0.15 School sports 1.03 0.73 1.04 0.65 1.00 0.96 Study groups*not part of social integration index 1.23 -1 0.21 1.23 -1 0.21 1.30 -1 0.13 Student-Faculty Relationship (2004) Faculty informal meeting 1.06 0.57 1.03 0.69 1.06 0.50 Faculty talk outside class 1.61 ** 0.00 1.65 ** 0.00 1.73 *** 0.00 Meet academic advisor 1.27 0.15 1.24 0.21 1.21 0.26Postsecondary Post-First Year Experience Transfer 2.42 *** 0.00 Ever married while enrolled 1.48 0.09 1.33 0.23 Ever had a child while enrolled 1.67 -1 * 0.01 1.66 -1 * 0.02 Became a part time student after first year 1.56 -1 * 0.02 1.61 -1 * 0.02 Satisfaction Satisfaction with Major (2009) 1.23 0.37 Satisfaction with Institution (2009) 1.43 0.13* p<.05 ** p<.01 *** p<.001Notes:Parental marital status and high school academic variables are not included in this model because they are only asked of dependent children (parental marital status) and those <24 with traditional high school diplomas (hs academic variables). SOURCE: 2004/09 Beginning Postsecondary Students Longitudinal Study Restricted Use Data Files
Std. OR Std. ORStd. OR
Table 11. Predictors of 2- or 4-Year Postsecondary Completion of 2003-04 First Time Beginners who Started at 2-Year Postsecondary Institutions
N=2,700 R2=0.182126
Std. OR
5-All years of enrollment with
transfers and
N=2,700 R2=.210486
4-All years of enrollment
3-1st year of enrollment1-Demographics 2-Before enrollment
N= 4,100 R2=0.031651
N=2,400 R2=0.102407
N=2,400 R2=0.171378
Std. OR
66

Sig. p
Transfer 2.42 *** 0.00
GPA (2003-04 school year) 2.10 *** 0.00
Began as a part-time Student (2003-2004 school year) 1.81 -1 ** 0.01
Faculty talk outside class 1.73 *** 0.00
Ever had a child while enrolled 1.66 -1 * 0.02
High School GPA 1.61 * 0.03
Became a part time student after first year 1.61 -1 * 0.02
Income ($10,000) 1.56 * 0.03
Selected Major 1st Year 1.53 ** 0.00
Student budget-all aid (2003-04) ($1,000) 1.43 * 0.03* p<.05 ** p<.01 *** p<.001N= 2,700Notes:Includes beginning postsecondary students under 24 years old with traditional high school diplomas. Race and gender variables are excluded because they are considered non-malleable.SOURCE: 2004/09 Beginning Postsecondary Students Longitudinal Study Restricted Use Data Files
Std. OR
Table 12. Rank-Ordered Significant Odds Ratios of Predictors of 2- or 4-Year Postsecondary Completion of 2003-04 First Time Beginners who Started at 2-Year Postsecondary Institutions
67

VariableUnweighted N Weighted N Mean SE Min Max
Any postsecondary completion 1,380 286,000 0.56 0.022 0 1Demographics Gender Female 1,380 286,000 0.73 0.021 0 1 Race White 1,380 286,000 0.36 0.033 0 1 Black 1,380 286,000 0.25 0.018 0 1 Hispanic 1,380 286,000 0.32 0.036 0 1 Other 1,380 286,000 0.06 0.009 0 1 Income ($10,000) 1,380 286,000 2.19 0.080 0 27 Parental Education (BA+) 1,380 286,000 0.13 0.015 0 1Postsecondary Pre-Enrollment Application Process Number of Schools Applied 1,380 286,000 1.50 0.040 1 13 Received any Financial Aid (2003-04 school year) 1,380 286,000 0.92 0.010 0 1 Student budget-all aid (2003-04) ($1,000) 1,330 278,000 7.55 0.260 0 32 Institutional Characteristics (of first institution) Institution size 1,380 286,000 612.16 94.340 8 48,420 Experience Delayed enrollment 1,320 272,000 0.70 0.018 0 1 Began as a part-time Student (2003-2004 school year) 1,320 272,000 0.18 0.007 0 1Postsecondary First Year GPA (2003-04 school year) 1,380 286,000 3.17 0.050 0 4 Selected Major 1st Year 1,380 286,000 0.73 0.017 0 1 Remedial Classes 1,380 286,000 0.93 0.010 0 1 Highest degree expected (2004) 1,380 286,000 3.42 0.060 1 6 Experience Married when entered school 1,380 286,000 0.26 0.015 0 1 Had a child when entered school 1,380 286,000 0.47 0.018 0 1 Hours working (compared with 0) (2003-04 school year) 0 hours/week 1,380 286,000 0.42 0.017 0 1 Up to 20 hours/week 1,380 286,000 0.18 0.012 0 1 More than 20 hours/week 1,380 286,000 0.40 0.018 0 1 Hours volunteering (2004) 1,380 286,000 3.96 0.460 0 120Postsecondary Post-First Year Experience Transfer 1,380 286,000 0.28 0.020 0 3 Satisfaction Satisfaction with Major (2009) 1,380 286,000 0.85 0.014 0 1 Satisfaction with Institution (2009) 1,380 286,000 0.83 0.013 0 1
Table 13. Descriptive Statistics of 2003-04 Beginning Postsecondary Students Who Started at Less Than 2-Year Institutions
SOURCE: 2004/09 Beginning Postsecondary Students Longitudinal Study Restricted Use Data Files
68

Sig. p Sig. p Sig. p Sig. pIntercept 1.27 -1 0.31 1.54 0.37 1.75 0.32 1.94 0.33Demographics Gender (Being Female) 1.43 0.06 1.27 0.24 1.26 0.25 1.25 0.29 Race (compared to White) Black 1.39 -1 0.08 1.30 -1 0.20 1.05 -1 0.81 1.06 -1 0.77 Hispanic 1.89 *** 0.00 1.89 ** 0.00 1.96 ** 0.00 1.94 ** 0.00 Other 1.33 -1 0.16 1.27 -1 0.32 1.32 -1 0.28 1.32 -1 0.27 Income ($10,000) 1.18 0.16 1.19 0.20 1.17 0.24 1.16 0.25 Parental Education (BA+) 1.10 -1 0.67 1.20 -1 0.40 1.15 -1 0.55 1.15 -1 0.54Postsecondary Pre-Enrollment Application Process Number of Schools Applied 1.06 -1 0.45 1.07 -1 0.39 1.08 -1 0.32 Received any Financial Aid (2003-04 school year) 1.75 -1 0.17 1.76 -1 0.12 1.78 -1 0.13 Student budget-all aid (2003-04) ($1,000) 1.63 ** 0.00 1.66 ** 0.00 1.66 ** 0.00 Institutional Characteristics (of first institution) Institution size 1.20 -1 0.60 1.14 -1 0.71 1.13 -1 0.72 Experience Delayed enrollment 1.51 -1 * 0.01 1.76 -1 ** 0.01 1.75 -1 * 0.01 Began as a part-time Student (2003-2004 school year) 1.42 -1 0.25 1.54 -1 0.14 1.54 -1 0.14Postsecondary First Year GPA (2003-04 school year) 1.49 * 0.03 1.50 * 0.02 Selected Major 1st Year 1.65 -1 ** 0.00 1.66 -1 ** 0.00 Remedial Classes 1.29 0.42 1.30 0.41 Highest degree expected (2004) 1.27 -1 * 0.05 1.29 -1 * 0.04 Experience Married when entered school 1.72 * 0.03 1.71 * 0.03 Had a child when entered school 1.24 -1 0.36 1.24 -1 0.37 Hours working (compared with 0) (2003-04 school year) Up to 20 hours/week 1.12 -1 0.59 1.11 -1 0.60 More than 20 hours/week 1.03 -1 0.85 1.04 -1 0.79 Hours volunteering (2004) 1.08 -1 0.39 1.08 -1 0.40Postsecondary Post-First Year Experience Transfer 1.09 0.47 Satisfaction Satisfaction with Major (2009) 1.09 -1 0.79 Satisfaction with Institution (2009) 1.03 -1 0.92* p<.05 ** p<.01 *** p<.001Notes:Parental marital status and high school academic variables are not included in this model because they are only asked of dependent children (parental marital status) and those <24 with traditional high school diplomas (hs academic variables). Percentage minority enrollment is not included in this model because it is only asked of degree-granting title IV institutions and many of the less than 2-year institutions did not meet this criteria.SOURCE: 2004/09 Beginning Postsecondary Students Longitudinal Study Restricted Use Data Files
Std. OR Std. OR
Table 14. Predictors of Any Postsecondary Completion of 2003-04 First Time Beginners who Started at Less than 2-Year Postsecondary Institutions
Std. OR Std. OR
1-Demographics 2-Before enrollment3-1st year of enrollment
4-1st year of enrollment with
transfers and satisfaction
N= 1,400R2=0.043611
N=1,300 R2=0.072930
N=1,300 R2=0.100940
N=1,300 R2=0.101641
69

Sig. p
Delayed enrollment 1.75 -1 * 0.01
Married when entered school 1.71 * 0.03
Student budget-all aid (2003-04) ($1,000) 1.66 ** 0.00
Selected major 1st year 1.66 -1 ** 0.00
Postsecondary GPA (2003-04 school year) 1.50 * 0.02
Highest degree expected (2004) 1.29 -1 * 0.04
Std. OR
* p<.05 ** p<.01 *** p<.001N=1,300Notes:Parental marital status and high school academic variables are not included in this model because they are only asked of dependent children (parental marital status) and those <24 with traditional high school diplomas (hs academic variables). Percentage minority enrollment is not included in this model because it is only asked of degree-granting title IV institutions and many of the less than 2-year institutions did not meet this criteria. Race and gender variables are not included becuase they are considered non-malleable.SOURCE: 2004/09 Beginning Postsecondary Students Longitudinal Study Restricted Use Data Files
Table 15. Rank-Ordered Significant Odds Ratios of Predictors of Any Postsecondary Completion of 2003-04 First Time Beginners who Started at Less than 2-Year Postsecondary Institutions
70

VariableDemographics Parental Education (BA+) 1.26
Gender (being female) 1.31 1.26 Being black (compared to white) 1.46 -1 2.09 -1
Being Hispanic (compared to white) 1.43 -1 1.94 Income ($10,000) 1.41 1.38 1.56High School High School GPA 1.63 1.56 1.61 †
Highest math class 1.14 †Postsecondary Pre-Enrollment Delayed enrollment 1.74 -1 1.75 -1
Began as a part-time Student (2003-2004 school year) 1.30 1.90 -1 1.81 -1
Ever a part-time student 2.57 -1 † † † Became a part time student after first year † 3.24 -1 1.61 -1 † Married when entered school † † 1.71 Had a child when entered school 2.01 -1 † † Ever had a child while enrolled † 2.29 -1 1.66 -1 † Selectivity † 3.65 † † Number of Schools Applied 1.15 1.28 Student budget-all aid (2003-04) ($1,000) 1.26 1.43 1.66 Highest degree expected (2004) 1.29 -1
Postsecondary Post-Enrollment Selected Major 1st Year 1.21 1.53 1.66 -1
GPA (2004) 1.96 3.76 2.10 1.50 Hours volunteering (2004) 1.17 -1
Faculty talk outside class † 1.19 1.73 † Meet academic advisor † 1.23 † School clubs † 1.14 † Worked more than 20 hours/week 1.23 -1
Transferring (continuous) 1.28 -1 2.87 -1 2.42 Satisfaction with Major (2009) 1.26 1.36 Satisfaction with Institution (2009) 1.95 1.93
Table 16. Summary of Significant Predictors of Postsecondary Completion Across Institution Levels Among 2003-04 First Time Beginners
Note: In some instances, certain variables were not included in the model; † denotes N/A.SOURCE: 2004/09 Beginning Postsecondary Students Longitudinal Study Restricted Use Data Files
All students4-year
institutions2-year
institutions<2-year
institutions
71

Risk indicators TotalDid not
complete CompletedTotal 100 35.6 64.4
Overall risk indicatorRisky (2 or more risks) 100 76.0 24.0Not risky 100 22.1 77.9
First-year GPARisky (less than a C) 100 77.6 22.4Not risky 100 32.5 67.5
TransferRisky (1 or more) 100 69.4 30.6Not risky 100 26.9 73.1
Started part-timeRisky 100 57.9 42.1Not Risky 100 35.6 64.4
Became part-timeRisky 100 59.3 40.7Not risky 100 32.2 67.8
Had a childRisky 100 77.1 22.9Not risky 100 34.4 65.6
Not satisfied with educationRisky 100 61.7 38.3Not risky 100 35.2 64.8
Non-selective schoolRisky 100 71.1 28.9Not risky 100 33.6 66.4
Table 17. Percentage of 2003-04 beginning postsecondary students who started at 4-year institutions by 4-year degree attainment and risk indicators
Percent
Weighted N=1,372,000Notes:Includes beginning postsecondary students under 24 years old with traditional high school diplomasSOURCE: 2004/09 Beginning Postsecondary Students Longitudinal Study Restricted Use Data Files
72
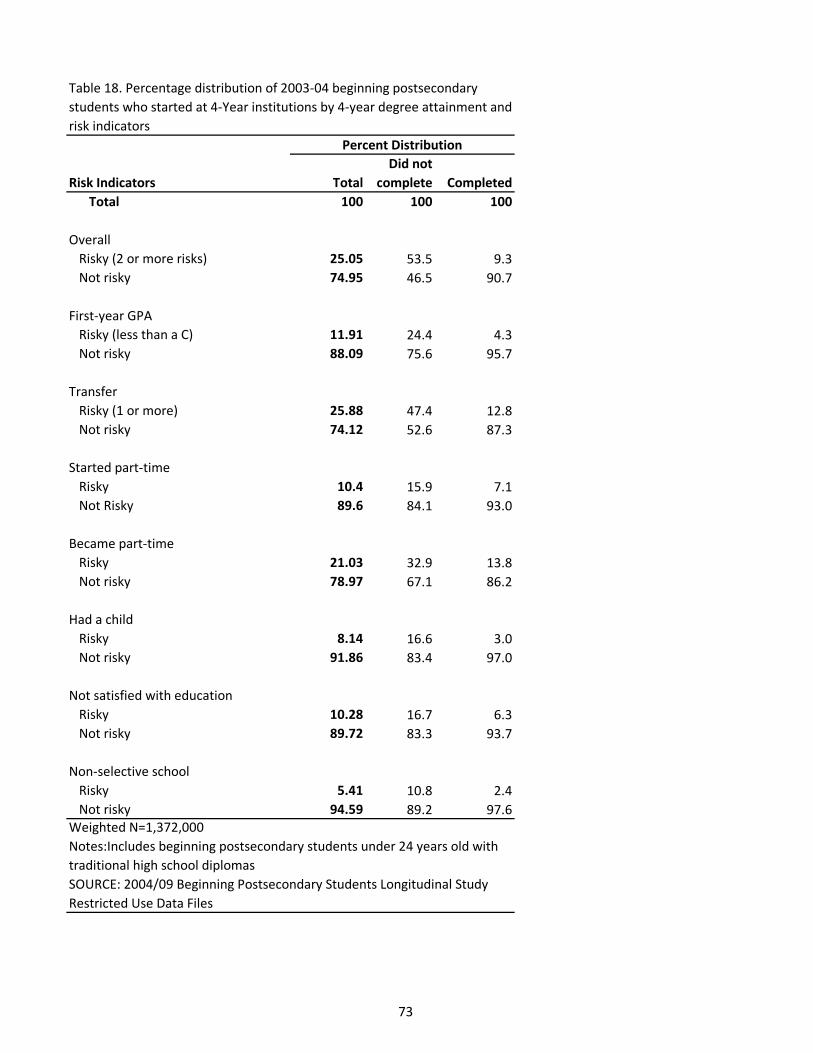
Risk Indicators TotalDid not
complete CompletedTotal 100 100 100
OverallRisky (2 or more risks) 25.05 53.5 9.3Not risky 74.95 46.5 90.7
First-year GPARisky (less than a C) 11.91 24.4 4.3Not risky 88.09 75.6 95.7
TransferRisky (1 or more) 25.88 47.4 12.8Not risky 74.12 52.6 87.3
Started part-timeRisky 10.4 15.9 7.1Not Risky 89.6 84.1 93.0
Became part-timeRisky 21.03 32.9 13.8Not risky 78.97 67.1 86.2
Had a childRisky 8.14 16.6 3.0Not risky 91.86 83.4 97.0
Not satisfied with educationRisky 10.28 16.7 6.3Not risky 89.72 83.3 93.7
Non-selective schoolRisky 5.41 10.8 2.4Not risky 94.59 89.2 97.6
Percent Distribution
Table 18. Percentage distribution of 2003-04 beginning postsecondary students who started at 4-Year institutions by 4-year degree attainment and risk indicators
Weighted N=1,372,000Notes:Includes beginning postsecondary students under 24 years old with traditional high school diplomasSOURCE: 2004/09 Beginning Postsecondary Students Longitudinal Study Restricted Use Data Files
73

Sig. p Sig. p Sig. pIntercept 72.32 -1 *** 0.00 2260.70 -1 *** 0.00 126.83 -1 *** 0.00Demographics Gender (Being Female) 1.29 0.06 1.23 0.35 1.40 0.19 Race (compared to White) Black Hispanic Other Income ($10,000) 1.29 ** 0.01 1.77 0.06 1.92 ** 0.00 Parental Education (BA+) 1.08 0.38 1.26 0.36 1.04 0.90 Parental Marital Status (married)1
High School GPA 1.64 *** 0.00 1.66 * 0.04 1.59 0.11 SAT score (10 points) 1.02 0.91 1.30 0.39 1.32 0.30 Highest Math Class 1.20 * 0.02 1.28 0.09 1.14 0.37 Earned College Credit 1.10 0.50 1.04 -1 0.92 1.37 0.41 Earned AP Credit 1.03 0.84 1.05 -1 0.93 1.19 -1 0.67Postsecondary Pre-Enrollment Application Process Number of Schools Applied 1.15 0.06 1.19 0.23 1.04 0.83 Received any Financial Aid 1.00 0.99 3.10 ** 0.00 1.83 * 0.04 Student budget-all aid (2003-04) ($1,000) 1.32 *** 0.00 1.14 -1 0.59 1.17 0.45 Institutional Characteristics Institution size 1.30 * 0.05 1.28 0.44 1.11 -1 0.73 Percent Minority Enrollment 1.33 0.27 2.36 0.37 2.35 0.44 Experience Delayed enrollment 2.51 -1 *** 0.00 1.22 0.58 1.29 -1 0.52 Part-time Student (2004) 1.42 -1 * 0.01 1.41 -1 0.26 1.41 -1 0.28Postsecondary Post-Enrollment GPA (2004) 2.21 *** 0.00 1.89 *** 0.00 1.42 0.14 Selected Major 1st Year 1.24 * 0.03 1.76 * 0.03 1.03 0.89 Remedial Classes 1.06 -1 0.69 1.26 -1 0.27 1.02 -1 0.93 Highest degree expected (2004) 1.01 0.84 1.41 * 0.03 1.18 0.28 Experience Married when entered school Had a child when entered school Hours working (compared with 0) (2004) Up to 20 hours/week 1.15 0.16 1.15 0.58 1.47 0.17 More than 20 hours/week 1.37 -1 * 0.01 1.19 0.54 1.80 0.06
Hours volunteering (2004) 1.29 -1 * 0.02 1.29 * 0.04 1.01 0.97 Satisfaction with Major (2009) Satisfaction with Institution (2009) Transferring (continuous) Ever a part-time student
Table 19. Predictors of Any Postsecondary Completion of 2003-04 First Time Beginners at Any Postsecondary Institution, by race/ethnicity
Black HispanicWhite
* p<.05 ** p<.01 *** p<.001Notes:Includes beginning postsecondary students under 24 years old with traditional high school diplomas. 1 Parental marital status was only asked of dependent children.SOURCE: 2004/09 Beginning Postsecondary Students Longitudinal Study Restricted Use Data Files
N=6,900 R2=0.199673
N=1,040 R2=0.199223
Std. ORStd. ORStd. OR
N= 910 R2=0.163395
74

Sig. p Sig. pIntercept 44.74 -1 *** 0.00 35.21 -1 *** 0.00Demographics Gender (Being Female) 1.28 ** 0.01 1.14 0.17 Race (compared to White) Black 1.64 -1 *** 0.00 1.35 -1 * 0.04 Hispanic 1.56 -1 ** 0.01 1.30 -1 0.06 Other 1.23 -1 0.11 1.08 0.58 Income ($10,000) 1.30 ** 0.00 1.40 ** 0.01 Parental Education (BA+) 1.45 *** 0.00 1.04 0.71 Parental Marital Status (married)1
High School GPA SAT score (10 points) Highest Math Class Earned College Credit Earned AP CreditPostsecondary Pre-Enrollment Application Process Number of Schools Applied 1.30 *** 0.00 1.40 *** 0.00 Received any Financial Aid 1.51 *** 0.00 1.35 * 0.03 Student budget-all aid (2003-04) ($1,000) 1.37 *** 0.00 2.19 *** 0.00 Institutional Characteristics Institution size 1.77 *** 0.00 1.25 -1 0.12 Percent Minority Enrollment 1.87 * 0.03 1.28 0.39 Experience Delayed enrollment Part-time Student (2004)Postsecondary Post-Enrollment GPA (2004) 2.59 *** 0.00 1.64 *** 0.00 Selected Major 1st Year 1.21 * 0.04 1.34 ** 0.00 Remedial Classes 1.32 -1 * 0.02 1.05 0.67 Highest degree expected (2004) 1.12 0.10 1.13 ** 0.01 Experience Married when entered school Had a child when entered school Hours working (compared with 0) (2004) Up to 20 hours/week More than 20 hours/week
Hours volunteering (2004) 1.02 -1 0.65 1.09 0.16 Satisfaction with Major (2009) Satisfaction with Institution (2009) Transferring (continuous) Ever a part-time student
Table 20. Predictors of Any Postsecondary Completion of 2003-04 First Time Beginners at Any Postsecondary Institution, by student status
Traditional StudentsNon-Traditional
StudentsN=7,700
R2=0.171194N=5,700
R2=0.090824Std. OR Std. OR
* p<.05 ** p<.01 *** p<.001Notes:Parental marital status and high school academic variables are not included in this model because they are only asked of dependent children (parental marital status) and those <24 with traditional high school diplomas (hs academic variables). SOURCE: 2004/09 Beginning Postsecondary Students Longitudinal Study Restricted Use Data Files
75
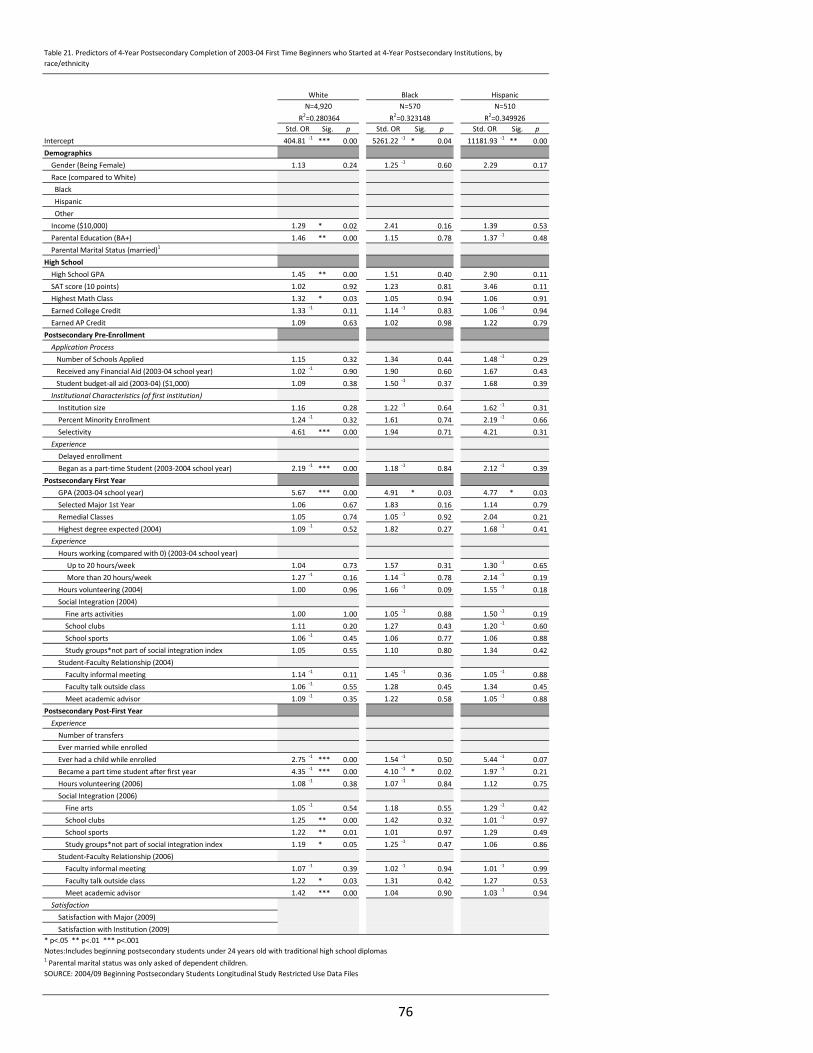
Sig. p Sig. p Sig. pIntercept 404.81 -1 *** 0.00 5261.22 -1 * 0.04 11181.93 -1 ** 0.00Demographics Gender (Being Female) 1.13 0.24 1.25 -1 0.60 2.29 0.17 Race (compared to White) Black Hispanic Other Income ($10,000) 1.29 * 0.02 2.41 0.16 1.39 0.53 Parental Education (BA+) 1.46 ** 0.00 1.15 0.78 1.37 -1 0.48 Parental Marital Status (married)1
High School High School GPA 1.45 ** 0.00 1.51 0.40 2.90 0.11 SAT score (10 points) 1.02 0.92 1.23 0.81 3.46 0.11 Highest Math Class 1.32 * 0.03 1.05 0.94 1.06 0.91 Earned College Credit 1.33 -1 0.11 1.14 -1 0.83 1.06 -1 0.94 Earned AP Credit 1.09 0.63 1.02 0.98 1.22 0.79Postsecondary Pre-Enrollment Application Process Number of Schools Applied 1.15 0.32 1.34 0.44 1.48 -1 0.29 Received any Financial Aid (2003-04 school year) 1.02 -1 0.90 1.90 0.60 1.67 0.43 Student budget-all aid (2003-04) ($1,000) 1.09 0.38 1.50 -1 0.37 1.68 0.39 Institutional Characteristics (of first institution) Institution size 1.16 0.28 1.22 -1 0.64 1.62 -1 0.31 Percent Minority Enrollment 1.24 -1 0.32 1.61 0.74 2.19 -1 0.66 Selectivity 4.61 *** 0.00 1.94 0.71 4.21 0.31 Experience Delayed enrollment Began as a part-time Student (2003-2004 school year) 2.19 -1 *** 0.00 1.18 -1 0.84 2.12 -1 0.39Postsecondary First Year GPA (2003-04 school year) 5.67 *** 0.00 4.91 * 0.03 4.77 * 0.03 Selected Major 1st Year 1.06 0.67 1.83 0.16 1.14 0.79 Remedial Classes 1.05 0.74 1.05 -1 0.92 2.04 0.21 Highest degree expected (2004) 1.09 -1 0.52 1.82 0.27 1.68 -1 0.41 Experience Hours working (compared with 0) (2003-04 school year) Up to 20 hours/week 1.04 0.73 1.57 0.31 1.30 -1 0.65 More than 20 hours/week 1.27 -1 0.16 1.14 -1 0.78 2.14 -1 0.19 Hours volunteering (2004) 1.00 0.96 1.66 -1 0.09 1.55 -1 0.18 Social Integration (2004) Fine arts activities 1.00 1.00 1.05 -1 0.88 1.50 -1 0.19 School clubs 1.11 0.20 1.27 0.43 1.20 -1 0.60 School sports 1.06 -1 0.45 1.06 0.77 1.06 0.88 Study groups*not part of social integration index 1.05 0.55 1.10 0.80 1.34 0.42 Student-Faculty Relationship (2004) Faculty informal meeting 1.14 -1 0.11 1.45 -1 0.36 1.05 -1 0.88 Faculty talk outside class 1.06 -1 0.55 1.28 0.45 1.34 0.45 Meet academic advisor 1.09 -1 0.35 1.22 0.58 1.05 -1 0.88Postsecondary Post-First Year Experience Number of transfers Ever married while enrolled Ever had a child while enrolled 2.75 -1 *** 0.00 1.54 -1 0.50 5.44 -1 0.07 Became a part time student after first year 4.35 -1 *** 0.00 4.10 -1 * 0.02 1.97 -1 0.21 Hours volunteering (2006) 1.08 -1 0.38 1.07 -1 0.84 1.12 0.75 Social Integration (2006) Fine arts 1.05 -1 0.54 1.18 0.55 1.29 -1 0.42 School clubs 1.25 ** 0.00 1.42 0.32 1.01 -1 0.97 School sports 1.22 ** 0.01 1.01 0.97 1.29 0.49 Study groups*not part of social integration index 1.19 * 0.05 1.25 -1 0.47 1.06 0.86 Student-Faculty Relationship (2006) Faculty informal meeting 1.07 -1 0.39 1.02 -1 0.94 1.01 -1 0.99 Faculty talk outside class 1.22 * 0.03 1.31 0.42 1.27 0.53 Meet academic advisor 1.42 *** 0.00 1.04 0.90 1.03 -1 0.94 Satisfaction Satisfaction with Major (2009) Satisfaction with Institution (2009)* p<.05 ** p<.01 *** p<.001Notes:Includes beginning postsecondary students under 24 years old with traditional high school diplomas1 Parental marital status was only asked of dependent children. SOURCE: 2004/09 Beginning Postsecondary Students Longitudinal Study Restricted Use Data Files
Table 21. Predictors of 4-Year Postsecondary Completion of 2003-04 First Time Beginners who Started at 4-Year Postsecondary Institutions, by race/ethnicity
BlackN=570
R2=0.323148
HispanicN=510
R2=0.349926
WhiteN=4,920
R2=0.280364Std. OR Std. OR Std. OR
76

Sig. p Sig. pIntercept 86.83 -1 *** 0.00 158.99 -1 *** 0.00Demographics Gender (Being Female) 1.36 ** 0.01 1.02 -1 0.91 Race (compared to White) Black 1.23 -1 0.34 1.27 -1 0.44 Hispanic 1.50 -1 0.06 1.53 -1 0.23 Other 1.06 -1 0.76 1.04 -1 0.91 Income ($10,000) 1.40 ** 0.00 1.15 0.47 Parental Education (BA+) 1.39 ** 0.00 1.25 0.30 Parental Marital Status (married)1
High School High School GPA SAT score (10 points) Highest Math Class Earned College Credit Earned AP CreditPostsecondary Pre-Enrollment Application Process Number of Schools Applied 1.23 * 0.04 1.11 0.61 Received any Financial Aid (2003-04 school year) 1.11 0.50 1.05 0.84 Student budget-all aid (2003-04) ($1,000) 1.11 0.24 1.25 0.29 Institutional Characteristics (of first institution) Institution size 1.25 0.06 1.09 -1 0.66 Percent Minority Enrollment 1.17 -1 0.50 1.34 -1 0.43 Selectivity 4.78 *** 0.00 5.10 ** 0.00 Experience Delayed enrollment Began as a part-time Student (2003-2004 school year)Postsecondary First Year GPA (2003-04 school year) 6.21 *** 0.00 2.38 *** 0.00 Selected Major 1st Year 1.16 0.17 1.13 -1 0.53 Remedial Classes 1.06 -1 0.67 1.08 0.73 Highest degree expected (2004) 1.09 -1 0.48 1.56 * 0.03 Experience Hours working (compared with 0) (2003-04 school year) Up to 20 hours/week More than 20 hours/week Hours volunteering (2004) 1.17 -1 ** 0.01 1.01 0.97 Social Integration (2004) Fine arts activities 1.01 0.86 1.13 -1 0.35 School clubs 1.01 0.90 1.24 0.18 School sports 1.01 -1 0.89 1.03 -1 0.83 Study groups*not part of social integration index 1.15 0.08 1.01 -1 0.94 Student-Faculty Relationship (2004) Faculty informal meeting 1.04 -1 0.60 1.05 -1 0.73 Faculty talk outside class 1.05 0.59 1.13 0.39 Meet academic advisor 1.17 -1 0.06 1.06 -1 0.73Postsecondary Post-First Year Experience Number of transfers Ever married while enrolled 2.07 -1 ** 0.00 1.11 -1 0.72 Ever had a child while enrolled 2.04 -1 ** 0.00 2.33 -1 ** 0.00 Became a part time student after first year 3.79 -1 *** 0.00 2.33 -1 ** 0.00 Hours volunteering (2006) 1.03 -1 0.73 1.10 -1 0.58 Social Integration (2006)
Fine arts 1.09 -1 0.27 1.13 0.43 School clubs 1.25 *** 0.00 1.04 0.74 School sports 1.24 ** 0.00 1.19 0.22 Study groups*not part of social integration index 1.10 0.20 1.04 0.79 Student-Faculty Relationship (2006) Faculty informal meeting 1.08 -1 0.28 1.09 0.53 Faculty talk outside class 1.22 * 0.01 1.35 * 0.03 Meet academic advisor 1.12 0.21 1.41 * 0.03 Satisfaction Satisfaction with Major (2009) Satisfaction with Institution (2009)
Std. OR Std. OR
* p<.05 ** p<.01 *** p<.001Notes:Parental marital status and high school academic variables are not included in this model because they are only asked of dependent children (parental marital status) and those <24 with traditional high school diplomas (hs academic variables). SOURCE: 2004/09 Beginning Postsecondary Students Longitudinal Study Restricted Use Data Files
Table 22. Predictors of 4-Year Postsecondary Completion of 2003-04 First Time Beginners who Started at 4-Year Postsecondary Institutions, student status
Traditional StudentsNon-Traditional
StudentsN=5,750
R2=0.255272N=1,430
R2=0.238982
77

Sig. p Sig. p Sig. pIntercept 255.81 -1 *** 0.00 278.85 -1 * 0.01 11.68 -1 0.41Demographics Gender (Being Female) 1.46 0.08 2.44 0.11 1.06 -1 0.91 Race (compared to White) Black Hispanic Other Income ($10,000) 1.58 0.06 1.48 0.63 1.22 0.80 Parental Education (BA+) 1.26 -1 0.18 2.08 0.13 1.72 0.38 Parental Marital Status (married)1
High School High School GPA 2.15 * 0.03 1.18 0.78 1.12 0.88 SAT score (10 points) 1.27 -1 0.32 1.77 0.34 1.29 -1 0.69 Highest Math Class 1.13 0.47 1.14 -1 0.73 1.28 0.58 Earned College Credit 1.48 0.15 2.82 0.22 1.59 0.57 Earned AP Credit 1.12 -1 0.75 4.26 -1 0.25 1.82 -1 0.58Postsecondary Pre-Enrollment Application Process Number of Schools Applied 1.11 -1 0.45 1.10 0.75 1.09 0.84 Received any Financial Aid (2003-04 school year) 1.39 -1 0.23 1.75 0.46 1.45 0.57 Student budget-all aid (2003-04) ($1,000) 1.69 * 0.01 1.94 -1 0.42 1.31 0.66 Institutional Characteristics (of first institution) Institution size 1.71 0.29 2.41 -1 0.49 1.19 -1 0.86 Percent Minority Enrollment 1.27 -1 0.96 7.03 -1 0.83 10.82 0.63 Experience Delayed enrollment 1.52 -1 0.08 1.93 0.28 1.92 -1 0.38 Began as a part-time Student (2003-2004 school year) 1.89 -1 * 0.02 2.08 -1 0.30 1.82 -1 0.51Postsecondary First Year GPA (2003-04 school year) 2.34 *** 0.00 2.20 0.09 1.21 0.75 Selected Major 1st Year 1.40 * 0.04 2.43 0.13 1.29 -1 0.65 Remedial Classes 1.33 -1 0.09 1.46 -1 0.46 1.53 -1 0.45 Highest degree expected (2004) 1.25 0.25 1.20 -1 0.73 1.74 0.34 Experience Hours working (compared with 0) (2003-04 school year) Up to 20 hours/week 1.97 ** 0.01 1.75 -1 0.41 3.38 -1 0.11 More than 20 hours/week 1.24 0.33 1.86 -1 0.26 2.02 -1 0.28 Hours volunteering (2004) 1.30 0.05 1.09 -1 0.80 1.34 0.35 Social Integration (2004) Fine arts activities 1.11 0.32 1.03 0.91 1.10 0.83 School clubs 1.05 0.71 1.30 0.34 1.67 0.20 School sports 1.04 0.71 1.26 0.56 1.01 0.98 Study groups*not part of social integration index 1.09 -1 0.26 1.52 0.33 1.70 -1 0.49 Student-Faculty Relationship (2004) Faculty informal meeting 1.12 0.33 1.01 -1 0.98 1.28 -1 0.43 Faculty talk outside class 1.94 *** 0.00 1.82 0.35 1.71 0.41 Meet academic advisor 1.18 0.47 1.32 -1 0.58 1.21 0.75Postsecondary Post-First Year Experience Transfer Ever married while enrolled 1.37 0.31 1.58 0.69 4.18 0.21 Ever had a child while enrolled 1.71 -1 0.06 1.58 -1 0.43 2.44 -1 0.22 Became a part time student after first year 1.77 -1 * 0.02 1.13 -1 0.83 1.15 -1 0.84 Satisfaction Satisfaction with Major (2009) Satisfaction with Institution (2009)* p<.05 ** p<.01 *** p<.001Notes:Includes beginning postsecondary students under 24 years old with traditional high school diplomas1 Parental marital status was only asked of dependent children. SOURCE: 2004/09 Beginning Postsecondary Students Longitudinal Study Restricted Use Data Files
Std. OR Std. OR Std. OR
Table 23. Predictors of 2- or 4-Year Postsecondary Completion of 2003-04 First Time Beginners who Started at 2-Year Postsecondary Institutions, by race/ethnicity
Hispanic
N=340 R2=0.191916
White
N=1,700R2=0.218336
Black
N=410 R2=0.170667
78
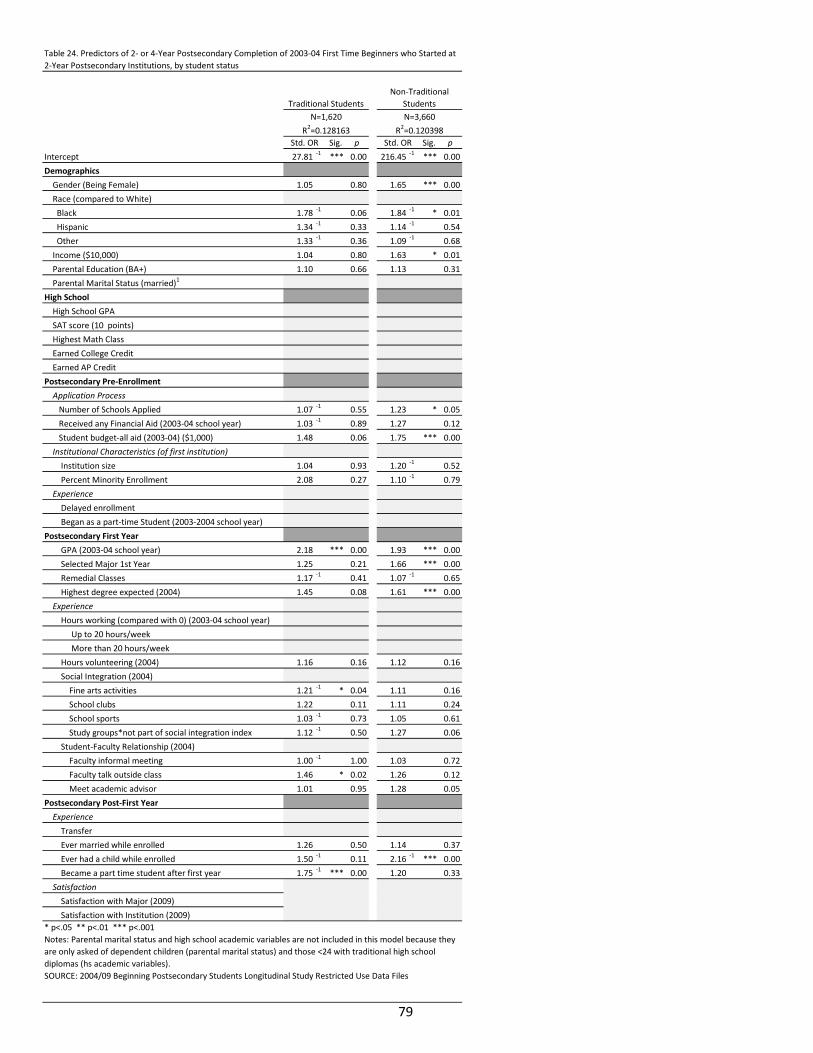
Sig. p Sig. pIntercept 27.81 -1 *** 0.00 216.45 -1 *** 0.00Demographics Gender (Being Female) 1.05 0.80 1.65 *** 0.00 Race (compared to White) Black 1.78 -1 0.06 1.84 -1 * 0.01 Hispanic 1.34 -1 0.33 1.14 -1 0.54 Other 1.33 -1 0.36 1.09 -1 0.68 Income ($10,000) 1.04 0.80 1.63 * 0.01 Parental Education (BA+) 1.10 0.66 1.13 0.31 Parental Marital Status (married)1
High School High School GPA SAT score (10 points) Highest Math Class Earned College Credit Earned AP CreditPostsecondary Pre-Enrollment Application Process Number of Schools Applied 1.07 -1 0.55 1.23 * 0.05 Received any Financial Aid (2003-04 school year) 1.03 -1 0.89 1.27 0.12 Student budget-all aid (2003-04) ($1,000) 1.48 0.06 1.75 *** 0.00 Institutional Characteristics (of first institution) Institution size 1.04 0.93 1.20 -1 0.52 Percent Minority Enrollment 2.08 0.27 1.10 -1 0.79 Experience Delayed enrollment Began as a part-time Student (2003-2004 school year)Postsecondary First Year GPA (2003-04 school year) 2.18 *** 0.00 1.93 *** 0.00 Selected Major 1st Year 1.25 0.21 1.66 *** 0.00 Remedial Classes 1.17 -1 0.41 1.07 -1 0.65 Highest degree expected (2004) 1.45 0.08 1.61 *** 0.00 Experience Hours working (compared with 0) (2003-04 school year) Up to 20 hours/week More than 20 hours/week Hours volunteering (2004) 1.16 0.16 1.12 0.16 Social Integration (2004) Fine arts activities 1.21 -1 * 0.04 1.11 0.16 School clubs 1.22 0.11 1.11 0.24 School sports 1.03 -1 0.73 1.05 0.61 Study groups*not part of social integration index 1.12 -1 0.50 1.27 0.06 Student-Faculty Relationship (2004) Faculty informal meeting 1.00 -1 1.00 1.03 0.72 Faculty talk outside class 1.46 * 0.02 1.26 0.12 Meet academic advisor 1.01 0.95 1.28 0.05Postsecondary Post-First Year Experience Transfer Ever married while enrolled 1.26 0.50 1.14 0.37 Ever had a child while enrolled 1.50 -1 0.11 2.16 -1 *** 0.00 Became a part time student after first year 1.75 -1 *** 0.00 1.20 0.33 Satisfaction Satisfaction with Major (2009) Satisfaction with Institution (2009)* p<.05 ** p<.01 *** p<.001Notes: Parental marital status and high school academic variables are not included in this model because they are only asked of dependent children (parental marital status) and those <24 with traditional high school diplomas (hs academic variables). SOURCE: 2004/09 Beginning Postsecondary Students Longitudinal Study Restricted Use Data Files
Table 24. Predictors of 2- or 4-Year Postsecondary Completion of 2003-04 First Time Beginners who Started at 2-Year Postsecondary Institutions, by student status
Traditional StudentsNon-Traditional
StudentsN=1,620
R2=0.128163N=3,660
R2=0.120398Std. ORStd. OR
79

Appendix B. Technical Appendix This technical appendix provides methodological details about our analyses. It includes a discussion of how we estimated standard errors in our models and how we generated variables for analysis. For additional methodological information on NELS and BPS, see the following methodology reports from NCES which contain information on sampling, questionnaire design, data collection, and weighting for NELS and BPS, respectively.
Haggerty, C., Dugoni, B., Reed, L., Cederlund, A., & Taylor, J. (1996). National Education Longitudinal Study: 1988-1994 Methodology Report (NCES 96-174). National Center for Education Statistics, Institute of Education Sciences, U.S. Department of Education. Washington, DC. Retrieved June 20, 2013, from http://nces.ed.gov/pubs/96174.pdf
Wine, J., Janson, N., & Wheeless, S. (2011). 2004/09 Beginning Postsecondary Students Longitudinal Study (BPS: 04/09) Full-scale Methodology Report (NCES 2012-246). National Center for Education Statistics, Institute of Education Sciences, U.S. Department of Education. Washington, DC. Retrieved June 20, 2013, from http://nces.ed.gov/pubs2012/2012246.pdf
Sampling error Both BPS and NELS are complex surveys. As a result, regular variance estimation strategies would underestimate the margins of error associated with estimates. Thus, we estimated standard errors for BPS using Taylor series approximations, balanced repeated replication (BRR, using replicate weights WTB001 – WTB200), and we estimated standard errors for NELS using Taylor series approximations, with replication (WR).
The variance estimation formulas we used require at least two primary sampling units (PSU) in each stratum because estimates of the variances are calculated using the between-primary sampling unit within-stratum variance component. We used SAS-callable SUDAAN to run the logistic regressions for NELS and BPS. When running the NELS logistic regressions, due to weighting, some observations were omitted from the analysis and therefore there were missing values. This resulted in empty clusters (or strata with only one PSU rather than the necessary two). In order to compute the variance contribution for the strata (the square of the taylorized deviation), SUDAAN used the deviation from the overall mean of that sampling stage. When running the descriptive statistics for NELS we used SAS (using the procedures proc surveymeans and proc surveyfreq); unlike SUDAAN, SAS omits the single-cluster strata from the variance estimates. The result of this is that the standard errors generated by SAS and SUDAAN are slightly different (on the order of one one-thousandth of a point).
NELS Variable Descriptions
Demographics Variable Description Gender Students were asked their sex (male or female).
Family income
In 1992, parents were asked to estimate their total gross income from all sources before taxes in 1991. Respondents were given 15 options (from none to $200,000 or more), but, for this analyses, this variable is treated as a continuous variable.
Family composition
This variable indicates the family or household composition and is based entirely on second follow-up (1990, when on-track students would have been in 10th grade) parent questionnaire items which
80
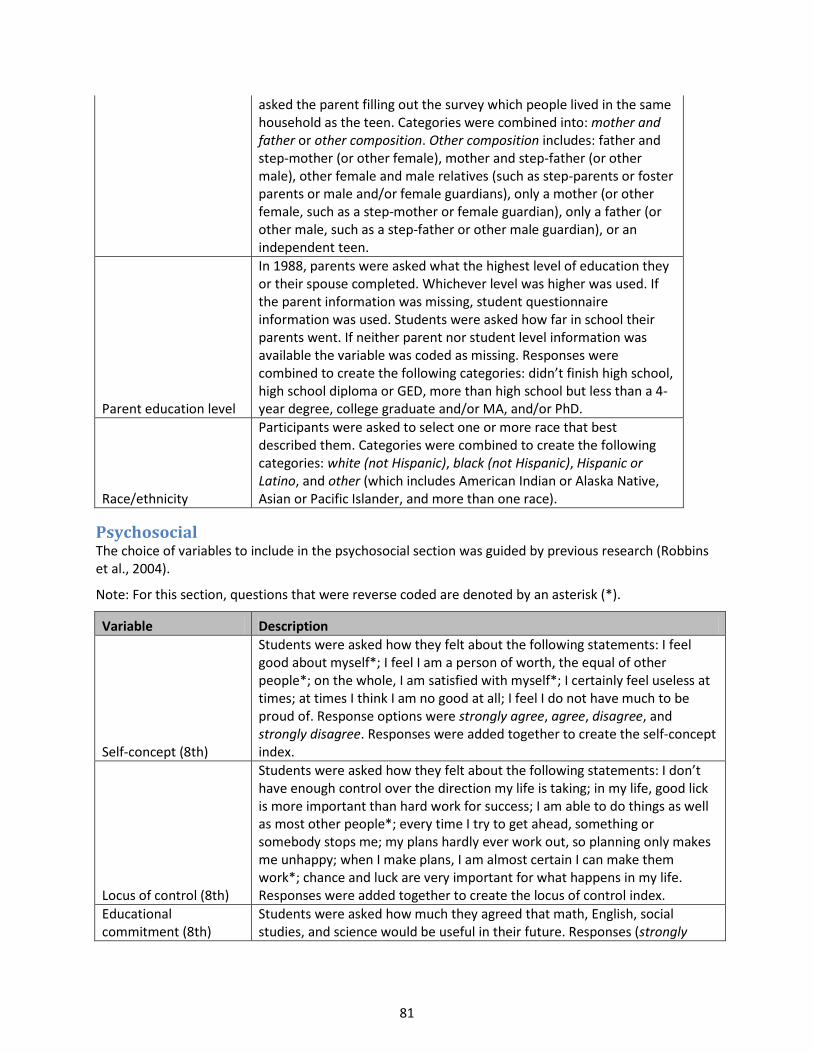
asked the parent filling out the survey which people lived in the same household as the teen. Categories were combined into: mother and father or other composition. Other composition includes: father and step-mother (or other female), mother and step-father (or other male), other female and male relatives (such as step-parents or foster parents or male and/or female guardians), only a mother (or other female, such as a step-mother or female guardian), only a father (or other male, such as a step-father or other male guardian), or an independent teen.
Parent education level
In 1988, parents were asked what the highest level of education they or their spouse completed. Whichever level was higher was used. If the parent information was missing, student questionnaire information was used. Students were asked how far in school their parents went. If neither parent nor student level information was available the variable was coded as missing. Responses were combined to create the following categories: didn’t finish high school, high school diploma or GED, more than high school but less than a 4-year degree, college graduate and/or MA, and/or PhD.
Race/ethnicity
Participants were asked to select one or more race that best described them. Categories were combined to create the following categories: white (not Hispanic), black (not Hispanic), Hispanic or Latino, and other (which includes American Indian or Alaska Native, Asian or Pacific Islander, and more than one race).
Psychosocial The choice of variables to include in the psychosocial section was guided by previous research (Robbins et al., 2004).
Note: For this section, questions that were reverse coded are denoted by an asterisk (*).
Variable Description
Self-concept (8th)
Students were asked how they felt about the following statements: I feel good about myself*; I feel I am a person of worth, the equal of other people*; on the whole, I am satisfied with myself*; I certainly feel useless at times; at times I think I am no good at all; I feel I do not have much to be proud of. Response options were strongly agree, agree, disagree, and strongly disagree. Responses were added together to create the self-concept index.
Locus of control (8th)
Students were asked how they felt about the following statements: I don’t have enough control over the direction my life is taking; in my life, good lick is more important than hard work for success; I am able to do things as well as most other people*; every time I try to get ahead, something or somebody stops me; my plans hardly ever work out, so planning only makes me unhappy; when I make plans, I am almost certain I can make them work*; chance and luck are very important for what happens in my life. Responses were added together to create the locus of control index.
Educational commitment (8th)
Students were asked how much they agreed that math, English, social studies, and science would be useful in their future. Responses (strongly
81

agree, agree, disagree, and strongly disagree) were reversed coded and added together. Higher scores indicate the student believed school was important to his or her future.
Importance of good grades to student (10th)
In 10th grade, students were asked how important good grades were to them. Responses were not important, somewhat important, important, and very important.
Student plans to attend college sometime after HS (10th)
In 10th grade, students were asked if they planned to go to college after graduating from high school. Responses were combined into no, yes, and don’t know.
How far student thinks he/she will go in school (8th)
In 8th grade, student was asked, how far in school he/she thought he/she would get (as things stood then). Responses were: won’t finish HS, will finish HS, voc. /tech school, will attend college, will finish college, and higher school after college.
Sureness of going farther than HS (8th)
In 8th grade, students were asked how sure they were that they would go on for further education after leaving HS. Responses were very sure, probably will, probably won’t, and very sure won’t. Responses were reverse coded so that higher scores indicated student was very sure he or she would go on for further education.
Social ability (10th)
Students were asked how the following statements best described them (false, mostly false, more false than true, more true than false, mostly true, and true): I have good friends who are members of my own sex, I make friends easily with girls, I make friends easily with boys, I don’t get along very well with boys*, I don’t get along very well with girls*, and it is difficult to make friends with members of my own sex*. Responses were added together to create the social ability index.
Academic self-concept (8th and 10th)
Students were asked in 8th grade how they felt about the following statements (strongly agree, agree, disagree, and strongly disagree): I am often afraid to ask questions in math class, English class, social studies class, and science class. Students were asked in 10th grade how the following statements best described them (false, mostly false, more false than true, more true than false, mostly true, and true): I learn things quickly in English classes, math is one of my best subjects, English is one of my best subjects, and I’m hopeless in English*. Responses were added together to create the academic self concept index with higher scores indicating a stronger academic self concept.
Student thinks of his or herself as a good student (12th)
Students were asked, in math and science class, how often (never, rarely, sometimes, often, or always) they did the following: paid attention in class, completed work on time, did more work than was required of them, and participated actively in class. Responses were added together to so that high scores indicated better academic habits.
Student cuts or skips class (8th)
In 8th grade, students were asked how often they cut or skipped class (never/almost never, less than once a week, at least once a week, or daily).
Student believes it is okay to work hard for good grades (10th)
Students were asked if they thought it was okay to work hard for good grades (y/n).
Student believes it is okay to ask challenging
Students were asked if they thought it was okay to ask challenging questions (y/n).
82

questions (10th)
Student believes it is okay to solve problems using new ideas (10th)
Students were asked if they thought it was okay to solve problems using new ideas (y/n).
Student believes it is okay to help others with school work (10th)
Students were asked if they thought it was okay to help other students with their schoolwork (y/n).
Student tries as hard as he/she can in classes (10th)
Students were asked in 10th grade how often they tried as hard as they could in math, English, history, and science. Responses were never, less than once a week, about once a week, a few times a week, and almost every day. Students that were not taking the subject were counted as missing.
Student comes to class prepared (8th)
Students were asked in 8th grade how often they came to class without: pencil or paper (when needed), books (when needed), and homework done (when assigned). Responses were usually, often, seldom, and never. Responses were combined to create a new preparedness variable so that higher scores indicated a higher level of preparedness for class.
Average amount of time spent on homework each week (8th)
Students were asked in 8th grade the average amount of time they spent on homework each week in math, science, English, and social studies. Originally a categorical variable, categories were created to correspond to the actual hours spent on homework so that the variable turned into a continuous variable. For example, 0= none and 1= less than 1 hour. The variables were re-coded so that 0=0 and 1=.5. Then the time spent on each subject was added together to create the new, continuous variable, time spent on HW each week. Values range from zero hours to 40 hours per week.
Teacher rating: student usually works hard (10th)
Two teachers of the student were asked if the student usually worked hard for good grades (y/n). Responses were re-coded so that yes =2 and 1=no. Teachers who responded don’t know were counted as missing. The average of the teachers’ responses was calculated for the overall score with higher scores indicating teachers believed that student did work hard. If one teacher was missing then the student’s score was determined by the teacher who did respond.
Teacher rating: student relates will to others (10th)
Two teachers of the student were asked if the student seemed to relate well to other students (y/n). Responses were re-coded so that yes =2 and 1=no. Teachers who responded don’t know were counted as missing. The average of the teachers’ responses was calculated for the overall score with higher scores indicating teachers believed that student did relate well to others. If one teacher was missing then the student’s score was determined by the teacher who did respond.
Teacher rating: student will probably go to college (10th)
Two teachers of the student were asked if the student would probably got o college (y/n). Responses were re-coded so that yes =2 and 1=no. Teachers who responded don’t know were counted as missing. The average of the teachers’ responses was calculated for the overall score with higher scores indicating teachers believed that student would probably go to college. If one teacher was missing then the student’s score was determined by the teacher who did respond.
Teacher rating: student does homework often
Two teachers of the student were asked how often the student completed homework assignments (never, rarely, some of the time, most of the time, all
83
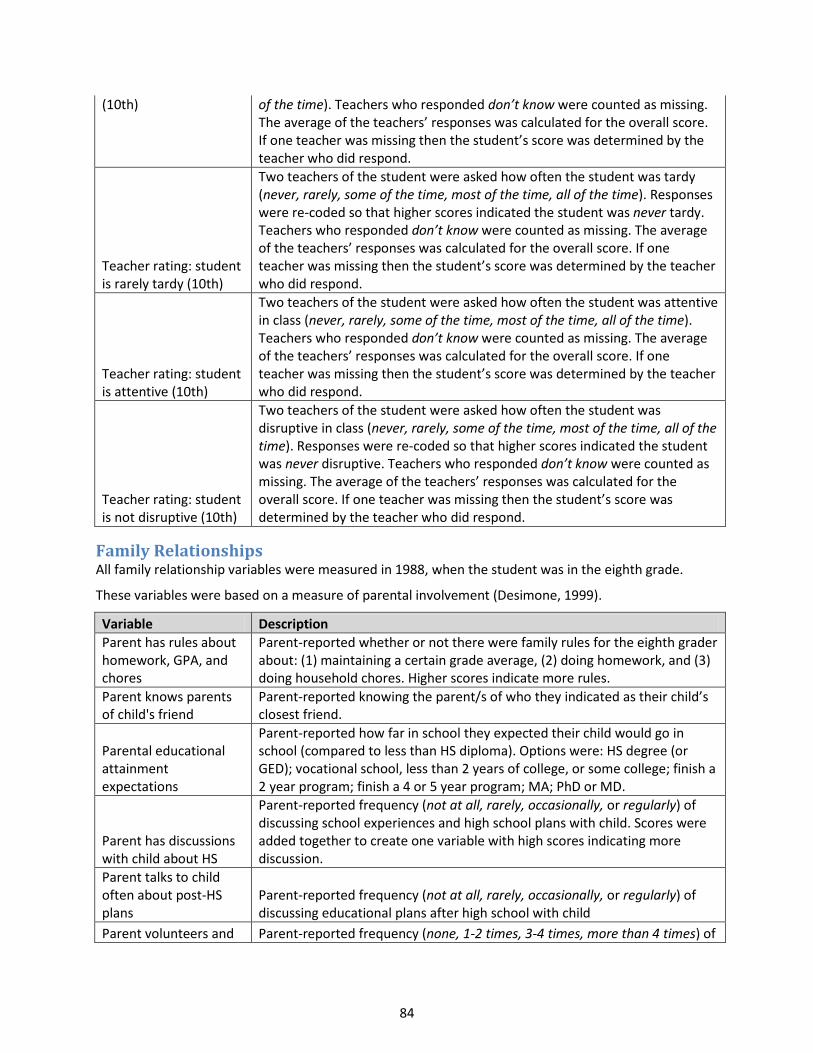
(10th) of the time). Teachers who responded don’t know were counted as missing. The average of the teachers’ responses was calculated for the overall score. If one teacher was missing then the student’s score was determined by the teacher who did respond.
Teacher rating: student is rarely tardy (10th)
Two teachers of the student were asked how often the student was tardy (never, rarely, some of the time, most of the time, all of the time). Responses were re-coded so that higher scores indicated the student was never tardy. Teachers who responded don’t know were counted as missing. The average of the teachers’ responses was calculated for the overall score. If one teacher was missing then the student’s score was determined by the teacher who did respond.
Teacher rating: student is attentive (10th)
Two teachers of the student were asked how often the student was attentive in class (never, rarely, some of the time, most of the time, all of the time). Teachers who responded don’t know were counted as missing. The average of the teachers’ responses was calculated for the overall score. If one teacher was missing then the student’s score was determined by the teacher who did respond.
Teacher rating: student is not disruptive (10th)
Two teachers of the student were asked how often the student was disruptive in class (never, rarely, some of the time, most of the time, all of the time). Responses were re-coded so that higher scores indicated the student was never disruptive. Teachers who responded don’t know were counted as missing. The average of the teachers’ responses was calculated for the overall score. If one teacher was missing then the student’s score was determined by the teacher who did respond.
Family Relationships All family relationship variables were measured in 1988, when the student was in the eighth grade.
These variables were based on a measure of parental involvement (Desimone, 1999).
Variable Description Parent has rules about homework, GPA, and chores
Parent-reported whether or not there were family rules for the eighth grader about: (1) maintaining a certain grade average, (2) doing homework, and (3) doing household chores. Higher scores indicate more rules.
Parent knows parents of child's friend
Parent-reported knowing the parent/s of who they indicated as their child’s closest friend.
Parental educational attainment expectations
Parent-reported how far in school they expected their child would go in school (compared to less than HS diploma). Options were: HS degree (or GED); vocational school, less than 2 years of college, or some college; finish a 2 year program; finish a 4 or 5 year program; MA; PhD or MD.
Parent has discussions with child about HS
Parent-reported frequency (not at all, rarely, occasionally, or regularly) of discussing school experiences and high school plans with child. Scores were added together to create one variable with high scores indicating more discussion.
Parent talks to child often about post-HS plans
Parent-reported frequency (not at all, rarely, occasionally, or regularly) of discussing educational plans after high school with child
Parent volunteers and Parent-reported frequency (none, 1-2 times, 3-4 times, more than 4 times) of
84

fundraises for school contacting school about (1) participating in school fundraising activities and (2)parent-reported whether or not (y/n) they act as a volunteer at the school. Scores were added together to create one variable with high scores indicating more parental volunteering and fundraising.
Parent is involved in parent teacher organization
Parent-reported whether or not they (1) belong to a parent-teacher organization and (2) take part in the activities of a parent-teacher organization. Scores were added together to create one variable with high scores indicating more parental involvement.
Parent attends parent-teacher organization meetings
Parent-reported whether or not they attend meetings of a parent-teacher organization (y/n).
Student perception about rules about TV, friends, and chores
Student-reported frequency (often, sometimes, rarely, never) of parents (1)requiring them to do work or chores around the home, (2) limiting the amount of time they can spend watching TV, and (3) limiting the amount of time going out with friends on school nights. Scores were added together to create a new variable with high scores indicating more rules.
Student reports parent checks his/her homework
Student-reported frequency (often, sometimes, rarely, never) of parents checking on whether or not they have done their homework.
Parent contacts school about academics
Parent-reported frequency (none, 1-2 times, 3-4 times, more than 4 times) of contacting child’s school since Fall semester about child’s academic performance and academic program for 1988 school year. Scores were added together to create new variable with high scores indicating frequent contact.
Student has discussions with parents about school
Students were asked how often (not at all, once or twice, or 3 or more times) they: talked to mother about planning high school program, discussed selecting courses/programs at school with parent(s), discussed school activities or events with parent(s), discussed things studied in class with parent(s). Scores were added tougher to create new variable with higher numbers indicating more discussion.
Student talks to father about planning for HS program
Students were asked how often (not at all, once or twice, or 3 or more times) they talked to their father (or male guardian) about planning for high school program. Higher numbers indicate more discussion.
High School Academics Variable Description
GPA (10th)
Student reported GPA from beginning of 9th grade until 10th grade. Student was asked what statement best described their grades in math, English, science, and history. Response options were: mostly A’s, half A’s and half B’s, mostly B’s, half B’s and half C’s, mostly C’s, half C’s and half Ds, mostly D’s, and mostly below D. Scores were reverse coded so that higher numbers indicated better grades. The average across all four subjects was used as high school GPA. Students who reported that they were not taking a subject or that their classes were not graded were coded as missing.
ACT/SAT score (12th)
Indicated by student transcript data. If students took the SAT or both the ACT and SAT then their SAT score was used (SAT math and SAT verbal were added together); if students took only the ACT then the four component
85
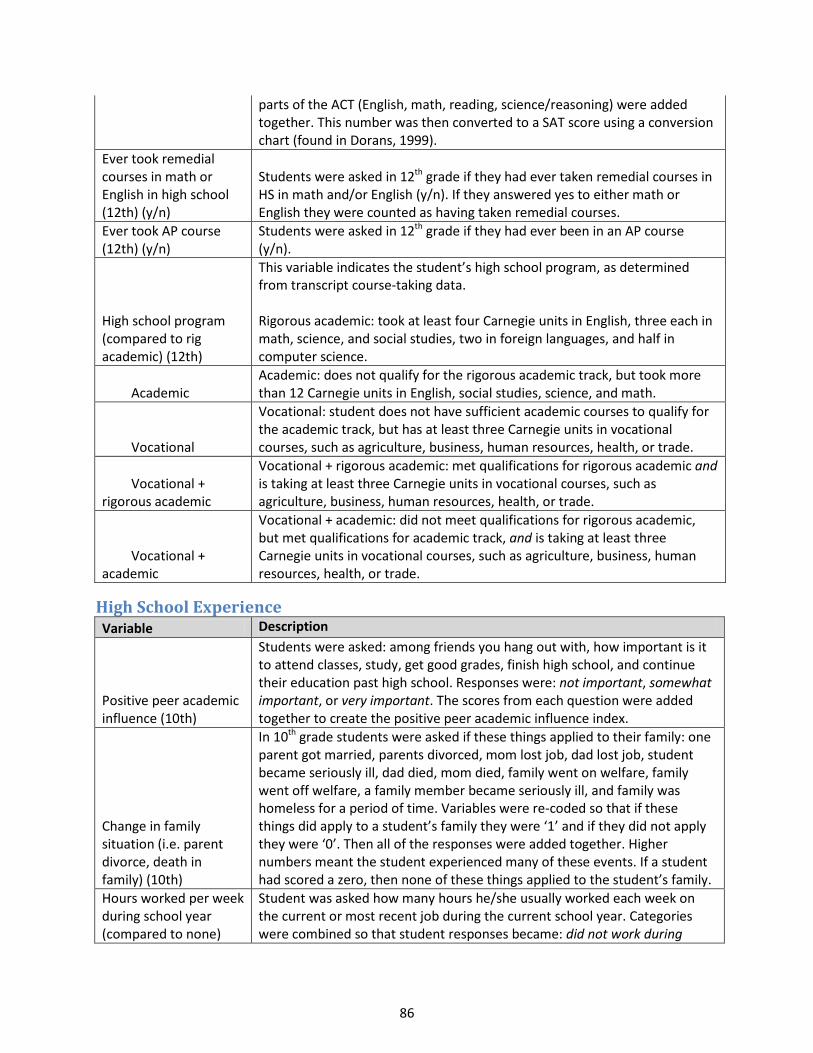
parts of the ACT (English, math, reading, science/reasoning) were added together. This number was then converted to a SAT score using a conversion chart (found in Dorans, 1999).
Ever took remedial courses in math or English in high school (12th) (y/n)
Students were asked in 12th grade if they had ever taken remedial courses in HS in math and/or English (y/n). If they answered yes to either math or English they were counted as having taken remedial courses.
Ever took AP course (12th) (y/n)
Students were asked in 12th grade if they had ever been in an AP course (y/n).
High school program (compared to rig academic) (12th)
This variable indicates the student’s high school program, as determined from transcript course-taking data. Rigorous academic: took at least four Carnegie units in English, three each in math, science, and social studies, two in foreign languages, and half in computer science.
Academic Academic: does not qualify for the rigorous academic track, but took more than 12 Carnegie units in English, social studies, science, and math.
Vocational
Vocational: student does not have sufficient academic courses to qualify for the academic track, but has at least three Carnegie units in vocational courses, such as agriculture, business, human resources, health, or trade.
Vocational + rigorous academic
Vocational + rigorous academic: met qualifications for rigorous academic and is taking at least three Carnegie units in vocational courses, such as agriculture, business, human resources, health, or trade.
Vocational + academic
Vocational + academic: did not meet qualifications for rigorous academic, but met qualifications for academic track, and is taking at least three Carnegie units in vocational courses, such as agriculture, business, human resources, health, or trade.
High School Experience Variable Description
Positive peer academic influence (10th)
Students were asked: among friends you hang out with, how important is it to attend classes, study, get good grades, finish high school, and continue their education past high school. Responses were: not important, somewhat important, or very important. The scores from each question were added together to create the positive peer academic influence index.
Change in family situation (i.e. parent divorce, death in family) (10th)
In 10th grade students were asked if these things applied to their family: one parent got married, parents divorced, mom lost job, dad lost job, student became seriously ill, dad died, mom died, family went on welfare, family went off welfare, a family member became seriously ill, and family was homeless for a period of time. Variables were re-coded so that if these things did apply to a student’s family they were ‘1’ and if they did not apply they were ‘0’. Then all of the responses were added together. Higher numbers meant the student experienced many of these events. If a student had scored a zero, then none of these things applied to the student’s family.
Hours worked per week during school year (compared to none)
Student was asked how many hours he/she usually worked each week on the current or most recent job during the current school year. Categories were combined so that student responses became: did not work during
86

(12th ) school year, worked less than 20 hours per week, or worked 21 or more hours.
Having been in any disciplinary trouble (10th grade)
The 10th grade discipline issues index (see below) was used to determine if students had ever been in disciplinary trouble. If students had ever gotten in trouble for not following school rules, been put on in-school suspension, were suspended/put on probation, or transferred to another school for disciplinary reasons they were counted as having been in disciplinary trouble.
Having been in any disciplinary trouble (12th grade)
The 12th grade discipline issues index (see below) was used to determine if students had ever been in disciplinary trouble. If students had ever gotten in trouble for not following school rules, been put on in-school suspension, were suspended/put on probation, or transferred to another school for disciplinary reasons they were counted as having been in disciplinary trouble.
Married in 12th grade
Students were asked what their current marital status was. Students who responded other were counted as missing. Students who said they were married, divorced/separated, or widowed were counted as being married in 12th grade. Students who said they were single or in a marriage-like relationship were counted as single.
Have children or expecting in 12th grade
Students were asked if they had any children of their own. Students who answered yes or no, but expecting were counted as having child or expecting in 12th grade.
Transferred schools (12th)
Students were asked how many times they changed schools since second semester of 8th grade (does not count promotion to another grade, move from middle school building to high school building in the same district). If they responded one or more times they were counted as having transferred schools.
Used a drug within last 30 days
Students were asked: how many times in the last 30 days they had alcohol beverages to drink (beer, wine, wine coolers, and liquor), how many times they used marijuana in the last 30 days, and how many times they took cocaine in any form in last 30 days. If students said they used any of these drugs one or more times they were counted as having used a drug within the last 30 days.
Time (hrs per week) spent on extracurricular activities (10th)
Students were asked: how much time in a typical week they spent on all school-sponsored extracurricular activities. Categories were reduced so that students could have spent no time, less than four hours, or five or more hours on extracurricular activities.
Time (hrs per week) spent on extracurricular activities (12th)
Students were asked: how much time in a typical week they spent on all school-sponsored extracurricular activities (sports, clubs, or other activities). Categories were reduced so that students could have spent no time, less than four hours, or five or more hours on extracurricular activities.
Student has experienced disciplinary issues (10th grade)
Students were asked how often the following happened to them in the first semester of 1990 school year (never, 1-2 times, 3-6 time, 7-9 times, or over 10 times): got in trouble for not following school rules, put on in-school suspension, suspended/put on probation, and transferred to another school for disciplinary reasons. Student scores were added together to create a discipline issues index with higher numbers indicating more discipline issues.
87

Student has experienced disciplinary issues (12th grade)
Students were asked how often the following happened to them in the first semester of 1992 school year (never, 1-2 times, 3-6 times, 7-9 times, 10-15 times, and over 15 times): got in trouble for not following school rules, was put in an in-school suspension, was suspended or put on probation from school, and was transferred to another school for disciplinary reasons. Student scores were added together to create a discipline issues index with higher numbers indicating more discipline issues.
Student has been arrested (12th)
Students were asked how many times they had been arrested. If they answered 1 or more times they were counted as having been arrested.
Student Perception of High School Climate These variables are based on the Office of Safe and Healthy Students (OSHS) Safe and Supportive Schools Model (US Department of Education, 2013). School engagement encompasses relationships, respect for diversity, and school participation; school environment covers the physical environment, academic environment, wellness, and disciplinary environment; and school safety includes emotional and physical safety at school.
Note: This section is based on a series of questions asking students about how much they agree with statements about their school from 1= strongly agree to 4= strongly disagree. Questions were re-coded so that higher numbers indicated the more desired answer. For example, “students get along with teachers” was reverse coded so that 4 (re-coded to strongly agree) indicated the student strongly agreed this was very true for his or her school. Undesirable statements were not re-coded. For example, “student feels ‘put down’ by teachers in class” was left with the original scale so that 4 (strongly disagree) indicated the student strongly disagreed that this was true are his or her school. For this section, questions that were reverse coded are denoted with an asterisk (*).
Variable Description School engagement (10th)
Students were asked a series of questions about how much they agreed with statements about their school (strongly agree, agree, disagree, strongly disagree). Questions related to school engagement were included in this index, including: students get along with teachers*, there is real school spirit*, students make friends with students of other racial and ethnic groups*, teachers are interested in students*, teachers praise hard work*, student feels “put down” by teachers in class, and teachers listen to what students have to say*. Students’ responses to the seven questions were added together, and then ‘6’ was subtracted (so the index began at 1), to create the school engagement index.
School environment (10th)
Students were asked a series of questions about how much they agreed with statements about their school (strongly agree, agree, disagree, strongly disagree). Questions related to school environment were included in this index, including: rules for behavior are strict*, discipline is fair*, other students disrupt class, the teaching is good*, disruptions by other students get in the way of learning, misbehaving students often get away with it. Students’ responses to the six questions were added together, and then ‘5’ was subtracted (so the index began at 1), to create the school environment index.
School safety (10th) Students were asked a series of questions about how much they agreed with statements about their school (strongly agree, agree, disagree, strongly disagree). Questions related to school safety were included in this index, including: student often feels “put down” by other students and student
88

doesn’t feel safe at this school. Students’ responses to both questions were added together, and then ‘1’ was subtracted (so the index began at 1), to create the school safety index.
High School Characteristics Variable Description
School level college encouragement and staff help (12th)
School was asked how often do staff at their school engage in the following: encourage 12th graders to visit colleges (the responses for this question were seldom, sometimes, or often), contact parents regarding student college selection, assist 12th graders in completing college applications, assist 12th graders in completing financial aid application, contact college representatives for 12th graders, provide letters of recommendation to colleges and universities. Responses were never, seldom, sometimes, or often. Responses were added together to create a school-level college encouragement/staff help index. The lowest possible score is one meaning staff at that school seldom encouraged students to visit colleges and never did the other things listed above. The highest possible score is 16 meaning staff at that school often do all of the above.
Overall parent involvement (12th)
School was asked what percentage of parents of 12th graders in your school are involved in the following on 12th graders behalf: volunteering time to help in classrooms or other school areas, attending programs on financial aid for colleges, universities or voc/tech schools, attending programs on educational opportunities after completing HS, attending programs on employment and career opportunities, soliciting information from academic subject teachers on how to help their students at home on specific skills or homework, joining some sort of parent organization (i.e. PTA), participating at PTA/PTO meetings or events during current school year, attending parent-teacher conferences. Responses were categorical (1=0-10, 2=11-24, 3=25-49, 4=50-74, and 5=75-100) (don’t know responses were counted as missing). Responses were added together to create an overall school-level parent involvement index.
Percent college help programs are used at school (12th)
School was asked what percentage of 12th graders attend: programs on college application procedures, programs on financial aid, school SAT/ACT courses, college fairs, and meet with college representatives. Responses were categorical (1=0-10, 2=11-24, 3=25-49, 4=50-74, and 5=75-100) (don’t have responses were counted as missing). Responses were added together.
Percent of 90-91 graduates in a 2-year college (12th)
Schools were asked, approximately what percent of the 1990-91 graduating class (the class before the NELS sample) went on to a 2 year college. Responses were (1=0, 2=1-10, 3=11-24, 4=25-49, 5=50-74, and 6=75-100).
Percent of 90-91 graduates in a four-year college (12th)
Schools were asked, approximately what percent of the 1990-91 graduating class (the class before the NELS sample) went on to a 4 year college. Responses were (1=0, 2=1-10, 3=11-24, 4=25-49, 5=50-74, and 6=75-100).
Percent of 90-91 graduates in a vocational/tech school (12th)
Schools were asked, approximately what percent of the 1990-91 graduating class (the class before the NELS sample) went on to a vocational/tech school. Responses were (1=0, 2=1-10, 3=11-24, 4=25-49, and 5=50-74). Categories 4 and 5 were combined due to low frequency in category 5.
12th grade enrollment School reported, total 12th grade enrollment. Categories were combined to
89

(compared to 1-99 students in 12th grade class)
1=1-99, 2=100-199, 3=200-299, 4=300-399, and 5=400+.
School classification (compared to public schools) (12th)
Classifies every student’s 12th grade school type into public, catholic, private NAIS, and other private not-NAIS. Combined categories into public and private.
Percent of students in single parent homes (12th)
Asks schools what percentage of the current 12th grade students lives in a single parent home (estimated). Responses were 1=0-10, 2=11-24, 3=25-49, 4=50-74, and 5=75-100.
Percent 12th grade language minority students
Asks schools what percentage of the current 12th grade is LEP or NEP. Responses were combined to create the following categories: none, less than 10%, and 10-49%.
Percent Asian/pacific Islander 12th graders
Asked schools, what percent of the current 12th grade students are Asian or Pacific Islander. Continuous variable.
Percent Hispanic 12th graders
Asked schools, what percent of the current 12th grade students are Hispanic. Continuous variable.
Percent black (non-Hispanic) 12th graders
Asked schools, what percent of the current 12th grade students are black, not of Hispanic origin. Continuous variable.
Percent white (non-Hispanic) 12th graders
Asked schools, what percent of the current 12th grade students are white, not of Hispanic origin. Continuous variable.
Percent American Indian or Alaskan 12th graders
Asked schools, what percent of the current 12th grade students are American Indian or Alaskan Native. Continuous variable.
Percent of students who receive FRPM (12th)
Asked schools what percentage of the total student body in their school receives free or reduced-price school lunch program. Continuous variable.
Average 12th grade attendance rate
Asked schools what the average daily attendance rate for 12th grade students is in 1992 (excused and unexcused absences). Continuous variable.
Percent of 12th grade students in AP courses
Divided the number of 12th graders enrolled in AP courses, as reported by schools (F2C49), by the total 12th grade enrolment, as reported by school as of Oct. 1, 1991 (F2C2) and multiplied by 100.
Percent 12th graders dropout before graduation
Asks schools what percent of students at their school who enter 12th grade drop out before graduation (not including students who transfer schools). Continuous variable.
Percent of 12th grade students in college prep programs
Asked schools to approximate the percentage of 12th graders at their school in college prep, academic, or specialized academic instructional programs (compared to general high school programs and specialized high school programs). Continuous variable.
Percent of students that receive remedial reading (12th)
Asked schools what percentage of the total student body in their school receives remedial reading. Continuous variable.
Percent of students that receive remedial math (12th)
Asked schools what percentage of the total student body in their school receives remedial math. Continuous variable.
Transition Variable Description
90

Parent involved in providing teen with information about college (12th)
Parent reported, asks (y/n) if parent has done the following: talked to teen about particular schools, talked to teen about general qualities that parent feels a school should have, and gave teen information that was received from a school (i.e. brochure). Responses were added together so that zero indicates the parent did none of these things and 3 indicates the parent did all of these things.
Number of schools student applied to (12th)
In 12th grade, student was asked how many schools they applied to; zero, 1, 2-4, or 5+.
Number of schools parent visited with teen (12th)
Parent was asked, when deciding (you and/or your teen) which school your child would attend after high school, how many different schools did you visit with him/her? Categories were condensed to: zero, 1, 2, 3-4, or 5+.
Parent talked to teen about applying for college (12th)
Parent report, in the past year how often parent has talked to teen about applying to voc/tech school, college, or university for education after high school. Responses: never, rarely, sometimes, often.
Parent is financially prepared for teen's college (12th)
Parent reported, parent was asked (y/n) if they had done the following in preparation of teen’s education after high school: started a savings account, bought an insurance policy, bought US savings Bonds, made investments in stocks or real estate, set up a college investment fund, started working another job and/or more hours, established another form of savings, planned to reduce other expenses in some way, planned to remortgage property or take out an equity loan, had teen put aside earnings. Responses were added together so that zero indicates the parent did none of these things and 10 indicates the parent did all of these things.
Parents took steps to learn about financial aid (12th)
Parent reported, parent was asked if he/she had done any of the following to learn about applying for financial aid: talked with a high school guidance counselor, talked with a representative from a vocational/tech school or college, talked with a loan officer at a bank, talked to another knowledgeable person, read US Department of Education information on financial aid, read information from a vocational/tech school or college on financial aid, or read about financial aid available through military service. Responses were added together so that zero indicates the parent did none of these things and seven indicates the parent did all of these things.
Parent is familiar with loan programs (12th)
Parent reported, parent given a list of programs that provide loans for study beyond high school and was asked how much they knew about each program (familiar, not familiar, teen has applied for program). Programs were: state student loan program, federal student loan program (such as Perkins or Stafford Loan Program), college or university student loan program, education loan privately arranged through a bank. If the parent answered they were familiar or the student had applied to the program they were considered familiar. Responses were added together so that zero indicates the parent was unfamiliar with all the above programs and four indicates the parent was familiar with all of the programs.
Parents read about or discussed financial aid with others to learn about it (12th)
Parent was asked if he or she had talked to anyone or read anything about sources of financial aid for education after high school for teen (y/n)
91
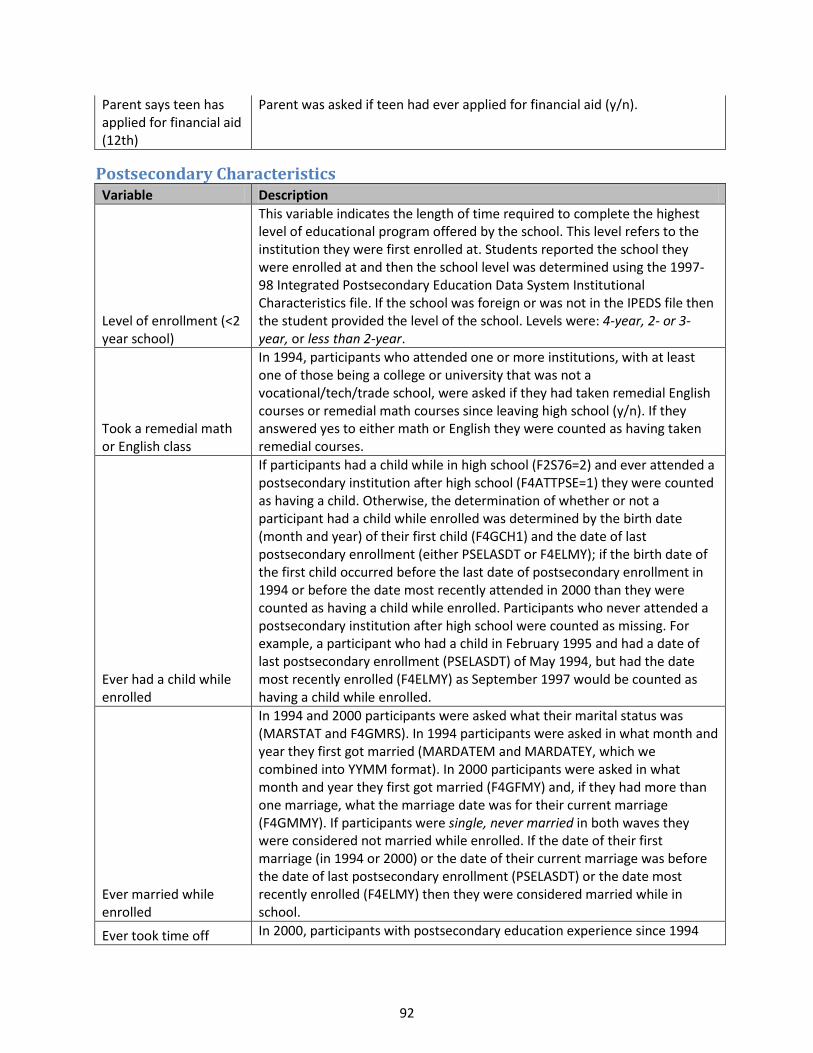
Parent says teen has applied for financial aid (12th)
Parent was asked if teen had ever applied for financial aid (y/n).
Postsecondary Characteristics Variable Description
Level of enrollment (<2 year school)
This variable indicates the length of time required to complete the highest level of educational program offered by the school. This level refers to the institution they were first enrolled at. Students reported the school they were enrolled at and then the school level was determined using the 1997-98 Integrated Postsecondary Education Data System Institutional Characteristics file. If the school was foreign or was not in the IPEDS file then the student provided the level of the school. Levels were: 4-year, 2- or 3-year, or less than 2-year.
Took a remedial math or English class
In 1994, participants who attended one or more institutions, with at least one of those being a college or university that was not a vocational/tech/trade school, were asked if they had taken remedial English courses or remedial math courses since leaving high school (y/n). If they answered yes to either math or English they were counted as having taken remedial courses.
Ever had a child while enrolled
If participants had a child while in high school (F2S76=2) and ever attended a postsecondary institution after high school (F4ATTPSE=1) they were counted as having a child. Otherwise, the determination of whether or not a participant had a child while enrolled was determined by the birth date (month and year) of their first child (F4GCH1) and the date of last postsecondary enrollment (either PSELASDT or F4ELMY); if the birth date of the first child occurred before the last date of postsecondary enrollment in 1994 or before the date most recently attended in 2000 than they were counted as having a child while enrolled. Participants who never attended a postsecondary institution after high school were counted as missing. For example, a participant who had a child in February 1995 and had a date of last postsecondary enrollment (PSELASDT) of May 1994, but had the date most recently enrolled (F4ELMY) as September 1997 would be counted as having a child while enrolled.
Ever married while enrolled
In 1994 and 2000 participants were asked what their marital status was (MARSTAT and F4GMRS). In 1994 participants were asked in what month and year they first got married (MARDATEM and MARDATEY, which we combined into YYMM format). In 2000 participants were asked in what month and year they first got married (F4GFMY) and, if they had more than one marriage, what the marriage date was for their current marriage (F4GMMY). If participants were single, never married in both waves they were considered not married while enrolled. If the date of their first marriage (in 1994 or 2000) or the date of their current marriage was before the date of last postsecondary enrollment (PSELASDT) or the date most recently enrolled (F4ELMY) then they were considered married while in school.
Ever took time off In 2000, participants with postsecondary education experience since 1994
92

were asked if they had ever taken off more than 6 months from school (not including time after finishing high school or another degree) (y/n). Don’t know responses were coded as missing.
Ever went part-time
In 2000, participants with postsecondary education experience since 1994 were asked if they had ever attended less than full-time (y/n). Don’t know responses were coded as missing.
Ever changed majors
In 2000, participants with postsecondary education experience since 1994 were asked if they had ever changed majors (y/n). Don’t know responses were coded as missing.
Ever transferred credits
In 2000, participants with postsecondary education experience since 1994 were asked if they had ever transferred credits (y/n). Don’t know responses were coded as missing.
Participated in varsity athletics
In 1994, participants who attended one or more institutions, with at least one of those being a college or university that was not a vocational/tech/trade school, were asked if they had ever participated in varsity intercollegiate athletics at the institution they attended the longest (y/n).
Participated in non-varsity intercollegiate athletics
In 1994, participants who attended one or more institutions, with at least one of those being a college or university that was not a vocational/tech/trade school, were asked if they had ever participated in other (as in non-varsity) intercollegiate athletics at the institution they attended the longest (y/n).
Participated in intramural athletics
In 1994, participants who attended one or more institutions, with at least one of those being a college or university that was not a vocational/tech/trade school, were asked if they had ever participated in intramural athletics at the institution they attended the longest (y/n).
Participated in performing arts
In 1994, participants who attended one or more institutions, with at least one of those being a college or university that was not a vocational/tech/trade school, were asked if they had ever participated in performing arts (such as music groups, theater) at the institution they attended the longest (y/n).
Participated in college newspaper or radio station
In 1994, participants who attended one or more institutions, with at least one of those being a college or university that was not a vocational/tech/trade school, were asked if they had ever participated in a college newspaper or radio station at the institution they attended the longest (y/n).
Participated in student government or political groups
In 1994, participants who attended one or more institutions, with at least one of those being a college or university that was not a vocational/tech/trade school, were asked if they had ever participated in student government or political groups at the institution they attended the longest (y/n).
Participated in social clubs, fraternities/sororities
In 1994, participants who attended one or more institutions, with at least one of those being a college or university that was not a vocational/tech/trade school, were asked if they had ever participated in social clubs, fraternities, or sororities at the institution they attended the longest (y/n).
Volunteer service to In 1994, participants who attended one or more institutions, with at least
93
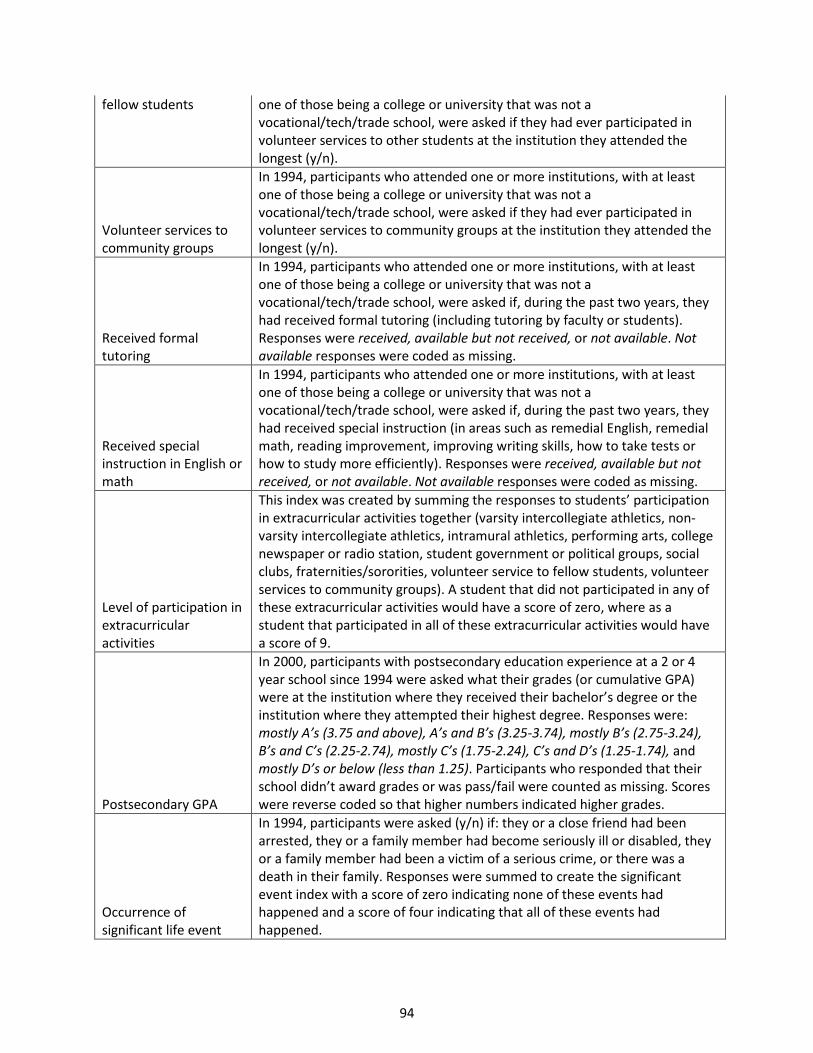
fellow students one of those being a college or university that was not a vocational/tech/trade school, were asked if they had ever participated in volunteer services to other students at the institution they attended the longest (y/n).
Volunteer services to community groups
In 1994, participants who attended one or more institutions, with at least one of those being a college or university that was not a vocational/tech/trade school, were asked if they had ever participated in volunteer services to community groups at the institution they attended the longest (y/n).
Received formal tutoring
In 1994, participants who attended one or more institutions, with at least one of those being a college or university that was not a vocational/tech/trade school, were asked if, during the past two years, they had received formal tutoring (including tutoring by faculty or students). Responses were received, available but not received, or not available. Not available responses were coded as missing.
Received special instruction in English or math
In 1994, participants who attended one or more institutions, with at least one of those being a college or university that was not a vocational/tech/trade school, were asked if, during the past two years, they had received special instruction (in areas such as remedial English, remedial math, reading improvement, improving writing skills, how to take tests or how to study more efficiently). Responses were received, available but not received, or not available. Not available responses were coded as missing.
Level of participation in extracurricular activities
This index was created by summing the responses to students’ participation in extracurricular activities together (varsity intercollegiate athletics, non-varsity intercollegiate athletics, intramural athletics, performing arts, college newspaper or radio station, student government or political groups, social clubs, fraternities/sororities, volunteer service to fellow students, volunteer services to community groups). A student that did not participated in any of these extracurricular activities would have a score of zero, where as a student that participated in all of these extracurricular activities would have a score of 9.
Postsecondary GPA
In 2000, participants with postsecondary education experience at a 2 or 4 year school since 1994 were asked what their grades (or cumulative GPA) were at the institution where they received their bachelor’s degree or the institution where they attempted their highest degree. Responses were: mostly A’s (3.75 and above), A’s and B’s (3.25-3.74), mostly B’s (2.75-3.24), B’s and C’s (2.25-2.74), mostly C’s (1.75-2.24), C’s and D’s (1.25-1.74), and mostly D’s or below (less than 1.25). Participants who responded that their school didn’t award grades or was pass/fail were counted as missing. Scores were reverse coded so that higher numbers indicated higher grades.
Occurrence of significant life event
In 1994, participants were asked (y/n) if: they or a close friend had been arrested, they or a family member had become seriously ill or disabled, they or a family member had been a victim of a serious crime, or there was a death in their family. Responses were summed to create the significant event index with a score of zero indicating none of these events had happened and a score of four indicating that all of these events had happened.
94

Hours/week volunteering
In 1994, all participants were asked, over the past year, how many hours per week they spent doing volunteer work. Continuous scale.
Total amount borrowed for education
In 1994, all participants were asked the total amount they had borrowed for their postsecondary education (at all of the postsecondary institutions attended combined). Continuous variable.
Outcome variables Variable Description
Any postsecondary enrollment
This variable comes from a derived variable and was created by looking at the number of postsecondary institutions attended by 1993 and whether participants attended any postsecondary institutions since 1993 (y/n).
Any postsecondary completion
This variable is a derived variable which used the series of degree type variables to determine the highest degree awarded. If respondents were unable to provide a degree type for any of their reported degrees they were coded as missing. Respondents who reported having a certificate/license, Associate’s degree, Bachelor’s degree, Master’s degree, or PhD were counted as having completed postsecondary education.
BPS Variable Descriptions
Demographics Variable Description
Gender Student-reported gender from the NPSAS, or if not available, from CADE, or from CPS. Male is the reference group.
Race
Student-reported race-ethnicity from the NPSAS. Two separate questions were asked: ethnicity and race based on Census definitions. Students of Hispanic origin are excluded from the other race categories. Students could select more than one race. The other category contains students who reported Asian, American Indian or Alaskan Native, Native Hawaiian or other Pacific Islander, Other, or More than one race. White is the reference group.
black Hispanic Other
Income ($10,000)
Student-reported income from financial aid applications or student interviews in units of $10,000. Dependent students were asked their parents’ total income for 2002. Independent students were asked to report their income and that of their spouse for 2002.
Parental Education (BA+)
Student-reported the highest level of education of either parent during the 2003-04 school year. This question was based on NPSAS student interview, or the CPS, if that was not available. Reported levels were then dichotomized to attaining a Bachelor’s degree or higher and attaining less than a Bachelor’s degree.
Parental Marital Status (married)
Student-reported marital status during the 2003-04 school year, based on the NPSAS student interview or, if not available, CPS. Only dependent
95

students were asked this question. Single, Divorced/separated, and Widowed parents were grouped together as unmarried.
High School Variable Description
GPA
Student-reported high school GPA, as reported on their most recent SAT or ACT questionnaire. Values for students without ACT or SAT records were imputed. We converted this score into a 4.0 scale. Students under the age 24 who received a high school diploma have values for this item.
SAT score (10 points)
SAT I Combined score, reported or derived from the following sources: 1) College Board-reported SAT scores; ACT-reported ACT composite scores; Institution-reported SAT scores; Institution-reported ACT scores. BPS converted ACT scores to the SAT scale using a conversion chart (found in Dorans, 1999). We report SAT scores in units of 10.
Highest Math Class
Student-reported highest math class taken or planned to take, according to NPSAS student interview or as reported on the most recent SAT or ACT questionnaire. Our created categories are: None of these, Algebra 2 or Trigonometry/Algebra 2, Pre-calculus, and Calculus.
Earned College Credit
Student-reported on NPSAS questionnaire whether they 1) took any courses at a college or university and earned college credits while in high school; or 2) earned Advanced Placement (AP) credits that were accepted by the first school in which they enrolled. This question only applies to respondents under the age of 24.
Earned AP Credit
Student-reported on NPSAS questionnaire whether they earned Advanced Placement (AP) credits that were accepted by the first school in which they enrolled. This question only applies to respondents under the age of 24.
Postsecondary Pre-enrollment Variable Description Application Process Number of Schools Applied
Student-reported number of colleges, universities, and trade schools they applied to on the NPSAS student interview.
Received any Financial Aid
BPS-derived variable on the total amount of all financial aid (including Federal, State, Institutional, and Outside grants, loans, and work-study, as well as other types of aid) the student received during the 2003-04 school year. We dichotomized to $0 or >$0.
Student cost (2003-04) ($1,000)
BPS-derived variable on the amount of money left when all state aid and institutional grants were subtracted from tuition and fees for the 2003-04 school year. Students who attended more than one institution were skipped. We set this variable to units of $1,000.
Institutional Characteristics
Institution size As reported in IPEDS 2001 or 2003, the Fall 2003 enrollment at the first institution the student attended.
Percent Minority Enrollment
As reported in IPEDS 2003, the percentage of total undergraduate enrollment that are black, non-Hispanic, Hispanic, Asian/Pacific Islander, or
96

American Indian/Alaska Native. Applies to degree-granting, title IV institutions only.
Selectivity
IPEDS-reported selectivity of the first institution the respondent attended. Among public or private not-for-profit 4-year schools, the options are: Very selective, Moderately Selective, Minimally Selective, and Open admission.
Experience
Delayed enrollment
BPS-derived variable indicating the number of years between the student’s high school graduation and the year they first enrolled in postsecondary education.
Part-time Student (2004)
Student-reported intensity of enrollment during the 2003-04 school year. Created options are: Full time or Part-time/mixed. If the BPS 2006 interview was not available, data come from NPSAS 2004, IPEDS 2003, or NSLDS.
Postsecondary Post-enrollment Variable Description
GPA (2004)
Institution-reported student GPA for the 2003-04 school year on a 4.0 scale from the NPSAS. If institution-reported GPA was not available, the NPSAS student interview was used.
Selected Major 1st Year
Student-reported major during the 2003-04 school year from the NPSAS student interview was recoded to indicate whether or not the student chose a major this year.
Remedial Classes Students reported whether or not the student took any remedial courses during the 2003-04 school year in the NPSAS student interview.
Highest degree expected (2004)
Student-reported highest level of education they ever expected to complete from the NPSAS student interview. Created categories are: No degree or certificate; Certificate; Associate’s degree; Bachelor’s degree; Post-BA or post-master certificate or Master’s degree; Doctoral degree or First-professional degree.
Experience
Married during the first year of postsecondary enrollment
Student-reported marital status during the 2003-04 school year, from the CPS financial aid application or the NPSAS student interview. Created categories are: Single, divorced, or widowed; and Married or Separated.
Ever married while enrolled
Student-reported marital status during the 2003-04 school year from the CPS financial aid application or the NPSAS student interview, student-reported marital status during 2006 from the 2006 BPS student interview, and student-reported marital status during 2009 from the 2009 BPS student interview were used along with dates of marriage as reported in FAFSA forms, survey completion dates, and student-reported date of last enrollment from the BPS student interviews to determine whether or not students were ever married while enrolled.
Had a child during the first year of postsecondary enrollment
If a student reported having any dependents, the NPSAS student interview and CPS were used to determine whether they had a dependent child during the 2003-04 school year.
Ever had a child while enrolled
Student-reported indicators of dependent children from the NPSAS student interview, 2006 BPS student interview, and 2009 BPS student interview, dates of survey completion, youngest child’s birth date, and student-
97

reported date of last enrollment from the BPS student interviews were used to determine whether or not students ever had a child while enrolled.
Hours working (compared with 0) (2004)
Student-reported average hours worked per week during the 2003-04 school year (including work-study/assistantship/traineeship) from the NPSAS student interview. We created three categories of hours: 0 hours, 1-20 hours; >20 hours.
Up to 20 hours/week More than 20 hours/week
Hours volunteering (2004)
Student-reported average hours per month spent volunteering during the 2003-04 school year from the NPSAS student interview.
Social Integration (2004)
Fine arts activities
Student-reported frequency (never, sometimes, often) of attending musical, choir, drama or other fine arts activities during the 2003-04 academic year from the NPSAS student interview. Only applies to students who attended 2- or 4-year institutions.
School Clubs
Student-reported frequency (never, sometimes, often) of participating in school clubs during the 2003-04 academic year from the NPSAS student interview. Only applies to students who attended 2- or 4-year institutions.
School sports
Student-reported frequency (never, sometimes, often) of participating in varsity/intramural/club sports during the 2003-04 academic year from the NPSAS student interview. Only applies to students who attended 2- or 4-year institutions.
Study groups
Student-reported frequency (never, sometimes, often) of attending study groups outside of the classroom during the 2003-04 academic year from the NPSAS student interview. Only applies to students who attended 2- or 4-year institutions.
Student-Faculty Relationship (2004)
Faculty informal meeting
Student-reported frequency (never, sometimes, often) of informal or social contacts with faculty members outside of classrooms and the office during the 2003-04 academic year from the NPSAS student interview. Only applies to students who attended 2- or 4-year institutions.
Faculty talk outside class
Student-reported frequency (never, sometimes, often) of talking with faculty about academic matters outside of class time (including email) during the 2003-04 academic year from the NPSAS student interview. Only applies to students who attended 2- or 4-year institutions.
Meet academic advisor
Student-reported frequency (never, sometimes, often) of meeting with an advisor concerning academic plans during the 2003-04 academic year from the NPSAS student interview. Only applies to students who attended 2- or 4-year institutions.
Hours volunteering (2006)
Student-reported average hours per month spent volunteering during the 2003-04 school year from the 2006 BPS student interview.
Social Integration (2006)
Fine arts activities Student-reported frequency (never, sometimes, often) of attending musical,
98

choir, drama or other fine arts activities when last enrolled from the 2006 BPS student interview. Only applies to students who had been enrolled at some point after the 2003-04 school year and attended 2- or 4-year institutions.
School Clubs
Student-reported frequency (never, sometimes, often) of participating in school clubs when last enrolled from the 2006 BPS student interview. Only applies to students who had been enrolled at some point after the 2003-04 school year and attended 2- or 4-year institutions.
School sports
Student-reported frequency (never, sometimes, often) of participating in varsity/intramural/club sports when last enrolled from the 2006 BPS student interview. Only applies to students who had been enrolled at some point after the 2003-04 school year and attended 2- or 4-year institutions.
Study groups
Student-reported frequency (never, sometimes, often) of attending study groups outside of the classroom when last enrolled from the 2006 BPS student interview. Only applies to students who had been enrolled at some point after the 2003-04 school year and attended 2- or 4-year institutions.
Student-Faculty Relationship (2006)
Faculty informal meeting
Student-reported frequency (never, sometimes, often) of informal or social contacts with faculty members outside of classrooms and the office when last enrolled from the 2006 BPS student interview. Only applies to students who had been enrolled at some point after the 2003-04 school year and attended 2- or 4-year institutions.
Faculty talk outside class
Student-reported frequency (never, sometimes, often) of talking with faculty about academic matters outside of class time (including email) when last enrolled from the 2006 BPS student interview. Only applies to students who had been enrolled at some point after the 2003-04 school year and attended 2- or 4-year institutions.
Meet academic advisor
Student-reported frequency (never, sometimes, often) of meeting with an advisor concerning academic plans when last enrolled from the 2006 BPS student interview. Only applies to students who had been enrolled at some point after the 2003-04 school year and attended 2- or 4-year institutions.
Satisfaction Satisfaction with Major (2009)
Student indicated whether or not (Yes/No) they were satisfied with their choice of major in the 2009 BPS student interview.
Satisfaction with Institution (2009)
Student indicated whether or not (Yes/No) they were satisfied with the quality of undergraduate education they received in the 2009 BPS student interview.
Transferring (continuous)
Student-reported number of transfers between institutions as of June 2009 from the BPS student interviews.
Ever a part-time student
Student-reported enrollment intensity for all months of enrollment through June 2009 from the BPS student interviews. Created categories are: Always full-time; Always part-time or mixed.
Became a part-time student after the first year
Created variable from student-reported intensity of enrollment during the 2003-04 school year (BPS 2006 interview or NPSAS 2004, IPEDS 2003, or NSLDS) and student-reported enrollment intensity for all months of enrollment through June 2009 from the BPS student interviews. If student
99

reported being a full-time student during the 2003-04 school year and was at any time a part-time or mixed student, they are considered becoming part-time.
Outcome Variables Variable Description
Any degree attainment
All respondents were asked the highest degree type attained through 2009. If respondents answered certificate, Associate’s degree, or Bachelor’s degree they were counted as having attained a degree.
Completion of 4-year degree or more
Respondents who were initially enrolled in a 4-year institution were asked the highest degree type they attained through 2009. If respondents answered Bachelor’s degree they were counted as having attained a 4-year degree.
Completion of 2-year degree or more
Respondents who were initially enrolled in a 2-year institution were asked the highest degree type they attained through 2009. If respondents answered Associate’s degree or Bachelor’s degree they were counted as having attained a degree.
100