social capital: measurement and consequences...
TRANSCRIPT
1
Social Capital: Measurement and Consequences
Robert Putnam1
This paper starts with a discussion of definitions of social capital, then turns to
issues in measurement, and finally, presents some evidence on the consequences of social
capital. In the last five years, I have been working exclusively on some specific and
perhaps unique problems about social capital in the United States, so all of my examples
are going to be drawn from the United States experience. I don’t want to be interpreted as
saying these trends are common to all OECD countries. It is just that the United States
has been the main focus of my research for the past five years.
There are, among those of us who work in the area, some marginal differences in
terms of exactly how we would define social capital, but Michael Woolcock correctly
says in his paper that among the people who are working in this field, there has been a
visible convergence, definitionally, toward something like the definition he offers. The
central idea of social capital, in my view, is that networks and the associated norms of
reciprocity have value. They have value for the people who are in them, and they have, at
least in some instances, demonstrable externalities, so that there are both public and
private faces of social capital. I am focussing largely on the external returns, the public
returns to social capital, but I think that is not at all inconsistent with the idea that there
are also private returns. The same is no doubt true in the area of human capital, i.e. there
are simultaneously public and private returns.
In the great debate of the two Cambridges about "capital", the focus of much of
the discussion was on whether physical capital was homogeneous enough to be
susceptible to aggregate measurement. There is room for similar debates about human
and social capital. Obviously there are many different forms of physical capital. For
instance, both an egg-beater and an aircraft carrier enter into the American national
accounts as little bits of physical capital, and yet they are not interchangeable. Try fixing
your morning omelette with an aircraft carrier, or try attacking the Serbs with an egg-
beater. The same thing is true about social capital. Social capital is certainly far from
homogeneous.
1 Kennedy School of Government, Harvard University.
2
There are some forms of social capital that are good for some things and not for
others. Now, it is not so easy to see yet exactly how we should add up all those forms in
the same way that, I gather, it was initially not easy to see how we were going to add up
all those different forms of physical capital. Accepting that there is no single form of
social capital, we need to think about the multiple dimensions of social capital. High on
the research priority list in the area of social capital, as far as I am concerned, is
developing the theoretically coherent and empirically valid typologies or dimensions
along which social capital should vary. I will give some examples of how social capital
varies, but I don’t think we are anywhere near yet a kind of canonical account of the
dimensions of social capital.
Some forms of social capital are highly formal, like a PTA (Parent-Teacher
Association) organisation or a national organisation of any sort, or a labour union,
formally organised with a chairman and a president, and membership dues and so on.
Some forms of social capital, like the group of people who gather at the bar every
Thursday evening, are highly informal. And yet, both of those constitute networks in
which there can easily develop reciprocity, and in which there can be gains. Some forms
of social capital are densely interlaced, like a group of steelworkers who work together
every day at the factory, go to Catholic Church every Sunday, and go out bowling on
Saturday. That is a very dense, interconnected, multiplex form of social capital. There
are also very thin, almost invisible forms of social capital, meaning networks and the
associated norms of reciprocity, like the nodding acquaintance you have with the person
you occasionally see at the supermarket, while waiting in line.
Don’t be too dismissive of very casual forms of social connection, because there
has been good experimental evidence that if you nod to people in the hall, they are more
likely to come to your aid if you should have a fit or have a heart attack, than if you don’t
nod to them, even if you don’t otherwise know them. Merely nodding to someone in the
hall generates visible, measurable forms of reciprocity. So there are, as I say, these very
evanescent forms and also quite regular forms of social capital, both formal and informal.
I agree with Michael Woolcock that one of the most important distinctions is between
bridging and bonding. And I certainly agree with him that not all social capital has good
consequences for every one.

3
This was called most vividly to my attention in a book review that appeared on the
front page of the New York Times several years ago, written by a former student of mine.
He wasn’t reviewing a book of mine, but somebody else’s. In his review, he called
attention to the fact that Tim McVeigh cooked up the Oklahoma City bombing in a
bowling alley in Oklahoma City. The reviewer then juxtaposed this with my article
written several years ago, called “Bowling Alone” (Putnam 1995), in which I called
attention to the fact that Americans were no longer bowling in leagues. The last line of
the New York Times review is "we all would have been better off if Tim McVeigh had
gone bowling alone." The network of people who formed this conspiracy was indeed
social capital – it enabled Tim McVeigh to do things he could not otherwise have done.
However, this was clearly an example of social capital (involving as it did, both
reciprocity and trust) that was put to genuinely destructive ends. In short, it had negative
externalities. Of course, this possibility is not unique to social capital. In that same
bombing, there were bits of physical capital that were put to destructive ends, the truck
that was blown up, and there were bits of human capital that were put to destructive ends,
the bomb-making expertise. What I wish to emphasize is that all forms of social capital,
indeed any form of capital, can be used to ends that are in some instances destructive.
I now turn to address issues of measurement, especially measurement of long-run
trends, over the course of the twentieth century, in social capital in the United States. For
many Americans that is an interesting question. In Putnam (1995) I conjectured that the
long-run trends, at least the recent trends, in social capital in the United States were
down. In that article I provided preliminary evidence that showed, at least by some
measures, that membership in organisations was down. My recent book (Putnam 2000)
looks in much more detail at the question of trends in social capital in the United States.
In the course of doing research for that book, I faced the same problem that students of
global warming face. That is, you know exactly what evidence you would have liked
people to have collected 200 years ago so that you could now tell whether there have been
subsequent trends in warming, but you are stuck with what data happened to have been
gathered then. The solution that the global warming people use is to triangulate among
different sources of evidence, any one of which is imperfect. However, if you get the
same basic story from ice cores in Greenland, from tree rings in the Southwest of the
United States, and from the temperature records of the British Admiralty, even though
4
any of those measures is subject to some error and none of them is exactly the measure
you would want, concordance among different sources of evidence makes more plausible
the claim that there has been an upturn in average global temperature.
I want to show you very briefly the kinds of evidence that I have brought to bear
on the question of long-run trends in the United States in social capital, and I want to
begin with the simplest kind of evidence that I used in my earlier article. I now show this
evidence by means of market share measures for many major civic organisations in
American life. What fraction of all Jewish women in America belongs to Hadassah?
What fraction of catholic men belongs to the Knights of Columbus? What fraction of all
adult men belongs to one of the “animal clubs”, that is, men’s organisations? (Animal
clubs is a technical term. I only realised when I began doing this research that all men’s
clubs in America are named for animals: the Lions club, the Moose club, the Elks club,
the Eagles club, and so on.)
So for all these organisations we gathered market share data, as well as for many
other organisations. What fraction of rural kids belongs to the 4-H? What fraction of
girls belongs to the girl-scouts? What fraction of parents belongs to a PTA? And so on.
We have done it for more than 30 large organisations. Virtually all of the individual
graphs look like Figure 1, which in fact shows the average membership rates for 32
national chapter-based voluntary associations for almost the entire 20th century. By the
way, an almost identical graph applies to professional organisations. If you ask what
fraction of all doctors belongs to the AMA (American Medical Association), what
fraction of all electronic engineers belongs to the IEEE (Institute of Electrical and
Electronic Engineers) – market shares is what I am talking about here – those graphs also
look like Figure 1, that is, rising for the first two thirds of the century with a sharp dip
during the Great Depression – many organisations lost half their membership between
1930 and 1935 – followed by a long period of very rapid growth, doubling on average in
market share – the growth in membership numbers was even greater, because the total
population was growing.
Probably that period between 1940 and 1965 was the most rapid period of civic
revival in American history. Figure 1 doesn’t prove that, but I believe it was the case.
And then suddenly, silently, mysteriously, inexplicably, all of those organisations began
to experience levelling market shares and then decline in market shares, and gradually the
5
decline in market shares became so great that they began to experience absolute decline in
the number of members. By 1997, in terms of market shares, the average organisation
was back to Depression levels. Not all organisations’ membership fell at the same time.
The AMA actually was the first to peak in terms of its market share. Appropriately, the
last of my organisations to peak and begin to fall was the Optimists. The Optimists didn’t
begin falling until 1980, but then they really plummeted and so they are now back down
in terms of their market share below what they were in the 1930s.
But there are two reasons to doubt the adequacy of the membership data as a
sufficient measure of social connectedness. First of all, it is based on membership in
fixed organisations. I wanted to know membership across the whole of the century, so I
needed some measures that would last across the whole century. But there might have
been another shadow universe of organisations that was growing while these were
declining, so perhaps this graph represents just changes in the pecking order of
organizations, and not a universal pattern.
Secondly – and I want to underline this because there has been some
misunderstanding of my own position on this, among other places in Steve Knack’s paper
– I do not believe, nor have I ever believed, that associations were some privileged form
of social capital, except in the sense that associations tend to gather data on themselves
and, therefore, it is easier to gather data on associations. Beyond this greater ease of
measurement, there is nothing canonically superior about formal associations as forms of
social networks.
Of course it could be true that associations were becoming less common in
America but that we were hanging out in bars more, that we were having more picnics,
that we were seeing folks at our home at night more often, and those forms of informal
social capital can be quite important. But I couldn’t figure out where the picnic register
in American society was located. Where would I go to find out about trends in picnics
over time?
Both of these possible shortcomings of the membership data were solved when I
discovered two massive new archives of data in the United States. These are infinitely
interesting datasets.
One of them, the Roper survey, has asked national samples of Americans, every
month over the last twenty-five years and continuing still, questions of the following
6
form: in the course of the last year, did you do any of the following things; did you sign a
petition, did you write a letter to your congressman, attend a local meeting, serve as an
official of a local club, serve on a committee of any local organisation, work for a
political party, and so on. By political science standards, the Roper database is a huge
one, with more than 400,000 surveys, and it shows unequivocally a decline in all these
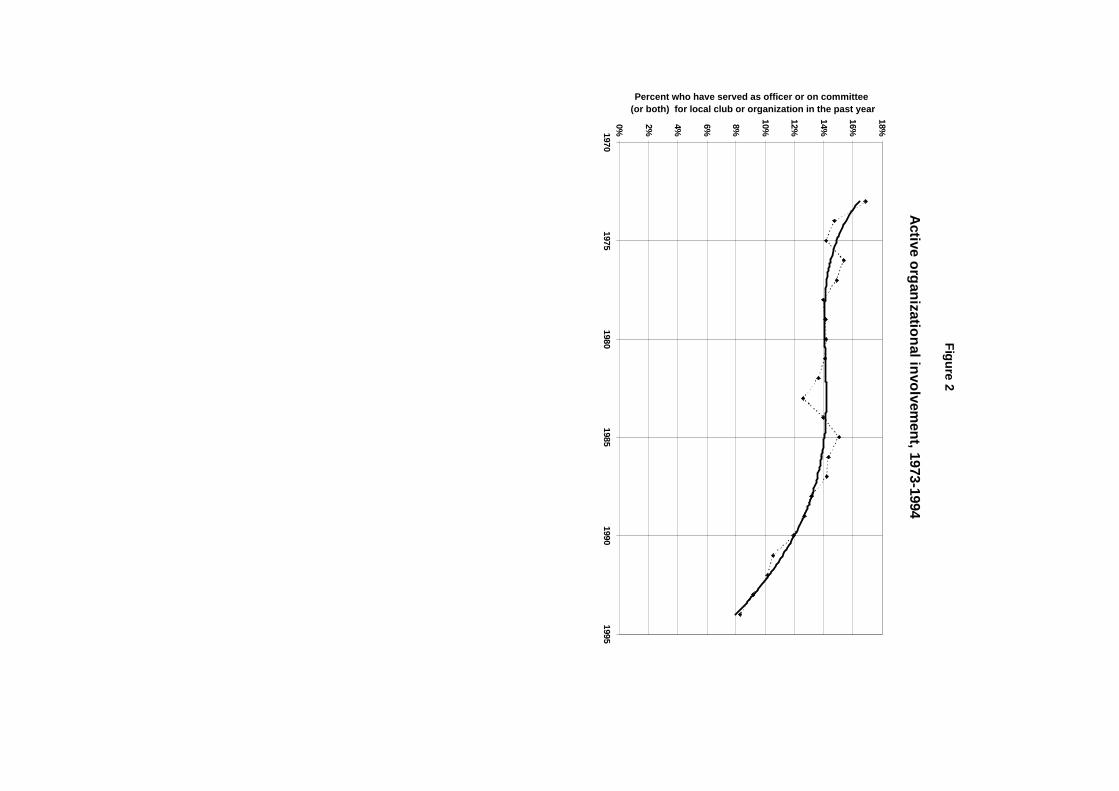
forms of civic participation. Figure 2, which happens to be the graph of the Roper data
for the percentage of Americans who had, in the course of the last year, served either as
officer of a local organisation, or as a committee member of a local organisation − any
organisation, not just one of my 32 national organizations, shows a quite dramatic drop,
basically a cut in half, over these years. Every one of the twelve different kinds of
connectedness covered in the survey shows the same decline.
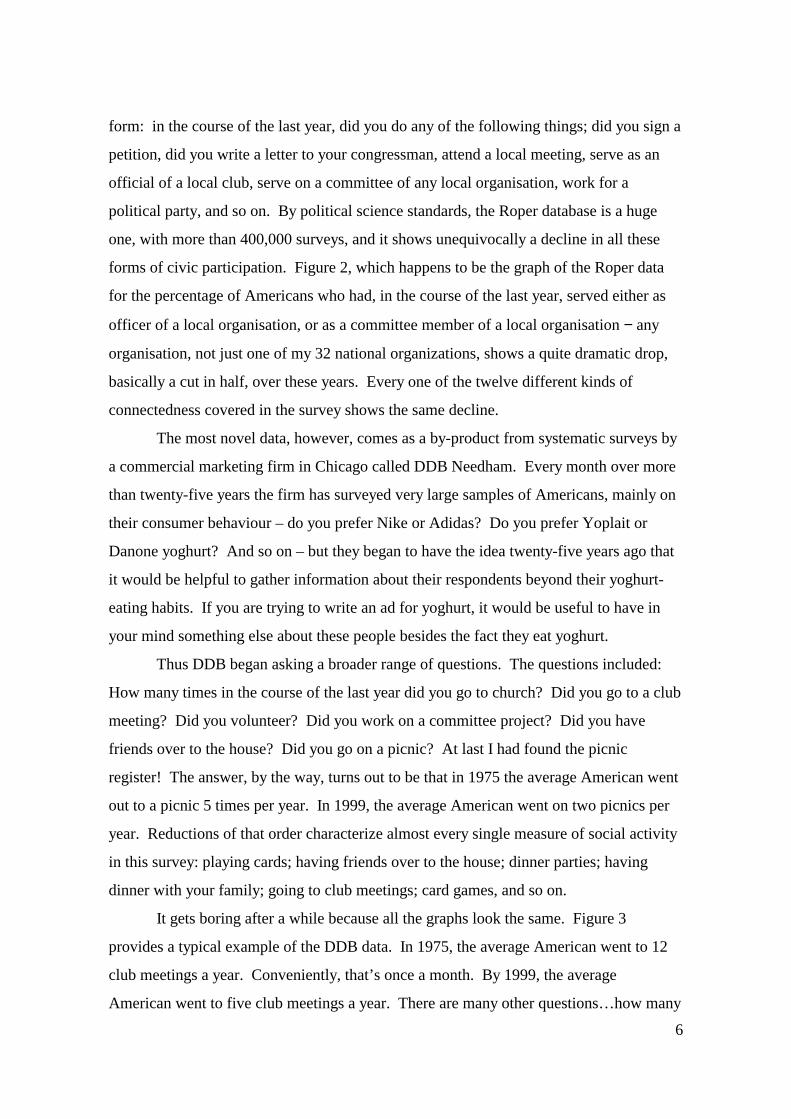
The most novel data, however, comes as a by-product from systematic surveys by
a commercial marketing firm in Chicago called DDB Needham. Every month over more
than twenty-five years the firm has surveyed very large samples of Americans, mainly on
their consumer behaviour – do you prefer Nike or Adidas? Do you prefer Yoplait or
Danone yoghurt? And so on – but they began to have the idea twenty-five years ago that
it would be helpful to gather information about their respondents beyond their yoghurt-
eating habits. If you are trying to write an ad for yoghurt, it would be useful to have in
your mind something else about these people besides the fact they eat yoghurt.
Thus DDB began asking a broader range of questions. The questions included:
How many times in the course of the last year did you go to church? Did you go to a club
meeting? Did you volunteer? Did you work on a committee project? Did you have
friends over to the house? Did you go on a picnic? At last I had found the picnic
register! The answer, by the way, turns out to be that in 1975 the average American went
out to a picnic 5 times per year. In 1999, the average American went on two picnics per
year. Reductions of that order characterize almost every single measure of social activity
in this survey: playing cards; having friends over to the house; dinner parties; having
dinner with your family; going to club meetings; card games, and so on.
It gets boring after a while because all the graphs look the same. Figure 3
provides a typical example of the DDB data. In 1975, the average American went to 12
club meetings a year. Conveniently, that’s once a month. By 1999, the average
American went to five club meetings a year. There are many other questions…how many

7
times in the course of the last year did you give the ‘finger’ to other drivers, that is made
rude gestures to another driver? That actually turns out to be an interesting datum.
People were also asked about their tax evasion. And among the thousands of variables in
this dataset, by far the best predictor of tax evasion is the number of times in the course of
the last year that you gave the ‘finger’ to another driver. (I have a great idea for the IRS
auditors, and if rational expectation is right, one of two things ought to happen: either the
IRS (Internal Revenue Service) will get better at finding tax evaders, or else the apparent
level of comity on American highways will improve.)
I have thus far described one set of indicators: formal membership and
participation in many different forms of informal networks. I am trying to build up the
evidence, both for you and for my larger American audience, for the claim that basically
the same stories are being told by the ice cores in Greenland and the tree rings in Arizona.
Another form of evidence that fits perfectly with this picture comes from data on
social trust. I am in agreement with Michael Woolcock that social trust is not part of the
definition of social capital but it is certainly a close consequence, and therefore could be
easily thought of as a proxy. Figure 4 shows what the trend is, based on many surveys
asking the same question: basically, do you trust other people. The graph shows that
there has been a forty-year steady decline, and a decline that is actually greater among
American youth than among adults. Other analysis has shown very clearly that the
decline in social trust in America is entirely generational, that is if you look at any birth
cohort, average trust has not changed overtime, but each successive birth cohort over the
last thirty-forty years has become adult with a lower level of social trust.
Now there are other indirect measures that one can use. A slightly less direct
measure comes from data on organised altruism. Altruism (doing good for other people)
is not part of the definition of social capital in my view, but it turns out empirically, at
least in the United States and probably elsewhere, that a very strong predictor of altruism
is social connectedness. That is, the people who give blood, give money, and have
volunteered their time are people who are more connected. By far the best predictor of
philanthropy, for example, is not how much money you have, but how many clubs you go
to or how often you go to church. There is a very strong affinity between social
connectedness and altruism. Therefore, it would be very interesting to ask about trends in
philanthropy, or for that matter volunteering or blood-giving over time.
8
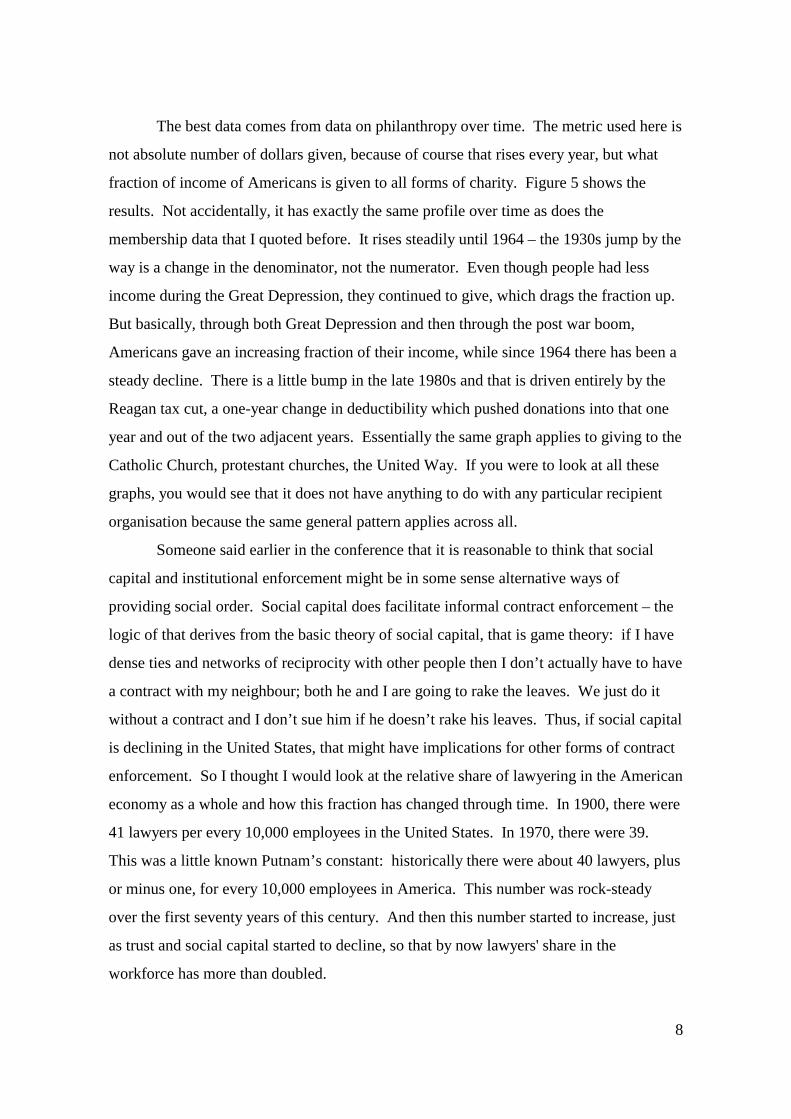
The best data comes from data on philanthropy over time. The metric used here is
not absolute number of dollars given, because of course that rises every year, but what
fraction of income of Americans is given to all forms of charity. Figure 5 shows the
results. Not accidentally, it has exactly the same profile over time as does the
membership data that I quoted before. It rises steadily until 1964 – the 1930s jump by the
way is a change in the denominator, not the numerator. Even though people had less
income during the Great Depression, they continued to give, which drags the fraction up.
But basically, through both Great Depression and then through the post war boom,
Americans gave an increasing fraction of their income, while since 1964 there has been a
steady decline. There is a little bump in the late 1980s and that is driven entirely by the
Reagan tax cut, a one-year change in deductibility which pushed donations into that one
year and out of the two adjacent years. Essentially the same graph applies to giving to the
Catholic Church, protestant churches, the United Way. If you were to look at all these
graphs, you would see that it does not have anything to do with any particular recipient
organisation because the same general pattern applies across all.
Someone said earlier in the conference that it is reasonable to think that social
capital and institutional enforcement might be in some sense alternative ways of
providing social order. Social capital does facilitate informal contract enforcement – the
logic of that derives from the basic theory of social capital, that is game theory: if I have
dense ties and networks of reciprocity with other people then I don’t actually have to have
a contract with my neighbour; both he and I are going to rake the leaves. We just do it
without a contract and I don’t sue him if he doesn’t rake his leaves. Thus, if social capital
is declining in the United States, that might have implications for other forms of contract
enforcement. So I thought I would look at the relative share of lawyering in the American
economy as a whole and how this fraction has changed through time. In 1900, there were
41 lawyers per every 10,000 employees in the United States. In 1970, there were 39.
This was a little known Putnam’s constant: historically there were about 40 lawyers, plus
or minus one, for every 10,000 employees in America. This number was rock-steady
over the first seventy years of this century. And then this number started to increase, just
as trust and social capital started to decline, so that by now lawyers' share in the
workforce has more than doubled.
9
A corollary to Putnam’s law was that there should be one doctor for every lawyer,
or one lawyer for every doctor, in America. But that too has changed, because the post-
1970 jump in lawyering has not been matched by one for doctoring. Thus the jump in
lawyers per capita is not simply a reflection of a general increase in professionals in
America; it is unique to lawyers. In fact, over most of the century, the ratio of engineers
to lawyers shifted sharply in the direction of more engineers per lawyer, but since 1970
that trend has reversed. You would think that as a country becomes more technologically
intensive, more and more of its workforce would be trained engineers, but in fact since
1970 that trend has completely reversed.
What I claim to have shown so far is that by a variety of different measures there
has been a massive transformation of social bonds in America over our lifetime. And it is
very important for my countrymen and me to figure out why that happened and how we
can reverse it.
My responsibility in the OECD context is to talk about the concept of social
capital, about the measurement of social capital, and about its consequences. What I have
done so far is illustrate how a workaday researcher in the field of social capital looks
desperately for different measures of social capital and tries to triangulate among those
measures to see if there is any convergence among stories told by different indicators.
My book (Putnam 2000) deals with the extent, causes and consequences of these
changes in much more detail. Specifically, it deals with four questions:
The first is, “What has been happening to American social capital?” It has not
always been in decline. Within living memory, Americans were spending more and more
time playing cards with each other, giving more money, connecting more and more.
Suddenly, for some mysterious reason, in the middle 1960s those trends began to reverse
and they have been reversing quite sharply over the last thirty-five years.
The second question in the book is, “Why?” But I am not going to address that
question here.
The third question is, “What can we do about it in the United States?” I have
some ideas about that, but again I am not going to address those here.
The fourth question is, “So what? Does it matter?” That is what I am going to
deal with here. What evidence is there for plausibly believing that it is not just a matter
10
of warm cuddly feelings that we are lacking? There are measurable consequences to
social capital.
Think of me now as explicating and giving a particular example of many of the
generalisations that Michael Woolcock has offered, for example on the effects of social
capital on crime, health and so on. I am going to talk about those in the particular context
of my research project, taking advantage of the fact that in the United States we have fifty
states, which hold some things constant but not others. Across all the American states, I
have developed 13 different measures of social capital. Many of these I have already
described: the fraction of people in the state who had in the previous year served on a
committee of some local organisation, or as an officer of a local organisation, the number
of club meetings attended, the number of club memberships, the turnout at the
presidential election, the number of public meetings attended, and so on.
I have, for the sake of simplicity, combined all of those measures, via factor
analysis, into a single measure. You can think of that as the latent variable that is
measured by the overlap among all these individual indicators. Operationally what I will
mean by social capital in what follows is the degree to which a given state is either high
or low in the number of meetings citizens go to, the level of social trust its citizens have,
the degree to which they spend time visiting one another at home, the frequency with
which they vote, the frequency with which they do volunteering, and so on.
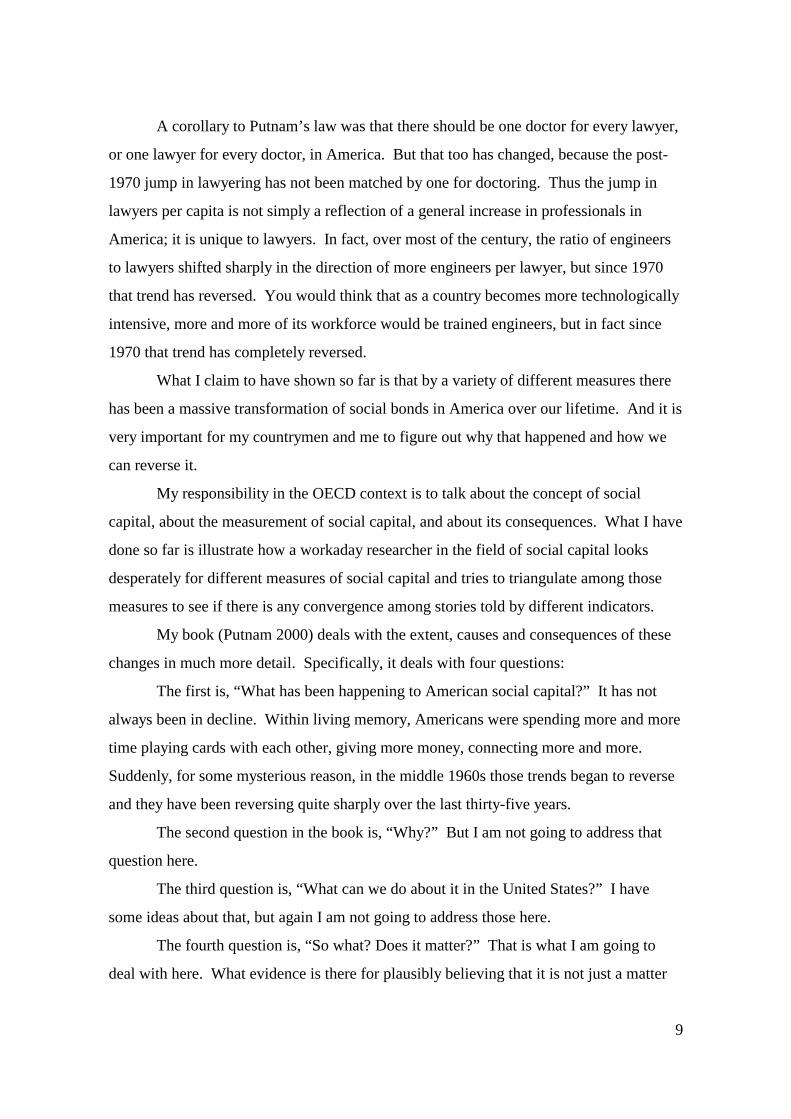
Figure 6 provides a social capital map of the United States. It is appropriate, I
think, given the venue of our meeting, that the best single predictor of the level of social
capital in American states is distance to the Canadian border. Being closer to the
Canadian border means more social capital. Actually, if you looked at that graph in more
detail you would see that it can be described in terms of a barometric map with one high,
centred over Minneapolis-St. Paul, and one low, centred over Baton Rouge, Louisiana.
There are probably deep historical roots of that pattern. It is not an accident that the low
social capital is very clearly associated with the depth of slavery in the nineteenth century,
and that is because slavery as a system and the post-slavery reconstruction period were
institutionally designed to destroy social capital. This is what slavery was about; it was
about destroying social capital, because social capital, among Blacks at least, and later in
post-slavery, social connection between Blacks and poor Whites, would have threatened
11
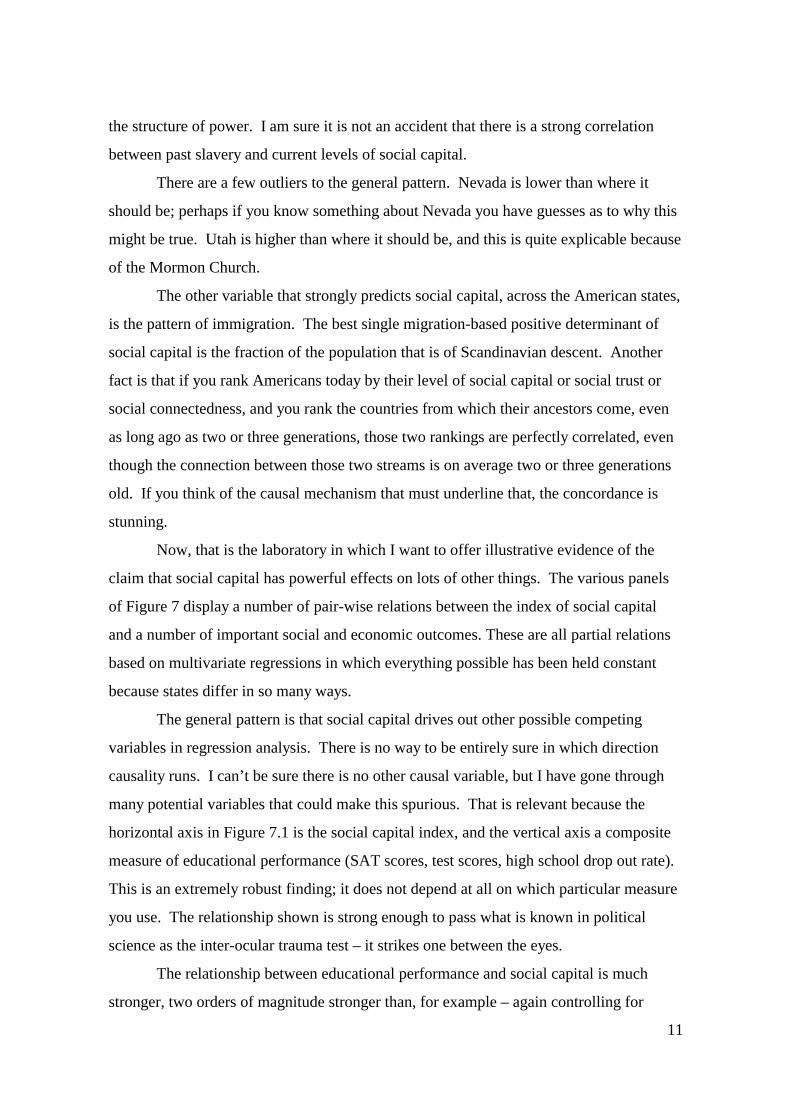
the structure of power. I am sure it is not an accident that there is a strong correlation
between past slavery and current levels of social capital.
There are a few outliers to the general pattern. Nevada is lower than where it
should be; perhaps if you know something about Nevada you have guesses as to why this
might be true. Utah is higher than where it should be, and this is quite explicable because
of the Mormon Church.
The other variable that strongly predicts social capital, across the American states,
is the pattern of immigration. The best single migration-based positive determinant of
social capital is the fraction of the population that is of Scandinavian descent. Another
fact is that if you rank Americans today by their level of social capital or social trust or
social connectedness, and you rank the countries from which their ancestors come, even
as long ago as two or three generations, those two rankings are perfectly correlated, even
though the connection between those two streams is on average two or three generations
old. If you think of the causal mechanism that must underline that, the concordance is
stunning.
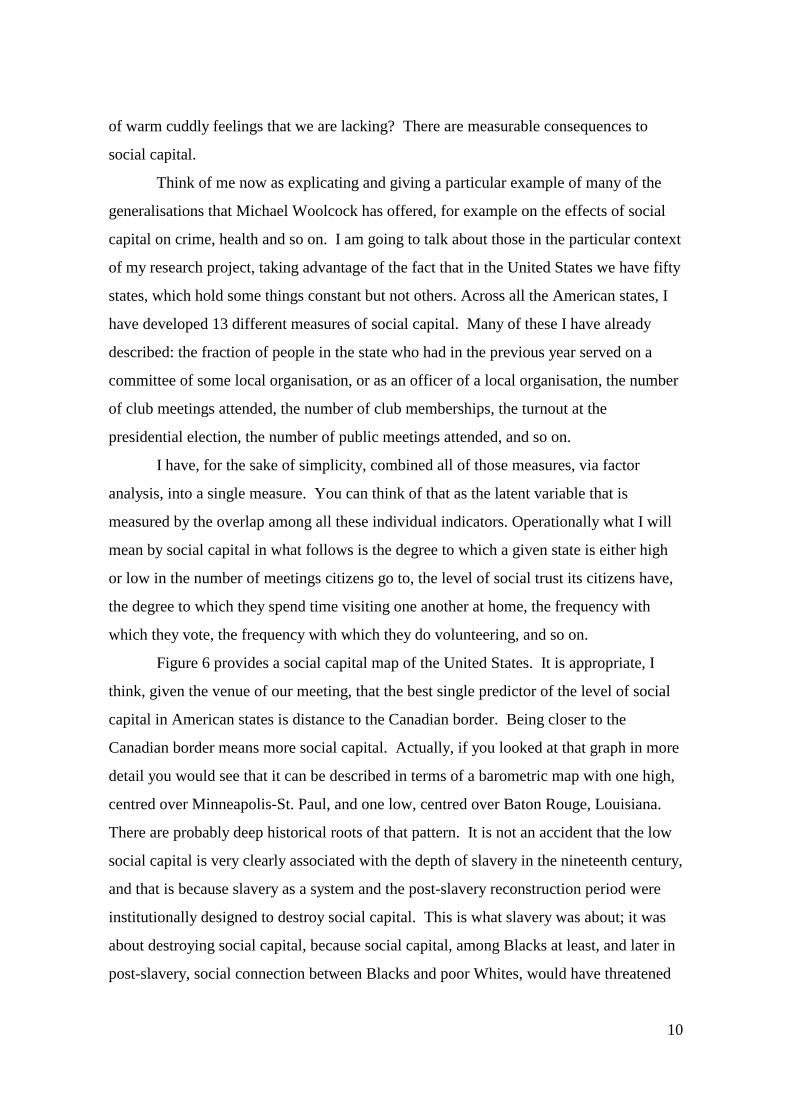
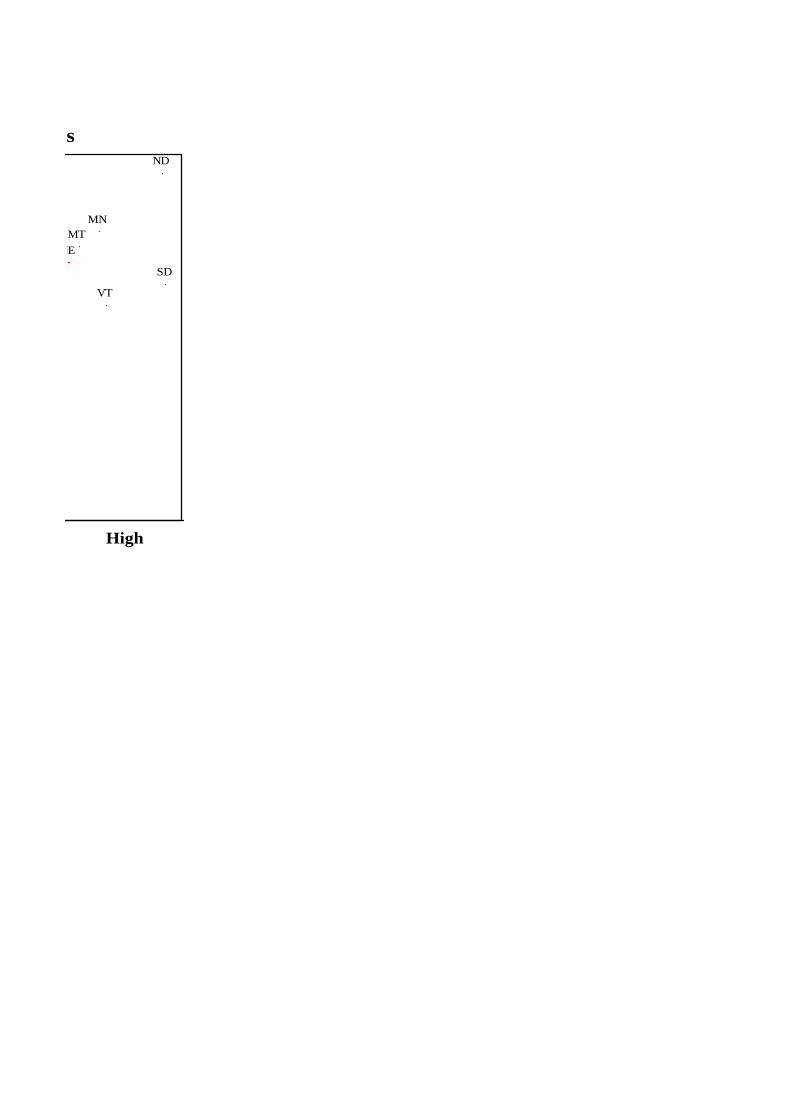
Now, that is the laboratory in which I want to offer illustrative evidence of the
claim that social capital has powerful effects on lots of other things. The various panels
of Figure 7 display a number of pair-wise relations between the index of social capital
and a number of important social and economic outcomes. These are all partial relations
based on multivariate regressions in which everything possible has been held constant
because states differ in so many ways.
The general pattern is that social capital drives out other possible competing
variables in regression analysis. There is no way to be entirely sure in which direction
causality runs. I can’t be sure there is no other causal variable, but I have gone through
many potential variables that could make this spurious. That is relevant because the
horizontal axis in Figure 7.1 is the social capital index, and the vertical axis a composite
measure of educational performance (SAT scores, test scores, high school drop out rate).
This is an extremely robust finding; it does not depend at all on which particular measure
you use. The relationship shown is strong enough to pass what is known in political
science as the inter-ocular trauma test – it strikes one between the eyes.
The relationship between educational performance and social capital is much
stronger, two orders of magnitude stronger than, for example – again controlling for

12
everything else – spending on schools or teacher/pupil ratios or any of the obvious things
that are more usually thought to increase educational performance. Figure 7.2 shows a
composite measure of child welfare (it includes teen pregnancy, infant mortality and a
variety of other measures of how well kids do) and again there is a very strong
relationship showing that, in general, the welfare of children is higher where social capital
is higher. Figure 7.3 shows that states where children watch less TV have higher levels
of social capital, a relationship I study in much more detail in my book.
Crime is strongly negatively predicted by social capital; this is true at the state
level, but it is also true at the community and neighbourhood levels. Once again the
strongest predictor of the murder rate is a low level of social capital. It is stronger than
poverty; it is stronger than other plausible measures. Figure 7.4 shows that murder rates
are lower in states where social capital is higher, and Figure 7.5 shows that people are
generally less pugnacious where social capital is high.
As Michael Woolcock and other authors have pointed out, there is very strong
evidence of powerful health effects of social connectedness. The evidence is strong not
only in American states, but also in Finland, Japan, and other countries. Controlling for
your blood chemistry, age, gender, whether or not you jog, and for all other risk factors,
your chance of dying over the course of the next year are cut in half by joining one group,
and cut to a quarter by joining two groups. This is not cheating; these are prospective
studies. It is not that people who are healthy become joiners, it is clear from the studies
that the arrow runs in the other direction, from joining to health. These are big effects, as
can been seen in Figure 7.6. Once again, these same results are confirmed by a multitude
of individual-level, over-time studies.
Figure 7.7 shows that interstate variance in the percentage of tax evasion, as
measured by the IRS, is strongly related to differences in social capital at the state level.
No other variable does as well at explaining why states differ in tax evasion. In other
words, where people are connected by dense networks of engagement and reciprocity,
they are more likely to comply with the law, very probably because they are more
confident that others will, too, so they will not be "suckers" in this dilemma of collective
action. Figure 7.8 shows that states where people are more connected with each other are
also marked by greater tolerance.
13
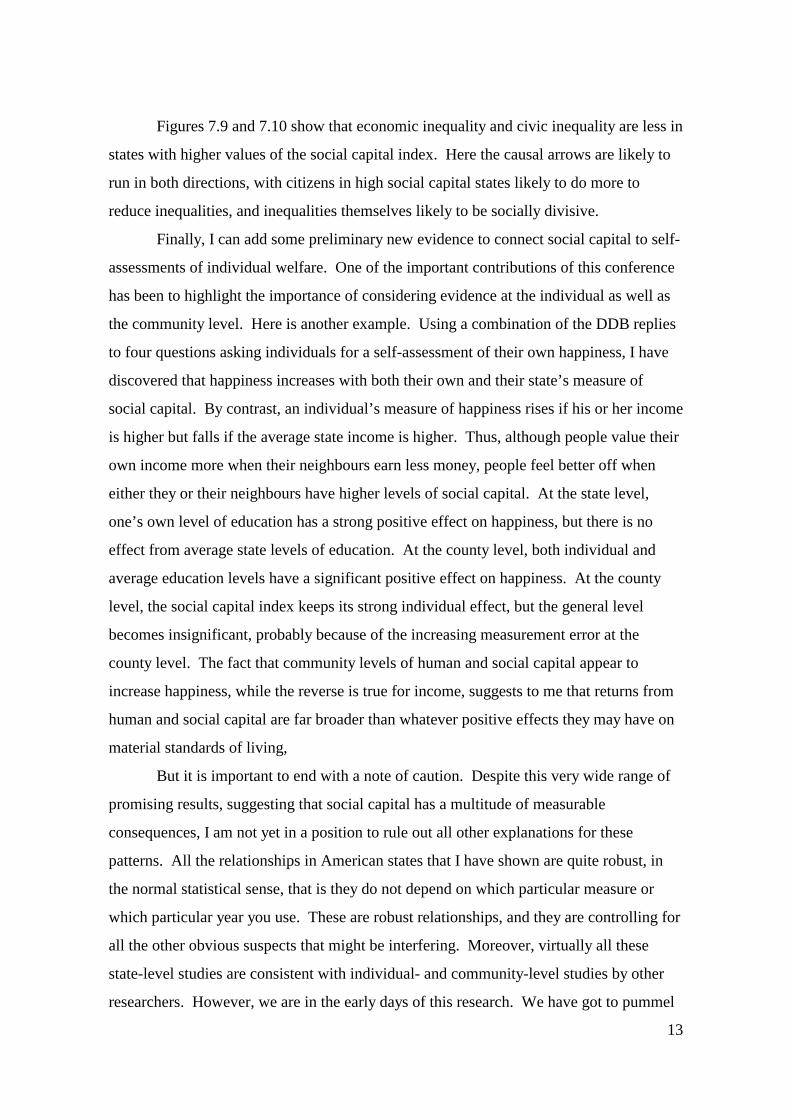
Figures 7.9 and 7.10 show that economic inequality and civic inequality are less in
states with higher values of the social capital index. Here the causal arrows are likely to
run in both directions, with citizens in high social capital states likely to do more to
reduce inequalities, and inequalities themselves likely to be socially divisive.
Finally, I can add some preliminary new evidence to connect social capital to self-
assessments of individual welfare. One of the important contributions of this conference
has been to highlight the importance of considering evidence at the individual as well as
the community level. Here is another example. Using a combination of the DDB replies
to four questions asking individuals for a self-assessment of their own happiness, I have
discovered that happiness increases with both their own and their state’s measure of
social capital. By contrast, an individual’s measure of happiness rises if his or her income
is higher but falls if the average state income is higher. Thus, although people value their
own income more when their neighbours earn less money, people feel better off when
either they or their neighbours have higher levels of social capital. At the state level,
one’s own level of education has a strong positive effect on happiness, but there is no
effect from average state levels of education. At the county level, both individual and
average education levels have a significant positive effect on happiness. At the county
level, the social capital index keeps its strong individual effect, but the general level
becomes insignificant, probably because of the increasing measurement error at the
county level. The fact that community levels of human and social capital appear to
increase happiness, while the reverse is true for income, suggests to me that returns from
human and social capital are far broader than whatever positive effects they may have on
material standards of living,
But it is important to end with a note of caution. Despite this very wide range of
promising results, suggesting that social capital has a multitude of measurable
consequences, I am not yet in a position to rule out all other explanations for these
patterns. All the relationships in American states that I have shown are quite robust, in
the normal statistical sense, that is they do not depend on which particular measure or
which particular year you use. These are robust relationships, and they are controlling for
all the other obvious suspects that might be interfering. Moreover, virtually all these
state-level studies are consistent with individual- and community-level studies by other
researchers. However, we are in the early days of this research. We have got to pummel
14
a lot of different datasets. We must look at lots of micro level data, not just at the very
aggregated level of states. We must also compare data across countries, and we have to
do experimental work.
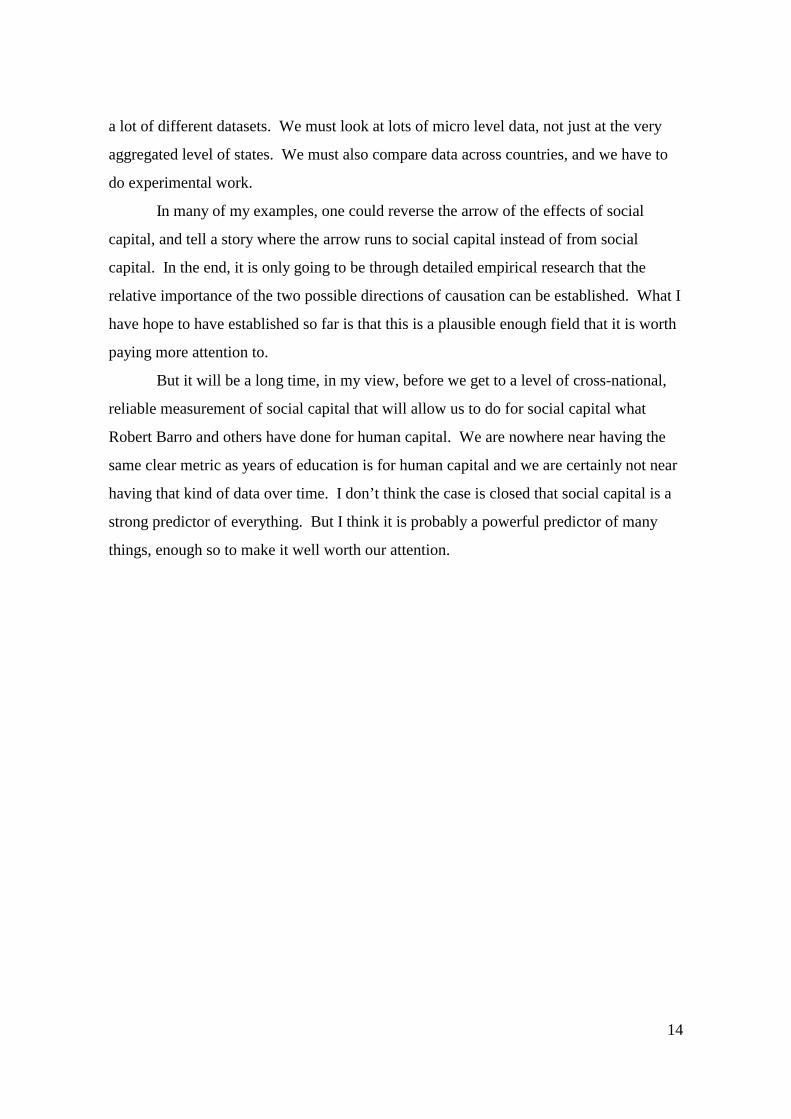
In many of my examples, one could reverse the arrow of the effects of social
capital, and tell a story where the arrow runs to social capital instead of from social
capital. In the end, it is only going to be through detailed empirical research that the
relative importance of the two possible directions of causation can be established. What I
have hope to have established so far is that this is a plausible enough field that it is worth
paying more attention to.
But it will be a long time, in my view, before we get to a level of cross-national,
reliable measurement of social capital that will allow us to do for social capital what
Robert Barro and others have done for human capital. We are nowhere near having the
same clear metric as years of education is for human capital and we are certainly not near
having that kind of data over time. I don’t think the case is closed that social capital is a
strong predictor of everything. But I think it is probably a powerful predictor of many
things, enough so to make it well worth our attention.

15
References
Putnam, Robert (1995) “Bowling Alone: America’s Declining Social Capital” Journal ofDemocracy 6(1): 65-78.
Putnam, Robert (2000) Bowling Alone: The Collapse and Revival of AmericanCommunity (New York: Simon and Schuster).
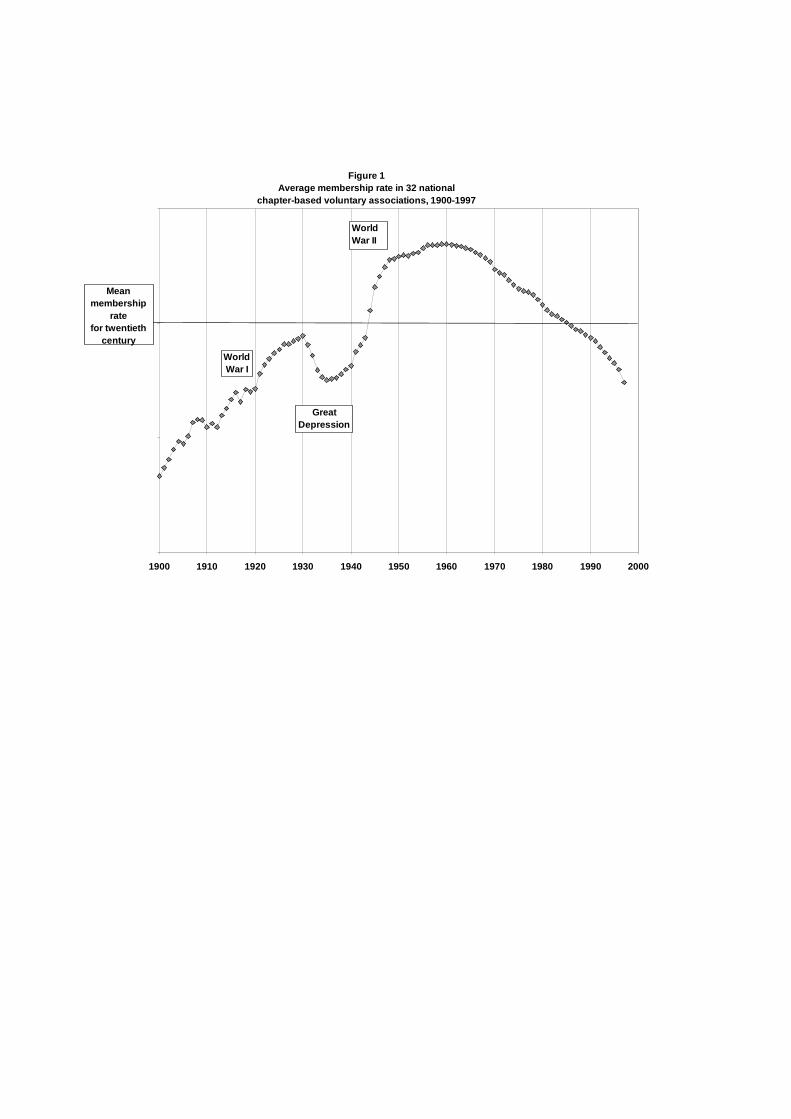
Figure 1Average membership rate in 32 national
chapter-based voluntary associations, 1900-1997
1900 1910 1920 1930 1940 1950 1960 1970 1980 1990 2000
WorldWar I
GreatDepression
WorldWar II
Mean membership
ratefor twentieth
century
Fig
ure 2
Active o
rgan
ization
al invo
lvemen
t, 1973-1994
0% 2% 4% 6% 8%
10%
12%
14%
16%
18%19701975
19801985
19901995
Percent who have served as officer or on committee (or both) for local club or organization in the past year
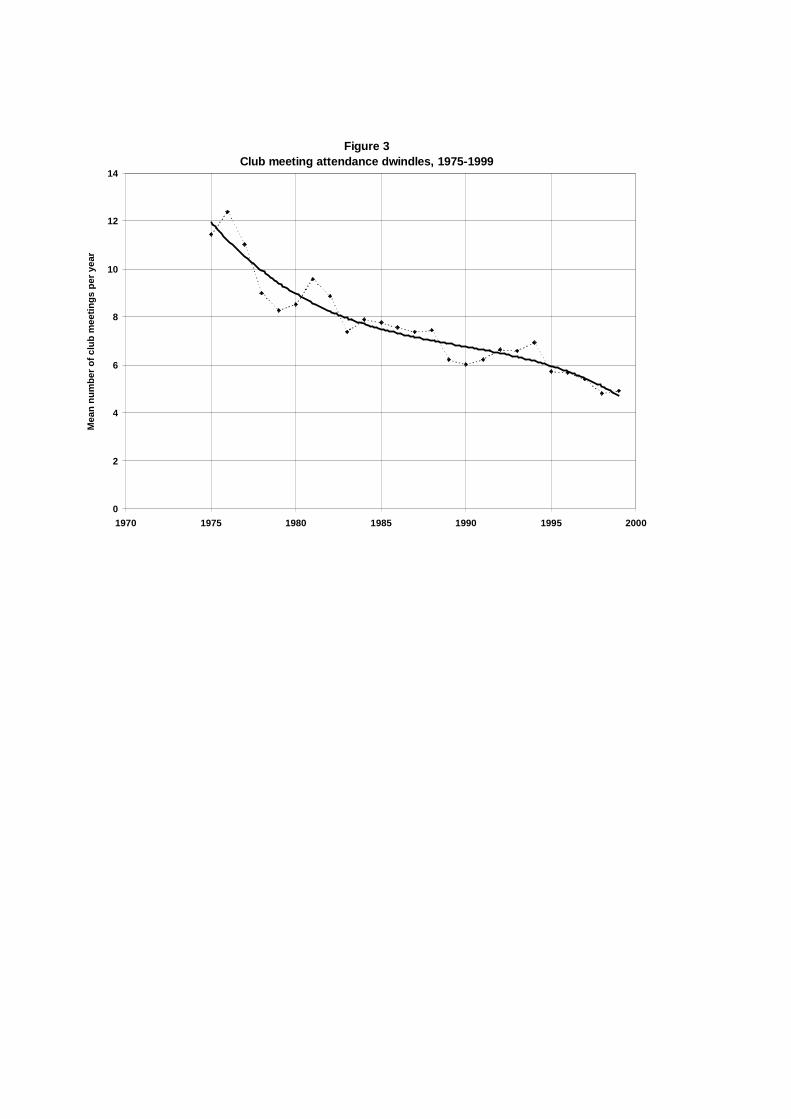
Figure 3Club meeting attendance dwindles, 1975-1999
0
2
4
6
8
10
12
14
1970 1975 1980 1985 1990 1995 2000
Mea
n n
um
ber
of
clu
b m
eeti
ng
s p
er y
ear
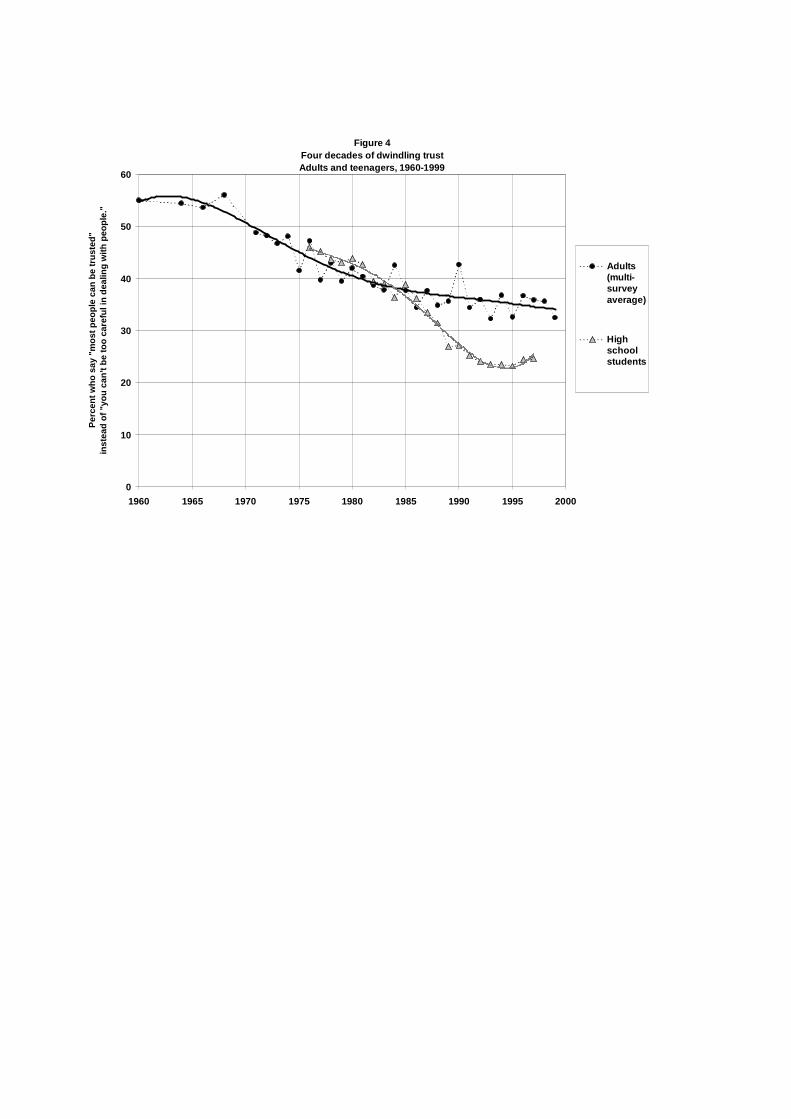
Figure 4Four decades of dwindling trustAdults and teenagers, 1960-1999
0
10
20
30
40
50
60
1960 1965 1970 1975 1980 1985 1990 1995 2000
Per
cen
t w
ho
say
"m
ost
peo
ple
can
be
tru
sted
"in
stea
d o
f "y
ou
can
’t b
e to
o c
aref
ul i
n d
ealin
g w
ith
peo
ple
."
Adults(multi-surveyaverage)
Highschoolstudents
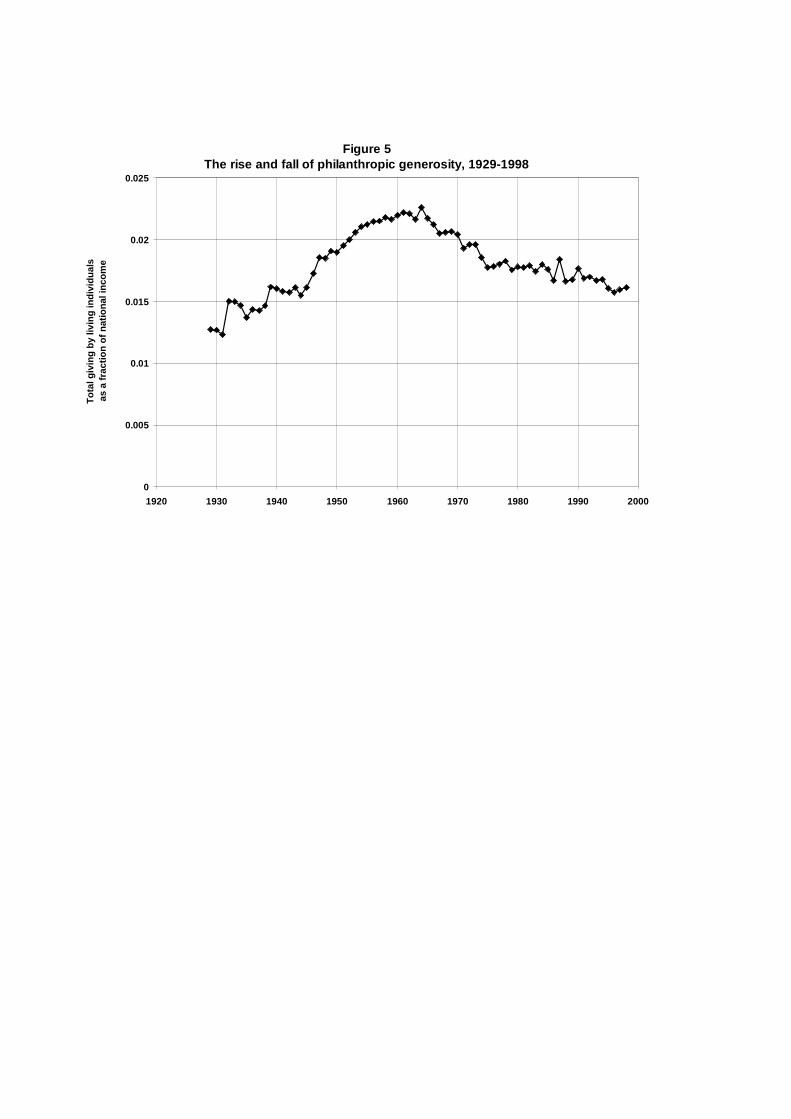
Figure 5The rise and fall of philanthropic generosity, 1929-1998
0
0.005
0.01
0.015
0.02
0.025
1920 1930 1940 1950 1960 1970 1980 1990 2000
To
tal g
ivin
g b
y liv
ing
ind
ivid
ual
sas
a f
ract
ion
of
nat
ion
al in
com
e
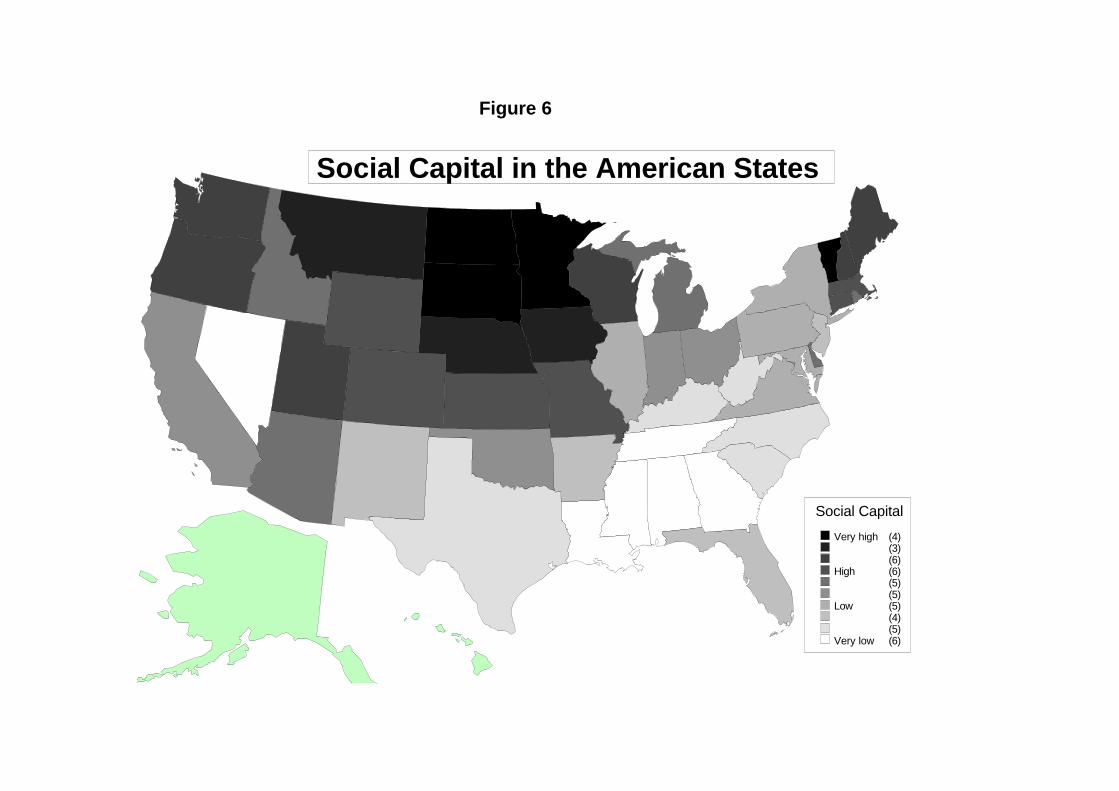
Figure 6
Social Capital
Very high (4) (3) (6)
High (6) (5) (5)
Low (5) (4) (5)
Very low (6)
Social Capital in the American States
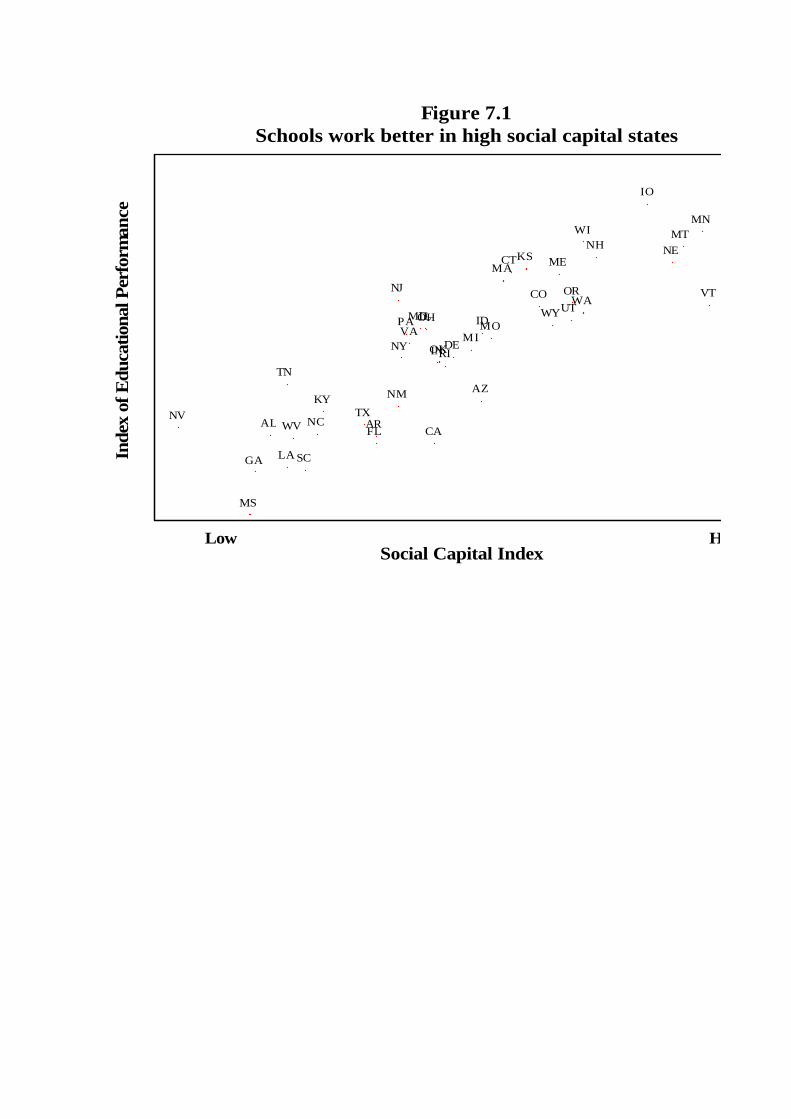
Figure 7.1 Schools work better in high social capital states
Social Capital Index
Inde
x of
Edu
catio
nal P
erfo
rman
ce
WY
WI
WV
WA
VA
VT UT
TX
TN
SC
RI
PA
OR
OK
OH
NC
NY
NM
NJ
NH
NV
NE MT
MO
MS
MN
MI
MA
MD
ME
LA
KY
KS
IO
IN
IL ID
GA FL
DE
CT
CO
CA AR
AZ
AL
Low High
Schools work better in high social capital states
VT SD
ND
NE MT
MN
High

Figure 7.2 Kids are better off in high social capital states
Social Capital Index
Chi
ld W
elfa
re I
ndex
(199
8)
WY
WI
WV
WA VA
VT UT
TX
TN
SD
SC
RI PA OR
OK
OH
ND
NC
NY
NM
NJ
NH
NV
NE
MT
MO
MS
MN
MI
MA
MD
ME
LA
KY
KS
IA
IN
IL
ID
GA FL
DE
CT
CO
CA
AR AZ
AL
Loww
High
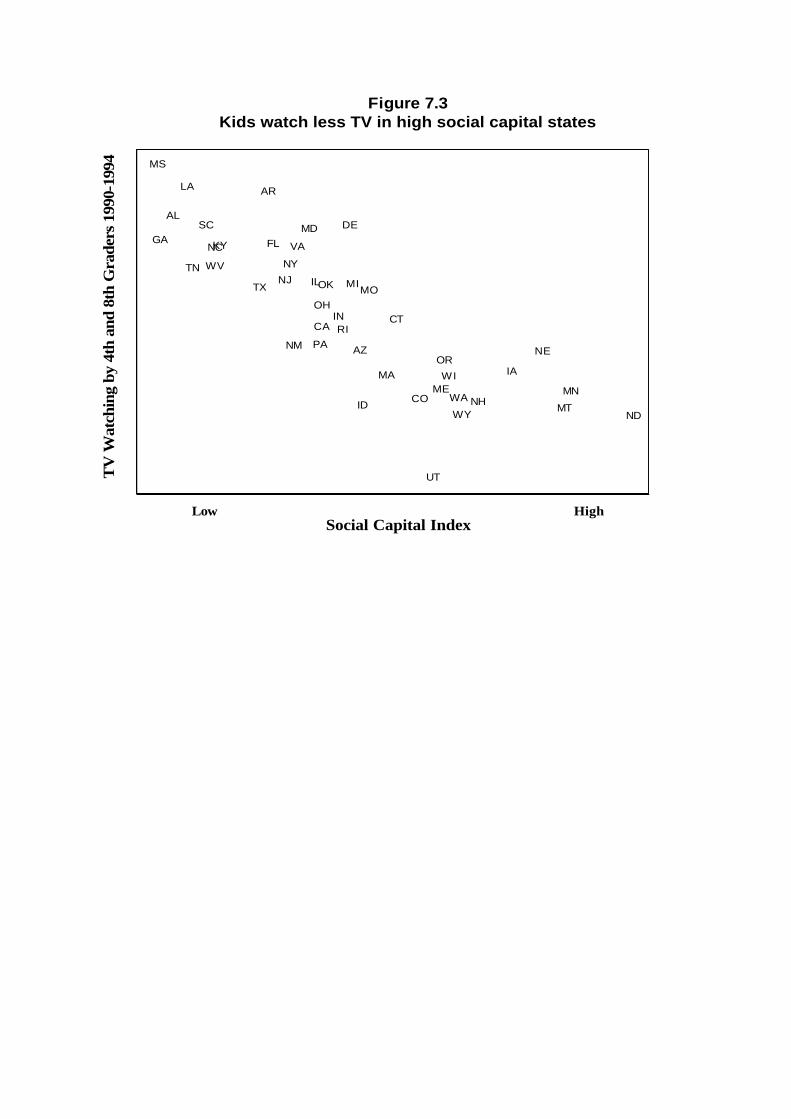
Figure 7.3 Kids watch less TV in high social capital states
Social Capital Index
TV
Wat
chin
g by
4th
and
8th
Gra
ders
199
0-19
94
WY
WI
WV
WA
VA
UT
TX TN
SC
RI PA
OR
OK OH
ND
NC NY
NM
NJ
NH
NE
MT
MO
MS
MN
MI
MA
MD
ME
LA
KY
IA
IN
IL
ID
GA FL DE
CT
CO
CA
AR
AZ
AL
Low High
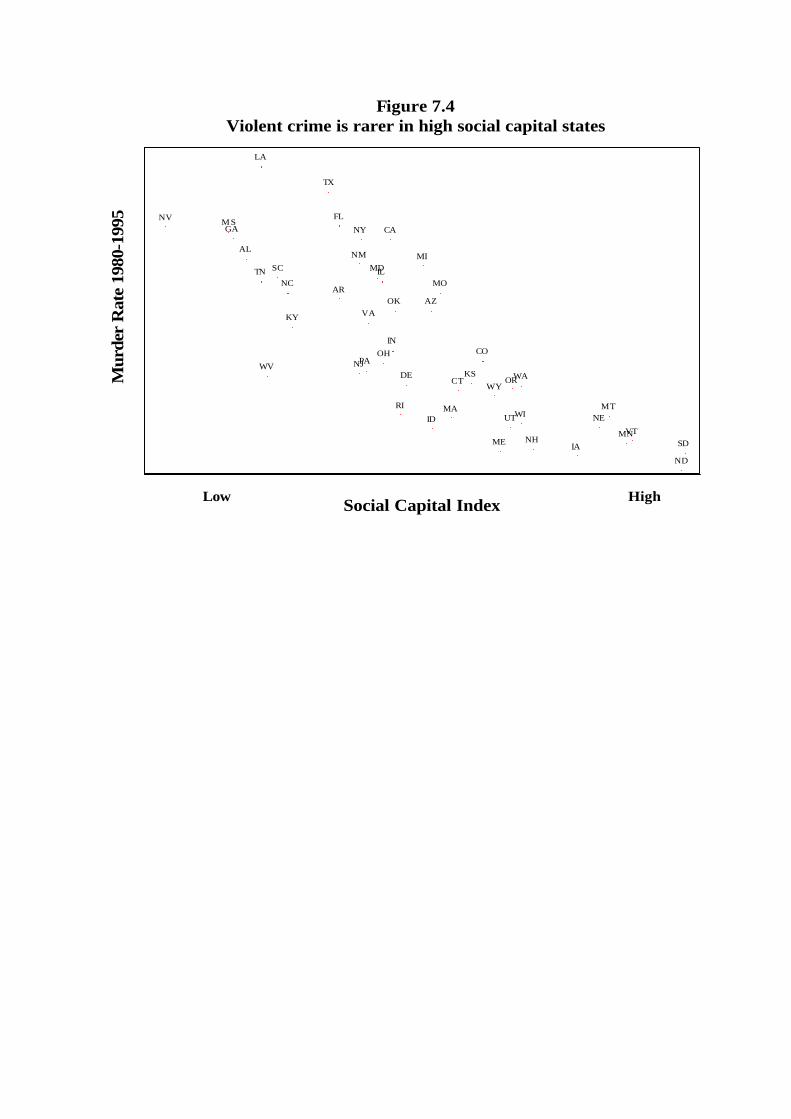
Figure 7.4 Violent crime is rarer in high social capital states
Social Capital Index
Mur
der
Rat
e 19
80-1
995
WY
WI
WV WA
VA
VT UT
TX
TN
SD
SC
RI
PA OR
OK
OH
ND
NC
NY NM
NJ
NH
NV
NE MT
MO
M S
MN
MI
MA
MD
ME
LA
KY
KS
IA
IN
IL
ID
GA FL
DE CT
CO
CA
AR AZ
AL
Low High
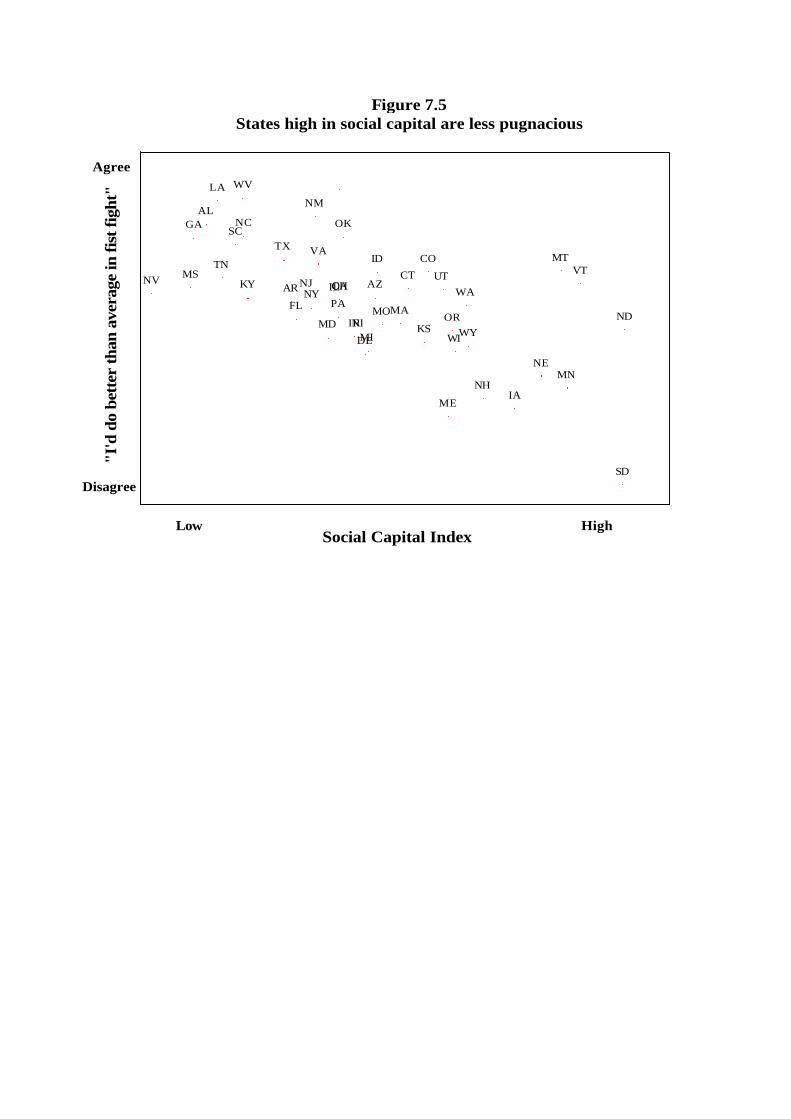
Figure 7.5 States high in social capital are less pugnacious
Social Capital Index
"I'd
do
bett
er th
an a
vera
ge in
fist
figh
t"
WY WI
WV
WA
VA VT UT
TX TN
SD
SC
RI PA
OR
OK
OH
ND
NC
NY
NM
NJ
NH
NV
NE
MT
MO
MS
MN
MI
MA MD
ME
LA
KY
KS
IA
IN
IL
ID
GA
FL
DE
CT CO
CA AR AZ
AL
Low High
Agree
Disagree
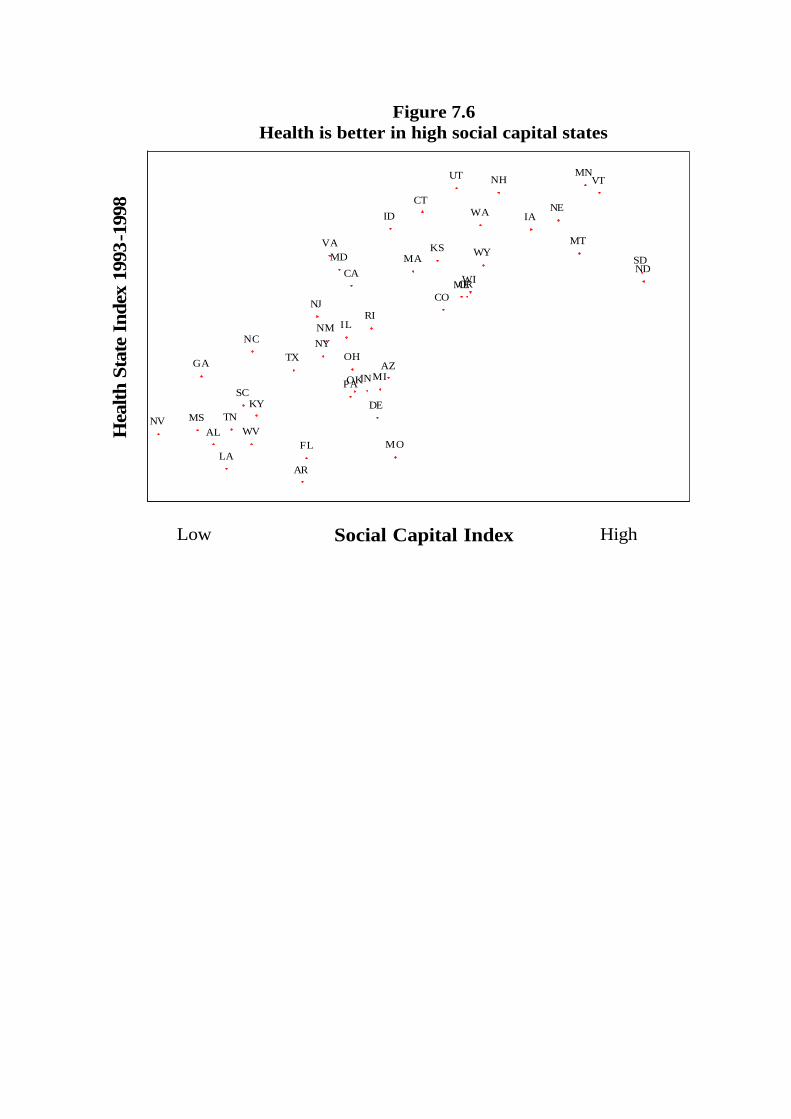
Figure 7.6 Health is better in high social capital states
Social Capital Index
Hea
lth S
tate
Ind
ex 1
993-
1998
WY WI
WV
WA
VA
VT UT
TX
TN
SD
SC
RI
PA
OR
OK OH
ND
NC NY NM
NJ
NH
NV
NE
MT
MO MS
MN
MI
MA MD
ME
LA
KY
KS
IA
IN
IL
ID
GA
FL
DE
CT
CO CA
AR
AZ
AL
Low High

Figure 7.7
Tax evasion is low where social capital is high
Social Capital Index
IRS
Cri
min
al R
efer
rals
and
Con
vict
ions
199
2-19
96
WY
WI
WV
WA
VA
VT
UT
TX
TN
SD
SC
RI
PA OR
OK
OH
ND NC
NY
NM
NJ
NH
NV
NE MT
MO MS
MN
MI MA
MD
ME LA
KY
KS IA
IN IL
ID GA
FL DE
DC
CT CO
CA AR AZ AL
Low High
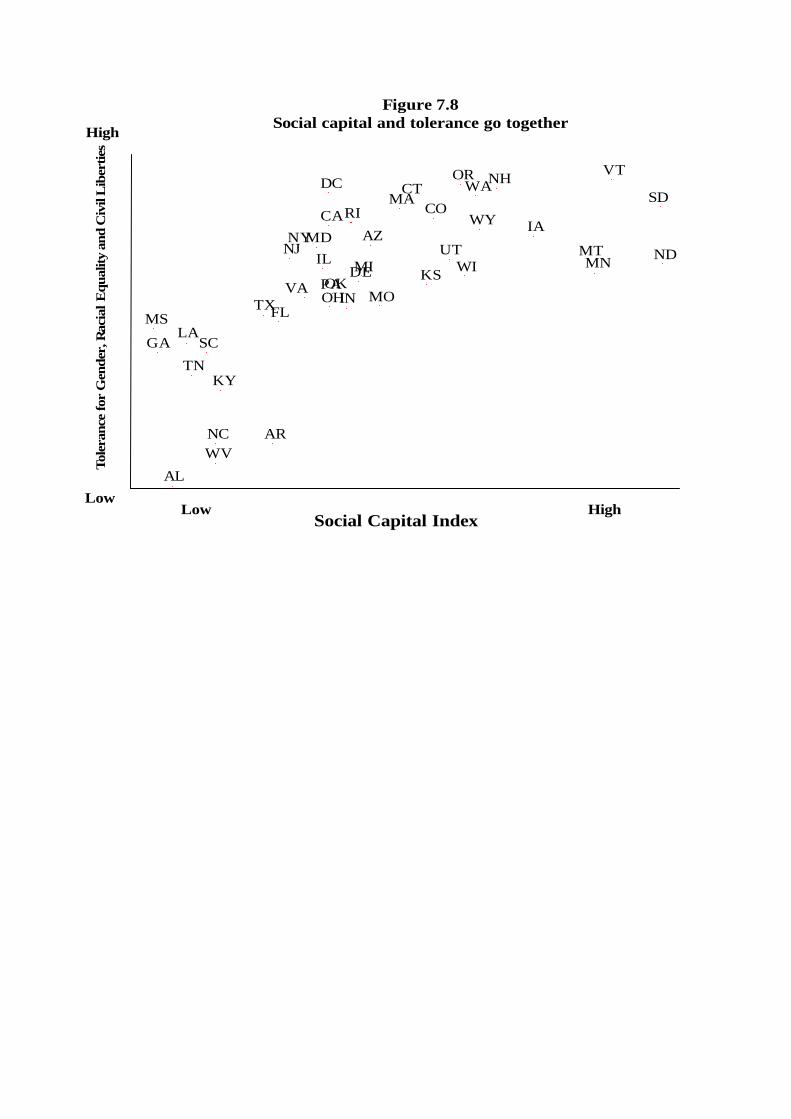
Figure 7.8 Social capital and tolerance go together
Social Capital Index
Tole
ranc
e fo
r G
ende
r, R
acia
l Equ
ality
and
Civ
il L
iber
ties
WY
WI
WV
WA
VA
VT
UT
TX
TN
SD
SC
RI
PA
OR
OK OH
ND
NC
NY NJ
NH
MT
MO
MS
MN MI
MA
MD
LA
KY
KS
IA
IN
IL
GA
FL
DE
DC CT CO CA
AR
AZ
AL
Low High
High
Low
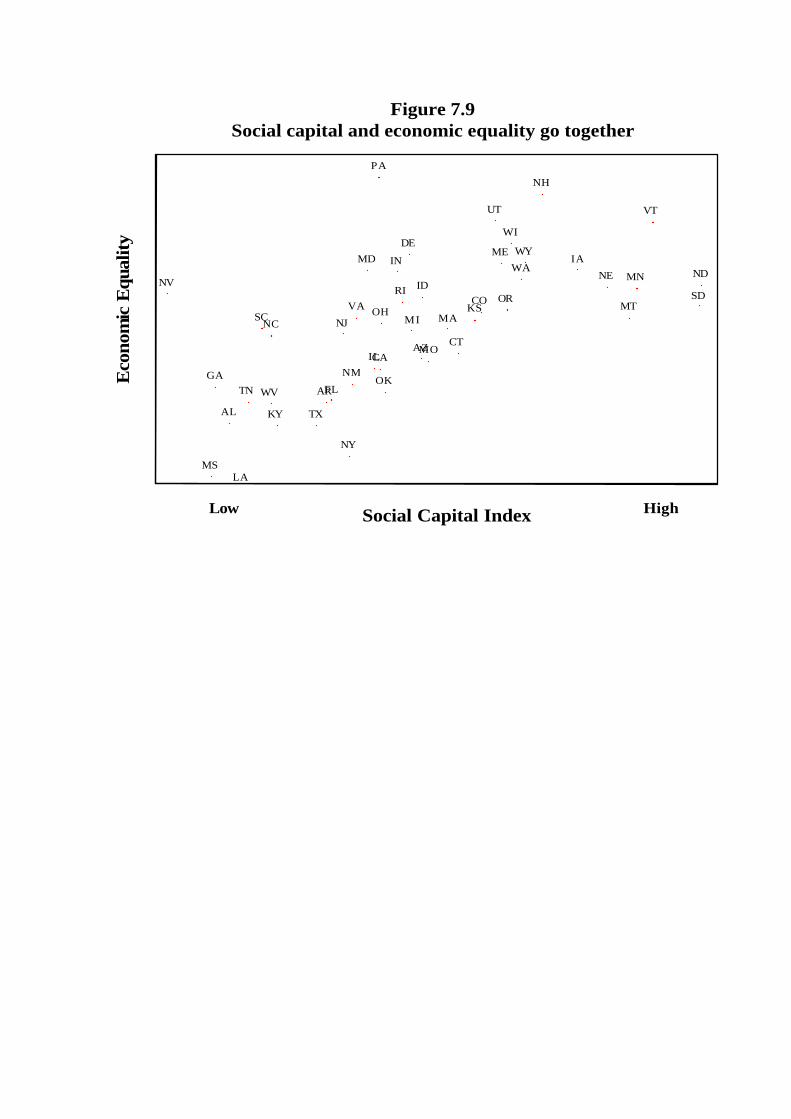
Figure 7.9 Social capital and economic equality go together
Social Capital Index
Eco
nom
ic E
qual
ity
WY WI
WV
WA
VA
VT UT
TX TN
SD SC
RI
PA
OR
OK
OH
ND
NC
NY
NM
NJ
NH
NV NE
MT
MO
MS
MN
MI MA
MD ME
LA
KY
KS
IA IN
IL
ID
GA FL
DE
CT
CO
CA
AR
AZ
AL
Low High
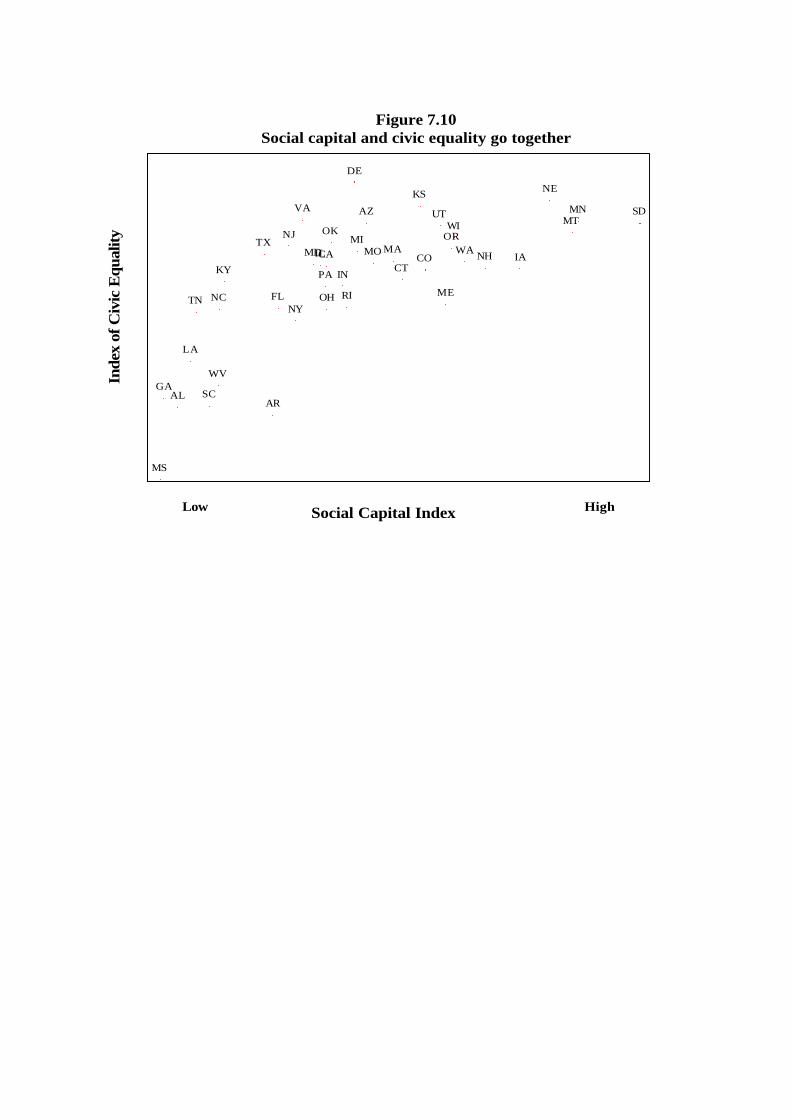
Figure 7.10
Social capital and civic equality go together
Social Capital Index
Inde
x of
Civ
ic E
qual
ity WI
WV
WA
VA UT
TX
TN
SD
SC
RI PA
OR OK
OH NC NY
NJ NH
NE
MT
MO
MS
MN
MI MA MD
ME
LA
KY
KS
IA IN
IL
GA
FL
DE
CT CO CA
AR
AZ
AL
Low High