social assistance policy development and the provision of ... · social assistance policy...
TRANSCRIPT

DELSA/ELSA/WD/SEM(2006)7
OECD SOCIAL, EMPLOYMENT AND MIGRATION WORKING PAPERS
Social Assistance Policy Development and the Provision of a Decent Level of Income in Selected
OECD Countries
Willem Adema
38

Unclassified DELSA/ELSA/WD/SEM(2006)7 Organisation de Coopération et de Développement Economiques Organisation for Economic Co-operation and Development 01-Aug-2006 ___________________________________________________________________________________________
English text only DIRECTORATE FOR EMPLOYMENT, LABOUR AND SOCIAL AFFAIRS EMPLOYMENT, LABOUR AND SOCIAL AFFAIRS COMMITTEE
OECD SOCIAL, EMPLOYMENT AND MIGRATION WORKING PAPERS NO. 38 SOCIAL ASSISTANCE POLICY DEVELOPMENT AND THE PROVISION OF A DECENT LEVEL OF INCOME IN SELECTED OECD COUNTRIES
Willem Adema
JEL Classification: H53, I31, I38
All Social, Employment and Migration Working Papers are now available through OECD's Internet website at http://www.oecd.org/els
JT03212444
Document complet disponible sur OLIS dans son format d'origine Complete document available on OLIS in its original format
DE
LSA
/EL
SA/W
D/SE
M(2006)7
Unclassified
English text only
DELSA/ELSA/WD/SEM(2006)7
2
DIRECTORATE FOR EMPLOYMENT, LABOUR AND SOCIAL AFFAIRS
http://www.oecd.org/els
OECD SOCIAL, EMPLOYMENT AND MIGRATION WORKING PAPERS
http://www.oecd.org/els/workingpapers
This series is designed to make available to a wider readership selected labour market, social policy and migration studies prepared for use within the OECD. Authorship is usually collective, but principal writers are named. The papers are generally available only in their original language � English or French � with a summary in the other. Comment on the series is welcome, and should be sent to the Directorate for Employment, Labour and Social Affairs, 2, rue André-Pascal, 75775 PARIS CEDEX 16, France.
The opinions expressed and arguments employed here are the responsibility of the author(s) and do not necessarily reflect those of the OECD
Applications for permission to reproduce or translate all or part of this material should be made to:
Head of Publications Service
OECD 2, rue André-Pascal
75775 Paris, CEDEX 16 France
Copyright OECD 2006

DELSA/ELSA/WD/SEM(2006)7
3
SUMMARY
1. In many OECD countries, social assistance policy has a focus on promoting independence of claimants through social help and employment support policies. Nevertheless, financial support provided to address the immediate needs of households remains an important plank of social assistance policy. How is the level of such support determined in OECD countries? Do countries use measures reflecting a �basket of goods� that is considered to provide a minimum subsistence level, or a somewhat more generous standard of living? Are benefits increased automatically, along mechanisms triggered automatically by observable changes in price levels, or are benefit payment rates revised regularly in view of (minimum) wage developments, trends in the consumer price index or the changing state of public budgets?
2. These questions were among the issues discussed at the International Symposium on the Formulation of Standards for Urban Subsistence Security in China in June 2006, as organized by the German Technical Co-operation Institution, GTZ, on request of the Chinese Ministry of Civil Affairs. This paper, which was prepared for the symposium tries to illustrate the different ways of setting and adjusting social assistance payment rates in selected OECD countries. The paper has a focus on rate setting mechanisms in Belgium, Canada, the Czech Republic, Germany, Korea, the Netherlands, Norway, Sweden, Switzerland and the UK.
3. The paper starts with a brief look at social expenditure patterns and the importance of different social policy areas, in particular the role of social assistance policy within social protection systems. It then looks at the objectives of social assistance policy and considers payment-rates in terms of adequacy, financial incentives to work, addressing issues as budget standards, indexation methods and the policy approach towards specific client groups. Also, the study briefly highlights Chinese public expenditure issues more generally and presents some key indicators on the dynamics of ageing populations which will have consequences for future social expenditure trends in China.

DELSA/ELSA/WD/SEM(2006)7
4
RÉSUMÉ
4. Dans de nombreux pays de l�OCDE, les politiques d�aide sociale servent à promouvoir l�indépendance des bénéficiaires par le biais de politiques d�assistance sociale et d�aide à l�emploi. Néanmoins, l�appui financier dégagé pour répondre aux besoins immédiats des foyers reste un point important des politiques d�aide sociale. Comment le niveau d�un tel appui est-il défini dans les pays de l�OCDE ? Les pays usent-ils de mesures reflétant le « panier de biens » comme référence du niveau de subsistance minimum, ou d�un standard de vie quelque peu plus généreux ? Les prestations sociales augmentent-elles automatiquement selon un mécanisme déclenché machinalement par l�observation des changements du niveau des prix, ou les taux de versement des prestations sont-ils réévalués régulièrement en fonction des évolutions des salaires (minimums), des tendances de l�indice des prix à la consommation ou de leur position changeante dans le budget des États ?
5. Ces questions faisaient partie de celles débattues lors du Colloque International sur la Formulation des Standards pour la Sécurité de Subsistance Urbaine en Chine au mois de juin 2006, organisé par l�Institut Allemand de Coopération Technique (GTZ), à la demande du Ministère Chinois des Affaires Publiques. Ce document, préparé pour le colloque, tente d�illustrer les différentes façons d�établir et d�ajuster les taux de versement de l�aide sociale dans des pays de l�OCDE choisis. Il focalise sur les mécanismes de la mise en place des taux en Allemagne, en Belgique, au Canada, en Corée, en Norvège, aux Pays-Bas, en République Tchèque, au Royaume-Uni, en Suède et en Suisse.
6. Le document commence par un bref aperçu de modèles de dépenses sociales et l�importance des différents domaines des politiques sociales, notamment le rôle des politiques d�aide sociale au sein des systèmes de protection sociale. Il traite ensuite des objectifs des politiques d�aide sociale et des taux de versement en termes d�adéquation, d�incitations financières au travail, en abordant des questions telles que les standards budgétaires, les méthodes d�indexation et les politiques d�approche de groupes de clients spécifiques. L�étude fait également ressortir brièvement et de manière plus générale les questions relatives aux dépenses publiques chinoises et présente quelques indicateurs clés sur la dynamique des populations vieillissantes qui aura des conséquences sur les tendances des futures dépenses sociales en Chine.

DELSA/ELSA/WD/SEM(2006)7
5
TABLE OF CONTENTS
SUMMARY.................................................................................................................................................... 3 RÉSUMÉ ........................................................................................................................................................ 4 SOCIAL ASSISTANCE POLICY DEVELOPMENT AND THE PROVISION OF A DECENT LEVEL OF INCOME IN SELECTED OECD COUNTRIES ..................................................................................... 6
1. Context: a brief overview of welfare state development .................................................................. 7 1.1 The importance of different social policy areas.......................................................................... 8
2. The role of social assistance policies in selected OECD countries ................................................ 13 3. Providing a decent level of income ................................................................................................ 14
3.1 What determines a decent level of income?.............................................................................. 15 3.1.1 The role of different levels of government ........................................................................... 15 3.1.2 Internal logic in setting of benefit payments......................................................................... 16 3.1.3 External influences on payment............................................................................................ 16 3.1.4 The effect of household composition.................................................................................... 20 3.1.5 Provisions for special client groups ...................................................................................... 20
3.2 How are benefit payments adjusted over time? ....................................................................... 21 4. Promoting independence ................................................................................................................ 26
4.1 Balancing adequacy with incentives to work............................................................................ 26 5. Concluding remarks ....................................................................................................................... 27
BIBLIOGRAPHY......................................................................................................................................... 29
DELSA/ELSA/WD/SEM(2006)7
6
SOCIAL ASSISTANCE POLICY DEVELOPMENT AND THE PROVISION OF A DECENT LEVEL OF INCOME IN SELECTED OECD COUNTRIES1
7. There is no OECD or European model welfare state: social protection systems vary widely across the OECD area in size, institutional set-up and re-distributional nature (Esping-Andersen, 1990 and SCP, 2001). In some countries with very redistributive tax/benefit systems (Whiteford and Adema, 2006, forthcoming), such as Australia, public income support rates are flat rate payments which depend on family circumstances, and are lower for those with high income or assets (OECD, 1998a). Other OECD countries, including Germany, have developed welfare states where benefit entitlements are generally based on contributions by those in work and their employer, so that the level of transfer payments to households often depends on work history and contributory records (Adema, et al., 2003). In addition, these countries have social safety net arrangements for those without access to insurance-based social support.
8. Such �social assistance� support is targeted on households that are clustered within the lower segment of the income distribution, and is provided with multiple goals in mind: preventing extreme hardship among those with no other resources; reduce social exclusion; minimise disincentives to paid employment; and, promoting self-sufficiency.
9. The nature of such �social assistance� programmes vary across and within countries. Across the OECD, local governments often deliver social assistance, but their role in policy design and financing varies from one country to another. Moreover, there is great variety across countries in the rules (and their application) regarding establishing benefit eligibility, setting payment rates and their adjustment over time, the conditions of benefit receipt, and the intensity of public support for re-integration in the labour market.
10. This paper starts with an overall glance at the development of welfare states, the role of different social policy areas, and the importance of social assistance policy within social protection systems. It then looks at the objectives of social assistance policy and considers payment-rates in terms of adequacy, addressing issues as budget standards and the policy approach towards specific client groups. Before concluding, payment rates are also considered in the context of indexation methods and financial incentives to paid work. The analysis draws from OECD work on social assistance policy (OECD, 1998a, 1998b, 1999a, 2000a; and Adema, et al., 2003) and therefore includes a focus on Belgium, Canada, the Czech Republic, Germany, Korea, the Netherlands, Norway, Sweden, Switzerland and the UK. Indicators for Denmark, France, and the United States are also used where available.
1. The author is Head, Asian Social and Health Outreach in the OECD. He is very grateful to Maxime
Ladaique, Dominique Paturot and Chen Yuong for statistical support. The views expressed in this paper cannot be attributed to the OECD or its Member governments: as with any remaining errors, they are the responsibility of the author alone. This paper was presented at an International Symposium on the Formulation of Standards for Urban Subsistence Security in China, which took place 27-28 June 2006 in Beijing. This symposium was organized by the German Technical Co-operation Institution, GTZ legal Advisory Service (Deutsche Gesellschaft für Technische Zusammenarbeit) on request of the Chinese Ministry of Civil Affairs (MCA).
DELSA/ELSA/WD/SEM(2006)7
7
1. Context: a brief overview of welfare state development
11. Economic development has facilitated the development of welfare states in OECD countries. During the 1960s and until the first oil-shock in the early 1970s, real GDP in OECD countries grew particularly fast at 5 per cent per annum (OECD, 1999b). Thereafter, economic prosperity in OECD countries has continued to grow but growth-rates slowed down to about 2% per annum. Over 1991-2004, real GDP grew by 2.25% on average across the OECD, while over the same period real GDP grew by almost 10 percentage points for China (OECD, 2006a).
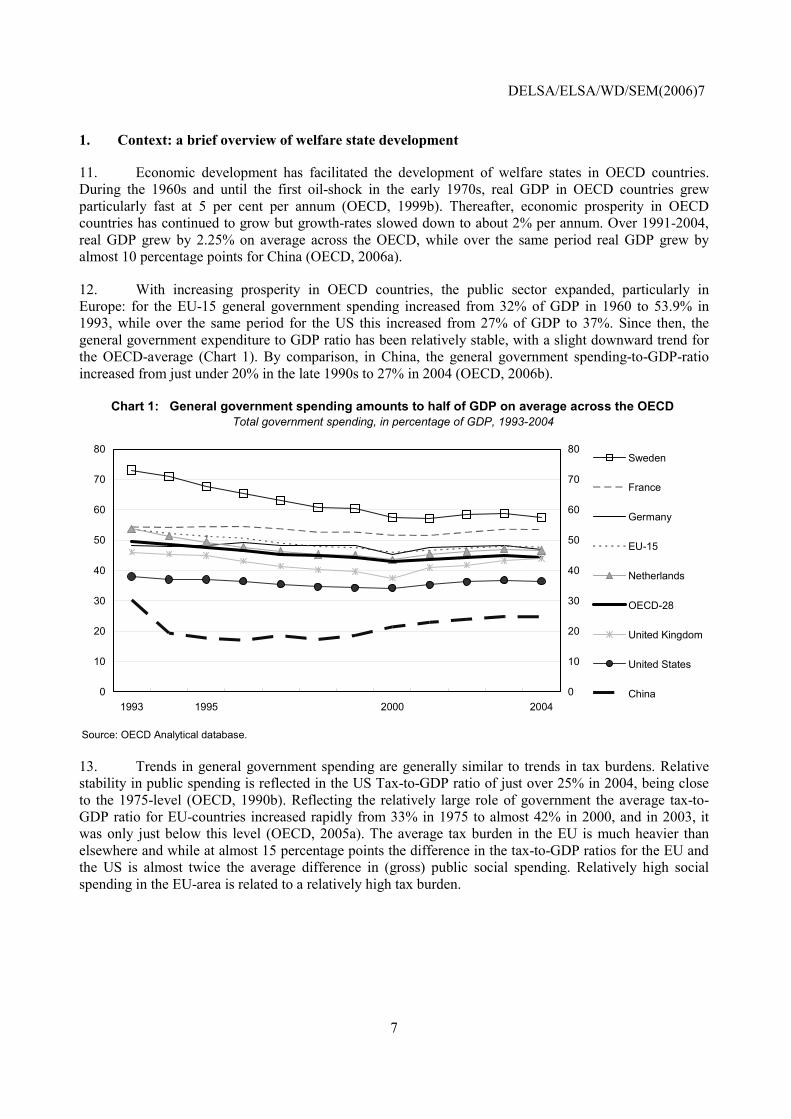
12. With increasing prosperity in OECD countries, the public sector expanded, particularly in Europe: for the EU-15 general government spending increased from 32% of GDP in 1960 to 53.9% in 1993, while over the same period for the US this increased from 27% of GDP to 37%. Since then, the general government expenditure to GDP ratio has been relatively stable, with a slight downward trend for the OECD-average (Chart 1). By comparison, in China, the general government spending-to-GDP-ratio increased from just under 20% in the late 1990s to 27% in 2004 (OECD, 2006b).
Source: OECD Analytical database.
Total government spending, in percentage of GDP, 1993-2004Chart 1: General government spending amounts to half of GDP on average across the OECD
0
10
20
30
40
50
60
70
80
1993 1995 2000 20040
10
20
30
40
50
60
70
80Sweden
France
Germany
EU-15
Netherlands
OECD-28
United Kingdom
United States
China
13. Trends in general government spending are generally similar to trends in tax burdens. Relative stability in public spending is reflected in the US Tax-to-GDP ratio of just over 25% in 2004, being close to the 1975-level (OECD, 1990b). Reflecting the relatively large role of government the average tax-to-GDP ratio for EU-countries increased rapidly from 33% in 1975 to almost 42% in 2000, and in 2003, it was only just below this level (OECD, 2005a). The average tax burden in the EU is much heavier than elsewhere and while at almost 15 percentage points the difference in the tax-to-GDP ratios for the EU and the US is almost twice the average difference in (gross) public social spending. Relatively high social spending in the EU-area is related to a relatively high tax burden.
DELSA/ELSA/WD/SEM(2006)7
8
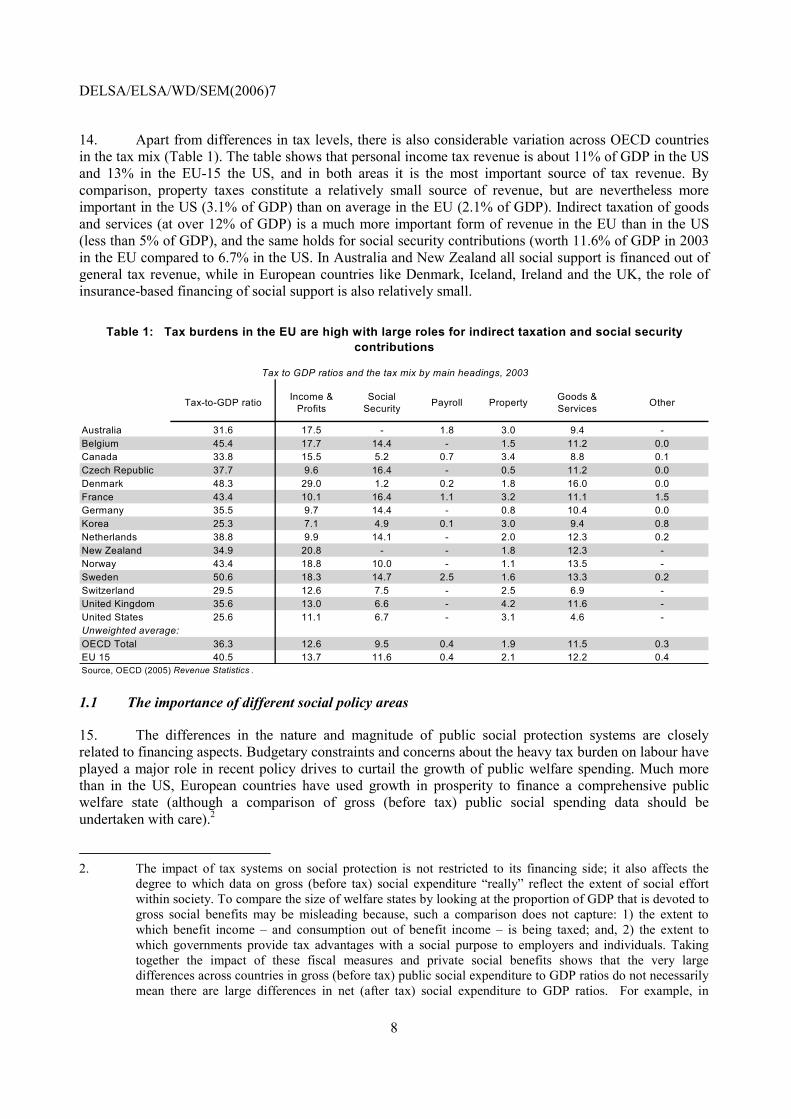
14. Apart from differences in tax levels, there is also considerable variation across OECD countries in the tax mix (Table 1). The table shows that personal income tax revenue is about 11% of GDP in the US and 13% in the EU-15 the US, and in both areas it is the most important source of tax revenue. By comparison, property taxes constitute a relatively small source of revenue, but are nevertheless more important in the US (3.1% of GDP) than on average in the EU (2.1% of GDP). Indirect taxation of goods and services (at over 12% of GDP) is a much more important form of revenue in the EU than in the US (less than 5% of GDP), and the same holds for social security contributions (worth 11.6% of GDP in 2003 in the EU compared to 6.7% in the US. In Australia and New Zealand all social support is financed out of general tax revenue, while in European countries like Denmark, Iceland, Ireland and the UK, the role of insurance-based financing of social support is also relatively small.
Tax-to-GDP ratio Income & Profits
Social Security Payroll Property Goods &
Services Other
Australia 31.6 17.5 - 1.8 3.0 9.4 -Belgium 45.4 17.7 14.4 - 1.5 11.2 0.0Canada 33.8 15.5 5.2 0.7 3.4 8.8 0.1Czech Republic 37.7 9.6 16.4 - 0.5 11.2 0.0Denmark 48.3 29.0 1.2 0.2 1.8 16.0 0.0France 43.4 10.1 16.4 1.1 3.2 11.1 1.5Germany 35.5 9.7 14.4 - 0.8 10.4 0.0Korea 25.3 7.1 4.9 0.1 3.0 9.4 0.8Netherlands 38.8 9.9 14.1 - 2.0 12.3 0.2New Zealand 34.9 20.8 - - 1.8 12.3 -Norway 43.4 18.8 10.0 - 1.1 13.5 -Sweden 50.6 18.3 14.7 2.5 1.6 13.3 0.2Switzerland 29.5 12.6 7.5 - 2.5 6.9 -United Kingdom 35.6 13.0 6.6 - 4.2 11.6 -United States 25.6 11.1 6.7 - 3.1 4.6 -Unweighted average: OECD Total 36.3 12.6 9.5 0.4 1.9 11.5 0.3EU 15 40.5 13.7 11.6 0.4 2.1 12.2 0.4Source, OECD (2005) Revenue Statistics .
Table 1: Tax burdens in the EU are high with large roles for indirect taxation and social security contributions
Tax to GDP ratios and the tax mix by main headings, 2003
1.1 The importance of different social policy areas
15. The differences in the nature and magnitude of public social protection systems are closely related to financing aspects. Budgetary constraints and concerns about the heavy tax burden on labour have played a major role in recent policy drives to curtail the growth of public welfare spending. Much more than in the US, European countries have used growth in prosperity to finance a comprehensive public welfare state (although a comparison of gross (before tax) public social spending data should be undertaken with care).2
2. The impact of tax systems on social protection is not restricted to its financing side; it also affects the
degree to which data on gross (before tax) social expenditure �really� reflect the extent of social effort within society. To compare the size of welfare states by looking at the proportion of GDP that is devoted to gross social benefits may be misleading because, such a comparison does not capture: 1) the extent to which benefit income � and consumption out of benefit income � is being taxed; and, 2) the extent to which governments provide tax advantages with a social purpose to employers and individuals. Taking together the impact of these fiscal measures and private social benefits shows that the very large differences across countries in gross (before tax) public social expenditure to GDP ratios do not necessarily mean there are large differences in net (after tax) social expenditure to GDP ratios. For example, in
DELSA/ELSA/WD/SEM(2006)7
9
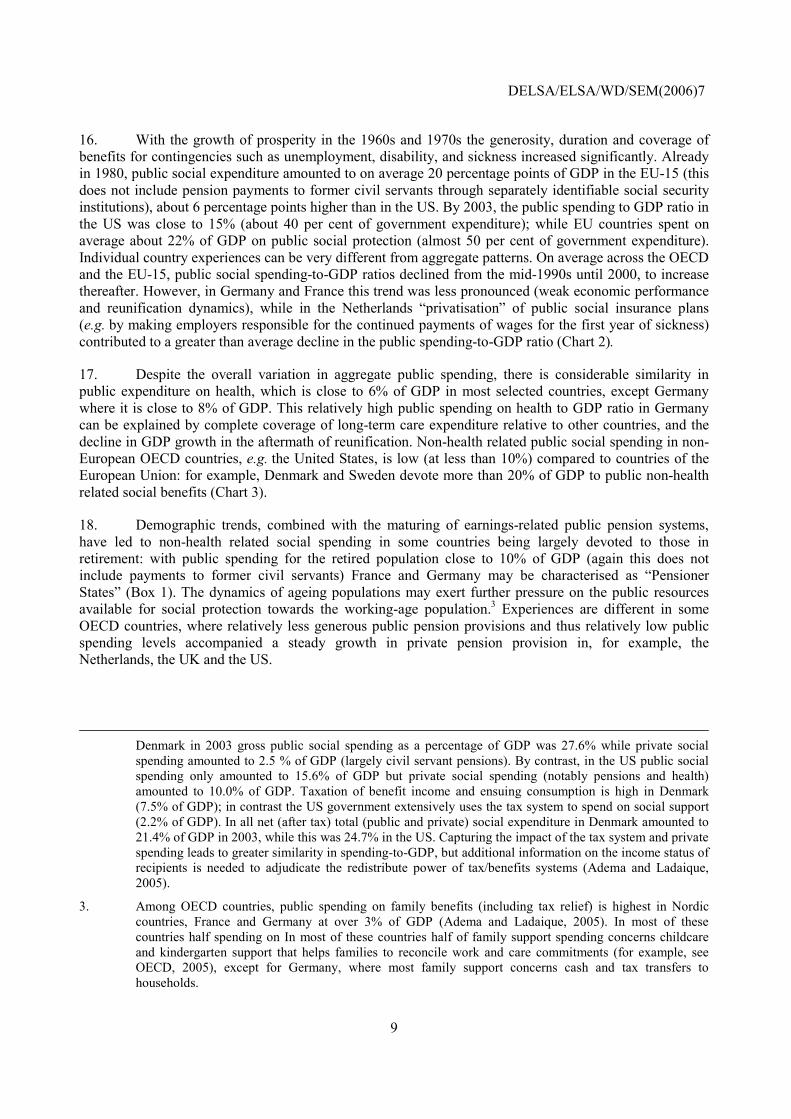
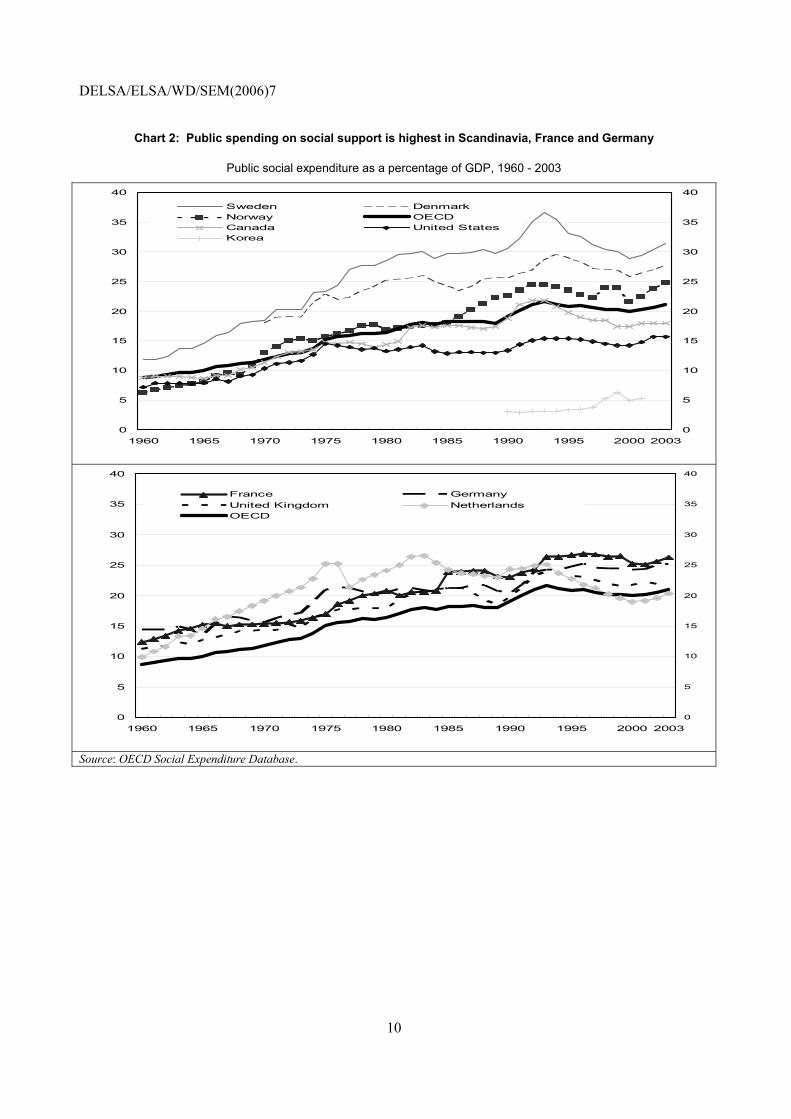
16. With the growth of prosperity in the 1960s and 1970s the generosity, duration and coverage of benefits for contingencies such as unemployment, disability, and sickness increased significantly. Already in 1980, public social expenditure amounted to on average 20 percentage points of GDP in the EU-15 (this does not include pension payments to former civil servants through separately identifiable social security institutions), about 6 percentage points higher than in the US. By 2003, the public spending to GDP ratio in the US was close to 15% (about 40 per cent of government expenditure); while EU countries spent on average about 22% of GDP on public social protection (almost 50 per cent of government expenditure). Individual country experiences can be very different from aggregate patterns. On average across the OECD and the EU-15, public social spending-to-GDP ratios declined from the mid-1990s until 2000, to increase thereafter. However, in Germany and France this trend was less pronounced (weak economic performance and reunification dynamics), while in the Netherlands �privatisation� of public social insurance plans (e.g. by making employers responsible for the continued payments of wages for the first year of sickness) contributed to a greater than average decline in the public spending-to-GDP ratio (Chart 2).
17. Despite the overall variation in aggregate public spending, there is considerable similarity in public expenditure on health, which is close to 6% of GDP in most selected countries, except Germany where it is close to 8% of GDP. This relatively high public spending on health to GDP ratio in Germany can be explained by complete coverage of long-term care expenditure relative to other countries, and the decline in GDP growth in the aftermath of reunification. Non-health related public social spending in non-European OECD countries, e.g. the United States, is low (at less than 10%) compared to countries of the European Union: for example, Denmark and Sweden devote more than 20% of GDP to public non-health related social benefits (Chart 3).
18. Demographic trends, combined with the maturing of earnings-related public pension systems, have led to non-health related social spending in some countries being largely devoted to those in retirement: with public spending for the retired population close to 10% of GDP (again this does not include payments to former civil servants) France and Germany may be characterised as �Pensioner States� (Box 1). The dynamics of ageing populations may exert further pressure on the public resources available for social protection towards the working-age population.3 Experiences are different in some OECD countries, where relatively less generous public pension provisions and thus relatively low public spending levels accompanied a steady growth in private pension provision in, for example, the Netherlands, the UK and the US.
Denmark in 2003 gross public social spending as a percentage of GDP was 27.6% while private social spending amounted to 2.5 % of GDP (largely civil servant pensions). By contrast, in the US public social spending only amounted to 15.6% of GDP but private social spending (notably pensions and health) amounted to 10.0% of GDP. Taxation of benefit income and ensuing consumption is high in Denmark (7.5% of GDP); in contrast the US government extensively uses the tax system to spend on social support (2.2% of GDP). In all net (after tax) total (public and private) social expenditure in Denmark amounted to 21.4% of GDP in 2003, while this was 24.7% in the US. Capturing the impact of the tax system and private spending leads to greater similarity in spending-to-GDP, but additional information on the income status of recipients is needed to adjudicate the redistribute power of tax/benefits systems (Adema and Ladaique, 2005).
3. Among OECD countries, public spending on family benefits (including tax relief) is highest in Nordic countries, France and Germany at over 3% of GDP (Adema and Ladaique, 2005). In most of these countries half spending on In most of these countries half of family support spending concerns childcare and kindergarten support that helps families to reconcile work and care commitments (for example, see OECD, 2005), except for Germany, where most family support concerns cash and tax transfers to households.
DELSA/ELSA/WD/SEM(2006)7
10
Chart 2: Public spending on social support is highest in Scandinavia, France and Germany
Public social expenditure as a percentage of GDP, 1960 - 2003
0
5
10
15
20
25
30
35
40
1960 1965 1970 1975 1980 1985 1990 1995 2000 20030
5
10
15
20
25
30
35
40
Sweden DenmarkNorway OECDCanada United StatesKorea
0
5
10
15
20
25
30
35
40
1960 1965 1970 1975 1980 1985 1990 1995 2000 20030
5
10
15
20
25
30
35
40
France GermanyUnited Kingdom NetherlandsOECD
Source: OECD Social Expenditure Database.

DELSA/ELSA/WD/SEM(2006)7
11
Public social expenditure by broad social policy area, in percentage of GDP, in 2003
Sweden (31.3)
Denmark (27.6)
France (26.3)
Germany (25.2)
Norway (24.8)
United Kingdom (22.1)
OECD-20 (21)
Netherlands (20.3)
Canada (16.8)
United States (15.6)
Source : OECD Social Expenditure database
Chart 3 Pensions and Health are the largest areas of public social spending
Cash benefits Services
Note: Countries are ranked by decreasing order of total public social expenditure as a percentage of GDP.
7.1
5.6
7.6
8.0
6.5
6.7
6.0
5.8
6.8
6.7
7.5
5.6
1.8
1.9
4.4
1.8
2.2
1.5
2.6
0.6
0 2 4 6 8 10 12 14 16 18 20
Health
All social servicesexcept health
8.0
5.3
9.8
9.6
5.4
7.9
6.7
5.1
5.3
6.2
7.4
9.5
6.0
4.6
7.8
5.2
5.3
6.8
3.0
1.9
02468101214161820
Income support tothe working agepopulation
Pensions (old ageand survivors)
19. The volume of income maintenance payments to the working-age population (including on those who have retired for labour market reasons, an important spending item in Nordic countries), and spending on unemployment compensation in particular, is affected by labour market trends and vice versa. Spending on unemployment compensation has gone down in recent years, but until the mid-1990s employment growth in many OECD countries was not strong enough to avoid marked increases in unemployment and non-employment. Moreover, many European countries have experienced increased take-up of non-employment benefits over the last few decades (OECD, 1999c and 2005b). The increase in non-employment, particularly among older workers, has made early withdrawal from the labour force more widely accepted in EU countries. Furthermore, some income-support programmes have been used to cover contingencies for which they were not originally intended. In particular, disability programmes have contributed to exit from the labour force, sometimes by explicitly using a labour-market criterion for disability assessment. Germany, the Netherlands, and the United Kingdom have all experienced significant increases in spending on disability benefits.

DELSA/ELSA/WD/SEM(2006)7
12
Box 1. Population Ageing in China and in the largest OECD economies
Projected population ageing is likely to have significant effects on OECD countries, china and other emerging economies. The share of the population aged 65 years and over is projected to increase by around 80 per cent, on average, in the seven largest OECD economies by 2050. In China the share of older people will triple over the next 45 years, and in 2050 China is projected to have nearly 330 million senior citizens (Table Box 1).
Across countries, the share of the population aged 80 years and over is projected to increase even more rapidly with major implications for health care and long-term care. Demographic pressures could well be reinforced by other factors to drive up costs. Urbanisation and changing family patterns in China are likely to reduce the capacity of traditional family and community social protection mechanisms in emerging economies to deal with the consequences of population change. Population ageing and lifestyle changes are also likely to lead to a relative increases heart disease and cancers. If OECD experience is anything to go by then the tendency for rising relative prices in the services sector and improved availability of medical treatments can be expected to exert upward pressure on public health budgets, and increase health care spending as a percentage of national income.
As in OECD countries, population ageing is likely to cause upward pressure on pension spending in emerging economies. High spending on pensions and the need to finance the deficit of the pension system crowd out outlays on means-tested programmes, such as income transfers for the care of children, and elderly and disabled persons, which accounts for a relatively small share of public social spending, well below the OECD average. Restoring the financial sustainability of the social security system is therefore a pre-requisite for making overall social spending more redistributive.
Pension spending in China is relatively low and does little to reduce income inequality because it mainly benefits those in the formal labour market. Because pensions are restricted to a relatively small share of the population, pension benefits per recipient are much higher relative to GDP per capita, than in OECD countries. Reform efforts are already underway, including the introduction of mandatory funded individual retirement accounts in 11 provinces. However, further changes are likely to be needed to improve the sustainability of social spending as populations age, while support for senior citizens need to be spread more widely and more effectively to alleviate poverty.
Table Box 1. Some indicators of ageing populations in China and the 7 largest OECD economies Share of
population 65+
Median Age Population 65+ (millions)
2000 2050 2000 2050 2000 2050 Canada 12.6 25.6 36.9 45.2 3.9 11.0 China 6.8 23.6 30.1 44.8 87.2 329.1 France 16.3 27.1 38.0 45.5 9.7 17.1 Germany 16.4 28.4 40.0 47.4 13.5 22.4 Italy 18.2 35.5 40.3 52.5 10.5 18.1 Japan 17.2 35.9 41.3 52.3 21.9 40.3 United Kingdom 15.9 23.2 37.7 42.9 9.5 15.6 United States 12.3 20.6 35.3 41.1 35.1 81.5
Source: Population Division of the Department of Economic and Social Affairs of the United Nations Secretariat, World Population Prospects: The 2004 Revision and World Urbanization Prospects: The 2003 Revision, http://esa.un.org/unpp
DELSA/ELSA/WD/SEM(2006)7
13
Public social expenditure in per cent of GDPPublic spending on social asssistance as a
proporion of public social expenditureBelgium (1) 27.2 2.5Canada 16.8 11.2China 5.8 5.3Czech republic (1) 20.1 17.5Denmark 27.6 3.6Germany 25.2 4.2France 26.3 2.1Korea (1) 6.1 7.7Norway 24.8 2.6the Netherlands 20.3 5.2Sweden 31.3 2.2Switzerland (1) 26.4 2.4United Kingdom 22.1 11.8(1) 2001Source : OECD Social Expenditure Database, and OECD, Economic Survey of China
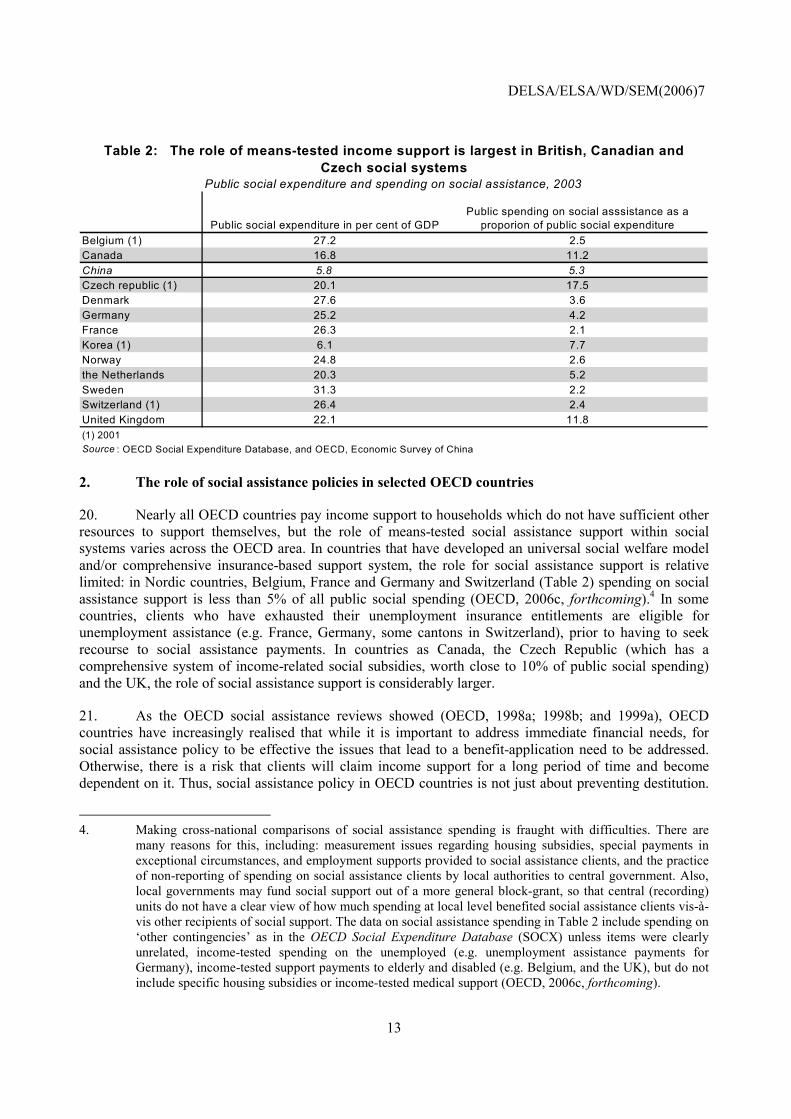
Table 2: The role of means-tested income support is largest in British, Canadian and Czech social systems
Public social expenditure and spending on social assistance, 2003
2. The role of social assistance policies in selected OECD countries
20. Nearly all OECD countries pay income support to households which do not have sufficient other resources to support themselves, but the role of means-tested social assistance support within social systems varies across the OECD area. In countries that have developed an universal social welfare model and/or comprehensive insurance-based support system, the role for social assistance support is relative limited: in Nordic countries, Belgium, France and Germany and Switzerland (Table 2) spending on social assistance support is less than 5% of all public social spending (OECD, 2006c, forthcoming).4 In some countries, clients who have exhausted their unemployment insurance entitlements are eligible for unemployment assistance (e.g. France, Germany, some cantons in Switzerland), prior to having to seek recourse to social assistance payments. In countries as Canada, the Czech Republic (which has a comprehensive system of income-related social subsidies, worth close to 10% of public social spending) and the UK, the role of social assistance support is considerably larger.
21. As the OECD social assistance reviews showed (OECD, 1998a; 1998b; and 1999a), OECD countries have increasingly realised that while it is important to address immediate financial needs, for social assistance policy to be effective the issues that lead to a benefit-application need to be addressed. Otherwise, there is a risk that clients will claim income support for a long period of time and become dependent on it. Thus, social assistance policy in OECD countries is not just about preventing destitution.
4. Making cross-national comparisons of social assistance spending is fraught with difficulties. There are
many reasons for this, including: measurement issues regarding housing subsidies, special payments in exceptional circumstances, and employment supports provided to social assistance clients, and the practice of non-reporting of spending on social assistance clients by local authorities to central government. Also, local governments may fund social support out of a more general block-grant, so that central (recording) units do not have a clear view of how much spending at local level benefited social assistance clients vis-à-vis other recipients of social support. The data on social assistance spending in Table 2 include spending on �other contingencies� as in the OECD Social Expenditure Database (SOCX) unless items were clearly unrelated, income-tested spending on the unemployed (e.g. unemployment assistance payments for Germany), income-tested support payments to elderly and disabled (e.g. Belgium, and the UK), but do not include specific housing subsidies or income-tested medical support (OECD, 2006c, forthcoming).

DELSA/ELSA/WD/SEM(2006)7
14
Certainly, cash support is provided to address the most urgent need of households claiming minimum income support, but authorities are also trying to tailor support so that underlying problems can be addressed.
22. In this �holistic� approach, social assistance policy thus rests on three pillars:
1. Financial assistance to help households obtain an adequate standard of living5
2. Social help to assist families in dealing with an underlying social contingency such as disability, homelessness or addiction.
3. Employment supports to help households with their re-integration in the labour market thereby regaining their autonomy.
23. Failure to ensure the adequacy of each of these pillars thus undermines the effectiveness of the whole system. If financial assistance is too low, attention is diverted from addressing underlying social problems into satisfying basic needs. If, on the other hand, cash assistance is set at too high a level, the motivation to look for work is reduced (see below). Failure to address social problems and or provide employment supports leaves individuals ill-equipped for work, limits earnings capacity, while prolonged benefit-dependency exacerbates the risk of transmitting disadvantage across generations. Effective social assistance policy thus involves coherent policy development and discharge across a great many central and local government organisations.
24. A comprehensive analysis of social assistance policy thus addresses issues related to benefit system design and application, including issues related to eligibility criteria, assessing benefit applications, and financing methods (e.g. cost-sharing or block-grants), and access and effectiveness of social help and employment support policies, policy coherence across different public agencies, policies for different clients groups or an assessment of effectiveness in poverty alleviation (e.g. Eardley, et al., 1996, and OECD, 1998a; 1998b; and 1999a) The scope of this study is far less ambitious, and focuses on how social assistance policy in some countries tries to procure adequacy in financial support and maintain this over time. However, it is important to realise that outcomes for minimum income payments in OECD countries are best understood in the context of an ongoing policy debate on the appropriate balance of adequacy in benefit provision and promoting independence and self-sufficiency for claimants.
3. Providing a decent level of income
25. In most OECD countries the objectives of social assistance systems include providing sufficient means for those dependent on it. However, the overall adequacy of social assistance support should also be seen in the context of other benefits available to claimants. The nature of benefit provision to claimants differs across countries, but there are common elements:
• A set minimum income standard included in the �social assistance payment�; A basic allowance covering normal day-to-day living expenses (other than housing), e.g. food, clothing, fuel, local taxes.
• Child and family allowances.
• Housing allowances.
5. Even if adequate for short-term needs, cash assistance will not usually be sufficient to support families for
extended periods and deprivation can still result.

DELSA/ELSA/WD/SEM(2006)7
15
• Regular but non-standard living expenses, e.g. exceptional dietary, health, heating or travel costs.
• Additional benefits for exceptional expenditure, e.g. replacement or repair of furniture and household equipment, maternity costs, funeral costs6; and,
• The provision of social services to persons in need.
26. Social assistance claimants in many OECD and European countries do not rely on one single benefit to meet these costs. The �basic allowance� that is available to clients, is intended to cover regular expenses while some form of help with irregular or exceptional costs can also be provided. Social assistance recipients often are eligible for family allowances and housing benefits.
27. In most European countries, including Belgium, Denmark, Germany, France, the Netherlands, Sweden, and the UK there are general benefit programmes for families, while Belgium (in addition) and the Czech Republic operate separate family benefits for low-income families.
28. Comprehensive housing benefits exist in the Czech Republic, Denmark, France, Germany, the Netherlands, Norway, Sweden, and the UK. In Belgium, Canada, Korean and Switzerland here is no comprehensive housing benefit and housing costs are accounted for in determining the overall social assistance benefit payment. In Germany too, Social Assistance offices should cover �reasonable� housing costs incurred by claimants (Adema, et al, 2003).
29. Social assistance programmes in OECD countries also provide for the delivery of additional (non-recurrent) benefits and services. These services are not necessarily targeted at regular social assistance claimants but are generally accessible to all low-income groups. Payments may reflect a wide variety of needs, e.g. contributions towards school trips of dependent children, exceptional housing costs, exceptional medical expenses, transportation grants, etc.
3.1 What determines a decent level of income?
3.1.1 The role of different levels of government
30. In most OECD countries, local, rather than central authorities, deliver social assistance support as such support is targeted at alleviating individual hardship which is best adjudicated at the government level closest to the individual. However, even though delivery of such support is decentralised in many OECD countries, the payments rates of minimum income support are largely or fully determined by central government. This is so for Belgium, the Czech Republic, Denmark, Germany (the federal government sets a reference rate on basis of which Länder (States) determine actual payment rates related to the cost of living in their jurisdiction), France, the Netherlands, Korea, Sweden (central guidelines with discretion for municipalities), and the UK. In Canada social assistance payment rates vary across the 10 provinces and 3 territories, and in Norway, social workers have the final say on payment rates, so that these vary across and within local governments.
6. Sometimes, e.g. in Canada, authorities generally have lists which specify items that can be covered. In
other countries, e.g. Switzerland, greater leeway is given to social workers who can recommend approval of exceptional expenses if they are caused by the claimant�s health, family situation or otherwise.
DELSA/ELSA/WD/SEM(2006)7
16
31. In theory, the scope for variety in benefit payments in Switzerland is also endless: the 26 cantons and half cantons have the ultimate legislative responsibility for social assistance policies, which they often leave at the discretion of each of the about 3 000 municipalities. In practice, however, variation of social assistance payment rates is limited, as the vast majority of cantons take the same �SKOS-expert-guidelines� as the basis for their social assistance policy.
3.1.2 Internal logic in setting of benefit payments
32. As noted above, in most OECD countries the minimum social assistance payments (in conjunctions with supplements for special items, (housing, heating, etc) and other benefits (children, housing) are supposed to cover the basic needs of claimants. Arguably, the �internal logic� in benefit determination is most prevalent within guidelines developed by a forum of experts in Switzerland. These �SKOS-guidelines� define a basic payment rate sufficient to �guarantee the beneficiary an existence which respects human dignity� and to �give (beneficiaries) the possibility of actively participating in social life� (SKOS, 2003). As a result, the guidelines stipulate the provision of a social minimum rather than income at subsistence level, and covers a variety of items including social drinks, tobacco and presents and is generous compared to many other OECD countries. The �social minimum� is also intended to guarantee horizontal equity of social assistance clients with low-income earners not in receipt of social assistance benefits (see section 4).
33. The basic benefit level in the SKOS-guidelines is based on surveys of what those in the bottom quintile actually consume, historical benefit levels and inflation. The basic benefit amount is designed to cover essential purchases, including food, clothing, utilities and even making allowance for the giving of (small) gifts. Additional amounts are given to cover housing costs and basic medical expenses. In addition a supplementary payment, amounting to about 10% of the basic benefit is recommended to give clients a degree of leeway in determining household expenditure, but also to cover expenditure such as membership of sports clubs or other cultural societies, so improving their social integration.
34. In Norway, the decision on what is a �decent income level� is taken locally. Local governments set benefit guidelines, but award decisions (including the level of payments) are at the discretion of social workers. Each social assistance claim is treated as being different, and therefore there is no nationally determined social minimum. This system produces not only variation in benefit levels between regions but also variation within municipalities. The award of social assistance is contingent on the assets, income and expenditure of the benefit unit. These are required to visit each applicant to determine on basis of their outgoings and reasonable levels thereof, what the benefit payments should be on an individual basis. In effect more than in other countries therefore, benefit levels are influenced by client budgets, and payments are frequently above levels suggested by local authorities (OECD, 1998b).
3.1.3 External influences on payment
35. In most other OECD countries benefit payment rates are set by government, with varying degrees of references to poverty lines, budget surveys, and/or external factors, as wages and replacement rates, and budgetary realities. In general social assistance payments (that vary with family composition, see below) are intended to cover the normal costs of living, including the costs of food and drink, housing, heating, furniture and recreation, but the link between payment rates, official poverty lines, and budget surveys is not strong (Box 2).

DELSA/ELSA/WD/SEM(2006)7
17
Box 2. The Budget Standards approach
The original budget standards as developed by Joseph Rowntree at the end of the 19th century focused on a notion of subsistence poverty defined as the cost of minimally adequate basket of goods and services (arguably, Saunders et al. (1998), provides the most comprehensive discussion of budget standards in OECD countries in recent years). The subsistence notion coincides with the poverty concept that defines people as poor if they are unable to pay for life�s necessities. Dissatisfaction with this notion, and difficulties with determining absolute poverty lines in an objective manner, mean that the composition of a minimally-adequate basket of goods and services cannot be separated from the social environment in which people live and involve value judgements on the definition of adequacy. By varying the scope, quantity and quality of the items included in the basket and pricing these items, different budget standards for different standards of living can be developed. For example, the notion of fostering social participation in the Swiss social assistance guidelines means that the relevant basket of goods has to be extended to cover for membership fees for clubs, have a social drink, etc.
Budget standards research is only one among a number of ways of approaching the analysis of living standards. The budget standards approach is one of the prescriptive approaches which specifies (on the basis of some set of principles) how much is enough to achieve adequacy; descriptive approaches try to infer adequacy by analysing the distribution of income or financial resources and/or expenditure or deprivation. Both approaches can make use of income data or information on spending patterns.
The focus on household needs in budget standards is expressed as the amount needed by a particular household to maintain a prescribed standard of living across a range of budget areas, such as housing, energy, food, clothing and footwear, household goods and services, transport, health care, personal care and leisure. These household needs lead to the construction of a budget standard by translating these household needs into goods and services, goods and services into household budgets, household budgets into expenditure and finally to the income required to meet the specified standard. Of course, which goods to include, and how to value these goods is a matter for debate, e.g. the treatment of housing costs is likely to be a contested issue, as are durable consumption goods (Whiteford and Henman, 1999).
A budget standard reflects both normative factors (�expert� judgements on what items should be included in the basket of good) and behavioural aspects (what items are bought by households in relevant expenditure surveys). The use of behavioural data for setting budget standards is debatable as patterns of behaviour are likely to be constrained by resources and are thus of limited use in coming to an objective benchmark for assessing income adequacy.
Because of the underlying expert value judgements and various assumptions that are made in calculating budget standards more generally, it is crucial to ensure transparency in the determination of the relevant basket of goods and services, as this facilitates reconsideration of budget standards in view of new insights on adequacy. Continuous scrutiny of the assumptions and methodology ensure that budget standard remains relevant for policy development, also across different regions in a country.
36. In Belgium, the Czech Republic7, Denmark, France, Germany and Sweden8 (with some discretion for local government), the Netherlands and the UK, payment rates are set by Central government, with or without reference to a basket of goods, but are in any case intended to cover the normal costs of living, including the costs of food and drink, housing, heating, furniture and recreation (in the Netherlands the benefit payment is equal to the net minimum wage). At some point in the past, budget
7. In the Czech Republic budget surveys and budgetary realities help to determine the minimum living
standard (MLS). The MLS plays an important role as it is used to determine benefit rates within the comprehensive system of State Social Transfers (SST), which covers substantial parts of the population, particularly among households with children, but also co-determines some social insurance payments. Anyone who on receipt of the state social transfers still has an income below the MLS (e.g. because of family size) can apply for social assistance payment that top up incomes to MLS-level (OECD, 1998b).
8. In the early 1980s, the National Consumers Board of Sweden identified a relevant basket of goods.

DELSA/ELSA/WD/SEM(2006)7
18
surveys and a relevant basket of goods helped determining the minimum income support payment rates9, but updates of payment rates are not necessarily in line with findings in budget surveys.
37. In Canada, income support levels are not determined by a decision on what should be a socially acceptable standard of living, and benefit levels are not linked to an �objective� measure of poverty as, for example, the Low-Income Cut-Offs (LICOs) calculated by Statistics Canada. Instead, benefit levels in the recent past have been determined by political acceptance, the state of public finances, and a desire to ensure that benefit levels do not generate a standard of living that exceeds or even matches that of a working household (see below).
38. In Korea the level of livelihood protection benefits is related to the official poverty line; the Minimum Cost of Living (MCL). The MCL, and hence benefit payments vary by household size, but not with regional variations in the cost of living, so that the real level of benefits varies across regions. Although, the payment rates are set with respect to the official poverty line � at maximum depending on family and income criteria, payment rates are equivalent to 60 per cent of the MCL, but there is no guarantee that the poor will have access to income support in Korea.
39. To understand how this can happen, it is important to consider the budgetary process. Each year local governments apply to the Ministry of Health and Welfare (MHW) for funding for the forthcoming year. Subsequently, the MHW submits a proposal containing a prioritisation among expenditure items to the Ministry of Budget and Planning. This Ministry then decides upon the overall budget while taking the financial status of provincial and district levels of government into account. As the budgetary allocations awarded by the Ministry of Planning and Budget are generally considered short of what is needed to serve all the poor, there is inevitably rationing in benefit awards.
40. The importance of concerns on �making work pay�, and public budgets in Korea (OECD, 2000) the US and to a lesser extent Canada underlie the frugality of benefit payments to single persons in these countries while payments for singles (disregarding housing costs) are only close or above the �40% of equivalised median income poverty line� in the Czech Republic, Norway, the Netherlands and Belgium. Chart 4, Panel A shows that the payments towards housing costs (as not already reflected in the basic social assistance payment rate, see the first part of section 3 above) play a crucial part in ensuring overall adequacy of benefit payments across the selected OECD countries. Chart 4, Panel B shows that basic payment rates (without additional housing support) for families with children are more generous than for single persons, especially in the US, as the group of clients with children is generally deemed to be more �deserving� of public support.10 In other countries the difference in generosity in payments for single person and families with children is less pronounced as the payment rate structure is designed to generate a more or less equal standard of living among clients regardless of their household status.
9. In 1974, when the social assistance benefit was introduced in Belgium, payments were established to
reflect the various elements of living cost (benefit rates were based on budget standards).
10. There is particular policy interest in the position of families with children was also reflected at the meeting of OECD Social Policy Ministers in Paris on March 31-April 1, 2005. The Ministers concluded: ��.Social and family policies must help give children and young people the best possible start to their lives and help them to develop and achieve through their childhood into adulthood. � All institutions of society and government should consider the impact of their policies on children. � Special effort should be targeted on the families that are struggling to give their children the resources, both financial and time, that they need. It is necessary to ensure that employment leads to an improved financial situation for families, that appropriate child care and educational support is available, and that cash and other benefits are designed in such a way that they effectively reduce child poverty� (OECD, 2005b).

DELSA/ELSA/WD/SEM(2006)7
19
Chart 4, Panel A: Housing benefits play a key role in adequacy of benefit support for many European claimants of social assistance
Net incomes of single social assistance recipients, in percent of equivalised median household income, 2001
0
10
20
30
40
50
60
70
USA CAN SWE UK DEU FRA DNK CHE CZE NOR NLD BEL
No housing related benefits With housing-related benefits (rent=20% APW)
Source : OECD (2004), Benefits and Wages.
Chart 4, Panel B: Income support payments to families with children on social assistance are highest relative to poverty thresholds in the Czech Republic, Denmark and Germany
Net incomes of couples with 2 children in receipt of social assistance benefit, in percent of equivalised median household income, 2001
0
10
20
30
40
50
60
70
USA FRA SWE CHE DEU CAN UK NLD NOR BEL DNK CZE
No housing related benefits With housing-related benefits (rent=20% APW)

DELSA/ELSA/WD/SEM(2006)7
20
3.1.4 The effect of household composition
41. In all OECD countries, social assistance payments vary with household composition, with supplements for different household member often depending on age. For example the standard payment rate structure in Germany includes: a standard rate for the head of household (the primary applicant); a standard rate for other adults in households; and, standard rates for each child (which in some countries vary with the age of children).11
42. OECD (1996) concluded that most estimates fell within a relatively narrow range around a median estimate of the amount given to a single person, multiplied by the square root of household size. In other words, in order to provide the same standard of living as experienced by a single person with an income of 100, a two-person household would need 100*√2=141; a three-person household 173, etc. Accordingly, the relevant equivalence elasticities (see the note to Table 3) are: 0.41 for a two-person household; 0.32 for a three-person household; and 0.27, 0.24 and 0.21 for four-, five- and six-person households, respectively.
43. It follows from the discussion of overall income levels that the benefits systems respond in different ways to the addition of more members to a household. There are high equivalence elasticities on additional children in the Czech Republic, Canada and Korea and to a lesser extent Germany and Norway, implying that these systems are favourable towards large families. The presence of children leads to higher payments across the benefit structure, including increased one-off payments and accommodation support. Increments for additional adults are generally lower (except for Canada, the Czech Republic and Korea as related to the very low social assistance payments to single persons in these countries).
Belgium Canada, Ontario
Czech republic
Germany Korea Netherlands Norway Switzerland, Zürich
Additional adult (couple) 0.33 0.74 0.77 0.57 0.94 0.41 0.5 0.53Additional number of children 1-2 0.25 0.53 0.62 0.39 0.65 0.07 0.41 0.31 3 or more 0.43 0.3 0.66 0.5 0.43 0.11 0.38 0.28
Equivalence elasticities for additional household members related to base amount Table 3: Payment rate increments for additional children are highest in the Czech Republic
Equivalence elasticities are defined as the increase in benefit for an additional household member compared to base amount (benefit payable to a single person). These are approximate values, as benefits and thus elasticities can fluctuate with the age of children. Source: Adema, W., D. Gray and S. Kahl (2003), "Social Assistance in Germany", Labour Market and Social Policy Occasional Papers, No. 58, OECD, Paris.
3.1.5 Provisions for special client groups
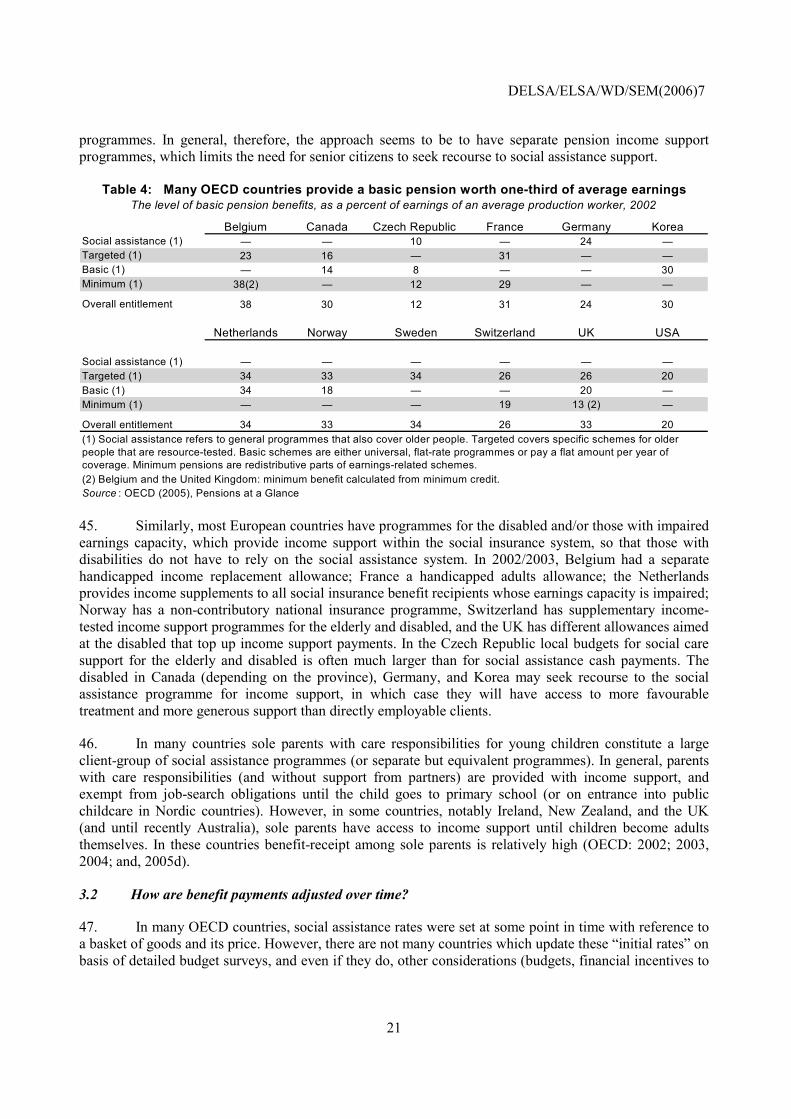
44. Most OECD countries have a separate pension programme that is targeted at low income families. Many countries have a specific scheme for senior citizens that are means-tested, and/or are universal programmes that pay a flat benefit payment per annum: in general relevant income support payments are equivalent to about one-third of average earnings (Table 4). Some countries (the Czech Republic, and Germany, in 2002) include senior citizens among the clientele of social assistance
11. To give another example, in the Netherlands, there are three basic social assistance payments rates based
on household composition: 1) couples are entitled to a payment worth 100% of the net minimum wage; 2) single parents get 70% of the net minimum wage; 3) single persons get 50% of the net minimum wage. Municipalities may pay supplements up to a maximum of 20% of the net minimum wage, for example, if single persons live alone.
DELSA/ELSA/WD/SEM(2006)7
21
programmes. In general, therefore, the approach seems to be to have separate pension income support programmes, which limits the need for senior citizens to seek recourse to social assistance support.
Belgium Canada Czech Republic France Germany KoreaSocial assistance (1) � � 10 � 24 �Targeted (1) 23 16 � 31 � �Basic (1) � 14 8 � � 30Minimum (1) 38(2) � 12 29 � �
Overall entitlement 38 30 12 31 24 30
Netherlands Norway Sweden Switzerland UK USA
Social assistance (1) � � � � � �Targeted (1) 34 33 34 26 26 20Basic (1) 34 18 � � 20 �Minimum (1) � � � 19 13 (2) �
Overall entitlement 34 33 34 26 33 20
(2) Belgium and the United Kingdom: minimum benefit calculated from minimum credit.Source : OECD (2005), Pensions at a Glance
The level of basic pension benefits, as a percent of earnings of an average production worker, 2002Table 4: Many OECD countries provide a basic pension worth one-third of average earnings
(1) Social assistance refers to general programmes that also cover older people. Targeted covers specific schemes for older people that are resource-tested. Basic schemes are either universal, flat-rate programmes or pay a flat amount per year of coverage. Minimum pensions are redistributive parts of earnings-related schemes.
45. Similarly, most European countries have programmes for the disabled and/or those with impaired earnings capacity, which provide income support within the social insurance system, so that those with disabilities do not have to rely on the social assistance system. In 2002/2003, Belgium had a separate handicapped income replacement allowance; France a handicapped adults allowance; the Netherlands provides income supplements to all social insurance benefit recipients whose earnings capacity is impaired; Norway has a non-contributory national insurance programme, Switzerland has supplementary income-tested income support programmes for the elderly and disabled, and the UK has different allowances aimed at the disabled that top up income support payments. In the Czech Republic local budgets for social care support for the elderly and disabled is often much larger than for social assistance cash payments. The disabled in Canada (depending on the province), Germany, and Korea may seek recourse to the social assistance programme for income support, in which case they will have access to more favourable treatment and more generous support than directly employable clients.
46. In many countries sole parents with care responsibilities for young children constitute a large client-group of social assistance programmes (or separate but equivalent programmes). In general, parents with care responsibilities (and without support from partners) are provided with income support, and exempt from job-search obligations until the child goes to primary school (or on entrance into public childcare in Nordic countries). However, in some countries, notably Ireland, New Zealand, and the UK (and until recently Australia), sole parents have access to income support until children become adults themselves. In these countries benefit-receipt among sole parents is relatively high (OECD: 2002; 2003, 2004; and, 2005d).
3.2 How are benefit payments adjusted over time?
47. In many OECD countries, social assistance rates were set at some point in time with reference to a basket of goods and its price. However, there are not many countries which update these �initial rates� on basis of detailed budget surveys, and even if they do, other considerations (budgets, financial incentives to
DELSA/ELSA/WD/SEM(2006)7
22
work), come into play to ensure that increases as in budget surveys are not fully reflected into increments of payment rates.
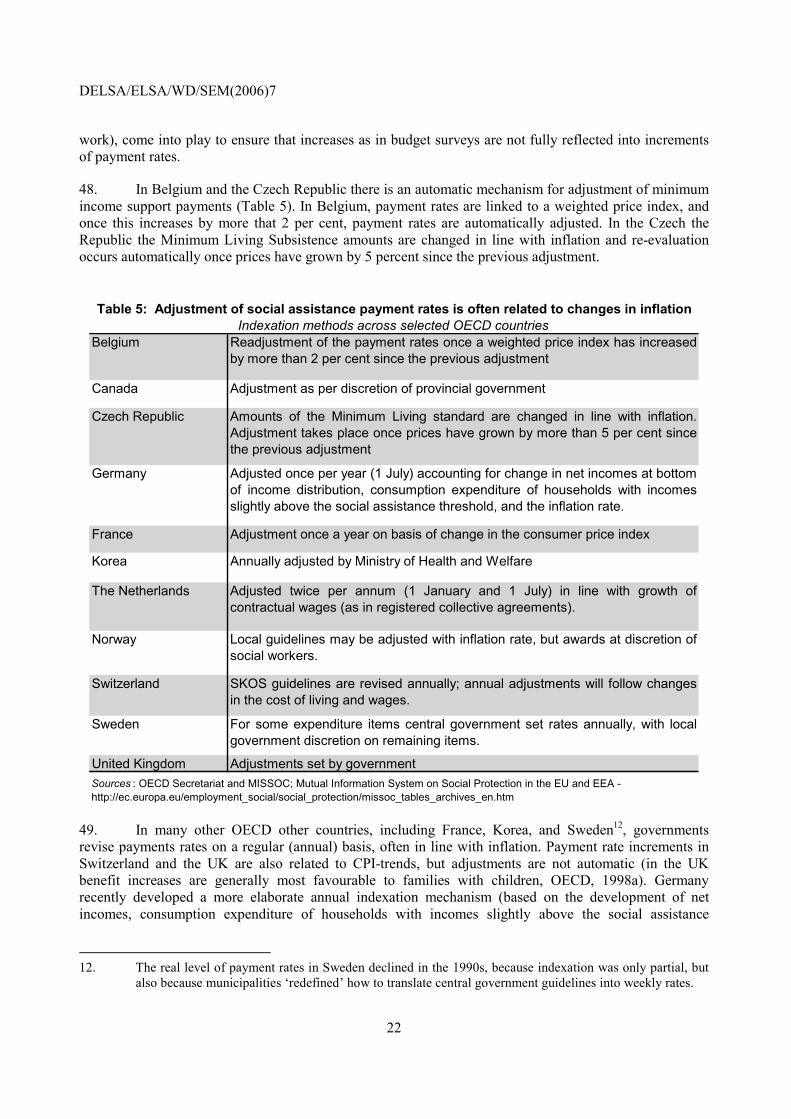
48. In Belgium and the Czech Republic there is an automatic mechanism for adjustment of minimum income support payments (Table 5). In Belgium, payment rates are linked to a weighted price index, and once this increases by more that 2 per cent, payment rates are automatically adjusted. In the Czech the Republic the Minimum Living Subsistence amounts are changed in line with inflation and re-evaluation occurs automatically once prices have grown by 5 percent since the previous adjustment.
Belgium Readjustment of the payment rates once a weighted price index has increasedby more than 2 per cent since the previous adjustment
Canada Adjustment as per discretion of provincial government
Czech Republic Amounts of the Minimum Living standard are changed in line with inflation.Adjustment takes place once prices have grown by more than 5 per cent sincethe previous adjustment
Germany Adjusted once per year (1 July) accounting for change in net incomes at bottomof income distribution, consumption expenditure of households with incomesslightly above the social assistance threshold, and the inflation rate.
France Adjustment once a year on basis of change in the consumer price index
Korea Annually adjusted by Ministry of Health and Welfare
The Netherlands Adjusted twice per annum (1 January and 1 July) in line with growth ofcontractual wages (as in registered collective agreements).
Norway Local guidelines may be adjusted with inflation rate, but awards at discretion ofsocial workers.
Switzerland SKOS guidelines are revised annually; annual adjustments will follow changesin the cost of living and wages.
Sweden For some expenditure items central government set rates annually, with localgovernment discretion on remaining items.
United Kingdom Adjustments set by government
Indexation methods across selected OECD countriesTable 5: Adjustment of social assistance payment rates is often related to changes in inflation
Sources : OECD Secretariat and MISSOC; Mutual Information System on Social Protection in the EU and EEA - http://ec.europa.eu/employment_social/social_protection/missoc_tables_archives_en.htm
49. In many other OECD other countries, including France, Korea, and Sweden12, governments revise payments rates on a regular (annual) basis, often in line with inflation. Payment rate increments in Switzerland and the UK are also related to CPI-trends, but adjustments are not automatic (in the UK benefit increases are generally most favourable to families with children, OECD, 1998a). Germany recently developed a more elaborate annual indexation mechanism (based on the development of net incomes, consumption expenditure of households with incomes slightly above the social assistance
12. The real level of payment rates in Sweden declined in the 1990s, because indexation was only partial, but
also because municipalities �redefined� how to translate central government guidelines into weekly rates.

DELSA/ELSA/WD/SEM(2006)7
23
threshold and the inflation rate), arguably, in response to past trends when rate increments were well below the annual increase in prices (Chart 5).
Chart 5: Evolution in Germany of the basic social assistance payment rate and inflation (1963 = 100)
0
50
100
150
200
250
300
1963 1970 1975 1980 1985 1990 1995 2000
Real value index of the basic payment rate
Consumer price index
The real value index of the basic payment rate reflects the increase in the nominal value of the basic payment rate in a given year related to consumer price inflation in the same year. The series is trended with base year 1963 = 100.
Sources: BMA (1998), Bundesregierung (2001) and Statistisches Bundesamt (1998).
50. In the Netherlands, payment rates are linked to the development of contractual wages (and thus the minimum wage) and are changed twice per annum. However, essentially the increments of the social minimum in the Netherlands is a political decision and when there is little budgetary room for increments, the link between payments rates and wages is cut, as happened on different occasions in the 1980s and 1990s (OECD, 1998b). In Canada, during the 1990s payment rate changes were more and more associated with external factors as budget constraints, public acceptance of benefit levels and payment rate increments, and ensuring a sufficiently large gap with low-wage incomes (see below). Benefit rates were often cut through non-indexation of payments. By 2000, social assistance payment rates across Canada were on average about 30% of the low-income thresholds calculated by Statistics Canada, while this was 40% in 1985 (Sceviour and Finnie, 2004). Given the experience in OECD countries, budgetary concerns play issues a key role in setting payment rates and their indexation: this illustrates the importance of addressing financing issues (Box 3).
51. In more recent years � when economic growth was stronger than in the 1980s and early 1990s, social assistance payments increased over and above the rate of inflation (Chart 6), except for in specific cases when the relationship between social assistance entitlements and separate housing benefits, as in Norway13, and child allowances. In Belgium and Canada (the province of Ontario) payment rates remained 13. The reference incomes for social assistance recipients in Norway as in the OECD tax/benefit models entitle
these households to housing allowance in 2001, 2002, and 2004, which reduces their basic social assistance

DELSA/ELSA/WD/SEM(2006)7
24
unchanged from mid-2003 to mid-2004 but over the 2003/4 period, but over the same period separate child allowances increased reducing basic social assistance entitlements. A similar mechanism underlies trends in basic social assistance payments in the UK, where fluctuations in payments to families are related to the introduction of the Child tax credit (Chart 6, Panel B).
Box 3.- Public expenditure issues in China
In many ways, financing is a key issue to understanding social assistance policy development and payment rate setting in particular. Policy makers across the OECD are keen to ensure financial sustainability of the social support systems, and budgetary considerations play a key role in determining minimum income support payment rates.
China�s public finances appear to be in good shape: in 2004, public debt was low at 23% of GDP, interest payments amounted to 0.6% of GDP and the general government deficit was less than 1% of GDP (OECD 2006b). All debt is owed by central government as local governments are required to balance their budgets annually. However, there exist considerable sub-national off-budget spending (often at local level) and implicit contingent liabilities (primarily from the financial system) that result in a severe weakening of accountability, coherence, control and transparency in expenditure policies and constitute a significant risk to the government expenditure outlook (OECD 2006d).
Moreover, the higher degree of decentralisation of expenditure responsibilities relative to revenues has led to major financing gaps of sub-national governments that are greatest at their lowest levels, where social assistance or last resort benefits are being delivered (Huang Yanfen and Yang Yiyong, 2004). The uneven decentralisation of the fiscal system in China along with disparities in per-capita tax bases across regions means that China�s sub-national governments typically lack sufficient tax revenues to finance their expenditure responsibilities and the resulting strains have encouraged the growth of illicit local government debt. The fiscal transfer system has only very partially reduced the gap between expenditure responsibilities and revenues for provinces in the western part of China, has done little for the central provinces where the gaps are now greatest, and has increased the disparities between the interior and coastal provinces. Furthermore, the lack of clear standards for the division of revenues between higher and lower levels of government, limited formal accountability of local governments to their citizens and the imposition by central government of unfunded mandates on sub-national governments, are among the distortions that have limited spending on education and other social development needs. Public expenditure on health was 0.6% of GDP in 2002, with other public spending on social welfare amounted to 2 % of GDP (transfers to social insurance programmes, pensions paid to former workers in public sector institutions, spending on social relief, income support and medical care (OECD, 2006b).
Public spending on social welfare has been increasing, particularly with regard to spending on last resort benefits, so that the minimum living standards payments covered 23 million people in 2004, while 1500 wealthier rural counties (about half of all such local governments) paid benefits to less than 7 million people. To secure delivering social assistance support to all those in need and reduce geographical discrepancies, the mechanisms for allocating transfers, both between the central government and provinces and within provinces, will need to be reformed to better take account of actual needs. At the same time, measures that are now being implemented to improve the accountability of local governments for expenditure outcomes could be further developed and steps taken to increase the efficiency of sub-national governments� administration (for a comprehensive assessment of China�s public expenditure system see OECD, 2006d).
OECD 2006d recommendations in the area of public spending reform include: continue with efforts to bring off-budget expenditures onto the budget; improve transparency by reforming accounting systems for expenditures along functional lines, using international standards as a guide, so that amounts spent on key social, development and strategic needs can be clearly determined and assessed; strong efforts should be made to constrain the growth of spending on public administration by improving efficiency and eliminating waste; reform fiscal relations among central and sub-national governments to bring expenditure responsibilities at each level of government more into line with financial resources; and, improve accountability of sub-national governments by establishing more explicit criteria for performance in key areas such as education, social development, etc. On the whole, the OECD recommends raising the allocation of public expenditure on education, health, science, and other social/development needs, as a share of overall spending and relative to GDP, to the extent necessary to achieve China�s development goals and equity objectives.
entitlement. However, reference income in 2003 is too high for housing benefit receipt, for which households are (largely) compensated by higher basic social assistance payments. In 2004, basic social assistance payments are again reduced (to account for receipt of housing benefit) which leads to the sharp reduction in the basic social assistance payment for Norway in Chart 6.

DELSA/ELSA/WD/SEM(2006)7
25
A n n u a l g r o w th r a te s , 2 0 0 1 - 2 0 0 4 , p e r c e n ta g e sC h a r t 6 , P a n e l A : C h a n g e s i n r e a l s o c i a l a s s i s t a n c e p a y m e n t r a t e s f o r s i n g le p e r s o n s
- 4- 3- 2- 1012345
2 0 0 1 - 2 0 0 2 2 0 0 2 - 2 0 0 3 2 0 0 3 - 2 0 0 4
B e lg iu m C a n a d a D e n m a r k F r a n c e G e r m a n y
- 4- 3- 2- 1012345
2 0 0 1 - 2 0 0 2 2 0 0 2 - 2 0 0 3 2 0 0 3 - 2 0 0 4
K o r e a N e t h e r la n d s N o r w a y S w e d e n U n i t e d K in g d o m
A n n u a l g ro w th r a te s , 2 0 0 1 -2 0 0 4 , p e r c e n ta g e s
S o u rc e : O E C D ( 2 0 0 4 ) , B e n e f i ts a n d W a g e s , a n d O E C D A n a ly t ic a l D a ta b a s e , C o n s u m e r P r ic e In d e x .
C h a r t 6 , P a n e l B : C h a n g e s in r e a l s o c ia l a s s is ta n c e p a y m e n t r a t e s fo r c o u p le s w it h t w o c h i ld r e n
- 4- 3- 2- 1012345
2 0 0 1 - 2 0 0 2 2 0 0 2 - 2 0 0 3 2 0 0 3 -2 0 0 4
B e lg iu m C a n a d a D e n m a r k F r a n c e G e r m a n y
- 4 0
- 3 0
- 2 0
- 1 0
0
1 0
2 0
2 0 0 1 -2 0 0 2 2 0 0 2 - 2 0 0 3 2 0 0 3 - 2 0 0 4
K o re a N e th e r la n d s N o r w a y S w e d e n U n ite d K in g d o m

DELSA/ELSA/WD/SEM(2006)7
26
4. Promoting independence
52. In many ways, social assistance programmes in OECD countries have moved beyond the mere provision of a decent level of income. To help those clients who are not able to engage in paid employment because of old-age or disability, and clients with social problems (e.g. homelessness, addictions), the policy response has been to provide relevant social support services. However, over the years, caseloads have changed and the proportion of social assistance clients who are employable has increased.
53. Social assistance policy across the OECD responded by developing measures with a greater focus on labour market re-integration, including a stronger emphasis on �reciprocity� in social assistance delivery. Social assistance clients are required to sign agreements or contracts about the steps they will take to end their dependency on assistance payments. These may involve both social and labour market activities. Failure to fulfil the conditions specified on the agreement may lead to loss of benefit. The notion of �reinsertion contracts� was an essential feature of the RMI in France, and similar programmes elsewhere in Europe, e.g. Belgium and the French-speaking part of Switzerland. A �stronger� form of �reciprocity� is �Workfare�, as prevalent in, for example, the US and (parts of) Canada, with compulsory participation of all welfare recipients in education, community work, training programmes or subsidised private sector employment. In many OECD countries, receipt of social assistance by young people is conditional on them completing their education or engaging in work.
54. In return, public authorities increasingly commit themselves to investing in employment supports for social assistance clients. Such supports can take different forms (depending on client characteristics), as training, job-search assistance, employment counselling, and for the many parents on social assistance, childcare supports. As the client commits him/herself to undertake integration-activities while public authorities invest in supporting measures, this policy feature is better known as �mutual obligations� social policy.
4.1 Balancing adequacy with incentives to work
55. In the broader context of promoting independence, payment rate setting plays a key role, as policy makers across the OECD grapple with the challenge of finding the right balance between adequacy in support by providing a decent level of income, while at the same time ensuring that clients have ample financial incentives to work, and thus reduce benefit dependency. With social assistance programmes targeting expenditure on needs they can introduce disincentives to employment. In particular, payment rates are close to wages on offer in low-paid jobs (often for those with few skills), recipients may get little, if any, financial reward from working; the �unemployment trap�.14
14. The payment rate structure can also establish employment disincentives of different types: �poverty� and
�dependency� traps. To start with the former, if benefits are withdrawn gradually with increasing income, rates of withdrawal are typically relatively high and recipients may face Marginal Effective Tax Rates (METRs) of around 70 to 100%. Policy is constrained as lower withdrawal rates would extend entitlement to benefits a long way up the income ladder, increasing the number of recipients and costs to public budgets. The high METRS discourage taking temporary or part time work when unemployed, or increasing earnings when employed and receiving means tested support. This �poverty trap� complicates the design of earnings disregards and employment-conditional benefits (OECD, 2004b). Also, social assistance receipt may confer other benefits, e.g. guaranteed payment of rent, some protection from other creditors such as energy and water utilities, or entitlement to other benefits and subsidies, e.g. school meals or health charges. Even where some modest gain could be made from moving into employment, there could be a strong incentive to retain the security offered by remaining on social assistance; the �dependency trap�.

DELSA/ELSA/WD/SEM(2006)7
27
56. Concerns on �benefit traps� may not (yet) be very relevant to Chinese policy development, but they are key to the social assistance debate, and thus rate setting practices, in many OECD countries. Table 6 illustrates the issue: compared to average earnings, most benefit recipients in OECD-countries have strong incentives to work. However, when low-wage jobs are concerned (around two/thirds of average earnings), clients with children face weak direct financial incentives to paid employment, particularly in Sweden, Switzerland, and the Czech Republic, but also in other European countries. Compared to families with children, single persons face considerably stronger financial incentives to work.
S in g le p e rs o n , n o c h i ld re n
O n e -e a rn e r m a r r ie d c o u p le , tw o c h i ld re n
S in g le p e rs o n , n o c h i ld re n
O n e -e a rn e r m a r r ie d c o u p le , tw o c h i ld re n
B e lg iu m 7 2 7 7 5 5 6 1C a n a d a 3 1 6 8 2 2 5 9C z e c h R e p u b l ic 4 5 9 1 3 1 7 1D e n m a rk 7 1 8 2 5 0 7 8F ra n c e 5 6 8 3 4 1 7 0G e rm a n y 8 2 8 4 6 1 6 8K o re a 2 5 7 2 1 7 4 9N e th e r la n d s 7 9 8 7 5 8 7 2N o rw a y 6 0 8 6 4 2 6 4S w e d e n 7 4 1 0 0 5 1 7 8S w itz e r la n d 7 3 9 9 5 1 7 1U n ite d K in g d o m 6 3 7 8 4 5 7 3U n ite d S ta te s 1 0 5 0 7 4 1
S o u rc e : O E C D , T a x -B e n e f i t M o d e ls .
(1 ) A f te r ta x a n d in c lu d in g u n e m p lo y m e n t b e n e f i ts , s o c ia l a s s is ta n c e , fa m ily a n d h o u s in g b e n e f i ts in th e 6 0 th m o n th o f b e n e f i t re c e ip t . F o r m a r r ie d c o u p le s th e re p la c e n t ra te s a re re la te d to e a rn in g s o f o n e s p o u s e o n ly . C h i ld re n a re a g e d 4 a n d 6 a n d n e ith e r c h i ld c a re b e n e f i ts n o r c h i ld c a re c o s ts a re c o n s id e re d .
T a b le 6 : N e t R e p la c e m e n t R a te s a r e h ig h e s t fo r c o u p le fa m i l ie s w ith c h i ld r e n in th e C z e c h R e p u b l ic , S w e d e n a n d S w itz e r la n d .
N e t re p la c e m e n t ra te s , 2 0 0 2 , fo r d if fe re n t fa m ily ty p e s a n d d if fe re n t e a rn in g s le v e ls (1 )6 7 % o f e a rn in g s o f a n a v e ra g e p ro d u c t io n
w o rk e r1 0 0 % o f e a rn in g s o f a n a v e ra g e p ro d u c t io n
w o rk e r
57. These outcomes need not surprise. Swiss guidelines have the explicit objective of maintaining horizontal equity between benefit recipients and low-income workers. European social policy is generally more inclined to define suitable minimum incomes at a higher level than in Canada, Korea and the US. However, the replacement rates in Table 6 help understand why in so many European countries payment rates increased at less than the rate of inflation for some period during the 1980s and 1990s. Strong economic and employment growth and improving budgetary conditions in recent years, have reduced the need to curtail increments in social assistance payment rates.
5. Concluding remarks
58. In most OECD countries the social assistance systems aim to provide sufficient means for those who need it. However, this objective is not the sole, or even main, purpose of current social assistance systems; in many OECD countries, policymakers have realised that for social assistance policy to be effective, support must have a greater focus on addressing the underlying reason for social assistance receipt. And with the growth of the proportion of employable clients on social assistance registers, policy increasingly focuses on investing in employment supports for labour market re-integrating of clients, while obliging clients to make use of the supports that are available to them.

DELSA/ELSA/WD/SEM(2006)7
28
59. The greater focus on labour market integration in social assistance policy in many OECD countries has brought to the fore the need to balance �adequacy� and �making work pay� concerns. Other external factors, such as budgetary concerns and political acceptance of benefit support have also contributed to a decline in the real benefit position of many social assistance recipients during the 1980s and 1990s (and a tightening of eligibility criteria more generally). So far during the new millennium, payment rates have outpaced inflation in many OECD countries. External factors play a major role in determining payment rates in European countries, but have proven to be particularly important in Canada, Korea and the US, while policy in countries like Sweden, Switzerland (and, perhaps, Germany in recent years) are more likely to pay attention to concerns regarding baskets of goods and services on a decent standard of living. Belgium and the Czech Republic are the only countries in which payment rate adjustments are triggered automatically when the consumer price index has risen by a specified amount.
60. The Swiss social assistance guidelines arguably constitute the most explicit and elaborate exponent of internal logic that underlies payment rate setting - what level of benefit is required to support a decent standard of living as based on the cost of food, clothing, toiletries, household goods, everyday necessities, as well as expenses for social activities and participation in cultural events (within reason). However, no country has a system of payment rate determination that is purely based on a budget standards approach. In general, payment rates are not based on poverty lines or the price of a certain basket of goods which identifies a social minimum, rather it is the other way around: social assistance payment rates (in conjunction with other benefits as housing and child allowances) define the minimum standard of living which individual societies are willing to support.
DELSA/ELSA/WD/SEM(2006)7
29
BIBLIOGRAPHY
Adema W., D. Gray and S. Kahl (2003), �Social Assistance in Germany�, Labour Market and Social Policy Occasional Papers, No. 58, OECD, Paris.
Adema, W. and M. Ladaique (2005), �Net Social Expenditure, 2005 edition�, Social, Employment and Migration Working Papers, No. 32, OECD, Paris.
BMA (1998), Sozialhilfe in Deutschland. Entwicklung und Strukturen. Bericht des Statistischen Bundesamtes, (www.bma.bund.de), Bundesministerium für Arbeit und Sozialordnung, Bonn.
Bundesregierung (2001), Lebenslagen in Deutschland. Daten und Fakten. Materialband zum ersten Armuts- und Reichtumsbericht der Bundesregierung, pdf version, available under www.bma.bund.de (Publikationen).
Eardley, T, J. Bradshaw, J. Ditch, I. Gough, and P. Whiteford (1996), Social Assistance in OECD Countries: Synthesis Report, OECD, Paris and Department of Social Security, Her Majesty�s Stationary Office, London.
Esping-Andersen, G. (1990), The Three Worlds of Welfare Capitalism, Policy Press, Cambridge
Huang Yanfen and Yang Yiyong (2004), �The Urban and Rural Poor in China and their Income-earning Potential, in OECD, Income Disparities in China: an OECD perspective, pp. 65-85, OECD, Paris.
OECD (1996), Income Distribution in OECD Countries, Social Policy Studies No. 18, OECD, Paris.
OECD (1998a), The Battle against Exclusion, Social Assistance in Australia, Finland, Sweden and the United Kingdom, Vol. 1, OECD, Paris.
OECD (1998b), The Battle against Exclusion, Social Assistance in Belgium, the Czech Republic, the Netherlands and Norway, Vol. 2, OECD, Paris.
OECD (1999a), The Battle against Exclusion, Social Assistance in Canada and Switzerland, Vol. 3, OECD, Paris.
OECD (1999b), OECD Historical Statistics, 1960-1997, OECD, Paris.
OECD (1999c), A Caring World: A New Social Policy Agenda, OECD, Paris.
OECD (2000), Pushing Ahead with Reform: Labour Market and Social Safety-net Policies in Korea, OECD, Paris.
OECD (2002), Babies and Bosses: Reconciling Work and Family Life, Vol.1, Australia, Denmark, the Netherlands, OECD, Paris.

DELSA/ELSA/WD/SEM(2006)7
30
OECD (2003), Babies and Bosses: Reconciling Work and Family Life, Vol. 2, Austria, Japan and Ireland, OECD, Paris.
OECD (2004a), Babies and Bosses: Reconciling Work and Family Life, Vol. 3, New Zealand, Portugal, Switzerland, OECD, Paris.
OECD (2004b), Benefits and Wages, OECD, Paris.
OECD (2005a), OECD Revenue Statistics, 1965-2004, OECD, Paris.
OECD (2005b), Extending Opportunities: How active social policy can benefit us all, OECD, Paris.
OECD (2005c), Pensions at a Glance, OECD, Paris.
OECD (2005d), Babies and Bosses: Reconciling Work and Family Life, Vol. 4, Canada, Finland, Sweden, and the United Kingdom, OECD, Paris.
OECD (2006a), OECD Factbook 2006, OECD, Paris.
OECD (2006b), OECD Economic Surveys: China, OECD, Paris.
OECD (2006c), OECD Social Expenditure Database, 1980-2003, Paris, forthcoming.
OECD (2006d), Challenges for China�s Public Spending: Towards greater effectiveness and equity, OECD, Paris.
Saunders, P., J. Chalmers, M. McHugh, C. Murray, M. Bittman and B. Bradbury (1998), �Development of Indicative Budget Standards for Australia�, Policy Research Paper, No. 74, Department of Social Security, Canberra and Social Policy Research Centre, University of New South Wales, Australia http://www.facsia.gov.au/internet/facsinternet.nsf/research/dss-policyres_series.htm
Sceviour, R. and R. Finnie (2004), �Social Assistance Use: Trends in Incidence, Entry and Exit Rates�, Canadian Economic Observer, August, Statistics Canada, Ottawa.
SCP (2001), On Worlds of Welfare, Institutions and their effects in eleven Welfare States, Sociaal-Cultureel Planbureau, �s-Gravenhage (the Hague), the Netherlands.
SKOS (2003), Richtlinien für die Ausgestaltung und Bemessung der Sozialhilfe, Schweizerische Konferenz für Sozialhilfe, Bern, Switzerland, www.skos.ch
Statistisches Bundesamt (1998), Sozialhilfe in Deutschland: Entwicklung und Strukturen, Report 1998 (www.bma.bund.de), Wiesbaden.
Whiteford P. and W. Adema (2006), �Fighting Child Poverty in OECD Countries: is Work the Answer?�, Social, Employment and Migration Working Papers, OECD, Paris, forthcoming.
Whiteford P. and P. Henman (1999), �Assessing Budget standards: conceptual issues in the treatment of durables� Social Security Journal, 1998/1, Department of Family and Community Services, Canberra, February.
DELSA/ELSA/WD/SEM(2006)7
31
OECD SOCIAL, EMPLOYMENT AND MIGRATION WORKING PAPERS
Most recent releases are:
No. 37 MEASURES OF MATERIAL DEPRIVATION IN OECD COUNTRIES Romina Boarini and Marco Mira d'Ercole
No. 36 FROM INACTIVITY TO WORK: THE ROLE OF ACTIVE LABOUR MARKET POLICIES Stéphane Carcillo and David Grubb
No. 35 EMPLOYMENT PATTERNS IN OECD COUNTRIES: REASSESSING THE ROLE OF POLICIES AND INSTITUTIONS Andrea Bassanini and Romain Duval
No. 34 AN AGE PERSPECTIVE ON ECONOMIC WELL-BEING AND SOCIAL PROTECTION IN NINE OECD COUNTRIES (2006) Thai-Thanh Dang, Herwig Immervoll, Daniela Mantovani, Kristian Orsini, Holly Sutherland
No. 33 ALTERNATIVE MEASURES OF WELL-BEING (2006) Romina Boarini, Asa Johansson and Marco Mira d�Ercole
No: 32 SOCIAL DISADVANTAGE AND EDUCATION EXPERIENCES (2006) Stephen Machin
No. 31 CAN PARENTS AFFORD TO WORK? CHILDCARE COSTS, TAX-BENEFIT POLICIES AND WORK INCENTIVES (2005) Herwig Immervoll and David Barber
No. 30 CHALLENGES FACING LABOUR OFFICES AND SOCIAL INSURANCE (2005) Anders Reutersward
No. 29 NET SOCIAL EXPENDITURE, 2005 EDITION Willem Adema & Maxime Ladaique
No. 28 WELFARE REFORM IN EUROPEAN COUNTRIES: A MICROSIMULATION ANALYSIS (2005) Herwig Immervoll, Henrik Jacobsen Kleven, Claus Thustrup Kreiner and Emmanuel Saez
No. 27 TRENDS AND DETERMINANTS OF FERTILITY RATES: THE ROLE OF POLICIES (2005) Cristina d'Addio & Marco Mira d'Ercole
No. 26 THE �ENABLING STATE?� (2005) Neil Guilbert
No. 25 COUNTING IMMIGRANTS AND EXPATRIATES IN OECD COUNTRIES: A NEW PERSPECTIVE (2005) Jean-Christophe Dumont and Georges Lemaître
No. 24 TAXATION, ETHNIC TIES AND THE LOCATION CHOICE OF HIGHLY SKILLED IMMIGRANTS (2005) Thomas Liebig and Alfonso Sousa-Poza
No. 23 SHOULD WE EXTEND THE ROLE OF PRIVATE SOCIAL EXPENDITURE? (2005) Mark Pearson and John P. Martin
No. 22 INCOME DISTRIBUTION AND POVERTY IN OECD COUNTRIES IN THE SECOND HALF OF THE 1990S (2005) Michael Förster and Marco Mira d'Ercole
Recent available working papers can be found on the OECD website: http://www.oecd.org/els/workingpapers.
Other series of working papers available from the OECD include: OECD HEALTH WORKING PAPERS
DELSA/ELSA/WD/SEM(2006)7
32
RECENT RELATED OECD PUBLICATIONS:
INTERNATIONAL MIGRATION OUTLOOK: SOPEMI - 2006 Edition
AGEING AND EMPLOYMENT POLICIES: LIVE LONGER, WORK LONGER (2006)
BABIES AND BOSSES: Reconciling Work and Family Life, Volume 4 Canada, Finland, Sweden and the United Kingdom (2005)
PENSIONS AT A GLANCE: Public policies across OECD countries (2005)
EXTENDING OPPORTUNITIES � How active social policy can benefit us all (2005)
SOCIETY AT A GLANCE: OECD Social Indicators (2005)
OECD EMPLOYMENT OUTLOOK (2006)
AGEING AND EMPLOYMENT POLICIES: AUSTRALIA (2005)
AGEING AND EMPLOYMENT POLICIES: AUSTRIA (2005)
AGEING AND EMPLOYMENT POLICIES: CANADA (2005)
AGEING AND EMPLOYMENT POLICIES: DENMARK (2005)
AGEING AND EMPLOYMENT POLICIES: FRANCE (2005)
AGEING AND EMPLOYMENT POLICIES: GERMANY (2005)
AGEING AND EMPLOYMENT POLICIES: IRELAND (2006)
AGEING AND EMPLOYMENT POLICIES: NETHERLANDS (2005)
AGEING AND EMPLOYMENT POLICIES: UNITED STATES (2005)
PROMOTING ADULT LEARNING (2005)
MIGRATION, REMITTANCES AND DEVELOPMENT (2005)
MIGRATION FOR EMPLOYMENT: BILATERAL AGREEMENTS AT A CROSSROADS (2004)
INCOME DISPARITIES IN CHINA: AN OECD PERSPECTIVE (2004)
BENEFITS AND WAGES: OECD Indicators (2004)
REFORMING PUBLIC PENSIONS: SHARING THE EXPERIENCES OF TRANSITION AND OECD COUNTRIES (2004)
BABIES AND BOSSES: Reconciling Work and Family Life, Volume 3, New Zealand, Portugal, Switzerland (2004)
ASSET BUILDING AND THE ESCAPE FROM POVERTY: A NEW WELFARE POLICY DEBATE (2003)
MANAGING DECENTRALISATION: A NEW ROLE FOR LABOUR MARKET POLICY (2003)
COMBATING CHILD LABOUR: A REVIEW OF POLICIES (2003)
BABIES AND BOSSES: Reconciling Work and Family Life, Volume 2, Austria, Ireland and Japan (2003)
For a full list, consult the OECD On-Line Bookstore at www.oecd.org