snow melting and heating systems based on geothermal … · snow melting and heating systems based...
TRANSCRIPT

GEOTHERMAL TRAINING PROGRAMME Reports 2002Orkustofnun, Grensásvegur 9, Number 21IS-108 Reykjavík, Iceland
431
SNOW MELTING AND HEATING SYSTEMS BASED ONGEOTHERMAL HEAT PUMPS AT GOLENIOW AIRPORT, POLAND
Katarzyna ZwaryczDepartment of Heat EngineeringTechnical University of Szczecinal. Piastow 19, 70-310 Szczecin
ABSTRACT
A design for a snow melting and heating system for the airport at Goleniow, Poland,is proposed. The system is based on utilization of geothermal energy from theSzczecin region close to Goleniow town. Geothermal water at 40-90/C is found inthis area. The system is based on utilization of heat pumps extracting heat from 40 or60/C hot water. Comparison of the performance of different heat pump arrangementsin a heating system for 40/C geothermal fluid is made. Thermal and fluid-flowcalculations for the geothermal heat plant are presented here. The production-reinjecting geothermal well system consists of a counter-flow geothermal-heatexchanger and heat pump (electrically driven) with an evaporator located eitherdirectly after the geothermal heat exchanger (system 1), or with an evaporator locatedindirectly on the return network water (system 2). The system also contains aconventional heat source – a peak gas boiler, which can work together with ageothermal heat exchanger (system 3). The heating plant supplies heat to adistribution network, which consists of parallel-connected heat users with differentoperational requirements. For the first type of user, a low-temperature radiator heatingsystem, calculations for two different working scenarios were done. In the firstscenario, the temperatures of the supply and return water are a function of the outdoortemperature. In the second scenario, the supply and return water temperatures do notdepend on the outdoor temperature but are considered to be constant. The second typeof user is a tap water / ventilation system running the network water at constanttemperature throughout the year. The third type of user is a snow melting systemworking in a -16 to +3/C outdoor temperature interval, at variable heat demand values,for melting (55/25/C) and idling (30/15/C) time. Geothermal heat is supplied to thissystem through a heat exchanger.
Each of the three different systems considered in this paper is represented by arelevant schematic diagram, which demonstrates the use of geothermal energy,electrical energy and energy from a gas boiler. In the presented heating systems, thedirect heat pump approach is more efficient and economical than the indirect heatpump approach. With purposeful control and by using a snow detector in a snowmelting system, the quantity of hot water and operating costs are reduced.

432Zwarycz Report 21
1. INTRODUCTION
Currently almost all of Poland’s fuel requirements for heating are met by hard and brown coal.Unfortunately, burning such fossil fuels results in major environmental deterioration. Trying to restrainthis rapidly growing environmental pollution, authorities have more and more frequently turned towardsalternative energy sources (renewable), among which geothermal energy plays a significant role. Polandis a country rich in geothermal water resources of average enthalpy. The volume of these geothermalwaters, having a temperature between ~30 and ~120/C, is estimated at circa 6,500 km3 (Sokolowski,1993). Water at temperatures ranging from 50 to 90/C is brought to the surface through boreholes of 1.5-3 km depth. The resources are more or less evenly distributed across a significant part of Poland inspecified geothermal basins and sub-basins, which belong to the specific geothermal provinces andregions. The most favourable geothermal conditions can be found in the Polish Lowland, Podhale andSudety.
Despite such significant energy potential in geothermal resources, extensive exploitation started only onedecade ago. Until that time, geothermal water was only used for balneological purposes. Examples ofimportant centres where utilisation of geothermal water for therapeutic treatment is taking place are thespas: Ldek Zdrój, Cieplice, Ciechocinek. Between 1993 and 2001, four large thermal systems based ongeothermal energy were constructed and commissioned in Poland (Banska Nizna, Pyrzyce, Mszczonow,Uniejow). Construction of subsequent developments is planned (Zapalowicz et al., 2002).
The project design calculations presented here are based on the utilization of geothermal energy througha heat exchanger and a heat pump in different arrangements. The hot water produced will be used forradiator and tap water heating as well as for heat transfer for the proposed installation of a snow meltingsystem at the Goleniow airport. This will make it possible to reduce emissions of greenhouse gases fromconventional fuels.
Pavement snow melting by geothermal water and steam is used in several countries, including Iceland,Japan and the United States. These installations include sidewalks, roadways, ramps, runways, squares,parking areas and bridges. Most commonly it is done with a glycol solution, hot water or steam beingcirculated in pipes within or below the pavement, using either heat pipes or geothermal fluids. In oneinstance, hot water was sprinkled directly onto the pavement. This paper will attempt to present thegeneral design requirements for a snow melting system and propose a solution for an airport wheregeothermal heat is supplied to the water system through heat exchangers. The obvious benefits of suchsystems are that they eliminate the need for snow removal, provide greater safety for pedestrians andvehicles, reduce the labour in slush removal and make better working conditions at the airport.
2. HEAT PUMPS IN HEATING SYSTEMS
Heat pumps are heat transfer devices that, by using an input of work or heat, are able to reverse the normaldirection of passive heat transfer and absorb heat at a low temperature and reject it at a higher temperature.Heat pumps can be used in low-temperature geothermal heating schemes to generally boost the heat outputof the fluid, but their particular role in any specific scheme will depend upon the temperatures of the fluidswhich are being used. Thus, with moderate temperature fluids in the range of 40-70/C, the heat extractionwill be dominated by a primary heat exchanger and the heat pumps will usually be connected in a waywhich extracts additional heat from the geothermal fluid. However, with fluid temperatures less than40/C, direct heat exchange becomes almost impossible and the heat pump is connected so that itaccomplishes all of the heat transfer (Harrison et al., 1990).

433Report 21 Zwarycz
FIGURE 1: Schematic diagram of a heat pump(Wright, 1999)
2.1 Basic principles
The most common heat pumps are of the vapour compression type where a mechanically drivencompressor is used as described below. When a gas is compressed without loss of heat, its temperatureand pressure increase because of the work done on the gas by the compressor. Conversely, when a gasexpands, its temperature and pressure decrease. Compressing and/or cooling a gas sufficiently can turnit into a liquid. Liquids and gases are separately known as states of matter and together known as fluids.
The conversion of a liquid to a gas is called vaporization or evaporation, and it takes place at constanttemperature with absorption of heat from the surrounding environment. The heat absorbed goes intoincreasing the molecular kinetic energy. The amount of heat required to convert a unit-mass of liquid intoits vapour is called its heat of vaporization. In a pan of water boiling on the stove, the liquid waterremains at boiling temperature while the heat input from the stove is taken up as heat of vaporization toconvert the water to steam. For water, the amount of heat needed is 2258 kJ/kg. When a gas reverts backinto liquid, a process known as condensation, it releases heat - its so-called heat of condensation - to itssurroundings. The heat of condensation and the heat of vaporization are equal for any given fluid, so thefluid gives up the same amount of heat upon condensation that it took up upon evaporation.
In a heat pump, a working fluid iscontained in a closed, sealed circuit.The working fluid in today'sgeothermal heat pumps is commonlysome kind of hydrofluorocarbon (HFC,chlorine free) or a natural refrigerantlike propane, isobutane, ammonia orcarbon dioxide. As the working fluidmoves around the circuit, it isrepeatedly expanded and evaporated inone part of the system, causing coolingand absorption of heat, andcompressed and condensed in anotherpart of the system, causing warmingand release of heat. The effect is tomove, or pump, heat from the part ofthe system where the fluid is vaporizedto the part of the system where thefluid is condensed. Figure 1 illustratesthis idea. The compressor does work on the gas, increasing its temperature and pressure. The hot, high-pressure gas flows into the condenser, where it gives up heat to its surroundings by first cooling as a gasand then condensing, releasing its heat of condensation. The fluid exiting the condenser is a cooled, high-pressure liquid. An expansion device releases the pressure on this liquid, which flows into the evaporatoras a low-pressure vapour/liquid mixture. In the evaporator, the heat of vaporization of the liquid isabsorbed and the resulting low-pressure gas flows back to the compressor, completing the circuit. Theheat that appears at the condenser is the sum of the heat absorbed at the evaporator and the heat added bythe compressor through the work of the motor running the compressor. Because electricity is used onlyto run the compressor, the heat pump delivers 3 to 4 times more energy than it consumes (Wright, 1999).
2.2 Basic arrangements
The heat production units in a thermal station fed by geothermal energy for the supply of a district heatingnetwork may be the following:

434Zwarycz Report 21
• Primary heat exchangers between the geothermal fluid and the district heating water;• Heat pumps;• Heat recovery units of the heat pumps' prime movers;• Boilers.
Peak load boilers are absolutely necessary when the supply temperature of the district heating networkis so high that it cannot be obtained by means of base load units only; otherwise, the decision to installpeak load boilers and the choice of the thermal power for these units depends on an economic optimisationcalculation (Piatti et al., 1992).
Heat pumps are not single elements like primary heat exchangers or back-up boilers. The evaporators andcondensers are located in different parts of the system; by-pass connections of various types are alsopossible. Consequently, a wide variety of different layouts are possible in geothermal schemes all ofwhich can, in general, perform differently. If attention is focussed on the way in which the heat pumpsupplies heat in any scheme, then two basic classes of configuration can be identified:
• The heat pump assists the primary heat exchanger, supplying additional heat from the geothermalfluid. This is called the heat pump assisted (HPA) approach. In these arrangements the heat pumpsare connected in ways which produce additional geothermal heat, over and above what would beobtained from simple heat exchange alone. The geothermal heat transfer is still dominated by theprimary heat exchanger and significant heat transfers would be obtained with the heat pump switchedoff. The basic arrangements are with alternative direct or indirect evaporator connections.
• The heat pump dominates the geothermal supply and no heat is transferred if the heat pump is notoperating. This is called the heat pump only (HPO) approach. This arrangement tends to be usedwhen the temperature of the supply fluids, aquifer brines or groundwater, is so low that onlyinsignificantly small heat transfers would be obtained by simple heat exchange alone. The heat isextracted by the evaporator from the geothermal supply fluid either directly or across an auxiliaryheat exchanger. The heat is released to the heating system by the condenser. The only heat transferpath is through the heat pump and no heat is delivered unless the heat pump is working. The heatpump upgrades the heat extracted so that the condenser outlet temperature is higher than thegeothermal supply temperature (Harrison et al., 1990).
In the presented project for the airport heating system, configurations based on an electrically-driven heatpump assisted (HPA) with an indirect evaporator, later called indirect evaporator variant, and a heat pumponly (HPO) with a direct evaporator, later called direct evaporator variant, as well as a gas boiler wereconsidered.
3. SNOW MELTING SYSTEMS - EXAMPLES
3.1 Iceland
In the old centre of Reykjavík, renewal of roads and pavements has been in progress since before 1990,with snow melting pipes embedded simultaneously. At present, a snow melting area of 30,000 m2 is areality; it is expected to be extended to 60,000 m2 when renewal is complete.
In Reykjavík, geothermal hot water is used for heating houses. The distribution system is partly singlepipe and partly double pipe. In the old city, a single pipe system was laid. Geothermal water, after beingused for heating houses, was released into the drain system of the city. The return water, at 32/C, containsa lot of energy. While renewing the roads the opportunity for using this water in snow melting wasrealised. The return water is now led to five control centres for snow melting. The pipe system for thewater was laid out in such a way that the centres are interconnected and the water can be distributed to thecentres at will.

435Report 21 Zwarycz
FIGURE 2: Valve box in a snow melting system in Iceland(Ragnarsson, 1997)
All snow melting pipes are plasticpipes except for the pipes in controlcentres, which are made of steel.Mains for supply and return water arelaid from control centres and branchesare connected to valve boxes wheretubes are connected. All tubes areconnected with valves. It is veryimportant that these valves be easilyaccessible so a tube can bedisconnected or relieved of airwhenever needed. Therefore, concretevalve boxes with cast iron cover platesat final surface level have been used(Figure 2). Thus, access to valves ispossible without removing stones fromthe slab.
The pipe system is a reverse-returnsystem that maintains pressure balance. All snow melting tubes are of equal length, 280 m. The distancebetween pipes is 0.25 m. Special requirements for more snow melting are met with less distance betweenpipes, 0.2 m. Tubes are embedded in special sand underneath a stone slab. The sand has higher heatconductivity than ordinary sand. In roads with heavy traffic load from buses, pipes are laid in the asphaltlayer (Ragnarsson, 1997).
3.2 Japan
In the Gaia snow-melting system, the Downhole Coaxial Heat Exchanger (DCHE) is used for extractingheat from the earth. The heat exchanger uses a thermally insulated inner pipe and reverse circulation, i.e.the cold fluid flows down the annulus and warmer fluid flows up through the inner pipe, for efficient heatextraction.
The first Gaia snow-melting system was installed in Ninohe, Iwate Prefecture, a city 500 km north ofTokyo, and has been operating successfully since December 1995. The average low temperature for themonth of January is -7.1/C. Annual snowfall in the winter of 1995/96 was 2.9 m. The Gaia system wasinstalled at the downhill section of a curved road with a 9% gradient, in order to prevent accidents byskidding and sliding vehicles in winter. The area covered by the snow-melting system is 4 m wide and65 m long, covering a total area of 266 m2. Heating pipes were embedded in the asphalt concretepavement at 10 cm depth and 20 cm intervals. The material under the road consists of sandy rock and theundisturbed temperature is 22.5/C at a depth of 150 m. Three DCHEs, each 8.9 cm in outer diameter and150 m deep, and a 15 kW (electric) heat pump were used. In winter, heat extracted from the earth byDCHEs is transferred to a heat pump. After the temperature is increased by the heat pump, the thermalenergy is transmitted to a heating fluid circulating through a network of heating pipes, which melt thesnow (as shown in Figure 3). Antifreeze is used as both a heat extraction medium and a heating medium.
In summer, solar heat raises the temperature of the road in which the heating pipes are embedded, up to30-50/C. The solar heat is recovered from the road and stored in the earth by connecting the DCHEs andheating pipes directly, and by circulating the fluid in this loop. The warmed fluid in the heating pipesflows into the DCHEs and warms up the surrounding earth, thereby storing the solar heat in the earth. Inthis way, summertime solar heat is stored for use in the winter for melting snow. This heat storageoperation is controlled automatically by referring to the temperatures of the fluid at the bottom, inlet andoutlet of DCHEs as well as the road. The Gaia system in Ninohe City demonstrated a reduction of 84%in annual energy consumption compared with systems in Ninohe which use electric heating cables (Moritaand Tago, 2000).

436Zwarycz Report 21
FIGURE 3: Layout of a snow melting system in Japan (Caddet, 2003)
FIGURE 4: Details of a snow melting installation in Klamath Falls, USA (Lund, 1999)
3.3 United States
The oldest geothermal pavement snow-melting system was installed in Klamath Falls, Oregon, in 1948by the Oregon Highway Department. This is a 450' long section of Esplanade Street approaching a trafficsignal on an 8% grade. The grid consisted of ¾" diameter iron pipes placed 3" below the surface of theconcrete pavement on 18" centres. The grid system was connected to a geothermal well with the heattransferred through a downhole heat exchanger to a 50-50 ethylene glycol-water solution that circulatedat 50 gpm.
By 1997, after almost 50 years of operation, the system failed due to leaks in the grid caused by externalcorrosion. In the fall of 1998, a contract was issued to reconstruct the bridge deck and highway pavementalong with replacing the grid heating system. The top layer of concrete on the bridge deck was removedby hydroblasting and the roadway pavement was entirely removed, and a new crushed rock base added.A ¾" cross-linked polyethylene tubing (PEX) was then used for the grid section, placed in a doubleoverlap pattern resulting in line spacing from 14 to 16" on centre (Figure 4). The PEX pipe was attachedto the reinforcing steel within the concrete pavement, providing a cover of about 3" over the pipe within

437Report 21 Zwarycz
FIGURE 5: Location of Goleniow town and airport
the 7" pavement section. The header pipe, placed along the edge of the roadway consisted of 1.25-2.5"insulated black iron pipe, which in turn was connected to the downhole heat exchanger. The header pipehad brass manifolds placed at about 40' intervals in concrete boxes, to allow for four supply and returnPEX pipes to be attached (Lund, 1999).
4. GOLENIOW AIRPORT
4.1 General information
Goleniow airport is located in NW-Poland, near the Baltic Sea and theGerman border (Figure 5). It is lessthan 40 km north of Szczecin, at theintersection of two major roads, the A-3 motorway connecting Scandinaviawith the southern part of Europe, andthe A-6 motorway along the Polishcoast of the Baltic Sea to Gdansk.Goleniow town is 5 km from Goleniowairport. The airport, together with thetown , fo rms an i mpor t an tcommunication junction with railwayservices to Szczecin, ÐwinoujÑcie,Kamien Pomorski and Ko»obrzeg.
Goleniow town has great prospects forgrowing tourism, recreation (e.g.sailing, hunting and bird-watching)and co-operation for investment in many economic fields. This is one of the biggest towns of the SzczecinProvince and lies in the heart of the Goleniowska Forest on the Ina River. The town has almost 22,500inhabitants. The landscape of Goleniovian region was moulded by the glacial action, which created themain forms of today's morphological image of the area. It brought a huge mass of different mixedmaterials: various kinds of gravel, sand, clay, calcareous components and rocks. In the western part ofthe Goleniowska Plain, there are alleged terraces along the Dbie Lake and the Oder River, situated atlevels from 0.5 m to 25 m (Goleniow, 2002).
The Goleniow airport was a military airport until 1998. It served about 45,000 passengers in 1998. Itslocation is very advantageous and the management of the airport plans to serve parts of northern Germany.It has at its disposal a new terminal with a capacity for 200,000 passengers per year; runway dimensionsare 2,500 x 60 m2 (Airport, 2002). Investment plans call for the construction of a new automaticmeteorological information system, a new air traffic control tower, modernization of the pavement,installation of a secondary surveillance radar system and more (US Department of Commerce, 2002).
4.2 Geothermal conditions
The Szczecin region with Goleniow town is a part of the Szczecin-Lodz Synclinorium which is consideredto be one of the best water sources in Poland (Figure 6). The synclinorium area is about 67,000 km2. Theestimated recoverable volume of sub-artesian and artesian geothermal water is 2854 km3 amounting to

438Zwarycz Report 21
FIGURE 6: Map of the geothermal regions inPoland with Szczecin-Lodz Synclinorium
&minVg
&maxVg
0
10
20
30
40
50
60
70
-16 -12 -8 -4 0 4 8 12t out [°C]
u [%
]
FIGURE 7: Temperature duration curvefor the Goleniow area
18,812 million toe (tons oil equivalent). Onaverage, it amounts to 42 million m3 of water or280,800 toe/km2. Geothermal water at 40-90/C isfound in this area at 600-2200 m depth. These strataconsist of gray sandstone with high porosity andthickness up to 200 m (Meyer and Kozlowski,1995).
The town Pyrzyce is located close to Goleniowtown, on the same synclinorium. Since 1997 amodern 50 MWt geothermal heat plant has been inoperation in Pyrzyce. For the base load it uses 340m3/h of 68/C geothermal fluid as well as two 10MWt heat pumps that heat the fluid to the 90/Crequired by the customers. As a peak heat source, a22 MWt gas boiler is used. Water is extracted froma depth of about 1500-1650 m, from rock deposits ofearlier Jurassic by means of two doublets. Extractedwater parameters are: temperature 68/C, salinity 120g/l, density 1.062 kg/m3. The task of the geothermal
heat plant in Pyrzyce was to replace 68 local coal boilers in use, and increase the energy efficiency.
From the existing wells in the Szczecin Basin, the following approximate data for the geothermal fluidaccessible in Goleniow can be estimated:
• Volumetric flow rate of geothermal water: = 50 m3/h; = 150 m3/h;
• Temperature of geothermal water: Tg min = 40/C ; Tg max = 100/C;• Average density of geothermal water: Dg = 1.08 kg / m3
• Average specific heat of geothermal water at const. pressure: cg = 3.81 kJ/kgK
On the basis of the operation of the Pyrzyce geothermal heat plant and chemical analysis, it is known thatthe geothermal water from Szczecin Basin is very aggressive. The reason for this is the highmineralization - a high salt content. Also, it is worthwhile to note that there could be danger ofmicrobiological corrosion. Salt and hot geothermal water can be a good environment for bacterial growth.The bacteria, if injected into the bedrock, can silt it up (stick up) making flow impossible.
4.3 Climatic data
The geographical location and surface features are the twomost important factors determining the climate of Poland(EPM, 2002). Due to the location of Poland in thetemperate latitudes, Arctic air masses dominate. Theshare of maritime air is greater than of continental air (38-46%), because of the more common, western (oceanic)circulation of air. The terrain pattern forming along theparallels of latitude also aids the flow of humid air massesfrom the ocean to Poland (75% of atmospheric frontscome from the West).
Because detailed information about weather conditions atGoleniow is not available the estimated temperatureduration curve shown in Figure 7 was used. The data is

439Report 21 Zwarycz
taken from heat load calculation for a geothermal heat plant located near the Goleniow area (Zwarycz,2000). Table 1 shows average temperatures from the Goleniow area used in the heat demand calculationsfor snow melting (Airport, 2002). Further assumptions are: relative humidity 80%, average rate ofsnowfall 2 mm/h and average wind velocity 3.4 m/s.
TABLE 1: Maximum and minimum daily average temperatures (/C) used for Goleniow area
Months Jan Feb Mar Apr May June July Aug Sep Oct Nov DecMaximum -0.6 1.5 6.6 12.2 18.7 20.5 22 22 17.8 13 6.7 3.1Minimum -4.8 -4.8 -0.8 1.8 6.9 10.2 11.9 11.7 8.8 5.4 0.9 -2
5. HEAT DEMAND ANALYSIS
5.1 Airport buildings
Heat demand for the airport buildings was calculated based on Polish Standards for public buildings(U#0.3W/m2K), which define heat demand with the parameters below:
• For geothermal water central heating: 30 W/m2
• For municipal tap water: 10 W/m2
• For ventilation/climatization: 20 W/m2
Table 2 shows heat demand calculated for the airport buildings. The assumed heat demands for tap waterand ventilation systems, as one cumulated value, were also taken.
TABLE 2: Heat demand for the Goleniow airport buildings
Buildings
Heat demand [kW]Heating season Rest of year
Area[m2]
Centralheating
Tapwater
Ventila-tion
Tapwater
Ventila-tion
Airport terminal building 2400 72 24 48 24 48Technical hinterland building 1700 51 17 34 17 34Fire brigade building 400 12 4 8 4 8Sum 4500 135 45 90 45 90
5.2 Snow melting system
Heating requirements for snow melting depend firstly on atmospheric factors and secondly on the demandfor effectiveness. Atmospheric factors are four, rate of snowfall, air temperature, relative humidity andwind velocity. Effectiveness of snow melting or melting rate means how quickly snow is melted. Heatoutput and melting rate are dependent on the distance between pipes, the depth of pipes in the ground,fluid flow and the drop in temperature of the fluid in pipes, conductivity of the slab, etc.
The extreme demand for snow melting is to have a constant snow-free surface. This demand is, in mostcases, unrealistic because of the operating cost. Using insignificant heat output, and, therefore, aninadequate melting rate, results in melting taking a long time. The time depends on the duration,frequency and quantity of snowfalls. Heat requirements can be great even when there is no snowfall andthe earth is free of snow, especially if wind is blowing hard. During freezing periods, it is necessary to

440Zwarycz Report 21
t
fr A
AA =
1)0(
ctsc
q aps
−=
ρ
1csh
q fm
ρ=
keep the surface temperature above freezing point to avoid icing. When snow starts to fall, a sufficientheat resource must be in the soil and the surface layer. The heat melts the snow when it starts to fall andcounterbalances a rather slow reaction of the snow melting system. Determining a sufficient heat resourcein a snow melting area is dependent on the expected weather condition. If surface temperature is low,snow piles up when snowfall is intense. It takes a long time, one or two months, to build up a resourcein cold earth. It can be expensive to preserve an abundant heat capacity in the earth (Ragnarsson, 1997).
Heat is transferred to the snow to change the temperature to the melting point, 0/C. Heat is required tomelt the snow, the heat of fusion. Heat is also required for evaporation. When the surface is free of snow,heat is transformed from the surface to the atmosphere by convection and radiation. This heat loss isdependent on outdoor temperature and wind speed. While snowflakes are being warmed and before theyare melted, they act as tiny blankets or insulation. The effect of this insulation can be great. The ratio ofthe uncovered, or free area Af to the total area At is the free area ratio Ar (general use of variables isexplained in Nomenclature).
(1)
To maintain Ar = 1, the system must melt the snow so rapidly that accumulation is zero. This isimpossible, but for purposes of design, it is permissible to assume Ar = 1 as a maximum. For Ar = 0, thesurface must be completely covered with snow to a depth sufficient to prevent evaporation and heattransfer losses. Research on the insulating effects of snow indicates that, in practice, the free area ratiocan be adequately expressed by one of three values: 0, 0.5, and 1.
Chapman and Katunich (1956) derived the general equation for the required slab heat output q0:
q0 = qs + qm + Ar (qe + qh) (2)
The sensible heat qs to bring the snow to 0/C is
(3)
The heat of fusion qm to melt the snow is
(4)
The heat of evaporation qe (mass transfer) is
qe = hfg (0.005 V + 0.022) (0.625 - pav) (5)
The heat transfer qh (convection and radiation) is
qh = 64.74 (0.0125 V + 0.055) (tf - ta) (6)
The solution to Equation 2, however, requires the simultaneous consideration of all four climatic factors,e.g. wind speed, air temperature, relative humidity and rate of snowfall. Annual averages or maximumsfor the climatic factors should not be used because there is no assurance that they will ever occursimultaneously. Therefore, it is necessary to perform a frequency analysis of the solutions to the equationfor all occurrences of snowfall over several years. During operation when the outdoor temperature isabove the freezing point, the snow melting system is operated with basic heat output rate, qmelting. Thebasic rate is sometimes determined by taking into consideration the output needed to melt snow in freezingperiods in the warmest month of operation. In freezing temperatures, 0/C and below, without snowfall,the system may be idling, which means that some heat, qidling, is supplied to the slab to prevent icing or tosecure the start of melting as snow starts to fall. Hot water is injected if house water is not sufficient.Light snowfalls can normally be handled by the idling slab. When snowfall increases, more hot water is

441Report 21 Zwarycz
FIGURE 8: Snow thickness on the ground as a function of time(Fjarhitun, 1982)
added. The effect of snow melting is dependent on the quantum of water and the maximum output thesnow melting system is matched for. The maximum output is regulated by the control system and isrelative to the demand for snow melting, but limited by acceptable operating cost.
Snow-melting installations are classified as Class I, II, or III (ASHRAE, 1995). Snow-melting systemsare generally classified, by urgency of melting, as follows:
• Class I (minimum): Residential walks or driveways; interplant ways or paths;• Class II (moderate): Commercial sidewalks and driveways; steps of hospitals;• Class III (maximum): Toll plazas of highways and bridges; aprons and loading areas of airports;
hospital emergency entrances.
The difference between a Class I system and a Class II system is the required ability of each system tomelt snow. For example, the accumulation of 25 mm of snow in an hour during a heavy storm might notbe objectionable for a residential system. On the other hand, a store manager might consider the systeminadequate if 13 mm of snow accumulated on the sidewalk in front of the store. In a residential systemwhere initial cost must be kept at a minimum, more frequent snow accumulations may have to beaccepted.
Back and edge losses, which increase the required slab output found by Equation 2, must also beconsidered. These losses can vary from 4 to 50%, depending on factors such as pavement construction,operating temperature, ground temperature, or back exposure. The snow melting pipes are embedded insand. Sand is a very insulating material, especially when dry. It is, therefore, important to use specialsand with good conductivity above the pipes (Ragnarsson, 1997).
TABLE 3: Heat demand for the Goleniow airport snow melting system
q0 [W/m2]class III
tm[°C]class III
Heat demand [kW]class III Area
[m2]Melting Idling Melting Idling Melting Idling
Method 1 499 30 44 3 2495 150 5000Method 2 436 30 39 3 2180 150 5000Method 3 200 100 40 23 1000 500 5000
For reasons of comparison, three different methods for calculating the heat demand of a snow meltingsystem have been applied. The first used Equations 2 to 6. The second, based on the ASHRAEHandbook, used meteorological data for American cities. In the third method, the Icelandic experiencewas applied. Table 3 shows calculated required heat load q0, mean water temperature tm as well as heatdemand for class III installation, assuming relative humidity 80%, average rate of snowfall 2 mm/h andaverage wind velocity 3.4 m/s. Because of so many assumptions due to not enough (exact) climatic datafor Goleniow airport area, calculations by the first method are very approximate. However, the results arecomparable to the results of thesecond method based on experiencefrom the United States. But accordingto the Icelandic experience, they aretoo high and result in very highoperating costs.
Figure 8 shows calculated values forsnow thickness on the ground as afunction of time. The assumedsnowfall is 3 mm/h and curves forthree different values of heat load are

442Zwarycz Report 21
FIGURE 9: Heat load as a function of air temperatureand wind velocity (Fjarhitun, 1982)
shown. The figure shows that for 200W/m2 heat load the time of melting isabout 3 hours and, after 2 hours, 1.6 mmwater equivalent of snow stays on thesurface. Figure 9 shows that for 3.5 m/swind velocity and average air temperature-2/C, the heat load 200 W/m2 is higherthan necessary. The excess heat can beused for back and edge losses. For thisreason, values based on the Icelandicliterature for a maximum heat load formelting equal to 200 W/m2 and an idlingload equal to 100 W/m2, were accepted.
6. DESIGN OF A SNOW MELTING SYSTEM
The snow melting system considered here is designed for operation between -16/C and +3/C outdoortemperatures. The maximum heat load for melting is assumed to be 200 W/m2 and supply-return waterparameters 55/25/C. In freezing temperatures (0/C and below) without snowfall, the system may beidling, which means that some heat is supplied to the slab so that melting begins immediately when snowstarts to fall. The idling load is equal to 100 W/m2 with supply-return water 30/15/C. The constant waterflow rate for both melting and idling operation is 5.7 l/m2h.
A hydronic system design includes selection of the following components:
1. Heat transfer fluid;2. Pipe system;3. Fluid heater;4. Pump(s) to circulate the fluid; and5. Controls.
In concrete pavement, thermal stress is also a design consideration.
6.1 Heat transfer fluid
There are a variety of fluids suitable for transferring the heat from the fluid heater to the pavement,including brine, oils, and glycol-water. Freeze protection is essential because most systems will not beoperated continuously in subfreezing weather. Without freeze protection, power loss or pump failurecould cause freeze damage to the pipe system and pavement.
Brine is the least costly heat transfer fluid, but it has a lower specific heat than glycol. The use of brinemay be discouraged because of the cost of heating equipment that is resistant to its corrosive potential.Glycols (ethylene and propylene) are used most often in snow-melting systems because of their moderatecost, high specific heat, and low viscosity; ease of corrosion control is another advantage. Automotiveglycols containing silicates are not recommended because they can cause fouling, pump seal wear, fluidgelation, and reduced heat transfer. The pipe system should be designed for a periodic addition of aninhibitor. Glycols should be tested annually to determine any change in reserve alkalinity and freezeprotection. Only inhibitors obtained from manufacturers of the glycol should be added. Heat exchangersurfaces should be kept below 140/C, which corresponds to about 280 kPa (gage) steam. Temperaturesabove 150/C accelerate the deterioration of the inhibitors (ASHRAE, 1995).
443Report 21 Zwarycz
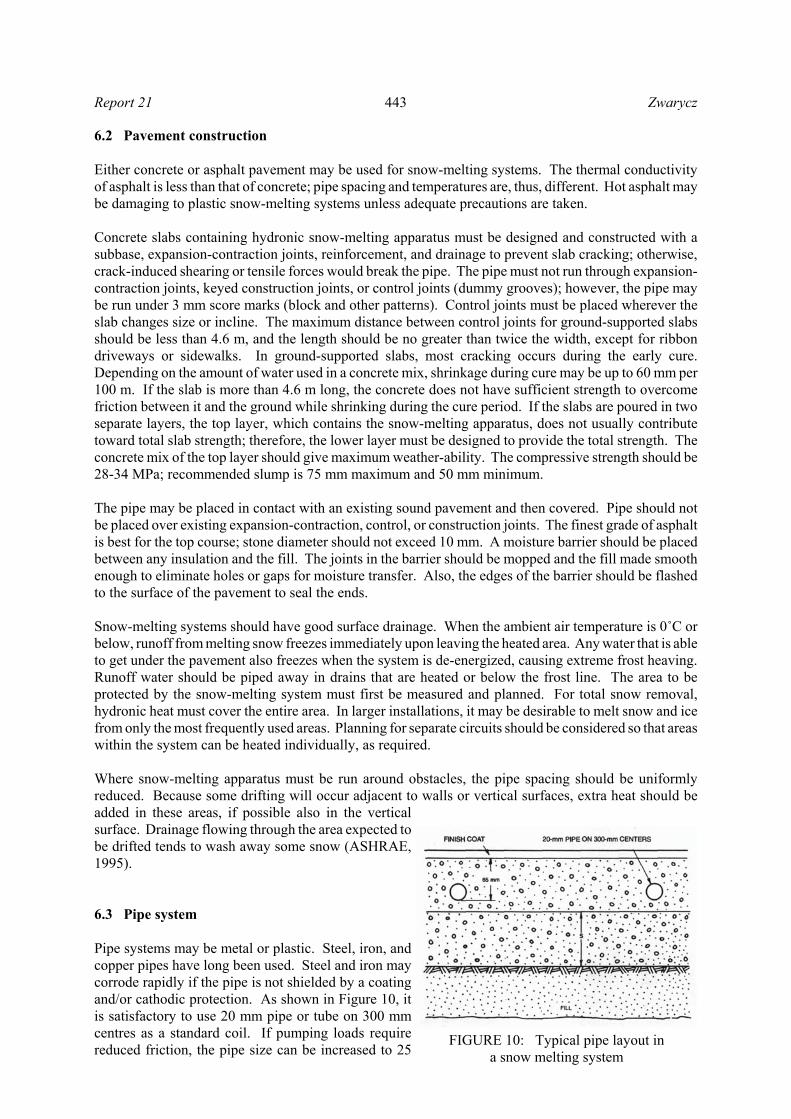
FIGURE 10: Typical pipe layout ina snow melting system
6.2 Pavement construction
Either concrete or asphalt pavement may be used for snow-melting systems. The thermal conductivityof asphalt is less than that of concrete; pipe spacing and temperatures are, thus, different. Hot asphalt maybe damaging to plastic snow-melting systems unless adequate precautions are taken.
Concrete slabs containing hydronic snow-melting apparatus must be designed and constructed with asubbase, expansion-contraction joints, reinforcement, and drainage to prevent slab cracking; otherwise,crack-induced shearing or tensile forces would break the pipe. The pipe must not run through expansion-contraction joints, keyed construction joints, or control joints (dummy grooves); however, the pipe maybe run under 3 mm score marks (block and other patterns). Control joints must be placed wherever theslab changes size or incline. The maximum distance between control joints for ground-supported slabsshould be less than 4.6 m, and the length should be no greater than twice the width, except for ribbondriveways or sidewalks. In ground-supported slabs, most cracking occurs during the early cure.Depending on the amount of water used in a concrete mix, shrinkage during cure may be up to 60 mm per100 m. If the slab is more than 4.6 m long, the concrete does not have sufficient strength to overcomefriction between it and the ground while shrinking during the cure period. If the slabs are poured in twoseparate layers, the top layer, which contains the snow-melting apparatus, does not usually contributetoward total slab strength; therefore, the lower layer must be designed to provide the total strength. Theconcrete mix of the top layer should give maximum weather-ability. The compressive strength should be28-34 MPa; recommended slump is 75 mm maximum and 50 mm minimum.
The pipe may be placed in contact with an existing sound pavement and then covered. Pipe should notbe placed over existing expansion-contraction, control, or construction joints. The finest grade of asphaltis best for the top course; stone diameter should not exceed 10 mm. A moisture barrier should be placedbetween any insulation and the fill. The joints in the barrier should be mopped and the fill made smoothenough to eliminate holes or gaps for moisture transfer. Also, the edges of the barrier should be flashedto the surface of the pavement to seal the ends.
Snow-melting systems should have good surface drainage. When the ambient air temperature is 0/C orbelow, runoff from melting snow freezes immediately upon leaving the heated area. Any water that is ableto get under the pavement also freezes when the system is de-energized, causing extreme frost heaving.Runoff water should be piped away in drains that are heated or below the frost line. The area to beprotected by the snow-melting system must first be measured and planned. For total snow removal,hydronic heat must cover the entire area. In larger installations, it may be desirable to melt snow and icefrom only the most frequently used areas. Planning for separate circuits should be considered so that areaswithin the system can be heated individually, as required.
Where snow-melting apparatus must be run around obstacles, the pipe spacing should be uniformlyreduced. Because some drifting will occur adjacent to walls or vertical surfaces, extra heat should beadded in these areas, if possible also in the verticalsurface. Drainage flowing through the area expected tobe drifted tends to wash away some snow (ASHRAE,1995).
6.3 Pipe system
Pipe systems may be metal or plastic. Steel, iron, andcopper pipes have long been used. Steel and iron maycorrode rapidly if the pipe is not shielded by a coatingand/or cathodic protection. As shown in Figure 10, itis satisfactory to use 20 mm pipe or tube on 300 mmcentres as a standard coil. If pumping loads requirereduced friction, the pipe size can be increased to 25

444Zwarycz Report 21
FIGURE 11: Snow melting heat load as a function ofpipe depth and distance between them (Fjarhitun, 1982)
FIGURE 12: Piping details for concrete construction joints
mm, but the pavement depth must be increased accordingly. The piping should be supported by aminimum of 50 mm of concrete above and below. This requires a 130 mm pavement for 20 mm pipe and140 mm for 25 mm pipe.
Figure 11 shows snow melting heatload as a function of pipe depth anddistance between them. It is assumedthat the supply and return watertemperatures are 35/C and 15/C,respectively, the pipe diameter is 25mm and the surface temperature 0/C.It is common to put pipes 8 to 10 cmbelow the surface and to have 25 cmdistance between them, then the headload varies between 320 and 270W/m2. If the distance between pipes is40 cm and they are at 10 cm depth theheat load is 220 W/m2, but then unevenheat transfer at the surface can beexpected (Fjarhitun, 1982). Plast ic pipes (polyethylene,polybutylene) are popular due to lowmaterial cost, low installation cost, andcorrosion resistance. Necessaryconsiderations when using plastic
pipes include stress crack resistance, temperature limitations and thermal conductivity. Heat transfer oilsshould not be used with plastic pipe. Polyethylene and polybutylene pipe is furnished in coils. Thesmaller sized pipe can be bent to form a variety of heating panel designs without elbows or joints.Mechanical compression connections can be used to connect the heating panel pipe to the larger supplyand return piping leading to the pump and fluid heater. Plastic pipe may be fused using the appropriatefittings and fusion equipment. Fusion joining eliminates metallic components and, thus, the possibilityof corrosion in the pipe system; it does, however, require considerable installation training. When plasticpipe is used, the system must be designed so that the fluid temperature required will not damage the pipe.If a design requires a temperature above the tolerance of plastic pipe, the heat output will never meetdesign requirements. A logical solution is to decrease the pipe spacing.
It is a good design practice to avoidpassing any embedded piping througha concrete expansion joint; otherwise,the pipe may be stressed and possiblyruptured. A method of protectingpiping, that must pass through aconcrete expansion joint, from stressunder normal conditions is shown inFigure 12. Because the introduction ofair causes deterioration of theantifreeze, the pipe system should notbe vented to the atmosphere. It shouldbe divided into smaller zones tofacilitate and allow isolation whenservice is necessary. After pipeinstallation, but before pavementinstallation, all piping should be air
445Report 21 Zwarycz
tested to about 700 kPa (gage). This pressure should be maintained until all welds and connections havebeen checked for leaks. Testing should not be done with water for the following reasons (ASHRAE,1995):
1. Small leaks may not be observed during pavement installation;2. Water leaks may damage the concrete during installation; 3. The system may freeze before antifreeze is added; and 4. It is difficult to add antifreeze when the system is filled with water.
6.4 Control
Snow-melting systems can be controlled either manually or automatically. Manual operation is strictlyby two-position control; an operator must activate and deactivate the system when snow falls. If thesystem is not turned off after snowfall, operating cost is increased. If the snow-melting system is notturned on until snow starts falling, it may not melt snow effectively for several hours, giving additionalsnowfall a chance to accumulate and increasing the time needed to melt the area. Automatic controlsprovide satisfactory operation because they turn on the system when light snow starts, allowing adequatewarm-up before heavy snowfall develops. Operating costs are reduced with automatic turn-off.
Snow detectors monitor precipitation and temperature. They allow operation only when snow is presentand may incorporate a delay-off timer. Snow detectors located in the heated area activate the snow-melting system when precipitation (snow) occurs at a temperature below the preset pavement temperature(usually 4/C). Another type of snow detector is mounted above ground, adjacent to the heated area,without cutting into the existing system; however, it does not detect tracked or drifting snow. Both typesof sensors should be located so that they are not affected by overhangs, trees, blown snow, or other localconditions.
To limit energy waste during normal and light snow conditions, it is common to include a remotetemperature sensor installed midway between two pipes or cables in the pavement; the setting is adjustedto between 5 and 15/C. Thus, during mild weather snow conditions, the system is automaticallymodulated or cycled on and off to keep the pavement temperature at the sensor at set point. The controlsystem may include an outdoor thermostat that turns the system off when the outdoor ambient temperaturerises above 2-5/C, as automatic protection against accidental operation in summer. For optimum operatingconvenience and minimum operating cost, all of the aforementioned controls should be incorporated inthe snow-melting system (ASHRAE, 1995).
6.5 Thermal stress
In general, thermal stresses will cause no problems if the following installation and operation rules areobserved:
• Minimize the temperature difference between fluid and the slab surface by maintaining close pipespacing (Figure 10), a low temperature differential in the fluid (less than 10/C) and continuousoperation (if economically feasible);
• Install pipe within about 50 mm of the surface;• Use reinforced steel designed for thermal stress if high structural loads are expected.
Thermal shock to the pavement may occur if heated fluid is introduced from a large source of residual heatsuch as a storage tank, a large pipe system, or another snow melting area. The pavement should bebrought up to the temperature by maintaining the fluid temperature differential at less than 10/C(ASHRAE, 1995).

446Zwarycz Report 21
&maxVg
&maxQRH
&maxQTV
&maxQSM
&maxQSM
7. HEATING AND SNOW MELTING NETWORK DESIGN
The purpose of this work was to make the thermal and fluid-flow calculations for a proposed geothermalheat plant at Goleniow Airport in NW-Poland. The geothermal water is utilized as a heat sourcesupplemented with other energy sources, a heat pump (direct and indirect evaporator connection), and agas boiler. The heating plant supplies heat to a distribution network, which itself consists of parallel-connected heat users featuring different operational requirements.
7.1 Characteristics and assumptions
The main components of the heating system are production–reinjecting geothermal wells, a counter-flowgeothermal-heat exchanger, a heat pump (electrically driven) and a gas boiler for peak loads. Threedifferent types of setup are considered:
System 1: Heat is transferred to the distribution network by a heat pump with a closed loop, geothermallyheated water on the evaporator side (heat source) and the distribution network water on the condenser side(heat supply).
System 2: Heat is transferred to the distribution network partly by a heat pump working between the returnand supply flows and partly by heating the return water after it passes the heat pump evaporator, in thegeothermal heat exchanger. A peak gas boiler is located in the radiator heating loop.
System 3: Heat is transferred to the distribution network by the geothermal heat exchanger and a peak gasboiler connected in series. No heat pump is used in this case.
That heat plant is interconnected by means of pipelines and bypasses with three types of users. They havedifferent operational requirements and are connected in parallel:
• The first type of user is a radiator heating system. Two scenarios are considered, in the first, thetemperature of the supply water varies as a function of the outdoor temperature; in the second, thesupply water temperature is kept constant. It was assumed that during the heating season the insidetemperature is kept at +20/C and the outdoor temperature varies between -16/C and +12/C.
• The second type of user is a tap water / ventilation system, running the network water at constanttemperature, 50/C, year round.
• The third type of user is a snow melting system working in a -16/C to +3/C outdoor temperatureinterval, on variable heat demand values for melting (55/25/C) and for idling (30/15/C).
For calculations, the following data were assumed:• Max. volumetric flow rate of geothermal water: = 50 m3/h = 15 kg/s • Max. temperature of geothermal water
Tg max = 40/C (radiator parameters are 65/50; 65/40; 65/35 or 90/70/C)Tg max = 60/C (radiator parameters are 90/70/C)
• Mean mass density of geothermal water: Dg = 1.08 kg/m3
• Mean specific heat of geothermal water: cg = 3.81 kJ/kgK
• Max. heat demand of radiator heating: = 135 kW
• Max. heat demand of tap water and ventilation: = 135 kW
• Max. heat demand of snow melting system
Melting time: = 1000 kWIdling time: = 500 kW

447Report 21 Zwarycz
& & & &max max maxQ Q Q QC RH TV SM= + +
0
200
400
600
800
1000
1200
1400
0 1000 2000 3000 4000 5000 6000 7000 8000 9000 10000time [h]
Qc
[kW
]
Total demand Qc (melting)
Total demand Qc (idling)
FIGURE 13: The heat demand curve usedfor Goleniow airport
∆ ∆QQ Q
i =+& &
1 2
2τ
Total demand for the thermal power, , which was predicted for the design outdoor temperature, tout =&Qc-16/C , was defined by the following relationship:
(7)
Data for operating time needed for different parts of the system is estimated as shown in Table 4. Theheating season is a 232-days period, with 15 snowfall days. However, the snow melting system is inoperation for 102 days until tout = 3/C. Above that temperature, heat is only required for radiators and thetap water / ventilation system. When tout = 12/C, the heating season is finished and the rest of year (133days) the system works only for tap water / ventilation demands.
TABLE 4: Operating time data
TimeDays Hours
No snowfall tout > 0°C 170 4080 tout # 0°C 47 1128Snowfall 15 360Sum for heating season 232 5568Rest of the year 133 3192Sum 365 8760
Because the heat demand curvefor Goleniow is not available, aheat demand curve isdemonstrated in Figure 13, withthe total heat load for theheating season (melting andidling time) and then the rest ofthe year. This data were takenfrom similar heat loadcalculations made for ageothermal heat plant locatednear the Goleniow area(Zwarycz, 2000).
The total heat energy Qc [MWh]for one year was estimated fromthe following formula:
Qc = 3)Qi (8)
where )Qi [MWh] is heat energy for the elementary time interval, )J, calculated as follows:
(9)
Geothermal heat energy Qg, heat pump energy Qout and gas boiler energy Qpb were calculated similarly.Heat demand values for radiator heating, tap water / ventilation and snow melting systems, as well as timeoccurrences for each outdoor temperature are shown in Appendix I.

448Zwarycz Report 21
outRHRH t
tQQ−−
=2020
max&&
3/4
0max
∆∆
=m
m
RH
RH
TT
QQ&
&
( )
−−
−=∆
iRHr
iRHs
RHrRHsm
TTTT
TTTln
)( RHrRHss
RHRH TTc
Qm−
=&
&
65/50°C
0
10
20
30
40
50
60
70
80
90
-16 -12 -8 -4 0 4 8 12tout[°C]
t[°C
]
tRHstRHr
65/40°C
010
2030
4050
6070
8090
-16 -12 -8 -4 0 4 8 12tout[°C]
t[°C
]
tRHstRHr
65/35°C
010203040
5060708090
-16 -12 -8 -4 0 4 8 12tout[°C]
t[°C
]
tRHstRHr
90/70°C
010203040
5060708090
-16 -12 -8 -4 0 4 8 12tout[°C]
t[°C
]
tRHstRHr
FIGURE 14: Radiator supply and return water temperature variants,first scenario
7.2 Radiator heating
Heat demand for radiator heating was calculated from the formula (Valdimarsson, 1993):&QRH
(10)
And return water temperature from radiators was estimated from the equation:
(11)
Logarithmic temperature difference )Tm is defined as
(12)
The mass flow of the network water for the radiator heating circuit, , was estimated from the&mRHfollowing formula:
(13)
The mass flow of the network water for the tap water / ventilation and snow melting system was calculatedin a similar way.
In the radiator heatingsystem calculations fortwo different workingscenarios were per-formed. In the first onethe temperatures of thesupply water is afunction of the outdoortemperature. In this casefour different sets ofsupply and return watertemperatures at designconditions were con-sidered (65/50, 65/40,65/35 and 90/70/C) asshown in Figure 14. Inthe second scenario, thesupply water tempera-tures do not depend onthe outdoor temperaturebut are considered to beconstant. In this case
three different sets of supply and return water temperatures at design conditions were considered (65/50,65/40 and 65/35/C) as shown in Figure 15. The return water temperature from radiators at differentoutdoor temperatures is calculated according to the )Tm / )Tm0 ratio from the heat balance Equation 11.

449Report 21 Zwarycz
65const/50°C
0102030405060708090
-16 -12 -8 -4 0 4 8 12tout[°C]
t[°C
]
tRHstRHr
65const/40°C
0102030405060708090
-16 -12 -8 -4 0 4 8 12tout[°C]
t[°C
]
tRHstRHr
65const/35°C
0102030405060708090
-16 -12 -8 -4 0 4 8 12
tout[°C]
t[°C
]
tRHstRHr
& & &Q W T W Tg g g s s= =∆ ∆
& &W m cg g g=
& &W Wg s=
FIGURE 15: Radiator supply and return water temperature variants, second scenario
7.3 Geothermal heat exchanger
For a geothermal-heat exchanger, we assume a multi-plate counter-flow exchanger where the heatcapacities for both media are equal to one another, and the temperature difference between them isconstant. It was assumed that )T = 5 K. In such a case the mean temperature difference equals ) =T5 K. The heat flux, the dispersal of the geothermal water via network water flowing through theexchanger, is defined by the following relationship:
(14)
where = Heat capacity of the network water that flows into the heatexchanger; and& &W m cs s s=
= Heat capacity of the geothermal water that also goes into that exchanger.
As for the temperature differences: )Tg = Tgp - Tgi, and )Ts = T1 - T3 , these are the respective changes intemperature for mediums circulating in the heat exchanger. For the purposes of our calculations, the massflow of the network water going into the heat exchanger was regulated in such a way that the followingassumed requirement could be satisfied, i.e.:
(15)
Three pipe-joints of the network water – the analytical nodes that are temporarily turned on if necessary,characterize the assumed analytical diagram of the heating system. Exercising the first principle ofthermodynamics, and on the assumption that the given node is in steady-state, the medium’s temperaturesand mass flows were estimated from the equations for energy balance and medium weight.
7.4 Heat pump
After the heat exchange, the working fluid goes through a heat pump unit where it is cooled down. The

450Zwarycz Report 21
12
2 273tt
tCOPCOP c −+
== χχ
eb
b
ttt
ba
e
ttt+−
−
−=
11
cf
f
ttt
fd
e
ttt
+
−
−
+=
12
−
−−
−
+
+
−
+
=
+−
+
−
+
−
eb
b
cf
f
cf
f
ttt
ba
ttt
fd
ttt
fd
c
e
tt
e
tt
K
e
tt
COP
11
273
1
Te2
Te1
me1
HP
mg
HETgp
TgiTc2
Tc1
mn
TV 10°C
50°CmTV
TTVs
TTVrRH
mc1
mc1
mRH
TRHr
TRHs
RHSMTSM2
mSM
HE
TSM1
Te2
Te1
me1
Te2
Te1
me1
HPHP
mg
HETgp
Tgi
mg
HETgp
TgiTc2
Tc1
mn
TV 10°C
50°CmTV
TTVs
TTVr
mn
TV 10°C
50°CmTV
TTVs
TTVrRH
mc1
mc1
mRH
TRHr
TRHs
RH RH
mc1
mc1
mRHmRH
TRHr
TRHs
RHSMTSM2
mSM
HE
TSM1
SMTSM2
mSM
HE
TSM1
FIGURE 16: Schematic diagram of heating system 1
water heated in the heat pumps’ upper heat sources is used for system heating. One of the importantparameters characterizing heat pumps is the Coefficient of Performance (COP). In heating mode, itdescribes the ratio of the heating capacity to the input driving power consumption. An approximate valueof the COP for a real heat pump can be found by using Equation 16:
(16)
For a real heat pump unit, the P value equals 0.5-0.6 (Rubik, 1996). The value of P is not constant andchanges with working conditions and heat pump construction (refrigerant, compressor type, etc.). Formodern heat pumps P has high values - near the upper mentioned limit. Consequently, the P value of 0.6is assumed in further calculations. Evaporation and condensation temperatures, respectively, for arefrigerant can be calculated according to Equations 17 and 18 (Rubik, 1996):
(17)
(18)
The values for tc and te for heat pumps, based on water as both heat sources, can be assumed as 3-4/C(Rubik, 1996). Equation 19 is derived by combining Equations 16 (for P = 1), 17 and 18. It describes theCOPC value as a function of heat source, temperatures, and temperature differences:
(19)
The COP has higher values when the temperature differences tf and tb are small. According to Equation16 this conclusion is also true for real heat pumps. Therefore, it can be said that COP for heat pumpsincreases when temperature differences decrease. Further calculations of COPc by Equation 19 aredescribed assuming tc = te = 3/C.
7.5 System 1
Here, the heat pump assists ageothermal heat exchanger insupplying additional heat to theheating system. As shown inFigure16, the lower heat sourcefor the evaporator is waterheated in the geothermal heatexchanger (Te1), whereas thecondenser works between thereturn, Tc2, and supply, Tc1,water from the heating system.T h e e v a p o r a t o r , u s i n ggeothermal supply fluid, extractsthe heat from a heat exchanger. The heat is released to the system by the condenser. The only heat transferpath is through the heat pump and no heat is delivered unless the heat pump is working. The heat pumpupgrades extracted heat so the condenser outlet temperature is higher than the geothermal supply

451Report 21 Zwarycz
mRHTRHs
TRHrmn
TV 10°C
50°CmTV
TTVs
TTVr
TSM2
mSM
SM
HE
TSM1
HP
Te1
Te2
Tc1
Tc2
RH
PB
mc1
mc1
mg
HETgp
Tgi
mRHTRHs
TRHrmn
TV 10°C
50°CmTV
TTVs
TTVr
mRHTRHs
TRHrmn
TV 10°C
50°CmTV
TTVs
TTVr
TSM2
mSM
SM
HE
TSM1
TSM2
mSM
SM
HE
TSM1
HP
Te1
Te2
Tc1
Tc2
RH
PB
mc1
mc1
HP
Te1
Te2
Tc1
Tc2
RH
PB
mc1
mc1
mg
HETgp
Tgi
mg
HETgp
Tgi
FIGURE 17: Schematic diagram of heating system 2
T1
mc1
TV 10°C
50°CmTV
TTVs
TTVr
TRHrmm mb
mg
HETgp
Tgi
SM
TSM2
mSM
HE
TSM1
SM
T3
RH
mm''
mRHTRHs
RH
PB
T4
T2T1
mc1
T1
mc1
TV 10°C
50°CmTV
TTVs
TTVr
TRHrmm mbmm mbmb
mg
HETgp
Tgi
mg
HETgp
Tgi
mg
HETgp
Tgi
SM
TSM2
mSM
HE
TSM1
SM
SM
TSM2
mSM
HE
TSM1
SM
T3
RH
mm''
mRHTRHs
RH
PB
T4
RH
mm''
mRHmRHTRHs
RH
PB
T4
T2
FIGURE 18: Schematic diagram of heating system 3
temperature. For regulation temperature needed before receivers, during melting and especially idlingtime, quantitative regulation was used. Additional water mass flow was sent through a bypass mn. Thissystem is without a gas boiler.
To compare how the heat pump works in each of the different radiator parameter scenarios (65/50, 65/40,65/35/C), four calculation variants A, B, C, D and Tg = 40/C were considered. Explanation of those is asfollows:
A. Water mass flow mc1 is constant; the outlet temperature of an upper heat source substance outsidethe heat pump unit, Tc1 is equal to 65/C.
B. Water mass flow mc1 is constant; outlet temperature of an upper heat source substance outside theheat pump unit Tc1 is equal to 65/C when outdoor temperature tout varies between -16 and 3/C; whentout varies between 4 and 12/C, Tc1 = 55/C.
C. Water mass flow mc1 is variable; temperature Tc1 is equal to 65/C when outdoor temperature toutvaries between -16 and 3/C; when tout varies between 4 and 12/C, Tc1 = 55/C.
D. Water mass flow mc1 is variable; temperature Tc1 equals 65/C.
7.6 System 2
Figure 17 shows heating system2, where the evaporator islocated on the heating systemreturn main. Heat is extractedfrom the return fluid. Thisreduces the return temperature tothe heat exchanger, andincreases the geothermal heat.In the indirect evaporatorarrangement, the heat pump andthe heat exchanger influenceeach other. The extra heat, which is transferred due to the cooling action of the heat pump, is proportionalto but less than the amount of heat absorbed by the evaporator (Harrison et al., 1990).
Calculations similar to system 1 were performed for different radiator parameter scenarios (65/50, 65/40,65/35/C), but only for variants A and D and Tg = 40/C. Extra calculations were also made for Tg = 60/Cand Tg = 40/C for system 2 and radiator parameters 90/70/C with a gas boiler as an additional heat source,variants named E and F. Explanations of variants E and F are as follows:
E. Water mass flow mc1 is constant; temperature Tc1 equals 70/C;F. Water mass flow mc1 is variable; temperature Tc1 equals 70/C.
7.7 System 3
Heating system 3, ofwhich the schematicdiagram is presented inFigure 18, consists of ag e o t h e r m a l h e a te x c h a n g e r a n d aconventional heat source,a gas boiler. This systemis without a heat pump.Calculations for radiator

452Zwarycz Report 21
System 1, Tgp=40°C
2980
1938
2980
1938
2980
1938
376
279
376
279
376
279
0
500
1000
1500
2000
2500
3000
3500
4000
melting idling melting idling melting idling
65/50°C 65/40°C 65/35°C
MW
h
Heat Pump Energy WGeothermal Energy Qg
FIGURE 19: Geothermal and electrical energy utilizationfor different radiator parameters in system 1;
melting and idling time
System 1, melting, Tgp=40°C
2.0
2.5
3.0
3.5
4.0
4.5
A B C Dvariant
aver
age
CO
P
COP 65/50°CCOP 65/40°CCOP 65/35°C
FIGURE 20: Average COP as a function ofradiator parameters and calculation variants
A, B, C, D
System 1, melting, 65/50°C, variant B
0
200
400
600
800
1000
1200
1400
0 2000 4000 6000 8000 10000
time [h]
kW
Total demand Qc Geothermal heat flux QgElectrical power W
FIGURE 21: Total demand, geothermal heatflux and electricity power as a function of time
for system 1; melting time
parameter scenarios (65/50, 65/40, 65/35/C) and Tg = 40/C were made. Because the return watertemperature from the users was in few cases higher than the supply geothermal water, it was necessary toreduce geothermal water mass flow due to Equation 15 and use the bypasses mm and mb.
8. CALCULATED RESULTS
The results of thermal and fluid flowcalculations for each of the heatingsystems described earlier are summarizedin Appendix II. There, the results arepresented in the form of tables showinghow the heat supply is divided betweengeothermal energy Qg, electrical energy W,gas energy Qpb and total energy.Moreover, the relevant diagrams havebeen plotted, and they are presented here.
Figure 19 shows the consumption ofgeothermal and electrical energy obtainedfor different radiator parameters in System1. For each set of radiator parameters, twodifferent variants concerning the snow melting system have been calculated, one assuming meltingconditions in the whole snow melting period and the other assuming idling conditions in the same period.The diagram shows that the same amount of geothermal energy and electrical power is needed regardlessof the radiator parameters. This is because of the constant supply temperature, 65/C, to all users.
Analysis of average heat pump COP-value for each of the calculation variants A, B, C and D (describedin Chapter 7) indicate that variant B for 65/50/C radiator parameters is the best (Figure 20). That particularcase is presented in Figure 21.
Figure 22 shows the consumption of geothermal and electrical energy obtained for different radiatorparameters in System 2. The calculation variants A and D are shown separately. Regarding snow melting,only the case with melting conditions in the whole snow melting period is considered. Note that variantD is preferable for both 65/50 and 65/40/C radiator supply / return temperatures, because of lowerelectricity input.

453Report 21 Zwarycz
System 2, melting, Tgp=40°C
2325 2403 2238 2284 2420 2318
936 1038107111189521030
0
500
1000
1500
2000
2500
3000
3500
4000
A D A D A D
melting melting melting melting melting melting65/50°C 65/40°C 65/35°C
MW
h
Heat Pump Energy W
Geothermal Energy Qg
FIGURE 22: Geothermal and electrical energy utilizationfor different radiator parameters in System 2; melting time
System 2, idling, 65/35°C, variant A
0
200
400
600
800
1000
1200
1400
0 2000 4000 6000 8000 10000
time [h]
kW
Total demand QcGeothermal heat flux QgElecrtical power W
FIGURE 23: Total power demand, geothermalheat flux and electrical power as a function
of time for System 2; idling timeSystem 2, melting, 90/70°C
2977 30652094
1224 1232
269431
2085
3838
3838
341 253
162
0
500
1000
1500
2000
2500
3000
3500
4000
E F E F
Tgp=60°C Tgp=40°C Tgp=60°C Tgp=40°C
heating season rest of year
MW
h
Heat Pump Inlet Energy WGas Boiler Energy QpbGeothermal Energy Qg
FIGURE 24: Utilization of geothermal, gas and electrical energyfor the radiator parameters 90/70/C in System 2, the temperature
of the geothermal water is 40 or 60/C; melting time
The d i ag ram a l sodemonstrates that forvariant A (constant Tc1and mc1), the best radiatortemperatures are 65/35/Cwith the highest geo-thermal water utilizationand lowest electricityinput for the heat pump.That particular example ispresented in Figure 23,assuming idling condi-tions in the whole snowmelting period.
F i g u r e 2 4 s h o w scalculated energy con-sumption in System 2when the radiator supply/return water temperaturesare 90/70/C as commonly used in Poland, i.e. higherthan in previous cases. This is obtained by using anadditional gas boiler as a heat source. Geothermalwater temperatures were Tg max = 40 and 60/C. Inthis example the condenser outlet water temperatureis 70/C. The share of geothermal energy is, ofcourse, much higher when the water is at 60/C thanwhen it is 40/C. The figure shows also that whenthe water temperature is 60/C, the highestgeothermal utilization is obtained in case F withvariable water mass flow mc1 when air temperatureincreases above 4/C (end of operation for the snowmelting system).
Figure 25 shows the totalpower demand, geother-mal heat flux, gas boilerheat flux and electricalpower as a function oft i m e f o r r a d i a t o rparameters 90/70/C inSystem 2. The tempera-ture of the geothermalwater is 60/C and meltingconditions are assumed inthe whole snow meltingperiod.
Figure 26 shows theconsumption of geo-thermal energy and energyfrom the gas boiler inSystem 3. In this case noheat pump is used. The

454Zwarycz Report 21
System 2, melting, Tgp=60°C, 90/70°C
0
200
400
600
800
1000
1200
1400
0 2000 4000 6000 8000 10000time [h]
kW
Total demand QcGeothermal heat flux QgGas boiler heat flux QpbElectrical power W
FIGURE 25: Total power demand, geothermal heatflux, gas boiler heat flux and electrical power as afunction of time for radiator parameters 90/70/C inSystem 2, temperature of geothermal water is 60/C;
melting time
System 3, melting, Tgp=40°C
195 218 235 251 255 267 215
3161 3138 3121 3105 3101 3089
215
0
500
1000
1500
2000
2500
3000
3500
4000
65/50°C 65/50°C 65/40°C 65/40°C 65/35°C 65/35°C
const const const
heating season rest of year
MW
h
Gas Boiler Energy Qpb
Geothermal Energy Qg
FIGURE 26: Geothermal and gas boiler energy utilization for differentradiator parameters in System 3; melting time
Geothermal heat flux QgTgp=40°C, melting, 65/40°C
0
200
400
600
800
1000
1200
1400
0 2000 4000 6000 8000 10000
time [h]
kW
Total demand QcSystem1System2System3System2 90/70°C
FIGURE 27: Geothermal heat flux as a functionof time, comparison for all systems; melting time
Electrical power WTgp=40°C, melting, 65/40°C
0
200
400
600
800
1000
1200
1400
0 2000 4000 6000 8000 10000
time [h]
kW
Total demand QcSystem1System2System2 90/70°C
FIGURE 28: Electrical power as a function oftime, comparison for all systems; melting time
figure shows that the amount of geothermalenergy utilized is greater when the supply watertemperature to the radiators is constant thanwhen it varies with the outdoor temperature.This is because the temperature of the returnwater is higher when the supply watertemperature varies with the outdoortemperature. In some cases, it is even higherthan the temperature of the geothermal water.In that case, the bypass mm was used for watercirculation. When the snow melting system isrunning under idling conditions and there is noneed for the boiler, the second bypass mb is alsoused.
The diagrams shown in Figures 27 and 28 weremade to compare System 1 and System 2 thathave different heat pump arrangements. Theradiator supply / return water temperatures65/40/C were chosen for this example. The
highest utilization ofgeothermal water isobserved in System 1, withthe direct heat pump. InSystem 2, with the indirectheat pump, the utilizationof the geothermal water islower. Similar results wereobtained for System 2 usingr a d i a t o r p a r a m e t e r s90/70/C. The difference inthe utilization of thegeothermal water in the twocases for System 2 is due tothe peak gas boiler thatonly supplies heat to theusers in the case of 90/70/Csupply / return watertemperatures.

455Report 21 Zwarycz
Total cost of energy $/yearmelting, Tgp=40°C, 65/40°C
0
20000
40000
60000
80000
100000
120000
140000
160000
SYSTEM 1 SYSTEM 2 SYSTEM 3 SYSTEM 2
90/70°C
$/ye
ar
Gas Boiler Energy Qpb
Heat Pump Electricity W
Geothermal Energy Qg
FIGURE 29: Running cost USD/year for heating systems, radiatorparameters 65/40/C, geothermal water temperature 40/C; idling time
Total cost of energy $/yearidling, Tgp=40°C, 65/40°C
0
20000
40000
60000
80000
100000
120000
140000
160000
SYSTEM 1 SYSTEM 2 SYSTEM 3 SYSTEM 2
90/70°C
$/ye
ar
Gas Boiler Energy Qpb
Heat Pump Electricity WGeothermal Energy Qg
FIGURE 30: Running cost USD/year for heating systems, radiator parameters 65/40/C, geohtermal water temperature 40/C; idling time
Because the amount of geothermal heat is connected to the electrical power of the heat pump, a similarutilization diagram was made for electrical power as a function of time (Figure 28). According to theliterature, heat pump performance for low temperatures of geothermal water (Tgp = 40/C) is better forSystem 1, i.e. when using a direct heat pump. This arrangement is usually used when the temperature ofthe supply water is low as only insignificant heat transfer would be obtained by simple heat exchangealone.
9. ECONOMICAL ASPECTS
In this chapter, calculations on the running costs for the heating systems 1, 2 and 3 are presented. The priceof electricity used in the calculations is 0.04 USD/kWh and the price used for natural gas is 0.14 USD/m3.The costs of subscription and delivery of energy (USD/year) are included in the total cost. The estimatedprice of geothermal energy is 0.252 USD/kWh.
The total cost of energy(USD/year) for allsystems and radiatorparameters 65/40/C for asnow melting systemunder melting conditionsis presented in Figure 29and in Figure 30 for snowmelting system underi d l i n g c o n d i t i o n s .Comparison of Systems 1and 2, that use differentheat pump arrangements,shows that System 1 haslower total cost per year.This difference is smallerwhen the snow meltingsystem is under idlingconditions. Comparisonof System 3 (gas boiler)with the other systems isalso shown in Figure 29.The worst case is System2 for radiator watertemperatures 90/70/C.Such h igh des igntemperatures, varyingwith outside temperature,are commonly used inPoland. The presentedcost results show that it ispreferable to use lowradiator supply and returnwater temperatures in heatpump-assisted geothermalheating systems.

456Zwarycz Report 21
Cost of energy unit $/kWh, Tgp=40°C, 65/40°C
0.030
0.0380.033
0.040
0.03030.0329 0.0329
0.0254
0
0.01
0.02
0.03
0.04
0.05
SYSTEM 1 SYSTEM 2 SYSTEM 3 SYSTEM 2
90/70°C
$/kW
h
meltingidling
FIGURE 31: Cost of energy unit USD/kWh for the heating systems,radiator parameters 65/40/C, geothermal water temperature 40/C;
melting and idling time
The cost of energy unit(USD/kWh) for allsystems and radiatorparameters 65/40/C ispresented in Figure 31.The diagram shows thatthe best solution is to useSystem 1. However, inthis case a very smalleconomic difference isfound between meltingand idling operations, asopposed to the situationfor System 2. The biggestd i f fe rence be tweenmelting and idlingoperations is in System 2for radiator watertemperatures 90/70/C. In
that case, a snow melting control system is important in order to decrease the melting time as much aspossible.
The economical calculations presented here are very approximate. It is necessary to remember the costsassociated with the production of the geothermal water. In the Polish Lowland, the share of geologicalwork and drilling operations ranges from 60 to 80% of the total cost of the construction of a geothermalpower plant, depending on the number and depth of the production and injection wells, and, hence, is amajor item on the investment list (Zapalowicz, at al., 2002). Important for economical appraisal is alsothe low consumption of extra energy sources in geothermal heat plants, compared with traditional sources.Finally, it must be remembered that each geothermal utilization project requires individual design and costcalculations.
10. CONCLUSIONS
• The project design calculations presented here are based on the utilization of geothermal energythrough a heat exchanger and a heat pump in different arrangements. The hot water produced isproposed to be used for radiator and tap water heating as well as for a snow melting system installedat the Goleniow airport in Poland. This scheme can reduce the annual running costs and also theemission of greenhouse gases from conventional fuel.
• The obvious benefits of a snow melting system are that it greatly reduces the need for snow removal,provides greater safety for pedestrians and vehicles, reduces the labour of slush removal and createsbetter working conditions at the airport.
• By limiting the maximum heat output of the snow melting system, the use of hot injection water isreduced. When there is snowfall, injection of hot water is needed. Heat output of a maximum 200W/m2 is acceptable and the operating cost is low, especially where snow detectors are used. It iscrucial to use solid control equipment. By using a computerised control system, it is easy to fulfil thedemand for effective snow melting, at low operating costs. With purposeful control and by using asnow detector, the quantity of hot water is expected to be reduced by half, as are the operating costs.Artificial melting of snow on pavements and roads is of great interest to the public. The use ofinexpensive geothermal hot water for snow melting is practical.
457Report 21 Zwarycz
• Heat pumps in geothermal schemes interact with the rest of the heating system in such a way that theirperformance must be analysed as part of the overall system. It is important to use temperature or watermass flow regulations in the system.
• For geothermal water temperatures lower than 40/C, the direct heat pump approach is mostadvantageous. On the other hand, when the geothermal water temperature is higher than 40/C, theindirect heat arrangement is preferable. In the presented heating system, based on the critical point40/C temperature of geothermal water, the direct heat pump approach (with an evaporator locateddirectly after the geothermal heat exchanger) is shown to be more efficient and economical than theindirect heat pump approach (evaporator located indirectly on the return network water).
• Utilization of an indirect heat pump approach, for low geothermal water temperature, gives totalenergy costs higher than in a direct heat pump arrangement. Using radiators with supply/return watertemperatures 90/70/C increases the cost of energy unit. Presented cost is one of the main reasons fordecreasing the design radiator supply and return water temperature in geothermal heating systems.
• Selection of low temperature radiator parameters depends not only on heating system efficiency andheat pump COP-values. Hydraulic calculations, taking into consideration pipe diameters withinsulation, amount of water flowing into the system, regulation solution and size of the circulatingpump, are also very important.
• In geothermal heating systems, it is necessary to be aware of high investment costs, mostly due todrilling, as well as low consumption of extra energy sources in geothermal heat plants compared totraditional plants. Each geothermal utilization project requires individual design and cost calculations.
• As an economical and efficient alternative to geothermal water as a heat source, it is possible to usea ground-source heat pump system with borehole heat exchangers. This is a simple device providinga closed circuit for the fluid to take heat from the ground and feed the evaporator, the cold side of theheat pump. The ground is an attractive heat source since its temperature remains near constantthroughout the year, except in Polish conditions for the uppermost 15-27 m (Plewa, 1994). A boreholeheat exchanger can be of a U-tube type, which is useful where soil moisture is adequate at shallowdepth, or a coaxial tube type, especially in the utilization of abandoned wells or deep boreholes.
ACKNOWLEDGEMENTS
I would like to thank Dr. Ingvar B. Fridleifsson and Mr. Lúdvík S. Georgsson for giving me theopportunity to participate in the UNU Geothermal Training Programme, and for guidance and advicethroughout the training period. I am very grateful to Dr. Árni Ragnarsson for advice and for guidance withmy report. I wish to give my thanks to Mrs. Gudrún Bjarnadóttir for help and care during the wholetraining period. Thanks to my friends, all the year 2002 UNU Fellows.
Special thanks to Prof. Wladyslaw Nowak from my university in Szczecin for giving me permission toparticipate in this training. Finally, thanks to Beata Kepinska for her advice and help.

458Zwarycz Report 21
NOMENCLATURE
Af = Free (uncovered) snow area (m2);Ar = Snow free area ratio;At = Total snow area (m2);a = Function used for outdoor temperatures duration COP = Coefficient of performance for heat pump;COPC = Coefficient of performance for a heat pump working with the Camot's circle;cg = Average specific heat of water (kJ/kgK);cp = Specific heat of snow (2090 J/kgK);c1 = 1000 mm/m x 3600 s/h = 3.6 x 10⁶ ;hf 0 = Heat of evaporation at the film temperature (kJ/kg);
= Water mass flow (kg/s);&mme1 = Water mass flow circulating between geothermal heat exchanger and evaporator (kg/s);mc1 = Water mass flow in system (kg/s);pav = Vapour pressure of moist air (kPa);
= Heat demand (kW);&Q)Qi = Heat demand for the elementary time interval )J (MWh);Q = Energy (MWh);Qin = Energy taken up by heat pump (MWh);Qout = Energy delivered by heat pump (MWh);q0 = Required slab heat output (W/m2);qe = Heat of evaporation (W/m2);qh = Heat transfer by convection and radiation (W/m2);qm = Heat of fusion (W/m2);qidling = Slab heat output for idling time (W/m2);qmelting = Slab heat output for melting time (W/m2);qs = Sensible heat transferred to snow (W/m2);
s = Rate of snowfall (mm water equivalent/h);T = Water temperature (/C);Te1 = Inlet temperature of evaporator (/C);Te2 = Outlet temperature of evaporator (/C);Tc1 = Outlet temperature of condenser (/C);Tc2 = Inlet temperature of condenser (/C);Tgp = Production well water temperature (/C);Tgi = Injection well water temperature (/C);Ti = Indoor temperature (/C); TSM1 = Snow melting supply temperature (/C);TSM2 = Snow melting return temperature (/C);T1 = Geothermal heat exchanger outlet water temperature (/C);T2 = Water temperature in system before users (/C);T3 = Water temperature in system after users (melting, idling) (/C);T4 = Water temperature in system after users (idling) (/C);)Tm = Logarithmic temperature difference (/C);)Tm0 = Logarithmic temperature difference at design conditions (/C);t = Outdoor temperature (/C);ta = Inlet temperature of a lower heat source substance into a heat pump unit (/C);tav = Water film temperature, 0.5 (/C);tb = Heat source substance's temperature drop in the lower heat source (/C);tc = Temperature difference between the refrigerant condensation temperature and the outlet upper
heat source substance's temperature (/C);td = Inlet temperature of an upper heat source substance into heat pump unit (/C);

459Report 21 Zwarycz
te = Temperature difference between the refrigerant evaporation temperature and the outlet lowerheat source substances' temperature (/C);
tf = Heat source substances' temperature growth in the upper heat source (/C);tm = Mean water temperature in snow melting system (/C);tout = Design outdoor temperature, -16/C;t1 = Evaporation temperature for refrigerant in heat pump (/C);t2 = Condensation temperature for refrigerant in heat pump (/C);U = Heat transfer coefficient (W/m2K);
= Volumetric flow rate (m3/h);&VV = Wind speed (km/h);
= Network water heat capacity (kJ/K);&WW = Heat pump electrical energy (MWh);W = Heat pump electrical power (kW);
Greek letters
P = Coefficient that compares a real heat pump COP to the ideal heat pump COPC working inCarnot's circle at the same working conditions;
Dg = Mean mass water density (kg/m3);D = Density of water equivalent of snow, 998 kg/m3;
J = Outdoor temperatures duration (h);
Subscripts
RH = Radiator heatingSM = Snow melting systemTV = Tap water and ventilationHE = Heat exchangerHP = Heat pumpPB = Peak boilerc = Totalb = Bypass b g = Geothermalm = Bypass m m'' = Bypass m'' s = Supplyr = Return
REFERENCES
Airport, 2002: International airport Szczecin-Goleniow, web page, http://www.airport.com.pl.
ASHRAE, 1995: Snow melting. In: Heating, ventilating and air conditioning applications. ASHRAEApplications Handbook 1995, 46.1-13.
Caddet, 2003: Geothermal and solar heat used to melt snow on roads. Caddet Renewable Energy Website,web page http://www.caddet-re.org/assets/no76.pdf .

460Zwarycz Report 21
Chapman, W.P., and Katunich, S., 1956: Heat requirements of snow melting systems. ASHRAETransactions, 62, 359.
EPM, 2002: Description of the climate of Poland. Environment Protection Ministry, web page,http://www.mos.gov.pl/soe/2a.htm.
Fjarhitun, 1982: Designing of a snow melting system. Fjarhitun Eng., Reykjavik, report 013 (in Icelandic),5 pp.
Goleniow, 2002: Welcome to Goleniow. Main web page of Goleniow city, http://www.goleniow.pl/.
Harrison, R., Mortimer, N.D., and Smárason, Ó.B., 1990: Geothermal heating: A handbook of engineeringeconomics. Pergamon Press, Oxford, 558 pp.
Lund, J.W., 1999: Geothermal snow melting. In: Popovski, K., Lund, J.W., Gibson, D.J., and Boyd, T.L.(editors), Direct utilization of geothermal energy. Geo-Heat Center, Oregon Institute of Technology, Or,93-98.
Meyer, Z., and Kozlowski, J., 1995: Pyrzyce - first geothermal heating system in Poland. Proceedingsof the World Geothermal Congress 1995, Florence, Italy, 3, 2269-2272.
Morita, K., and Tago, M., 2000: Operational characteristics of the Gaia snow-melting system in Ninohe,Iwate, Japan. Geo-Heat Center, Quart. Bull., 21-4, 5-11.
Piatti, A., Piemonte, C., and Szegö, E., 1992: Planning of geothermal district heating systems. KluwerAcademic Publishers, Dordrecht, 308 pp.
Plewa, S., 1994: Distribution of geothermal parameters on the territory of Poland (in Polish).Wydawnictwo CPPGSMiE PAN, Krakow, 138 pp.
Ragnarsson, R., 1997: Snow melting - safer cities. Cold Climate HVAC 1997, international conference,Reykjavík, 9 pp.
Rubik, M., 1996: Heat pumps - handbook. BOINTiE "Instal" (in Polish), Warsaw, 121 pp.
Soko»owski, J., 1993: Polish geothermal resources and their potential utilization in aid of environmentalprotection. Technika Poszukiwa½ Geologicznych,Geosynoptyka i Geotermia, 5-6, (in Polish).
US Department of Commerce, 2002: Showcase Europe, Airport development opportunities. Web page,http://www.sce.doc.gov/documents/market_briefs/aerospace/pdf/Poland-IMI-AirDevelop.pdf.
Valdimarsson, P., 1993: Modelling of geothermal district heating systems. University of Iceland, Ph.D.thesis, 315 pp.
Wright, M.P., 1999: Geothermal heat-pump systems. UNU G.T.P., Iceland, unpublished lectures.
Zapa»owicz, Z., Nowak, W., and Stachel, A., 2002: Condition and perspectives of utilization of geothermalenergy in Poland. 4th International Scientific Conference: Effective Production, Transmission andConsumption of Energy, Kosice, Slovakia, 191-198.
Zwarycz, K., 2000: The effect of thermal power of the heat receivers connected in series to the distributionnetwork upon the geothermal heat plant operation. Technical University of Szczecin, Department of HeatEngineering, Szczecin, M.Sc. thesis (in Polish), 201 pp.

461Report 21 Zwarycz
APPENDIX I: Heat demand values for radiator heating, tap water / ventilation andsnow melting systems, with time occurrences for different outdoor temperatures
Hea
ting s
easo
nTa
p w
ater
-ven
tilat
ion
syst
em ru
ns R
adia
tor h
eatin
g sy
stem
runs
S
now
mel
ting
syst
em ru
ns
Melting Idlingtout
[°C]t
[h]Dt[h]
Functiona
QTV[kW]
QRH[kW]
QSM[kW]
QC [kW]
QRH[kW]
QSM[kW]
QC [kW]
-16 0 0 0 135 135 1000 1270 135 500 770-15 21.16 21.16 16.6 135 131 1000 1266 131 500 766-14 42.32 21.16 33.2 135 128 1000 1263 128 500 763-13 63.48 21.16 49.8 135 124 1000 1259 124 500 759-12 84.64 21.16 66.4 135 120 1000 1255 120 500 755-11 126.45 41.81 99.2 135 116 1000 1251 116 500 751-10 168.77 42.32 132.4 135 113 1000 1248 113 500 748-9 232.25 63.48 182.2 135 109 1000 1244 109 500 744-8 295.1 62.84 231.5 135 105 1000 1240 105 500 740-7 337.42 42.32 264.7 135 101 1000 1236 101 500 736-6 379.49 42.07 297.7 135 98 1000 1233 98 500 733-5 442.71 63.23 347.3 135 94 1000 1229 94 500 729-4 506.19 63.48 397.1 135 90 1000 1225 90 500 725-3 674.84 168.65 529.4 135 86 1000 1221 86 500 721-2 843.61 168.77 661.8 135 83 1000 1218 83 500 718-1 1096.9 253.29 860.5 135 79 1000 1214 79 500 7140 1349.7 252.78 1058.8 135 75 1000 1210 75 500 7101 1729.6 379.87 1356.8 135 71 1000 1206 71 500 7062 2109.2 379.61 1654.6 135 68 1000 1203 68 500 7033 2446.6 337.42 1919.3 135 64 1000 1199 64 500 6994 2784 337.42 2184 135 60 0 195 60 0 1955 3121.4 337.42 2448.7 135 56 0 191 56 0 1916 3458.8 337.42 2713.4 135 53 0 188 53 0 1887 3838.6 379.74 3011.3 135 49 0 184 49 0 1848 4218.3 379.74 3309.2 135 45 0 180 45 0 1809 4554.9 336.53 3573.2 135 41 0 176 41 0 176
10 4893.2 338.31 3838.6 135 38 0 173 38 0 17311 5230.6 337.42 4103.3 135 34 0 169 34 0 16912 5568 337.42 4368 135 30 0 165 30 0 165
Res
t of y
ear
tout [°C] t [h] Dt [h] QTV [kW] QC [kW]
> 12 8760 3192 135 135

462Zwarycz Report 21
APPENDIX II: Summary of the calculation results for System 1, System 2 and System 3
TABLE 1: System 1
Radiatorparameters
[°C]
Heating season [MWh] The rest of year [MWh]Melting Idling
Qg Qin Qout W Qc Qg Qin Qout W Qc Qg Qin Qout W Qc
65/50A 2980 2980 3356 376 3356 1938 1938 2217 279 2217 365 365 431 66 431B 2980 2980 3356 376 3356 1938 1938 2217 279 2217 365 365 431 66 431C 2980 2980 3356 376 3356 1938 1938 2217 279 2217 365 365 431 66 431D 2980 2980 3356 376 3356 1938 1938 2217 279 2217 365 365 431 66 431
65/50constA 2980 2980 3356 376 3356 1938 1938 2217 279 2217 365 365 431 66 431B 2980 2980 3356 376 3356 1938 1938 2217 279 2217 365 365 431 66 431C 2980 2980 3356 376 3356 1938 1938 2217 279 2217 365 365 431 66 431D 2980 2980 3356 376 3356 1938 1938 2217 279 2217 365 365 431 66 431
65/40A 2980 2980 3356 376 3356 1938 1938 2217 279 2217 365 365 431 66 431B 2980 2980 3356 376 3356 1938 1938 2217 279 2217 365 365 431 66 431C 2980 2980 3356 376 3356 1938 1938 2217 279 2217 365 365 431 66 431D 2980 2980 3356 376 3356 1938 1938 2217 279 2217 365 365 431 66 431
65/40constA 2980 2980 3356 376 3356 1938 1938 2217 279 2217 365 365 431 66 431B 2980 2980 3356 376 3356 1938 1938 2217 279 2217 365 365 431 66 431C 2980 2980 3356 376 3356 1938 1938 2217 279 2217 365 365 431 66 431D 2980 2980 3356 376 3356 1938 1938 2217 279 2217 365 365 431 66 431
65/35A 2980 2980 3356 376 3356 1938 1938 2217 279 2217 365 365 431 66 431B 2980 2980 3356 376 3356 1938 1938 2217 279 2217 365 365 431 66 431C 2980 2980 3356 376 3356 1938 1938 2217 279 2217 365 365 431 66 431D 2980 2980 3356 376 3356 1938 1938 2217 279 2217 365 365 431 66 431
65/35constA 2980 2980 3356 376 3356 1938 1938 2217 279 2217 365 365 431 66 431B 2980 2980 3356 376 3356 1938 1938 2217 279 2217 365 365 431 66 431C 2980 2980 3356 376 3356 1938 1938 2217 279 2217 365 365 431 66 431D 2980 2980 3356 376 3356 1938 1938 2217 279 2217 365 365 431 66 431
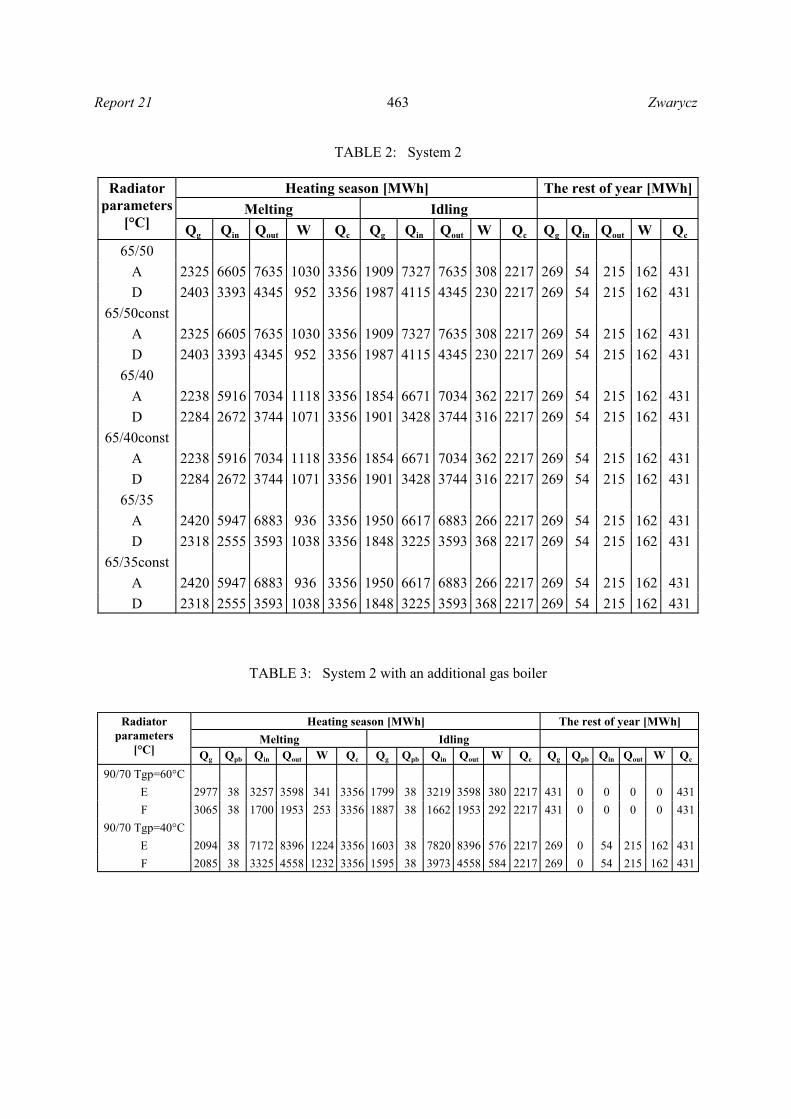
463Report 21 Zwarycz
TABLE 2: System 2
Radiatorparameters
[°C]
Heating season [MWh] The rest of year [MWh]Melting Idling
Qg Qin Qout W Qc Qg Qin Qout W Qc Qg Qin Qout W Qc
65/50A 2325 6605 7635 1030 3356 1909 7327 7635 308 2217 269 54 215 162 431D 2403 3393 4345 952 3356 1987 4115 4345 230 2217 269 54 215 162 431
65/50constA 2325 6605 7635 1030 3356 1909 7327 7635 308 2217 269 54 215 162 431D 2403 3393 4345 952 3356 1987 4115 4345 230 2217 269 54 215 162 431
65/40A 2238 5916 7034 1118 3356 1854 6671 7034 362 2217 269 54 215 162 431D 2284 2672 3744 1071 3356 1901 3428 3744 316 2217 269 54 215 162 431
65/40constA 2238 5916 7034 1118 3356 1854 6671 7034 362 2217 269 54 215 162 431D 2284 2672 3744 1071 3356 1901 3428 3744 316 2217 269 54 215 162 431
65/35A 2420 5947 6883 936 3356 1950 6617 6883 266 2217 269 54 215 162 431D 2318 2555 3593 1038 3356 1848 3225 3593 368 2217 269 54 215 162 431
65/35constA 2420 5947 6883 936 3356 1950 6617 6883 266 2217 269 54 215 162 431D 2318 2555 3593 1038 3356 1848 3225 3593 368 2217 269 54 215 162 431
TABLE 3: System 2 with an additional gas boiler
Radiatorparameters
[°C]
Heating season [MWh] The rest of year [MWh]Melting Idling
Qg Qpb Qin Qout W Qc Qg Qpb Qin Qout W Qc Qg Qpb Qin Qout W Qc
90/70 Tgp=60°CE 2977 38 3257 3598 341 3356 1799 38 3219 3598 380 2217 431 0 0 0 0 431F 3065 38 1700 1953 253 3356 1887 38 1662 1953 292 2217 431 0 0 0 0 431
90/70 Tgp=40°CE 2094 38 7172 8396 1224 3356 1603 38 7820 8396 576 2217 269 0 54 215 162 431F 2085 38 3325 4558 1232 3356 1595 38 3973 4558 584 2217 269 0 54 215 162 431

464Zwarycz Report 21
TABLE 4: System 3
Radiatorparameters
[°C]
Heating season [MWh] The rest of year [MWh]Melting Idling
Qg Qpb Qc Qg Qpb Qc Qg Qpb Qc
65/50 195 3161 3356 195 2022 2217 215 215 43165/50 const 218 3138 3356 218 1999 2217 215 215 431
65/40 235 3121 3356 235 1982 2217 215 215 43165/40 const 251 3105 3356 251 1966 2217 215 215 431
65/35 255 3101 3356 255 1962 2217 215 215 43165/30 const 267 3089 3356 267 1950 2217 215 215 431