sni group consolidated financial statements for … group consolidated financial statements for the...
TRANSCRIPT
SNI GROUP Consolidated financial statements for the year
ended 31 December 2016
This is a free translation into English of the consolidated financial statements of SNI Group prepared in the French language and is provided
solely for the convenience of English-speaking readers.
The translation reflects the most recent developments in IFRSs.
These consolidated financial statements and the notes thereto should be read in conjunction with, and construed in accordance with French law
and professional accounting standards applicable in France.
SNI Group - Société Nationale Immobilière 100-104 avenue de France - 75646 Paris Cedex 13 - France Tel.: (33) (1) 55 03 30 00 - Fax : (33) (1) 55 03 30 46 - www.groupesni.fr A French Société Anonyme d’Economie Mixte à Directoire (semi-public limited company with a Management Board) with share capital of €493,449,600 Registered in the Paris Trade and Companies Register (RCS) 470801 168
2 I SNI GROUP I Consolidated financial statements for the year ended 31 December 2016
CONTENTS
CONSOLIDATED INCOME STATEMENT ............................................................................................. 4
CONSOLIDATED BALANCE SHEET ..................................................................................................... 5
CONSOLIDATED STATEMENT OF CASH FLOWS ............................................................................. 6
CONSOLIDATED STATEMENT OF CHANGES IN EQUITY ................................................................... 7
NOTES TO THE CONSOLIDATED FINANCIAL STATEMENTS ............................................................. 8
1. Basis of preparation of the consolidated financial statements ..................................................... 8
1.1 Presentation of the balance sheet ................................................................................................................... 8 1.2 Presentation of the income statement ............................................................................................................. 8
2. Significant events .............................................................................................................................. 9
3. Accounting policies ......................................................................................................................... 11
3.1 Accounting standards ...................................................................................................................................... 11 3.2 Consolidation methods .................................................................................................................................... 12 3.3 Scope of consolidation .................................................................................................................................... 12 3.4 Consolidation adjustments and intercompany transactions ....................................................................... 12 3.5 Business combinations (Revised IFRS 3)) .................................................................................................... 12 3.6 Segment reporting (IFRS 8) ............................................................................................................................. 13 3.7 Fair Value Measurement (IFRS 13) ................................................................................................................. 13
4. Accounting policies - measurement ............................................................................................... 14
4.1 Intangible assets .............................................................................................................................................. 14 4.2 Owner-occupied property and equipment .................................................................................................... 14 4.3 Investment property ........................................................................................................................................ 14 4.4 Asset measurement and impairment testing................................................................................................. 15 4.5 Leases ............................................................................................................................................................... 16 4.6 Administrative long leases .............................................................................................................................. 17 4.7 Treatment of government grants and subsidies ........................................................................................... 17 4.8 Borrowing costs ............................................................................................................................................... 17 4.9 Assets held for sale (IFRS 5) ........................................................................................................................... 17 4.10 Available-for-sale financial assets .................................................................................................................. 18 4.11 Other financial assets ...................................................................................................................................... 18 4.12 Inventories, building contracts and off-plan sales ....................................................................................... 18 4.13 Trade accounts receivable .............................................................................................................................. 19 4.14 Cash and cash equivalents ............................................................................................................................. 19 4.15 Provisions ......................................................................................................................................................... 19 4.16 Employee benefits ............................................................................................................................................ 19 4.17 Financial liabilities ............................................................................................................................................ 20 4.18 Derivative instruments and hedge accounting ............................................................................................ 20 4.19 Related party transactions (Revised IAS 24) ................................................................................................. 21 4.20 Revenue and operating income ...................................................................................................................... 21 4.21 Income taxes ..................................................................................................................................................... 22 4.22 Measurement basis – Assessment and use of estimates ............................................................................ 22
5. Financial and operational risk management .................................................................................. 23
5.1 Interest rate risk ................................................................................................................................................ 23 5.2 Liquidity risk ..................................................................................................................................................... 23 5.3 Counterparty risk .............................................................................................................................................. 24 5.4 Operational risk ................................................................................................................................................ 24
6. Notes to the consolidated financial statements ............................................................................ 25
6.1 Property and equipment and intangible assets ............................................................................................ 25 6.2 Available-for-sale financial assets .................................................................................................................. 26 6.3 Investments in associates ............................................................................................................................. 26 6.4 Other non-current financial assets and derivatives ..................................................................................... 26 6.5 Deferred tax assets .......................................................................................................................................... 27
3 I SNI GROUP I Consolidated financial statements for the year ended 31 December 2016
6.6 Inventories and work in progress ................................................................................................................. 27 6.7 Trade accounts receivable ............................................................................................................................. 27 6.8 Current tax assets ............................................................................................................................................ 27 6.9 Sundry receivables .......................................................................................................................................... 28 6.10 Other current financial assets and derivatives ........................................................................................... 28 6.11 Cash and cash equivalents ........................................................................................................................... 28 6.12 Assets held for sale ........................................................................................................................................ 28 6.13 Equity ................................................................................................................................................................ 29 6.14 Non-current and current provisions ............................................................................................................... 29 6.15 Non-current and current borrowings ............................................................................................................. 29 6.16 Other non-current financial liabilities and derivatives ................................................................................. 30 6.17 Trade accounts payable .................................................................................................................................. 32 6.18 Current tax liabilities ........................................................................................................................................ 32 6.19 Sundry payables .............................................................................................................................................. 32 6.20 Other operating income ................................................................................................................................. 33 6.21 Other operating expense ............................................................................................................................... 33 6.22 Cost of gross debt .......................................................................................................................................... 33 6.23 Income from cash and cash equivalents ..................................................................................................... 33 6.24 Income tax expense ......................................................................................................................................... 34 6.25 Share in net income from associates ........................................................................................................... 34
7. Other disclosures ............................................................................................................................ 34
7.1 Off-balance sheet commitments ................................................................................................................... 34 7.2 Disclosures concerning leases ....................................................................................................................... 35 7.3 Employee benefit obligations ........................................................................................................................ 36 7.4 Headcount ........................................................................................................................................................ 36 7.5 Statutory Auditors’ fees ................................................................................................................................... 37 7.6 Related party-transactions and senior executive compensation ................................................................ 37 7.7 Subsequent events ........................................................................................................................................... 38

4 I SNI GROUP I Consolidated financial statements for the year ended 31 December 2016
CONSOLIDATED INCOME STATEMENT
INCOME STATEMENT Notes 2016 2015
Gross rental income 523.4 510.0
Income from recoverable rental charges 75.0 71.6
Recoverable rental charges -82.5 -78.5
Net rental income 515.9 503.2
Income from property development 18.9 38.5
Cost of inventory -14.8 -32.6
Property development margin 4.1 5.9
Income from other activities 14.1 12.7
Purchases consumed -2.0 -1.5
Maintenance -53.9 -51.9
External services -55.6 -41.9
Taxes other than income taxes -46.0 -43.5
Personnel expenses, discretionary and non-discretionary profit-sharing -76.7 -70.2
Other operating income 6.20 19.9 12.5
Other operating expense 6.21 -19.9 -23.8
RECURRING OPERATING INCOME 299.9 301.6
Disposal gains on investment property 116.7 90.0
GROSS OPERATING INCOME 416.7 391.6
Depreciation and amortisation net of government grants and subsidies -154.6 -144.7
Net (additions to) reversals of provisions 0.4 0.3
Net disposal gains (losses) 0.0 0.0
OPERATING INCOME 262.4 247.2
Share in net income of associates 6.25 16.3 21.8
OPERATING INCOME AFTER SHARE IN NET INCOME OF ASSOCIATES
278.7 269.0
Cost of gross debt 6.22 -132.0 -130.6
Income from cash and cash equivalents 6.23 19.2 30.7
Change in fair value of derivatives 2.4 8.0
Cost of net debt -110.4 -91.9
PROFIT BEFORE TAX 168.3 177.1
Income tax expense 6.24 -50.0 -45.4
NET PROFIT 118.3 131.7
Non-controlling interests NET PROFIT ATTRIBUTABLE TO OWNERS 118.3 131.7
Earnings per share (€) € 23.97 € 26.70
Diluted earnings per share (€) € 23.97 € 26.70
Statement of comprehensive income Notes 2016 2015
Net income reported in the income statement 118.3 131.7
Items that may be reclassified subsequently to profit or loss
Available-for-sale financial assets
0.0
0.0
Cash flow hedges -19.0 63.2
Fair value adjustments recognised directly in equity -19.0 63.2
Instruments not qualifying for hedge accounting transferred to profit or loss 0.0 0.0
Tax on items that may be reclassified to profit or loss
Items that will not be reclassified subsequently to profit or loss
Actuarial gains and losses on employee benefits
5.9
-1.3
-23.4
-2.9
Tax on items that will not be reclassified to profit or loss 0.5 1.2
Total comprehensive income (loss) recognised in equity -13.9 38.1
o/w recycled to profit or loss 0.0 0.0
Total comprehensive income (loss) for the period 104.4 169.8
Attributable to non-controlling interests 0.0 0.0
Attributable to owners 104.4 169.8
5 I SNI GROUP I Consolidated financial statements for the year ended 31 December 2016
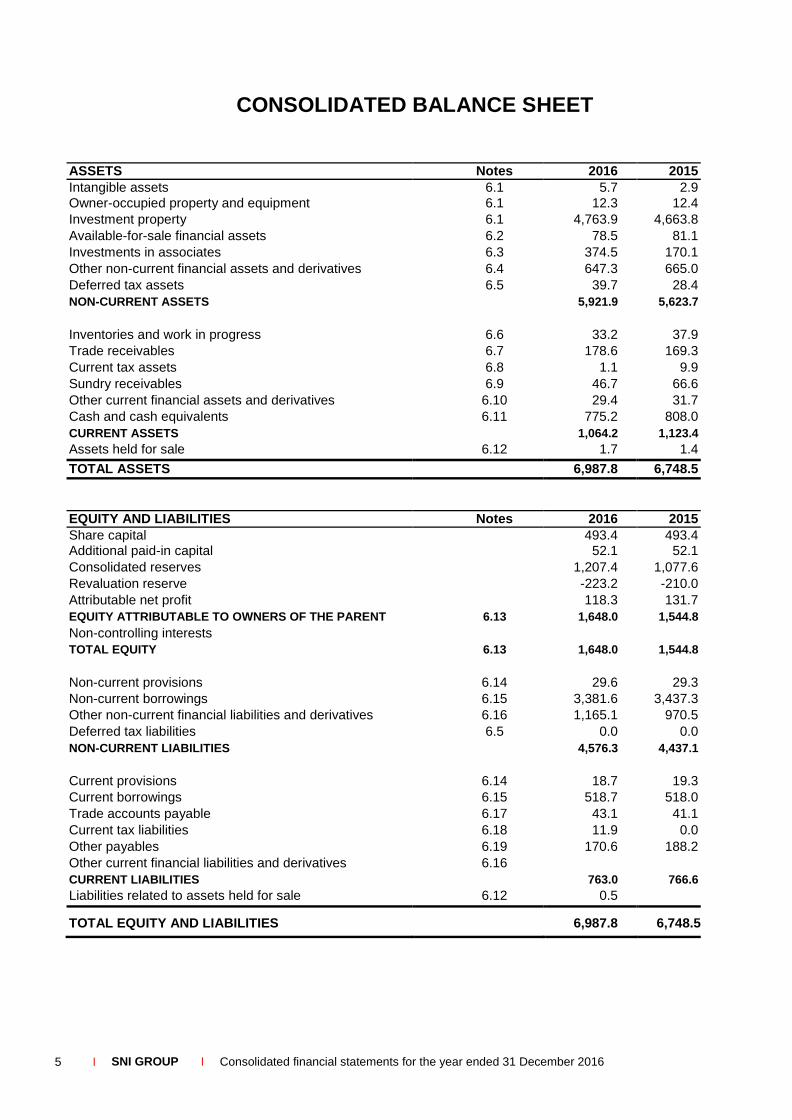
CONSOLIDATED BALANCE SHEET
ASSETS Notes 2016 2015
Intangible assets 6.1 5.7 2.9
Owner-occupied property and equipment 6.1 12.3 12.4
Investment property 6.1 4,763.9 4,663.8
Available-for-sale financial assets 6.2 78.5 81.1
Investments in associates 6.3 374.5 170.1
Other non-current financial assets and derivatives 6.4 647.3 665.0
Deferred tax assets 6.5 39.7 28.4
NON-CURRENT ASSETS 5,921.9 5,623.7
Inventories and work in progress 6.6 33.2 37.9
Trade receivables 6.7 178.6 169.3
Current tax assets 6.8 1.1 9.9
Sundry receivables 6.9 46.7 66.6
Other current financial assets and derivatives 6.10 29.4 31.7
Cash and cash equivalents 6.11 775.2 808.0
CURRENT ASSETS 1,064.2 1,123.4
Assets held for sale 6.12 1.7 1.4
TOTAL ASSETS 6,987.8 6,748.5
EQUITY AND LIABILITIES Notes 2016 2015
Share capital 493.4 493.4 Additional paid-in capital 52.1 52.1
Consolidated reserves 1,207.4 1,077.6
Revaluation reserve -223.2 -210.0
Attributable net profit 118.3 131.7
EQUITY ATTRIBUTABLE TO OWNERS OF THE PARENT
Non-controlling interests
6.13 1,648.0 1,544.8
TOTAL EQUITY 6.13 1,648.0 1,544.8
Non-current provisions 6.14 29.6 29.3
Non-current borrowings 6.15 3,381.6 3,437.3
Other non-current financial liabilities and derivatives 6.16 1,165.1 970.5
Deferred tax liabilities 6.5 0.0 0.0
NON-CURRENT LIABILITIES 4,576.3 4,437.1
Current provisions 6.14 18.7 19.3
Current borrowings 6.15 518.7 518.0
Trade accounts payable 6.17 43.1 41.1
Current tax liabilities 6.18 11.9 0.0
Other payables 6.19 170.6 188.2
Other current financial liabilities and derivatives 6.16 CURRENT LIABILITIES 763.0 766.6
Liabilities related to assets held for sale 6.12 0.5
TOTAL EQUITY AND LIABILITIES 6,987.8 6,748.5

6 I SNI GROUP I Consolidated financial statements for the year ended 31 December 2016
CONSOLIDATED STATEMENT OF CASH FLOWS 2016
2015
NET PROFIT FOR THE PERIOD 118.3 131.7
Net depreciation, amortisation and impairment expense 155.6 147.4 Impact of fair value adjustments 6.0 -8.2
Other non-cash income and expenses -2.9 0.1
Disposal gains or losses -122.2 -93.1
Interest income or expense on sales of consolidated investments Share in net income of associates (see 6.25) -16.3 -21.8
Dividends received -1.2 -2.0
Receivables written off and bad debts 2.4 4.4
Gross cash flow from operating activities after cost of debt and tax 139.8 158.6
Cost of net debt 112.1 102.2
Current and deferred tax expense (see 6.24) 50.0 45.4
Gross cash flow from operating activities before cost of debt and tax 301.9 306.3
Cost of debt net of interest income and expense -5.9 10.1
Net change in trade accounts receivable and payable -3.9 19.4
Employee benefit obligation 7.8 4.0
Tax expense (1) -34.1 -54.4
NET CASH FLOW GENERATED FROM OPERATING ACTIVITIES (a) 265.8 285.5
Expenditure on acquisitions of investment property -347.2 -452.6
Proceeds from disposals of investment property 198.9 131.6
Expenditure on acquisitions of equity investments -14.3 -55.5
Proceeds from disposals of equity investments 0.0 2.1
Impact of changes in scope of consolidation - Acquisitions 0.0 0.0
Impact of changes in scope of consolidation - Disposals 0.0 0.0
Proceeds and expenses related to disposals 0,0 0.0
Dividends received 1.5 2.0
Interest income received 17.1 10.7
Expenditure on/proceeds from other securities held for long-term investment 2.3 -2.0
Cash in or out for financial claims 19.8 22.4
NET CASH FLOW USED IN INVESTING ACTIVITIES (b) -121.9 -341.5
Share capital subscriptions received from shareholders 0.0 0.0 o/w paid up by the parent 0.0 0.0
o/w paid up by non-controlling interests New borrowings and debt 206.3 149.8
Repayment of borrowings and debt -202.5 -194.0
Change in other financial liabilities -0.4 -0.3
Gross interest paid -118.6 -123.2
Change in sundry receivables and payables 3.7 Dividends paid (2)
-20.0
NET CASH FLOW GENERATED USED IN FINANCING ACTIVITIES (c) -111.5 -187.8
Impact of changes in scope of consolidation - first-time consolidation of ADESTIA (d) 2.5 0.0
Change in cash and cash equivalents……………………… (I) = (a) + (b) + (c) + (d) 34.9 -243.8
Net cash and cash equivalents at start of year (A) 516.5 760.3
Net cash and cash equivalents at end of year (B) 551.4 516.5
Change in cash and cash equivalents (3) (II) = (B) - (A) 34.9 -243.8
(1) o/w cancellation of tax charge 0.0 0.0
(2) o/w dividends paid to the parent 0.0 0.0
(3) cash and cash equivalents are stated net of short-term bank loans and overdrafts (note 6.11)

7 I SNI GROUP I Consolidated financial statements for the year ended 31 December 2016
CONSOLIDATED STATEMENT OF CHANGES IN EQUITY
Number
of
shares
Share
capital Consolidated
reserves Equity
attributable to owners
Non-controlling interests
Total equity
(1) Recognition in equity of the effective portion of fair value adjustments to derivatives
(2) Impact of Regulation No. 2015-04 issued by France’s accounting standards setter (Autorité des Normes Comptables) applicable to social housing bodies.
At 31 December 2014 4,934,494 493.4 881.5 1,374.9 0.1 1,375.0
Fair value adjustments to derivatives (1)
39.8
39.8
39.8
Actuarial gains and losses on post-employment benefits -1.7 -1.7 -1.7
Fair value adjustments to available-for-sale financial assets 0.0
Total amount of adjustments recognised directly in reserves 38.1
38.1
38.1
Net profit for the year ended 31 December 2015 131.7 131.7 131.7
Total comprehensive income for the year ended 31 December 2015 169.8 169.8 169.8
Dividends paid - -0.1
Changes in scope of consolidation 0.0
Changes of accounting method 0.0
At 31 December 2015 4,934,494 493.4 1,051.3 1,544.7 0.0 1,544.7
Fair value adjustments to derivatives (1)
-13.1
-13.1
-13.1
Actuarial gains and losses on post-employment benefits -0.8 -0.8 -0.8
Fair value adjustments to available-for-sale financial assets 0.0
Total amount of adjustments recognised directly in reserves -13.9
-13.9
-13.9
Net profit for the year ended 31 December 2016 118.3 118.3 118.3
Total comprehensive income for the year ended 31 December 2016 104.4 104.4 104.4
Dividends paid 0.0
Changes in scope of consolidation 0.2 0.2 0.2
Other movements (2) -1.3 -1.3 -1.3
At 31 December 2016 4,934,494 493.4 1,154.6 1,648.0 0.0 1,648.0
8 I SNI GROUP I Consolidated financial statements for the year ended 31 December 2016
NOTES TO THE CONSOLIDATED FINANCIAL STATEMENTS
SNI SA is a French société anonyme d’économie mixte (semi-public limited company) with a Supervisory Board and a Management Board. It is 99.99% owned by Caisse des Dépôts et Consignations (CDC). SNI SA is registered in the Paris Trade and Companies Register (RCS) under no. 470 801 168 and its head office is located at 100-104 avenue de France-75646 Paris Cedex 13 – France.
The SNI Group is France's biggest social landlord and manages a portfolio of 300,000 units of housing. This includes nearly 86,000 units managed by its consolidated entities specialised principally in intermediate housing, and 185,000 units of social housing owned through a majority holding in the Group’s non-consolidated ESHs (social housing companies).
The consolidated financial statements cover the period from 1 January 2016 to 31 December 2016.
1. Basis of preparation of the consolidated financial statements
Unless indicated otherwise, all amounts are presented in millions of euros and rounded out to one decimal place. The Group does not carry out any transactions denominated in a foreign currency.
1.1 Presentation of the balance sheet
Items are broken out into their current and non-current portions.
Non-current assets have maturities of greater than 12 months and mainly comprise intangible assets, investment property, available-for-sale financial assets, investments accounted for by the equity method, other non-current financial assets and deferred tax assets.
Current assets comprise assets held for sale or for consumption in the course of the Group’s business cycle such as inventories and work in progress, trade accounts receivable and cash and cash equivalents.
Non-current liabilities include the portion of bank debt and other borrowings with maturities of greater than one year and deferred tax liabilities.
Current liabilities consist of all operating liabilities and the portion of debt that falls due within 12 months of the reporting date. Current liabilities also include bank overdrafts.
1.2 Presentation of the income statement
The income statement is presented by type of income or expense and broken down as follows:
Recurring operating income and Gross operating income
Recurring operating income comprises all income and expenses generated by the Group’s main cash-generating units (CGUs) and all of its other businesses before:
net disposal gains or losses on investment property (*), and net depreciation and amortisation expense and government grants related to investment property.
(*) amount net of the related marketing fees and work required.
The Group uses this indicator to calculate financial ratios and to analyse financial data (Recurring operating income/Revenue).
Gross operating income is equal to Recurring operating income plus net disposal gains or losses on investment property.

9 I SNI GROUP I Consolidated financial statements for the year ended 31 December 2016
Operating income
Operating income comprises all income and expenses generated by the Group’s main cash-generating units (CGUs) and all of its other businesses that are not related to investing or financing activities.
Operating income after share in net income from associates
In accordance with Recommendation 2013-01 issued by France’s accounting standards setter (Autorité des Normes Comptables) on 4 April 2013, “Share in net income of associates” is now presented as part of “Operating income”.
Cost of net debt
Cost of net debt comprises the sum of the following items for the reporting period:
Cost of gross debt, consisting of: all bank borrowings carried in liabilities (both the current and non-current portion, including short-term
bank loans and overdrafts); all other borrowings (current and non-current portion).
Income from cash and cash equivalents comprises interest income net of interest expense on investments in money market funds, dividends received, share in net income of associates, and net financial income (expense) from the Group’s cash pooling agreement. Cost of net debt is the sum of cost of gross debt, change in fair value of derivatives and income from cash and cash equivalents.
2. Significant events of the year
Intermediate housing
Intermediate housing operations gathered pace in 2016. Under the Finance Law of 2014, this type of housing is eligible for special tax treatment and will be a key focus of SNI's development over the next five years.
Two investment vehicles are involved in the intermediate housing stimulus plan being spearheaded by SNI: Fonds de Logement Intermédiaire (FLI), a private investor fund that is 19.14%-owned by SNI (directly
and indirectly), with an investment capacity of €1.7 billion, corresponding to nearly 10,000 new units of housing. FLI was launched in 2014. It is managed by Ampère Gestion – a wholly-owned subsidiary of SNI - which contracts asset and property management activities out to SNI.
Société de Logement Intermédiaire (SLI), a real estate investment fund (OPCI), managed on behalf of the French State with an investment capacity of €2.3 billion, i.e., approximately 13,000 units of housing. This fund was launched in 2015 and Ampère Gestion and SNI successfully tendered for the related fund and asset management activities. SNI was also retained to provide property management services following a competitive bidding process. In 2016, SNI successfully bid for four out of five tenders to provide rental and technical management services for five properties in the Paris region (156 units) and one in south-eastern France (22 units).
SNI will oversee the construction of 12,000 units of intermediate housing directly, representing a total investment €2.25 billion.
At end-2016, over 15,000 units of intermediate housing had been earmarked for development by the three investment vehicles and 5,176 Service Orders had been issued (including 3,352 in 2016: 931 by SNI and 2,421 by the investment funds).
10 I SNI GROUP I Consolidated financial statements for the year ended 31 December 2016
Property portfolio divestment programme
SNI and Sainte-Barbe continued to implement their asset disposal programmes and the volume of sales was similar to last year.
Activity outside of intermediate housing
Work began on nearly 1,800 units of housing, including more than 1,500 new family rental housing units delivered in 2016 (65% as part of the framework agreement signed with EDF).
Human Resources
Five employee-related agreements were signed during the year covering SNI GIE CAM (i.e., the structure representing employees of SNI and the Montpellier call centre). They dealt with the working week and marketing agreements. Group-wide agreements concerning employee savings schemes and individual mobility now also cover SNI GIE CAM.
Energy transition plan
In 2016, SNI signed a fourth partnership agreement with EDF to develop energy savings initiatives in its property portfolio through the use of Energy Saving Certificates. This extends the previous agreement whose target SNI reached in 2016 (set at the equivalent of 6 TWhc in energy savings since the 2014 agreement came into force) and the new agreement allows Energy Saving Certificates to be used for retrofits eligible under the national program that are completed before 31 December 2018. The Group is aiming to use this partnership to generate another 6 TWhc worth of Energy Saving Certificates, including at least 4.8 TWhc in special Energy Saving Certificates for distressed “energy-poor” households.
At the same time, SNI continued to systematically use two applications to analyse all of its projects: (i) SNI Environnement which assesses environmental impacts throughout the project life cycle based on three criteria (water savings, energy performance and health and safety) and; (ii) Etalement Urbain (i.e., urban sprawl), an application that can be used to limit the spatial encroachment of new Group developments or acquisitions.
In 2016, SNI signed a four-year agreement to provide project management consultancy services to CDC Biodiversité that focuses on moving towards pro-biodiversity, adapted management techniques for maintaining green spaces on its properties and encouraging programme developers to try to obtain eco-certification and labels. The Group also signed up to Nature 2015, a long-term initiative that encourages willing economic stakeholders to support projects that aim to preserve or reconstitute natural areas, ecological networks, forests and farmland.
Repurchase and rehousing guarantee programme
SNI has decided to extend existing social home ownership guarantees for new housing to all subsidised housing (older dwellings) as well as to non-subsidised older housing on a case-by-case basis in accordance with buyers' means if and when the guarantee is called upon. At end-2016, the amounts guaranteed, which totalled approximately €25 million and covered 218 dwellings, represented only a very
small proportion of sales and no buyer has sought to implement a guarantee.
Financing
SNI Group raised an additional €206 million of debt over the period, including €160 million in market debt (bonds) with an average maturity of 15 years.

11 I SNI GROUP I Consolidated financial statements for the year ended 31 December 2016
The average cash balance held by the Consolidated division during the period was €664 million and the average yield on cash balances came out at 2.67%. This performance was largely due to significant balances held in long-term deposits.
SNI's rating was reviewed by Fitch in July 2016 and confirmed at AA-, i.e., one notch below our shareholder and sponsor (CDC). This rating is a reflection of the increased control exercised by CDC as well as the financial strength of SNI.
3. Accounting policies
3.1 Accounting standards
In accordance with European directive 1606/2002/EC of 19 July 2002, the consolidated financial statements of SNI and its subsidiaries (“the Group) for 2016 have been prepared in accordance with the International Financial Reporting Standards adopted by the European Union before 31 December 2016. These standards may be consulted on the European Commission’s website at http://ec.europa.eu/finance/company-reporting/index_en.htm. International Accounting Standards include IFRSs (International Financial Reporting Standards) and IASs (International Accounting Standards) as well as the related interpretations (SICs and IFRICs).
The standards, amendments and interpretations applicable for the first time at 31 December 2016 are:
Amendments to IAS 1 - Disclosure initiative Amendments to IAS 16 and IAS 38 - Clarification of acceptable methods of depreciation and amortisation Amendments to IAS 19 - Employee contributions Amendments to IFRS 11 - Accounting for the acquisition of an interest in a joint operation Amendments to IAS 27 - Equity method in separate financial statements
Newly-adopted standards and improvements do not have a material impact on the consolidated financial statements.
The following standards, amendments and interpretations adopted but mandatory for subsequent periods, or awaiting adoption by the European Union, were not early adopted due to the non-material impact they are expected to have on the consolidated financial statements: IFRS 9 – Financial Instruments (applicable for reporting periods beginning on or after 1 January 2018):
Given the nature of the financial instruments held by SNI, the Group does not expect IFRS 9 to have a material impact on its accounts in terms of classification, measurement or the Group’s current hedging positions. The actual quantitative impacts of this new standard will be disclosed in the consolidated accounts at 31 December 2017.
IFRS 15 - Revenue from Contracts with Customers (applicable for reporting periods beginning on or after 1 January 2018): This new standard does not affect revenue generated from leases which constitute the bulk of the Group’s revenue. At present, the Group does not expect IFRS 15 to have a material impact on its current revenue recognition pattern. The actual quantitative impacts of this new standard will be disclosed in the consolidated accounts at 31 December 2017.
IFRS 16 - Leases (applicable for reporting periods beginning on or after 1 January 2019): Because the two definitions of leases under IAS 17 and IFRS 16 were very close, the number of agreements classified as leases in the Group’s accounts under IFRS should not change significantly. The actual quantitative impacts of this new standard will be disclosed in the consolidated accounts at 31 December 2018.
These consolidated financial statements were approved by the Management Board on 8 March 2017.

12 I SNI GROUP I Consolidated financial statements for the year ended 31 December 2016
3.2 Consolidation methods
All entities, over which the Group exercises exclusive control, either directly or indirectly, are fully consolidated. Entities over which the Group exercises significant influence and jointly-controlled companies are accounted for by the equity method.
3.3 Scope of consolidation
The Group’s scope of consolidation at 31 December 2016 comprises the following six entities:
2016 2015
Entity Legal
form
Consolidation
method % control % control
Société Nationale Immobilière (SNI) parent FULL - -
Sainte Barbe SAS subsidiary FULL 100% 100%
ADOMA SAEM subsidiary EQUITY 56.41% 56.31%
FLI subsidiary EQUITY 19.14% 19.14%
Ampere Gestion subsidiary FULL 100% 100%
Adestia (1) subsidiary FULL 100% FULL: fully consolidated / EQUITY: equity method / NC: Not consolidated
(1) Entity previously classified in Available-for-sale financial assets and now consolidated
Consolidation method used for ADOMA Despite SNI's majority stake in this entity, it is not deemed to exercise control within the meaning of IFRS 10. Instead, ADOMA is treated as a joint-venture within the meaning of Revised IAS 28.
Companies excluded from the scope of consolidation ESH social housing companies (Entreprise Sociale pour l’Habitat, formerly known as HLMs) are excluded from the scope of consolidation. Although Adestia is the strategic shareholder of these entities from a legal standpoint, its exposure to the earnings of the ESHs is severely constrained by the French building and housing code (Code de la construction et de l’habitation) (i.e., annual dividend entitlement is capped at the nominal amount of shares multiplied by the interest rate payable on Livret A passbook accounts plus a fixed margin; limit on the disposal price of shares; weak share capital base of these entities in terms of their total assets, etc.). Consequently, Adestia has a very limited ability to influence the earnings of these ESHs and its relative exposure in terms of their total earnings is non-material. Therefore, SNI does not control the ESHs and it recognises the related investments in “Available-for-sale financial assets”.
3.4 Consolidation adjustments and intercompany transactions
Accounting policies are applied throughout the Group in a consistent manner and all entities have a 31 December year-end.
Inter-company transactions and any disposal gains or losses between Group entities are eliminated in consolidation.
3.5 Business combinations (Revised IFRS 3)
The cost of the business combination corresponds to the fair value of the assets and liabilities contributed or equity instruments given in exchange for the acquiree. Goodwill is recognised in assets for the excess of the cost of the acquisition over the Group’s share in the net fair value of the acquiree's identifiable assets after adjusting for the impact of deferred taxation. Any negative goodwill is recognised directly in profit or loss.

13 I SNI GROUP I Consolidated financial statements for the year ended 31 December 2016
IFRS 3 does not apply to the acquisition of an asset or a group of assets that does not constitute a business. The cost of such a transaction will be allocated to individual identifiable assets and liabilities based on their fair values and will not give rise to the recognition of any goodwill.
3.6 Segment reporting (IFRS 8)
The Group only reports one operating segment for the following reasons: the vast majority of its activities are concentrated in a single business segment, i.e., the management
of property consisting primarily of housing used for rental purposes held in freehold or on a non-freehold basis, and a much smaller commercial property activity;
the Group’s entire property portfolio is located in France. This business segment is used for management reporting purposes and the chief operating decision maker is the Management Board.
3.7 Fair Value Measurement (IFRS 13)
The Group began applying IFRS 13 on 1 January 2013. This standard provides a single framework for measuring fair value based on the notion of disposal price. IFRS 13 defines fair value as the price that would be received to sell an asset or paid to transfer a liability in an orderly transaction between market participants at the measurement date.
It sets out the following three-level measurement hierarchy: Level 1 inputs (unadjusted quoted prices) are quoted prices in active markets for identical assets or
liabilities that the entity can access at the measurement date; Level 2 inputs are inputs other than quoted prices included within Level 1 that are observable for the
asset or liability, either directly or indirectly; Level 3 inputs are unobservable inputs for the asset or liability.
The fair value measurement hierarchy ranks measurement inputs in order of importance, it does not rank the measurement techniques actually used. In the event that inputs from different levels are used, the resulting fair value is classified at the same level as the lowest-ranked input used.
Investment property
Measurement at fair value must reflect the asset’s highest and best use. SNI has not identified any alternative use (in the event of reconversion of the asset, for example), that would result in a fair value that is greater than that measured according to the asset’s current use. Measuring buildings at their fair value requires the use of different measurement techniques (see section 4.4 Asset measurement) that use observable and unobservable inputs that have been subject to certain adjustments.
Consequently, the Group’s property portfolio is deemed to be measured based on Level 3-type inputs.
Financial instruments
IFRS 13 requires that counterparty credit risk and SNI’s own credit risk is factored into the measurement of financial assets and liabilities at fair value. Credit risk is based on Moody’s historical default rates applied to bad debt recovery rates.
In the measurement of derivative instruments, credit risk is deemed to be a component of the ineffective portion of effectiveness testing. The impact of recommended adjustments under IFRS 13 on the consolidated financial statements at 31 December was not material.
The measurement of derivatives based on the measurement hierarchy is disclosed in Note 6.16.7.

14 I SNI GROUP I Consolidated financial statements for the year ended 31 December 2016
4. Accounting policies - measurement
4.1 Intangible assets
An intangible asset is an identifiable non-monetary asset without physical substance, controlled by an entity as a result of past events from which future economic benefits are expected to flow to the entity. An intangible asset is identifiable when it is separable or arises from contractual or other legal rights.
Intangible assets with determinable useful lives are amortised using the straight-line method over the asset’s expected useful life.
These intangible assets, comprising leases on managed property, are amortised over the lease term.
4.2 Owner-occupied property and equipment
Owner-occupied property and equipment consists mainly of office improvements and furniture. They are measured at historical cost and depreciated over periods of between five and ten years using the straight-line method.
4.3 Investment property
Property held on a long-term basis and leased to third parties under operating leases and/or held for capital appreciation purposes is deemed to be investment property.
The Group has elected to measure investment properties using the cost model.
Investment property is property (land or buildings) held to earn rentals or for capital appreciation or both, rather than for use in the production or supply of goods or services or for administrative purposes, or for sale in the ordinary course of business.
This category includes buildings under construction or buildings being refitted for subsequent use as investment property as well as advances paid on such property.
In accordance with IAS 40, investment property is measured using the cost model, i.e., cost less accumulated depreciation and any accumulated impairment losses.
The cost of investment property includes: the purchase price as per the sale agreement or cost of construction, including non-refundable taxes,
less any trade or cash discounts; the cost of renovation work; any directly attributable expenditure required to prepare the property for rental in line with the use
intended by management. Directly attributable expenditure includes, for example, professional fees for legal services, property transfer taxes and other transaction costs;
the cost involved in bringing the property into line with safety and environmental regulations; capitalised borrowing costs (see Note 4.8).
The gross carrying amount is broken out into separate components, each with its own useful life.
15 I SNI GROUP I Consolidated financial statements for the year ended 31 December 2016
Each investment property is depreciated over its expected useful life using the straight-line method, with the exception of land which is not depreciated. These periods are as follows: new buildings and recent acquisitions: 40 years for the shell and between 15 and 25 years for the other
components; acquisitions of old property: 30 years for the shell and between 12 and 20 years for the other
components; renovation work: 15, 25 or 40 years, depending on the component.
In accordance with IAS 36, investment property is tested for impairment when recent events or changes in the market or internal sources of information indicate that the asset may be impaired.
4.4 Asset measurement and impairment testing
IAS 36 requires entities to test goodwill and finite-lived intangible assets for impairment at least once a year and to test other non-financial, non-current assets such as investment property if there is an indication that the assets may be impaired.
An indication of impairment may take the form of a significant decline in the assets’ market value and/or a significant change in the technological, economic or legal environment.
An impairment loss provision is recognised when the recoverable amount of an asset is less than its carrying amount.
Basis for determining impairment of intangible assets and other property and equipment
These assets are tested individually or with other groups of assets when they do not generate cash flows that are independent of the cash inflows of other assets or groups of assets.
If an indication of impairment no longer exists or diminishes and an asset’s recoverable amount once again exceeds its carrying amount, impairment previously recognised on property and equipment and intangible assets may be reversed.
Basis for determining impairment of investment property
The recoverable amount of investment property is the higher of its fair value less costs to sell and its value in use. Fair value is the net market value determined by expert valuations. Value in use is equal to the value of future income expected from these assets discounted to present value.
If an indication of impairment exists and the estimated recoverable amount is less than the carrying amount, an impairment loss is recognised for the difference. This will alter the asset’s depreciable basis and may change its depreciation schedule.
If an indication of impairment no longer exists or diminishes and an investment property’s recoverable amount once again exceeds its carrying amount, impairment previously recognised may be reversed. The carrying amount after the impairment reversal is capped at the amount net of accumulated depreciation that would have been determined had the impairment not been recognised previously.

16 I SNI GROUP I Consolidated financial statements for the year ended 31 December 2016
Measurement of housing portfolio
Every year, the Group’s investment property portfolio is subject to an external or in-house expert appraisal of its value: buildings with an estimated market value greater than €10 million, or buildings earmarked for a block
sale in 2017 are subject to an on-site appraisal by an external expert; every two years, a value opinion is issued for buildings with a market value of between €5 million and
€10 million; an in-house expert appraisal is performed on buildings with a market value of less than €5 million by
taking the median value generated by capitalising rents, market comparisons and discounting future cash flows to present value;
buildings that have been in service for less than three years are exempted from appraisal and measured at their carrying amount less any grants and subsidies received.
Basis for determining the fair value of buildings
Three methods are commonly used to appraise the fair value of property: comparisons based on data collected internally or by the French Chambre des notaires (or Callon); capitalisation of gross rents (or yield methods); discounting future cash flows from the property concerned to present value.
The fair value is also a function of the probable method of disposal and a block sale is used as the default assumption when appraising market values. For split sales, the comparison method is used after adjusting for financing arrangements and the discount applied to block sales. The other two methods listed above would appear most appropriate for block sales.
These methods are applied both for external appraisals and in-house valuations performed by the Group where the estimated market value is equal to the median value for the three methods. External appraisals are entrusted to the firm of Cushman&Wakefield which has signed up to the real estate appraisal charter drafted under the auspices of Institut Français de l’Expertise Immobilières (French institute of property appraisers). The estimated market value is generally equal to the average value under the three methods.
4.5 Leases
The Group uses leased assets and it leases out assets in the course of its business activities. These leases are analysed based on the situations and disclosures listed in IAS 17 to determine whether they are finance or operating leases.
A finance lease is a lease that transfers substantially all the risks and rewards incidental to ownership of an asset to the lessee. An operating lease is a lease other than a finance lease. The distinction is made at the inception of the lease.
As lessee – Finance leases
The asset is recognised in property and equipment with a matching entry in financial liabilities. It is measured at the lower of the fair value of the leased asset or the value of minimum lease payments discounted to present value. At inception of the lease, these agreements generally provide for balancing cash payments representing the fair value of the leased asset which extinguishes the related liability.
As lessee – Operating leases
Lease payments are expensed to profit or loss on a straight-line basis over the term of the lease.

17 I SNI GROUP I Consolidated financial statements for the year ended 31 December 2016
As lessor – Finance leases
The assets are recognised under “Other non-current financial assets” for the amount of the net investment in the lease. Financial income is based on a pattern reflecting a constant periodic rate of return on the lessor's net investment in the finance lease. Lease payments received for the period are allocated to gross investment in the lease, net of costs for services.
As lessor – Operating leases
The assets are carried in the lessor’s balance sheet according to the nature of the asset. Rental income is recognised on a straight-line basis over the fixed term of the lease along with any specific provisions or advantages (rent-free periods, step rents, lease rights, etc.).
4.6 Administrative long leases
The Group has acquired a property portfolio from the French State, public bodies and local and regional authorities on long leases with a maximum 99-year term. At inception of the lease, these agreements generally provide for balancing cash payments.
These operations and the balancing payments are analysed lease by lease in order to determine the most appropriate treatment under IFRS.
4.7 Treatment of government grants and subsidies
The Group accounts for subsidies and government grants received in the course of its business as follows: investment subsidies are deducted from the value of the related assets and taken to profit or loss
based on the depreciation schedule; subsidies received from institutions entitled to a reserved portion of an estate are recognised in rental
income and amortised over the term of the reservation agreement.
4.8 Borrowing costs
Borrowings costs directly attributable to the construction or production of a qualifying asset are included in the cost of that asset through completion of the work.
The amount of borrowing costs included in the value of an asset is determined as follows: when funds are borrowed to build a specific qualifying asset, the borrowing costs eligible for
capitalisation are the actual borrowing costs incurred during the period less any investment income on the temporary investment of those borrowings;
when funds are borrowed to build a number of qualifying assets, borrowing costs eligible for capitalisation are determined by applying a capitalisation rate to the expenditures on said assets. This capitalisation rate shall be the weighted average of the borrowing costs applicable to the borrowings of the entity that are outstanding during the period, other than borrowings made specifically for the purpose of obtaining the qualifying assets. The amount of borrowing costs capitalised during a period shall not exceed the amount of borrowing costs incurred during that period net of any investment income.
4.9 Assets held for sale (IFRS 5)
An asset (or disposal group) is classified in assets held for sale if: the asset (or disposal group) is available for immediate sale in its present condition subject only to
terms that are usual and customary for sales of such assets (or disposal groups); and its sale is highly probable within one year.
18 I SNI GROUP I Consolidated financial statements for the year ended 31 December 2016
In the Group’s case, block sales of property subject to a sale agreement at the reporting date are classified as assets held for sale.
The accounting treatment is as follows: the asset (or disposal group) available for sale is measured at the lower of its carrying amount and fair
value less costs to sell; the asset is no longer depreciated once it has been reclassified; liabilities related to the asset (or disposal group) classified as held for sale, are presented separately in
the balance sheet.
4.10 Available-for-sale financial assets
Available-for-sale financial assets are recognised at their fair value at the reporting date.
Unrealised gains and losses are recognised in revaluation reserve in Other Comprehensive Income until the assets are sold. However, if impairment testing indicates the existence of prolonged impairment and unrealised losses, the resulting impairment loss is recognised in profit or loss. Impairment losses on available-for-sale financial assets may only be reversed at the disposal date.
When there is objective evidence of impairment due to the occurrence of one or several events since the securities were acquired, available-for-sale financial assets are impaired on an individual basis.
In the case of the Group’s non-consolidated ESHs (social housing companies) owned by Adestia (see Note 3.3 Scope of consolidation), the investments are measured at fair value which is the best estimate of their nominal value in light of regulations stipulating the measurement of the disposal value in accordance with Article 423-4 of the French building and housing code (Code de la construction et de l’habitation) independently of the actual economic value of these entities.
4.11 Other financial assets
Other financial assets mainly comprise: mutual funds not classified as cash and cash equivalents and recognised at fair value; loans and advances to non-consolidated companies, loans, security deposits and guarantees, term
deposits, recognised at amortised cost; cash flow hedges recognised at fair value (see Note 6.4).
An impairment loss provision is recognised under unrealised losses if there is objective and measurable evidence of impairment related to an event that occurred after the loan was set up or the asset acquired.
4.12 Inventories, building contracts and off-plan sales
Buildings that are related to commercial property development or acquired with a view to being resold in the near term are recognised in inventories at cost. A provision for impairment loss is recognised if their expert appraisal value is less than their carrying amount.
The cost of building contracts and off-plan sales is equal to costs directly attributable to the contract plus borrowing costs through to completion of the work. Marketing fees are expensed directly. If it becomes probable that total project costs will exceed total revenue, the Group recognises a provision for loss on completion in profit or loss for the period.
Partial payments received for these contracts before completion of the corresponding work are recorded as prepayments in liabilities.
19 I SNI GROUP I Consolidated financial statements for the year ended 31 December 2016
4.13 Trade accounts receivable
Trade receivables are recognised for the initial amount of the invoice less any provisions for bad debts. Rent receivables for which receipts have been issued are systematically written down based on how long they are overdue and the situation of the tenants in question. Debtors are classified (i.e., current or former tenants/ordinary tenants/tenants in dispute) and assessed based on the related risk and provisions for doubtful receivables are adjusted on a case-by-case basis.
4.14 Cash and cash equivalents
Cash consists of cash at bank and demand deposits. Cash equivalents comprise money market funds and investments with maturities of less than three months, readily convertible into known amounts of cash and subject to an insignificant risk of changes in value, held to meet the Group’s short-term liquidity requirements. Cash and money market funds are disclosed at fair value.
Receivables from non-consolidated subsidiaries arising from the Group’s cash pooling agreement are disclosed at amortised cost.
4.15 Provisions
A provision is recognised when the Group has a present obligation to a third party arising from past events, the settlement of which is expected to result in an outflow from the entity of resources embodying economic benefits and whose amount may be measured with sufficient reliability. In the case of obligations with maturities of over one year, the provision is discounted to present value and the related impacts are recognised in financial income (expense).
All types of risks – especially operating and financial risks – are tracked on a regular basis to determine the amounts of the appropriate provisions.
4.16 Employee benefits
Pensions and length-of-service awards
Pensions and other post-employment benefits consist of retirement benefits and jubilees provided for in the French National Collective Bargaining Agreement for Real Estate companies and in Group-wide agreements.
Pension plans and other post-employment benefits treated as defined benefit plans (i.e., the Group guarantees to pay a defined amount or level of benefit) are recognised in liabilities based on an actuarial analysis of the Group’s benefit obligation at the reporting date, less the fair value of the related plan assets. Payments made under defined contribution plans (i.e., the Group’s obligation is limited to the amount of the contributions paid) are recognised as an expense in the current period.
The provision set aside in the consolidated accounts is calculated using the projected unit credit method and includes the related social charges. The benefit obligation is calculated based on the cost of service at the measurement date assuming unenforced retirement at between 63 and 65, depending on socio-professional category.
20 I SNI GROUP I Consolidated financial statements for the year ended 31 December 2016
Actuarial gains and losses reflect distortions between assumptions used and actual experience or changes in the assumptions used to calculate the benefit obligation and related plan assets, i.e.: employee turnover, rate of salary increase, discount rate, mortality tables, return on plan assets.
All actuarial gains and losses are recognised in equity in accordance with Revised IAS 19.
A provision is accrued for length-of-service awards over a given employee’s period of employment. It is determined for each employee grade based on the probability of employees actually reaching the required length of service and the provision is discounted to present value at the reporting date.
Profit sharing
The employee profit-sharing provision is calculated based on the Group's branch agreement currently in force.
4.17 Financial liabilities
After initial recognition, interest-bearing borrowings and other financial liabilities are remeasured at amortised cost using the effective interest rate of the loan. Arrangement fees and issuance costs impact the initial carrying amount and these are deferred over the loan term using the effective interest rate.
Interest-free long-term advances received from institutions entitled to a reserved portion of an estate and repayable over variable terms of up to 50 years have been remeasured at fair value using the average effective interest rate on borrowings.
Security deposits are considered current assets and are not discounted to present value.
Income from reservation agreements in consideration for fixed-term housing reservation rights granted to third parties is deferred over the term of the agreement and treated as either other non-current financial liabilities (non-current portion - maturing in over one year) or sundry payables (current portion – maturing in under one year).
4.18 Derivative instruments and hedge accounting
The Group uses derivative instruments to hedge its exposure to fluctuations in interest rates. The Group’s financial risk management policies together with the methods used to determine the fair values of derivative instruments are disclosed in Note 5 “Management of financial risk”.
Derivatives are recognised at their fair value and used to hedge variable-rate borrowings against interest rate risk (hedging of future cash flows). The Group uses hedge accounting when the contract complies with the requisite conditions in terms of documentation and hedge effectiveness (before the fact and retrospectively).
21 I SNI GROUP I Consolidated financial statements for the year ended 31 December 2016
If derivatives qualify for hedge accounting, changes in the fair value of the effective portion of the hedge are recognised directly in equity net of tax. The ineffective portion is recognised in profit or loss immediately during the period. Gains or losses accumulated in equity are recycled to the income statement (in the same heading as the hedged item) over the periods in which the hedged cash flows impact earnings.
If derivatives do not qualify for hedge accounting, changes in fair value are recognised directly in profit or loss for the period.
4.19 Related party transactions (Revised IAS 24)
As a 99.99%-owned subsidiary of Caisse des Dépôts et Consignations, the Group avails of the exemption from disclosure requirements in relation to transactions and related outstanding balances with government-related entities.
Transactions with related parties are disclosed in Note 7.6.
4.20 Revenue and operating income
Gross rental income (including financial rents)
Rental income generated by operating leases mainly comprises housing rental income as well as some office rental income. This revenue is recognised on a straight-line basis over the fixed term of the leases along with any specific provisions or advantages (rent-free periods, step rents, lease rights, etc.) without adjusting for inflation. The benchmark period is the first fixed lease term.
The framework management agreements signed with public or private third parties are analysed as follows on a case-by-case basis to ascertain whether they qualify as operating or finance leases under IAS 17: Operating lease revenue is recognised as described above. Finance lease revenue (SNI as lessor) is broken out into:
- the portion corresponding to the rendering of services (rental management, major upkeep and repairs, day-to-day operation, etc.), which is recognised under income from other activities in accordance with IAS 18; and
- the portion corresponding to repayment of the investment, which is broken down into repayment of principal and offset against the corresponding payable, and repayment of interest which is recognised in income from other activities.
Property development (building contracts and off-plan sales)
Income from property development is recognised on a percentage-of-completion basis. The portion recognised during the period corresponds to estimated final forecast revenue multiplied by the cumulative percentage of completion at the reporting date, less revenue recognised in prior periods for the operations already in construction at the beginning of the period. Only revenue for plots sold is recognised on a percentage-of-completion basis and the recognition period begins on the date on which the notarial act is signed.
22 I SNI GROUP I Consolidated financial statements for the year ended 31 December 2016
Income from other activities
Income from other activities essentially comprises the following: services rendered and resources provided to non-consolidated subsidiaries; services rendered under framework management agreements (see Note 4.20.1); the portion corresponding to repayment of a receivable under finance leases (see Note 4.20.1).
4.21 Income taxes
Income tax expense is recognised in profit or loss, except for tax on items recognised directly in equity.
The Group has not elected to file a consolidated tax return under French group relief rules.
Standard tax treatment
Current tax is determined based on tax rates applicable to Group entities and to operations not covered by the special tax treatment available to semi-public companies (SEMs).
Special tax treatment available to French semi-public companies (SEMs)
Pursuant to Article 207-1-4° of the French Tax Code, amended by Article 44-II and III of the Amending Finance Law of 2005, semi-public companies (Sociétés d’Economie Mixte) covered by Article L.481-1-1 of the French building and housing code (Code de la construction et de l’habitation) are exempted from income tax on the portion of their income generated on social housing. This tax treatment applies only to SNI and ADOMA.
Deferred taxes
Deferred taxes are recognised using the liability method for temporary differences between the carrying amount of assets and liabilities and their tax base. Under this method, deferred tax assets and liabilities are measured at the tax rates that are expected to apply to the period when the asset is realised or the liability is settled, based on tax rates (and tax laws) that have been enacted or substantively enacted by the end of the reporting period. The effects of changes in tax rates are recognised in the period in which the change is enacted or substantively enacted.
Deferred taxes are calculated at the level of each tax entity and deferred tax assets and liabilities for the same entity may be offset. Deferred tax assets are recognised only when it is probable that sufficient taxable profits will be available to permit their recovery.
4.22 Measurement basis – Assessment and use of estimates
The preparation of the Group’s consolidated financial statements involves making certain estimates and assumptions that are revised regularly and based on both historical data and other factors, including reasonable forecasts of future events in light of present circumstances. The estimates that could significantly affect the carrying value of assets and liabilities during the following reporting period are analysed below.
The fair value of financial instruments that are not traded on an organised market (e.g., derivatives traded over the counter) is determined using valuation techniques. The Group applies the methods and assumptions that it deems to be most appropriate, based mainly on market conditions at the reporting date. The actual disposal value of these instruments may be very different to the reported amount.

23 I SNI GROUP I Consolidated financial statements for the year ended 31 December 2016
The fair value of the property portfolio (whether held for short- or long-term investment purposes) is determined essentially based on independent expert appraisals as described in Note 4.4.
The value in use and fair value of equity investments in ESHs (social housing companies) as described in Note 4.10 is measured in accordance with Article 423-4 of the French building and housing code (Code de la construction et de l’habitation). It is capped at their nominal value, plus interest for each year preceding their disposal (not exceeding 20 years) calculated at the interest rate paid to first-time holders of passbook savings accounts at 31 December of the year in question plus 1.5 points, less any dividends paid over the same period.
Measurement of provisions for employee benefits is described in Notes 4.15 and 4.16. The basis for determining fair value in accordance with IFRS 13 is described in Note 3.7.
5. Financial and operational risk management
5.1 Interest rate risk
Interest rates and financing levels are an essential component in the Group's property operations and particular attention is paid to this risk and the impact of changes in interest rates on earnings.
Variable-rates (at Euribor and the interest rate payable on Livret A passbook accounts) are combined with an interest rate hedging policy that must be validated by the Management Board.
Borrowings indexed to Euribor are hedged for 100% of their outstanding amount using long-term swaps and options. Livret A outstandings are hedged for a maximum of 50% of their value.
SNI began using the financial markets in 2012 to meet its financing needs, mostly using fixed-rate debt. When coupons are linked to interest rates, the Group uses interest rate hedges to manage the related risk. In certain cases, notably when rent indexation is determined at the inception of an operation, SNI may pre-finance investment projects that have been validated by senior management.
The coupons are hedged using interest rate hedges and the related derivatives qualify for hedge accounting.
The Group operates a centralised hedging policy run from a single department.
5.2 Liquidity risk
As most of SNI’s debt consists of amortisable loans, there are no breaks in its debt maturity profile in the immediate future.
Due to the growth in bullet loans, SNI carefully defines the size and maturities of its annual financing programme in order to maintain maturities equivalent to those under amortisable financing.
SNI has negotiated short-term credit facilities with a banking consortium to provide financing for property development projects and asset acquisitions. These short-term drawdown facilities have also been designed with regard to any possible changes in outstanding deposit balances centralised by the Group under cash pooling arrangements. The Group’s treasury management function is run from a single platform and this makes it easier to coordinate and manage.
24 I SNI GROUP I Consolidated financial statements for the year ended 31 December 2016
5.3 Counterparty risk
The Group monitors its investments very carefully. It is especially attentive to the quality of the banks in which it holds deposits and tracks their credit ratings closely.
All such counterparty risks are detailed in the Liquidity charter approved by the Group's governance structures and SNI submits a half-yearly risk report to the CDC's Risk Management and Internal Control department (DRCI). All of these financial indicators are also provided to the Group's sole shareholder on a quarterly basis as part of the Caisse des Dépôts Group's capital adequacy reporting framework.
5.4 Operational risk
SNI is currently exposed to the following major operating risks: in its rental management business: unoccupied housing in outlying regions may result in significant
amounts of lost revenue. Guidelines for monitoring all sensitive properties are included in the annual property arbitration and review process which may result in either disposals or lowering of rents to bring them into line with the local rental market.
in the current difficult economic conditions, the Group also tracks any increases in overdue balances very closely and devises solutions to prevent such situations from arising. A major drive to recover overdue receivables was launched throughout the Group in Autumn 2013, particularly in the Social housing division.
in relation to the sale of housing: the risk of a slowdown in split sales due to a wait-and-see attitude and greater selectivity by banks when handing out loans. SNI has developed a repurchase and rehousing guarantee programme to enhance buyer solvency that is similar to existing social home ownership guarantees. Block sales could also be adversely affected by buyers encountering difficulties in obtaining long-term financing or guarantees from local authorities in the case of acquisitions by social landlords. The Group systematically analyses a potential buyer’s financial strength and sources of financing for each property sale transaction.
in tax matters: continued deterioration in the tax environment (VAT, income tax, social contributions, etc.). Although they are staggered over time, the impacts of an increasing tax burden are apparent in current financing operations (higher rates of VAT and average income tax), higher overheads due to increased social contributions, and exceptional measures (e.g., capping the deductibility of financial charges on loans to finance non-social housing). To counteract these trends, the Group anticipates developments and keeps tabs on potential changes while seeking to foster intelligent dialogue either directly or through professional bodies.
increasingly stringent technical regulations in the housing sector (compliance standards for lifts, thermal installations, treatment of asbestos, etc.) force the Group to keep close tabs on changing regulations and various related funding requirements (selling Energy Saving Certificates, for example).
Fraud prevention forms part of SNI Group's internal control arsenal and it is organised around three core processes: the internal and external fraud prevention framework which has been incorporated into the operational
risk mapping process and the Group's procedural guidelines and rules on ethics; ongoing awareness-raising initiatives for employees and tenants concerning the risks of fraud and the Group's IT security plan;
first-, second- and third-tier controls, concerning, respectively, self-monitoring and line supervision of operational staff, internal control assignments performed by business line management and support, and internal audits;
insurance policies taken out to cover specific risks of internal and external fraud.
25 I SNI GROUP I Consolidated financial statements for the year ended 31 December 2016
6. Notes to the consolidated financial statements
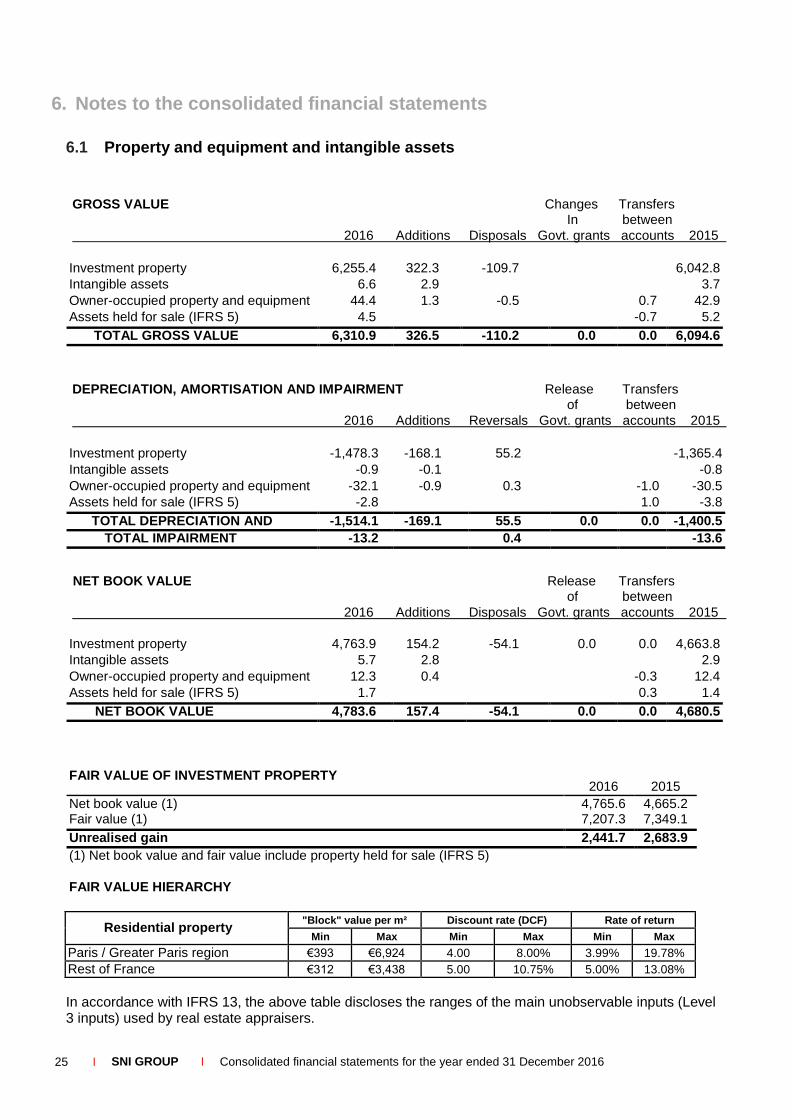
6.1 Property and equipment and intangible assets
GROSS VALUE Changes Transfers In between
2016 Additions Disposals Govt. grants accounts 2015
Investment property 6,255.4 322.3 -109.7 6,042.8
Intangible assets 6.6 2.9 3.7
Owner-occupied property and equipment 44.4 1.3 -0.5 0.7 42.9
Assets held for sale (IFRS 5) 4.5 -0.7 5.2
TOTAL GROSS VALUE 6,310.9 326.5 -110.2 0.0 0.0 6,094.6
DEPRECIATION, AMORTISATION AND IMPAIRMENT Release Transfers of between
2016 Additions Reversals Govt. grants accounts 2015
Investment property -1,478.3 -168.1 55.2 -1,365.4
Intangible assets -0.9 -0.1 -0.8
Owner-occupied property and equipment -32.1 -0.9 0.3 -1.0 -30.5
Assets held for sale (IFRS 5) -2.8 1.0 -3.8
TOTAL DEPRECIATION AND AMORTISATION
-1,514.1 -169.1 55.5 0.0 0.0 -1,400.5
TOTAL IMPAIRMENT -13.2 0.4 -13.6
NET BOOK VALUE Release Transfers of between
2016 Additions Disposals Govt. grants accounts 2015
Investment property 4,763.9 154.2 -54.1 0.0 0.0 4,663.8
Intangible assets 5.7 2.8 2.9
Owner-occupied property and equipment 12.3 0.4 -0.3 12.4
Assets held for sale (IFRS 5) 1.7 0.3 1.4
NET BOOK VALUE 4,783.6 157.4 -54.1 0.0 0.0 4,680.5
FAIR VALUE OF INVESTMENT PROPERTY 2016
2015
Net book value (1) 4,765.6 4,665.2 Fair value (1) 7,207.3 7,349.1
Unrealised gain 2,441.7 2,683.9
(1) Net book value and fair value include property held for sale (IFRS 5)
FAIR VALUE HIERARCHY
Residential property "Block" value per m² Discount rate (DCF) Rate of return
Min Max Min Max Min Max
Paris / Greater Paris region €393 €6,924 4.00%
8.00% 3.99% 19.78%
Rest of France €312 €3,438 5.00%
10.75% 5.00% 13.08%
In accordance with IFRS 13, the above table discloses the ranges of the main unobservable inputs (Level 3 inputs) used by real estate appraisers.

26 I SNI GROUP I Consolidated financial statements for the year ended 31 December 2016
6.2 Available-for-sale financial assets
Changes in
Scope of GROSS VALUE 2016 consolidation Disposals Acquisitions 2015
Non-consolidated equity investments (1) 79.0 -2.3 81.3
Fair value adjustments 0.0 0.0
TOTAL GROSS VALUE 79.0 -2.3 0.0 0.0 81.3
(1) o/w (€4 million) in consolidated ADESTIA shares and +€1.7 million in non-controlling interests in semi-public companies (SEMs) owned by ADESTIA and now consolidated.
IMPAIRMENT Changes in Scope of 2016 consolidation Reversals Additions 2015
The following data is presented on a 100% ownership basis in the reporting format (IFRS) used by ADOMA and FLI, the only entities accounted for using the equity method at the present time.
ADOMA FLI
Summary balance sheet 2016 2015 2016 2015
Property portfolio 907.0 822.2 252.1 61.6
Other assets 252.6 253.6 929.3 24.2
Total assets 1,159.6 1,075.8 1,181.4 85.8
Equity 313.6 288.2 1,032.2 40.8
Borrowings 632.0 574.9 0.2 0.0
Other liabilities 214.0 212.7 149.0 45.0
Total liabilities and equity 1,159.6 1,075.8 1,181.4 85.8
Net profit
28.8
39.1
0.2
-1.7
% control 56.41% 56.31% 19.14% 19.14%
Share in income of associates 16.2 22.0 0.0 -0.3
Equity 313.6 288.2 1,032.2 40.8 % control 56.41% 56.31% 19.14% 19.14%
INVESTMENTS IN ASSOCIATES 176.9 162.3 197.6 7.8
2016
2015
TOTAL SHARE IN NET INCOME OF ASSOCIATES 16.3 21.7
TOTAL INVESTMENTS IN ASSOCIATES 374.5 170.1
6.4 Other non-current financial assets and derivatives
2016 2015
Loans and advances to non-consolidated companies 38.0 38.0
Medium- and long-term loans 7.4 6.8
Other long-term receivables 57.0 77.5
Cash flow hedges 6.16.2 544.9 542.7
TOTAL 647.3 665.0
Provision for impairment -0.5 -0.3 -0.2
TOTAL IMPAIRMENT -0.5 0.0 0.0 -0.3 -0.2
NET BOOK VALUE 78.5 -2.3 0.0 -0.3 81.1
6.3 Investments in associates

27 I SNI GROUP I Consolidated financial statements for the year ended 31 December 2016
6.5 Deferred tax assets
2016
2015
DT / Timing differences
1.8
1.6
DT / Cash flow hedges 122.5 117.4
DT/ Valuation variances -43.2 -48.0
DT / Capitalisation of acquisition and borrowing costs
-23.4 -24.5
DT/ FV of debt -24.3 -23.3
DT / Other IFRS adjustments 6.3 5.2
Net deferred tax asset (liability) 39.7 28.4
6.6 Inventories and work in progress
Gross Impairment Net Net
2016 2016 (1) 2016 2015
Property in production (in progress)
33.5
-0.3
33.2
37.8 Property 0.0 0 0.0 0.1
TOTAL 33.5 -0.3 33.2 37.9
(1) o/w charge for the period of (1) o/w reversal for the period of 1.2
6.7 Trade accounts receivable
Gross 2016
Impairment
2016 (1)
Net
2016
Net
2015
Prepayments
13.4
13.4
5.4
Receivables from tenants 59.0 -15.1 43.9 37.3
Receivables from property development transactions
121.3 121.3 126.6
TOTAL 193.7 -15.1 178.6 169.3
(1) o/w charge for the period of -4.2 (1) o/w reversal for the period of 5.3
6.8 Current tax assets
2016 2015
Current tax assets
1.1
9.9
TOTAL 1.1 9.9

28 I SNI GROUP I Consolidated financial statements for the year ended 31 December 2016
6.9 Sundry receivables
Gross Impairment
Net
Net
2016 2016 (1) 2016 2015
Sundry and unbilled receivables 9.7 -0.9
8.8
3.2
Accrued government grants and subsidies 7.7 7.7 13.0
Tax receivables 5.0 5.0 7.1
Receivables on disposals of property 6.5 6.5 17.0
Miscellaneous receivables 10.9 -2.1 8.8 15.1
Prepaid expenses 9.9 9.9 11.2
TOTAL 49.7 -3.0 46.7 66.6
(1) o/w charge for the period -0.8 (1) o/w reversal for the period 1.4
6.10 Other current financial assets and derivatives
2016 2015
Short-term loans
0.2
0.2
Mutual funds > 3 months 11.5 11.9 Accrued interest 17.7 19.6 TOTAL 29.4 31.7
6.11 Cash and cash equivalents
2016 2015
Group cash pooling agreement – debit position 3.5 13.1 Mutual funds and other short-term investments (<3 months) 0.0 0.0 Cash and cash equivalents 771.7 794.9
TOTAL cash and cash equivalents (in ASSETS) 775.2 808.0
Group cash pooling agreement – credit position
167.6
218.6
Bank overdrafts 56.3 72.9
TOTAL cash (in LIABILITIES) 223.9 291.5
NET CASH AND CASH EQUIVALENTS 551.3 516.5
6.12 Assets held for sale
ASSETS HELD FOR SALE (IFRS 5)
2016
2015
Investment property held for sale 4.5 5.2 Government grants and subsidies 0.0 0.0 Cumulative amortisation and depreciation charges -2.8 -3.8 Provisions 0.0 0.0
TOTAL Assets held for sale 1.7 1.4
Borrowings / assets held for sale
0.5
0.0
TOTAL Liabilities related to assets held for sale 0.5 0.0
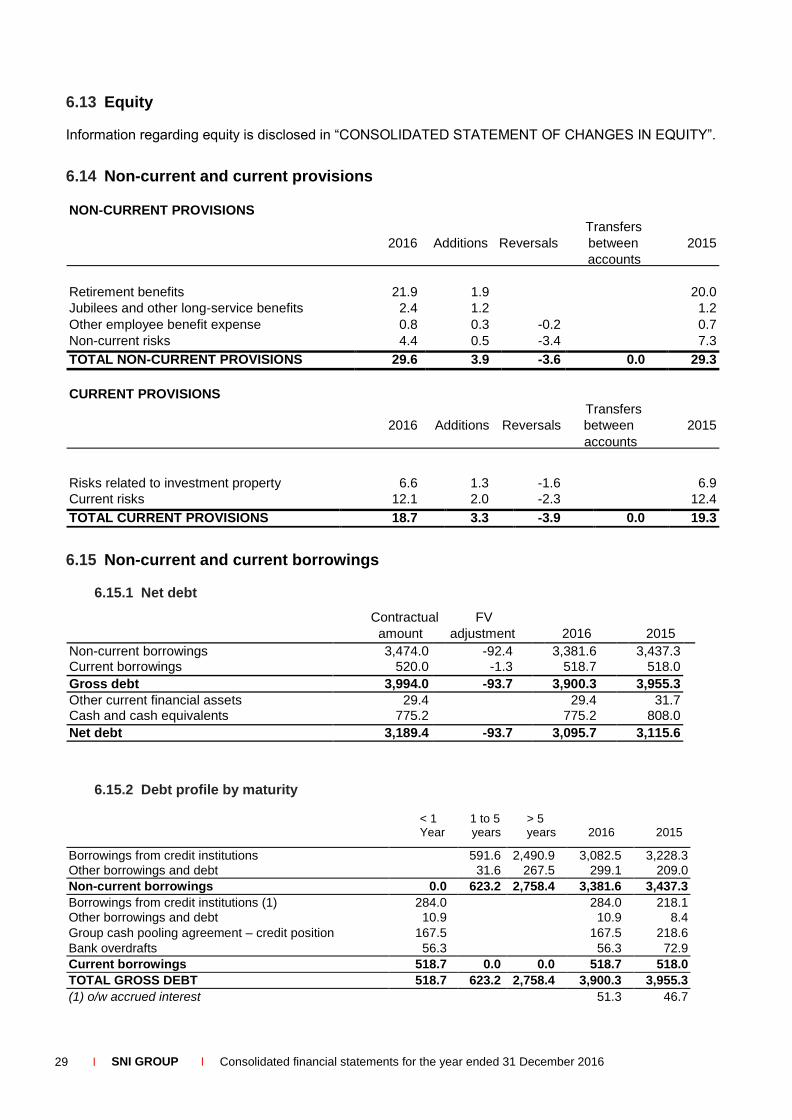
29 I SNI GROUP I Consolidated financial statements for the year ended 31 December 2016
6.13 Equity
Information regarding equity is disclosed in “CONSOLIDATED STATEMENT OF CHANGES IN EQUITY”.
6.14 Non-current and current provisions
NON-CURRENT PROVISIONS
2016 Additions Reversals
Transfers
between
2015
accounts
Retirement benefits 21.9 1.9 20.0
Jubilees and other long-service benefits 2.4 1.2 1.2
Other employee benefit expense 0.8 0.3 -0.2 0.7
Non-current risks 4.4 0.5 -3.4 7.3
TOTAL NON-CURRENT PROVISIONS 29.6 3.9 -3.6 0.0 29.3
CURRENT PROVISIONS
Transfers 2016 Additions Reversals between 2015
accounts
Risks related to investment property 6.6 1.3 -1.6 6.9
Current risks 12.1 2.0 -2.3 12.4
TOTAL CURRENT PROVISIONS 18.7 3.3 -3.9 0.0 19.3
6.15 Non-current and current borrowings
6.15.1 Net debt
Contractual
FV
amount adjustment 2016 2015
Non-current borrowings 3,474.0 -92.4 3,381.6 3,437.3 Current borrowings 520.0 -1.3 518.7 518.0
Gross debt 3,994.0 -93.7 3,900.3 3,955.3
Other current financial assets 29.4 29.4 31.7 Cash and cash equivalents 775.2 775.2 808.0
Net debt 3,189.4 -93.7 3,095.7 3,115.6
6.15.2 Debt profile by maturity
< 1 1 to 5 > 5 Year years years 2016 2015
Borrowings from credit institutions 591.6 2,490.9 3,082.5 3,228.3
Other borrowings and debt 31.6 267.5 299.1 209.0
Non-current borrowings 0.0 623.2 2,758.4 3,381.6 3,437.3
Borrowings from credit institutions (1) 284.0 284.0 218.1
Other borrowings and debt 10.9 10.9 8.4
Group cash pooling agreement – credit position 167.5 167.5 218.6
Bank overdrafts 56.3 56.3 72.9
Current borrowings 518.7 0.0 0.0 518.7 518.0
TOTAL GROSS DEBT 518.7 623.2 2,758.4 3,900.3 3,955.3
(1) o/w accrued interest 51.3 46.7
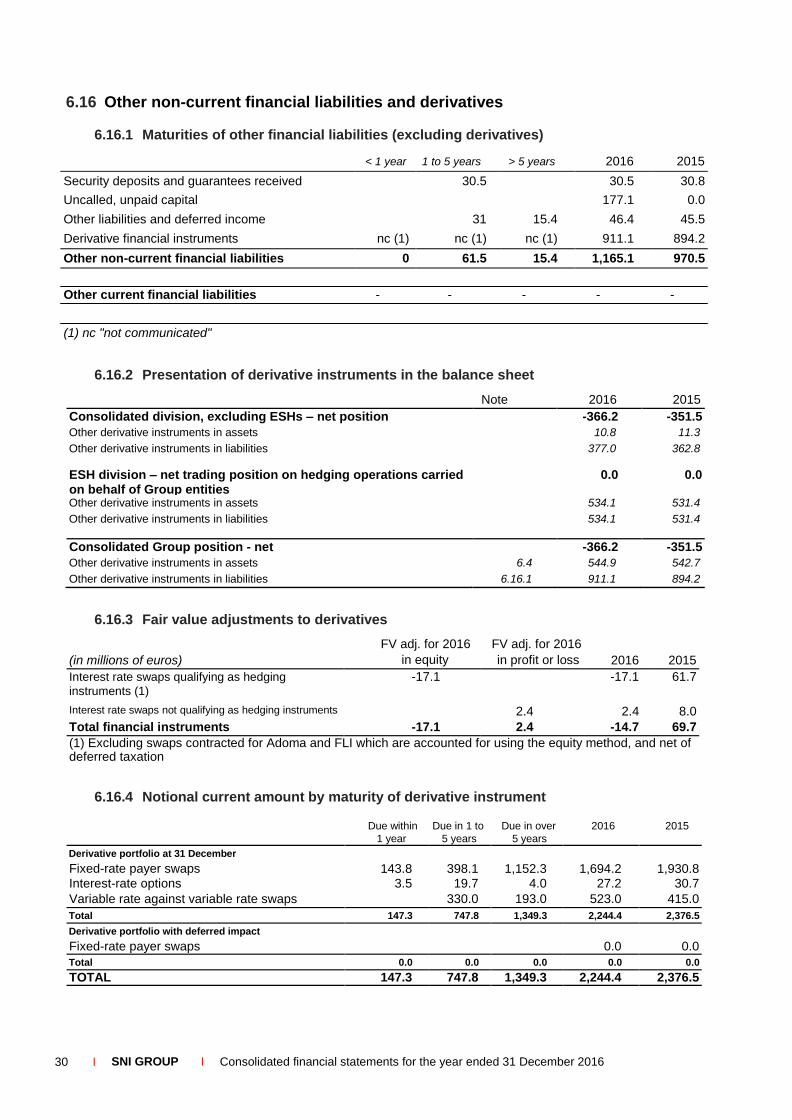
30 I SNI GROUP I Consolidated financial statements for the year ended 31 December 2016
6.16 Other non-current financial liabilities and derivatives
6.16.1 Maturities of other financial liabilities (excluding derivatives)
< 1 year 1 to 5 years > 5 years 2016 2015
Security deposits and guarantees received 30.5 30.5 30.8
Uncalled, unpaid capital 177.1 0.0
Other liabilities and deferred income 31 15.4 46.4 45.5
Derivative financial instruments nc (1) nc (1) nc (1) 911.1 894.2
Other non-current financial liabilities 0 61.5 15.4 1,165.1 970.5
Other current financial liabilities - - - - -
(1) nc "not communicated"
6.16.2 Presentation of derivative instruments in the balance sheet
Note 2016 2015
Consolidated division, excluding ESHs – net position -366.2 -351.5
Other derivative instruments in assets 10.8 11.3
Other derivative instruments in liabilities 377.0 362.8
ESH division – net trading position on hedging operations carried on behalf of Group entities
0.0 0.0
Other derivative instruments in assets 534.1 531.4
Other derivative instruments in liabilities 534.1 531.4
Consolidated Group position - net -366.2 -351.5
Other derivative instruments in assets 6.4 544.9 542.7
Other derivative instruments in liabilities 6.16.1 911.1 894.2
6.16.3 Fair value adjustments to derivatives
(in millions of euros)
FV adj. for 2016
in equity
FV adj. for 2016
in profit or loss
2016
2015
Interest rate swaps qualifying as hedging
instruments (1)
-17.1 -17.1 61.7
Interest rate swaps not qualifying as hedging instruments 2.4 2.4 8.0
Total financial instruments -17.1 2.4 -14.7 69.7
(1) Excluding swaps contracted for Adoma and FLI which are accounted for using the equity method, and net of deferred taxation
6.16.4 Notional current amount by maturity of derivative instrument
Due within Due in 1 to Due in over 2016 2015
1 year 5 years 5 years
Derivative portfolio at 31 December
Fixed-rate payer swaps
143.8
398.1
1,152.3
1,694.2
1,930.8 Interest-rate options 3.5 19.7 4.0 27.2 30.7
Variable rate against variable rate swaps 330.0 193.0 523.0 415.0
Total 147.3 747.8 1,349.3 2,244.4 2,376.5
Derivative portfolio with deferred impact
Fixed-rate payer swaps
0.0
0.0
Total 0.0 0.0 0.0 0.0 0.0
TOTAL 147.3 747.8 1,349.3 2,244.4 2,376.5

31 I SNI GROUP I Consolidated financial statements for the year ended 31 December 2016
6.16.5 Analysis of debt after hedging
Classification of debt
Fixed rate Variable rate 2016
Borrowings 1,292.4 2,118.2 3,410.6
Interest-free debt 187.4 187.4
Leases 27.1 27.1
Accrued interest on borrowings 51.3 51.3
Group cash pooling agreement – credit position 167.5 167.5
Bank overdrafts 56.3 56.3
GROSS DEBT BEFORE HEDGING 1,506.9 2,393.3 3,900.2
Hedging of variable-rate debt at fixed rates (borrowings) 1,536.7 -1,536.7 0.0
Hedging of Livret A debt at fixed rates (borrowings) 283.0 -283.0 0.0
GROSS DEBT AFTER HEDGING 3,326.6 573.6 3,900.2
Term deposits and other investments 568.0 568.0
Group cash pooling agreement – debit position 3.5 3.5
Accrued interest receivable 17.7 17.7
Interest-bearing bank accounts 215.4 215.4
Bank current account 0.0
TOTAL CURRENT FINANCIAL ASSETS AND CASH 585.7 218.9 804.6
GROSS DEBT AFTER HEDGING 2,740.9 354.7 3,095.6
6.16.6 Recognition of financial assets and liabilities
Note
Classification
NBV 2016 Fair value
Available-for-sale financial assets 6.2 Available-for-sale financial assets 78.5 78.5
Other non-current financial assets 6.4 Loans and receivables 102.4 102.4
Cash flow hedges/ 6.16.2 assets held 10.8 10.8
Group non-current derivative instruments (1) for trading Other receivables 6.7 to 6.9 Loans and receivables 226.4 226.4
Other current financial assets and derivatives 6.10 Financial assets at fair value through profit or loss
29.4 29.4
Cash and cash equivalents 6.11 Financial assets at fair value through profit or loss
775.2 775.2
TOTAL FINANCIAL ASSETS 1,222.7 1,222.7
Non-current borrowings
6.15.2
Financial liabilities at amortised cost
3,381.3
3,381.3
Other non-current financial liabilities 6.16.1 Financial liabilities at amortised cost 76.3 76.3
Cash flow hedges/ 6.16.2 liabilities held 377.0 377.0
Group non-current derivative instruments (1) for trading Current borrowings 6.15.2 Financial liabilities at amortised cost 518.7 518.7
Other liabilities 6.17 to 6.19 Financial liabilities at amortised cost 225.6 225.6
TOTAL FINANCIAL LIABILITIES 4,578.9 4,578.9
(1) net of hedging carried out on behalf of the ESH division

32 I SNI GROUP I Consolidated financial statements for the year ended 31 December 2016
6.16.7 Fair value hierarchy for measuring financial instruments
The criteria used for measuring the fair value of financial instruments are disclosed in Note 3.7. The hierarchy may be summarised as follows: Level 1 Quoted on an active market Level 2 Measured using observable inputs Level 3 Measured using non-observable inputs
Assets
2016 2015
Level 1 Level 2 Level 3 Level 1 Level 2 Level 3
Available-for-sale financial assets 78.5 81.1
Derivative instruments 544.9 542.7
Other current financial assets 11.5 11.9
Liabilities
Derivative instruments 911.1 894.2
6.17 Trade accounts payable
2016
2015
Trade accounts payable
6.5
4.5
Unbilled trade payables 25.8 30.7
Prepaid trade receivables 10.8 5.9
TOTAL TRADE PAYABLES 43.1 41.1
6.18 Current tax liabilities
2016
2015
Current tax liabilities
11.9
0.0
TOTAL 11.9 0.0
6.19 Sundry payables
2016
2015
Tax and social security liabilities
74.0
68.2
Amounts owed to property developers 57.2 86.6
Miscellaneous payables 13.8 14.6
Deferred income 25.6 18.8
TOTAL 170.6 188.2
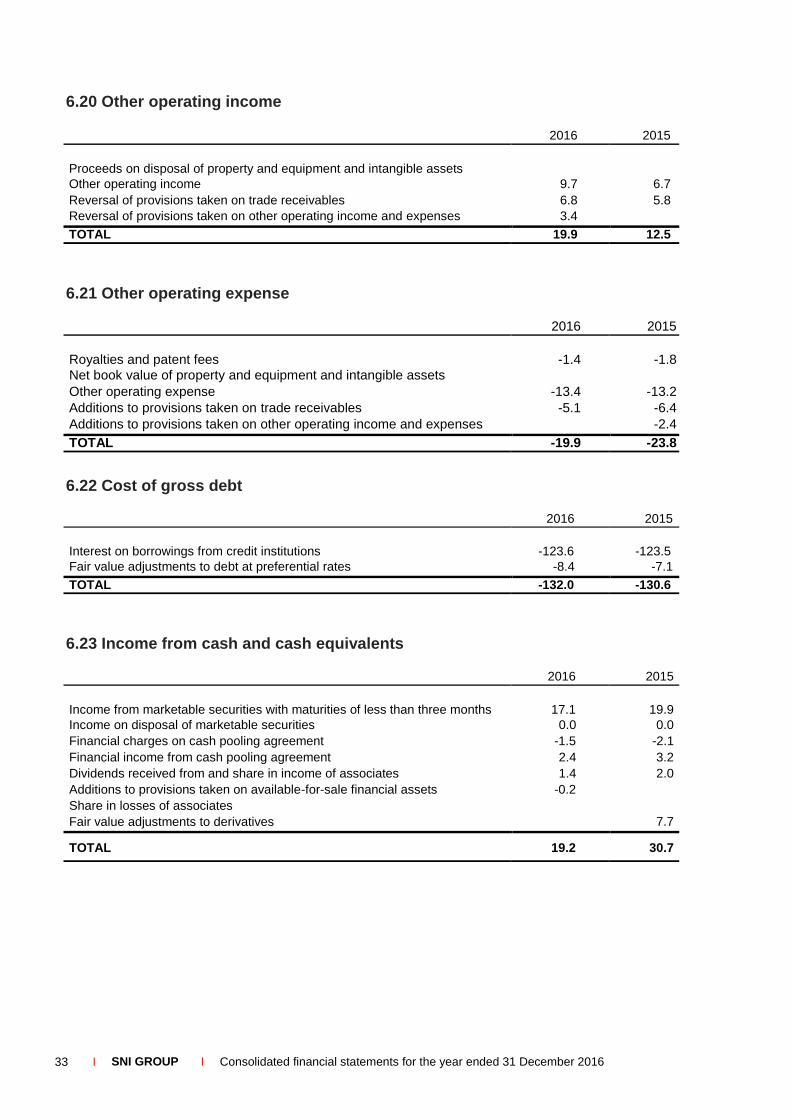
33 I SNI GROUP I Consolidated financial statements for the year ended 31 December 2016
6.20 Other operating income
2016
2015
Proceeds on disposal of property and equipment and intangible assets
Other operating income 9.7 6.7
Reversal of provisions taken on trade receivables 6.8 5.8
Reversal of provisions taken on other operating income and expenses 3.4 TOTAL 19.9 12.5
6.21 Other operating expense
2016 2015
Royalties and patent fees
-1.4
-1.8
Net book value of property and equipment and intangible assets Other operating expense -13.4 -13.2
Additions to provisions taken on trade receivables -5.1 -6.4
Additions to provisions taken on other operating income and expenses -2.4
TOTAL -19.9 -23.8
6.22 Cost of gross debt
2016 2015
Interest on borrowings from credit institutions
-123.6
-123.5
Fair value adjustments to debt at preferential rates -8.4 -7.1
TOTAL -132.0 -130.6
6.23 Income from cash and cash equivalents
2016 2015
Income from marketable securities with maturities of less than three months
17.1
19.9
Income on disposal of marketable securities 0.0 0.0
Financial charges on cash pooling agreement -1.5 -2.1
Financial income from cash pooling agreement 2.4 3.2
Dividends received from and share in income of associates 1.4 2.0
Additions to provisions taken on available-for-sale financial assets -0.2 Share in losses of associates
Fair value adjustments to derivatives
7.7
TOTAL 19.2 30.7
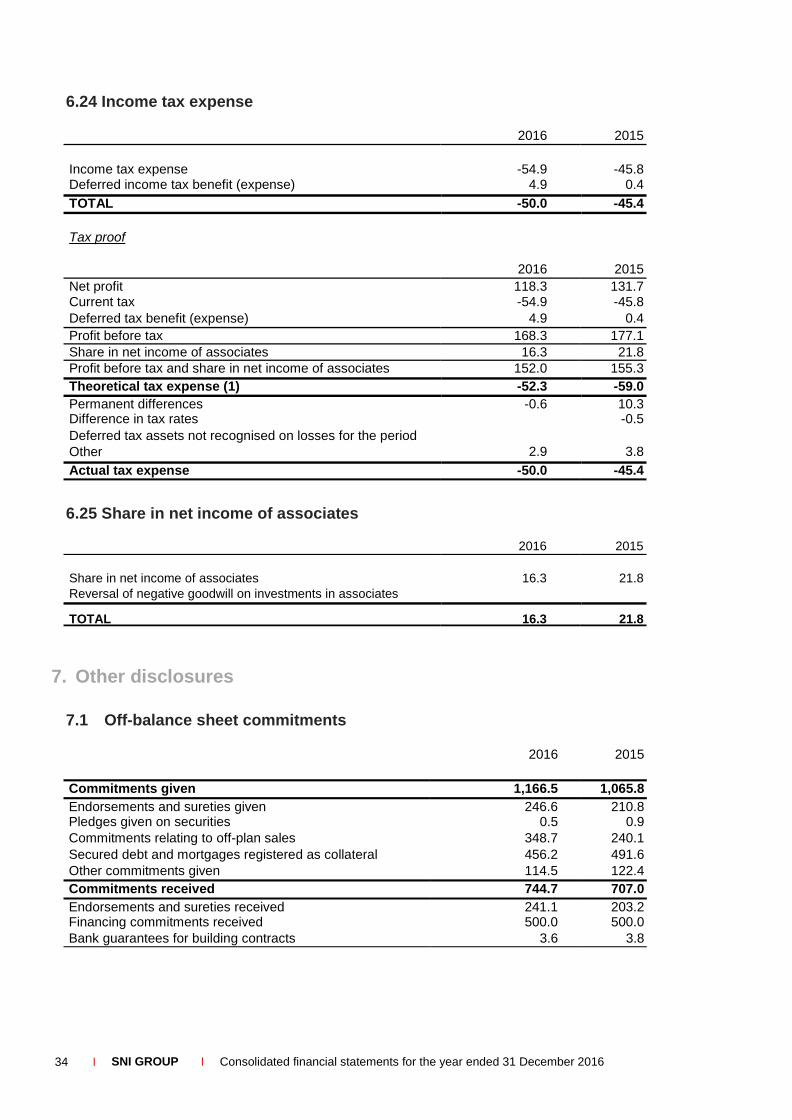
34 I SNI GROUP I Consolidated financial statements for the year ended 31 December 2016
6.24 Income tax expense
2016
2015
Income tax expense
-54.9
-45.8
Deferred income tax benefit (expense) 4.9 0.4
TOTAL -50.0 -45.4
Tax proof
2016 2015
Net profit 118.3 131.7 Current tax -54.9 -45.8
Deferred tax benefit (expense) 4.9 0.4
Profit before tax 168.3 177.1
Share in net income of associates 16.3 21.8
Profit before tax and share in net income of associates 152.0 155.3
Theoretical tax expense (1) -52.3 -59.0
Permanent differences -0.6 10.3 Difference in tax rates -0.5
Deferred tax assets not recognised on losses for the period
Other
2.9
3.8
Actual tax expense -50.0 -45.4
6.25 Share in net income of associates
2016 2015
Share in net income of associates
Reversal of negative goodwill on investments in associates
16.3
21.8
TOTAL 16.3 21.8
7. Other disclosures
7.1 Off-balance sheet commitments
2016
2015
Commitments given 1,166.5 1,065.8
Endorsements and sureties given 246.6 210.8 Pledges given on securities 0.5 0.9
Commitments relating to off-plan sales 348.7 240.1
Secured debt and mortgages registered as collateral 456.2 491.6
Other commitments given 114.5 122.4
Commitments received 744.7 707.0
Endorsements and sureties received 241.1 203.2 Financing commitments received 500.0 500.0
Bank guarantees for building contracts 3.6 3.8
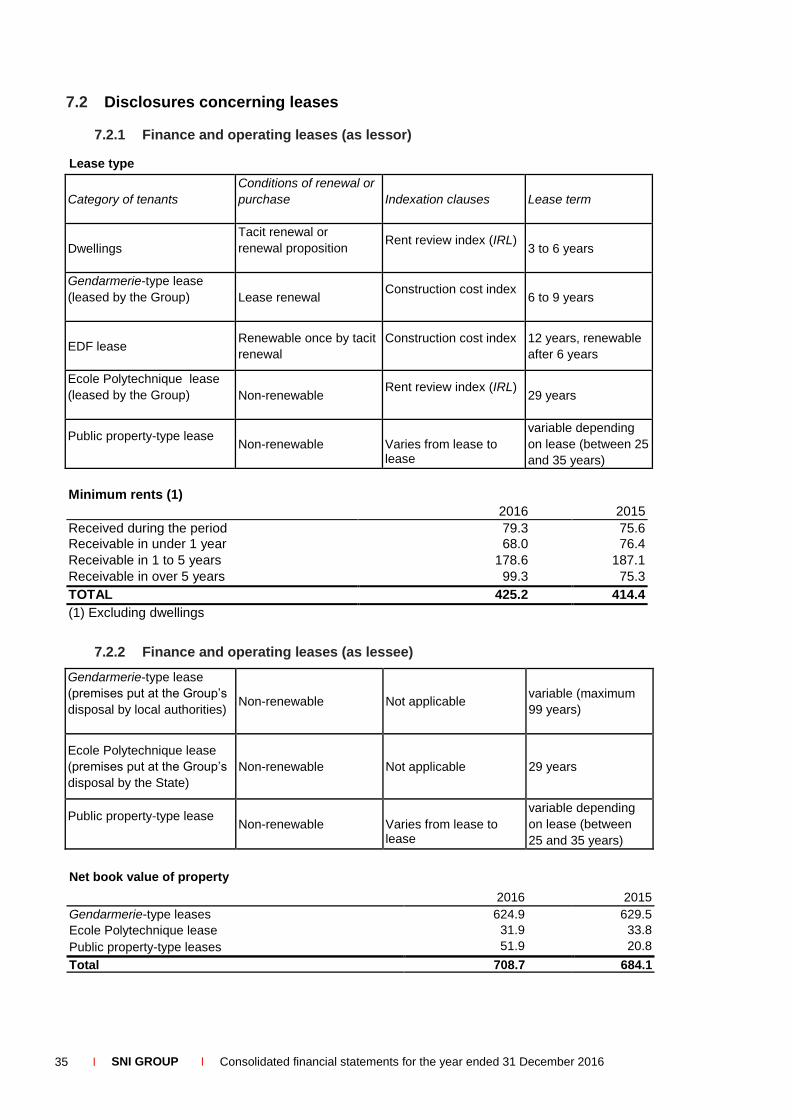
35 I SNI GROUP I Consolidated financial statements for the year ended 31 December 2016
7.2 Disclosures concerning leases
7.2.1 Finance and operating leases (as lessor)
Lease type
Category of tenants
Conditions of renewal or
purchase
Indexation clauses
Lease term
Dwellings
Tacit renewal or
renewal proposition Rent review index (IRL)
3 to 6 years
Gendarmerie-type lease
(leased by the Group)
Lease renewal
Construction cost index 6 to 9 years
EDF lease
Renewable once by tacit
renewal
Construction cost index 12 years, renewable
after 6 years
Ecole Polytechnique lease
(leased by the Group)
Non-renewable
Rent review index (IRL) 29 years
Public property-type lease Non-renewable
Varies from lease to lease
variable depending
on lease (between 25
and 35 years)
Minimum rents (1) 2016
2015
Received during the period 79.3 75.6
Receivable in under 1 year 68.0 76.4
Receivable in 1 to 5 years 178.6 187.1
Receivable in over 5 years 99.3 75.3
TOTAL 425.2 414.4
(1) Excluding dwellings
7.2.2 Finance and operating leases (as lessee)
Gendarmerie-type lease
(premises put at the Group’s
disposal by local authorities)
Non-renewable
Not applicable
variable (maximum
99 years)
Ecole Polytechnique lease
(premises put at the Group’s
disposal by the State)
Non-renewable
Not applicable
29 years
Public property-type lease Non-renewable
Varies from lease to lease
variable depending
on lease (between
25 and 35 years)
Net book value of property
2016
2015
Gendarmerie-type leases 624.9 629.5
Ecole Polytechnique lease 31.9 33.8
Public property-type leases 51.9 20.8
Total 708.7 684.1
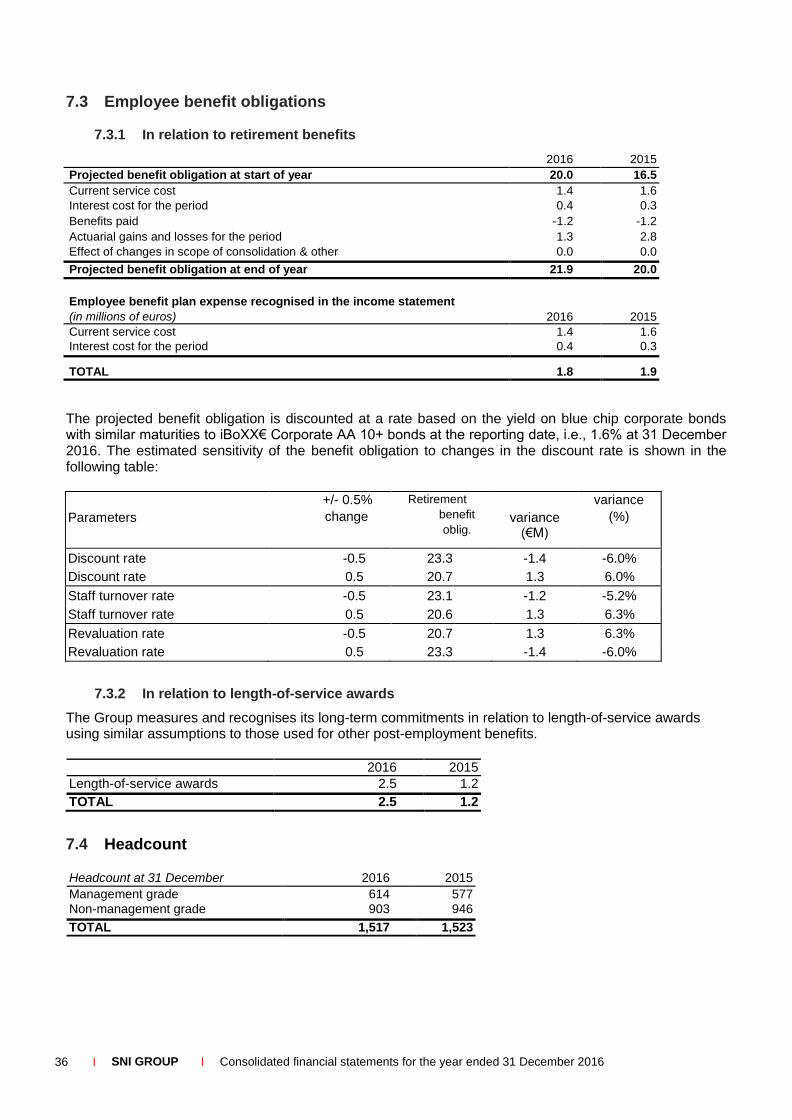
36 I SNI GROUP I Consolidated financial statements for the year ended 31 December 2016
7.3 Employee benefit obligations
7.3.1 In relation to retirement benefits
2016 2015
Projected benefit obligation at start of year 20.0 16.5
Current service cost 1.4 1.6
Interest cost for the period 0.4 0.3
Benefits paid -1.2 -1.2
Actuarial gains and losses for the period 1.3 2.8
Effect of changes in scope of consolidation & other 0.0 0.0
Projected benefit obligation at end of year 21.9 20.0
Employee benefit plan expense recognised in the income statement
(in millions of euros)
2016
2015
Current service cost 1.4 1.6
Interest cost for the period 0.4 0.3
TOTAL 1.8 1.9
The projected benefit obligation is discounted at a rate based on the yield on blue chip corporate bonds with similar maturities to iBoXX€ Corporate AA 10+ bonds at the reporting date, i.e., 1.6% at 31 December 2016. The estimated sensitivity of the benefit obligation to changes in the discount rate is shown in the following table:
Parameters
+/- 0.5%
change
Retirement
benefit
oblig.
variance
(€M)
variance
(%)
Discount rate -0.5 23.3 -1.4 -6.0%
Discount rate 0.5 20.7 1.3 6.0%
Staff turnover rate -0.5 23.1 -1.2 -5.2%
Staff turnover rate 0.5 20.6 1.3 6.3%
Revaluation rate -0.5 20.7 1.3 6.3%
Revaluation rate 0.5 23.3 -1.4 -6.0%
7.3.2 In relation to length-of-service awards
The Group measures and recognises its long-term commitments in relation to length-of-service awards using similar assumptions to those used for other post-employment benefits.
2016 2015
Length-of-service awards 2.5 1.2
TOTAL 2.5 1.2
7.4 Headcount
Headcount at 31 December 2016 2015
Management grade 614 577
Non-management grade 903 946
TOTAL 1,517 1,523

37 I SNI GROUP I Consolidated financial statements for the year ended 31 December 2016
7.5 Statutory Auditors’ fees
2016 2015
Mazars 0.3 0.3
PricewaterhouseCoopers
Other audit firms
0.2 0.2
Total - statutory audit engagements 0.5 0.5
Mazars
PricewaterhouseCoopers
Other audit firms
0.2
Services other than statutory audit engagements 0.2 0.0
TOTAL 0.7 0.5
7.6 Related party-transactions and senior executive compensation
The Group’s parent, CDC, complies with the notion of a “government-related entity” under Revised IAS 24 and SNI avails of the reporting exemption available under paragraph 25 of the standard.
7.6.1 Relations with the parent company
Relations with the parent mainly concern bank loans granted under arm’s length conditions and guarantees provided to either SNI or one of its subsidiaries.
2016 2015
Borrowings - Caisse des dépôts et consignations 29.0 33.3 Operating profit/(loss) 0.9 0.0
Financial income (expense) 0.0 0.1
Pledges and guarantees given 65.8 74.5
Pledges and guarantees received 121.0 128.0
RELATIONS WITH CDC – BALANCE SHEET (1) 29.0 33.3
RELATIONS WITH CDC – INCOME STATEMENT (2) 0.9 0.1
RELATIONS WITH CDC –OFF BALANCE SHEET (3) 55.2 53.5
(1) "+asset / - liability", (2) "+ income / - expense", (3) "+ received / - given"
7.6.2 Relations with consolidated entities
These mainly concern the Group cash pooling agreement, secondment of personnel and provision of premises and on-site facilities, and guarantees provided to subsidiaries.
2016 2015
Loans and advances to consolidated companies 5.2 5.6 Group cash pooling agreement – in B/S assets 2.0 0.0
Group cash pooling agreement – in B/S liabilities 29.5 19.8
Sundry receivables 1.8 0.9
Operating profit/(loss) 3.2 0.0
Net financial income (expense) from cash management facilities 0.1 0.1
RELATIONS WITH CONSOLIDATED ENTITIES – BALANCE SHEET (1) -20.5 -14.2
RELATIONS WITH CONSOLIDATED ENTITIES – INCOME STATEMENT (2)
3.3 0.1
(1) "+asset / - liability", (2) "+ income / - expense";

38 I SNI GROUP I Consolidated financial statements for the year ended 31 December 2016
7.6.3 Relations with ESHs
These mainly concern the Group cash pooling agreement and the provision of debt hedging services.
2016 2015
Group cash pooling agreement – in B/S assets 0.0 8.9 Group cash pooling agreement – in B/S liabilities 149.2 213.3
Net financial income (expense) from cash management facilities -1.3 -1.8
Derivative instruments - Assets 534.1 531.4
Derivative instruments - Liabilities 534.1 531.4
RELATIONS WITH ESHs – BALANCE SHEET (1) -149.2 -204.4
RELATIONS WITH ESHs – INCOME STATEMENT (2) -1.3 -1.8
(1) "+asset / - liability", (2) "+ income / - expense";
7.6.4 Senior executive compensation
Members of the Management Board and Supervisory Board are deemed to be senior executives.
2016 2015
COMPENSATION PAID TO MANAGEMENT BODIES (TOTAL) 1.4 1.6
Short-term benefits
Post-employment benefits
Other long-term benefits
Termination indemnities
1.4 1.6
COMPENSATION PAID TO MEMBERS OF THE SUPERVISORY BOARD (TOTAL)
0.1 0.1
Attendance fees 0.1 0.1
7.7 Subsequent events
No material changes occurred in the SNI Group’s financial or commercial position between the end of the year and the date on which the financial statements were prepared.