smart sheet range for excel - collabion charts for sharepoint
TRANSCRIPT
Smart Sheet Range
For Excel
Collabion Charts for SharePoint
To Make Your Charts Dynamic
Let’s learn how to
fetch data from Excel dynamically, in Collabion Charts.
Smart Sheet Range For Excel| Collabion Charts For SharePoint
What’s the necessity for such a feature? We have the answer in the next few slides…
Smart Sheet Range For Excel| Collabion Charts For SharePoint
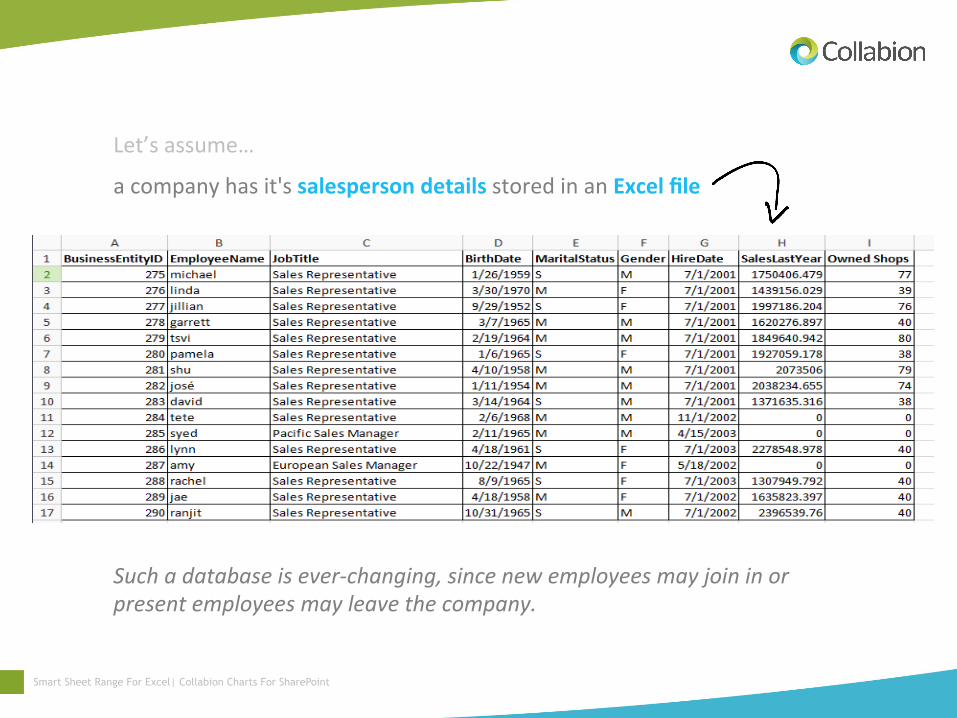
Let’s assume…
a company has it's salesperson details stored in an Excel file
Such a database is ever-‐changing, since new employees may join in or present employees may leave the company.
Smart Sheet Range For Excel| Collabion Charts For SharePoint
To avoid such a scenario, Collabion Charts provides the user a simple yet powerful op?on – smart sheet range selec>on from Excel sheets.
Collabion Charts can dynamically update the chart as per any updates in the source Excel file.
But we might face an issue if we define a sta?c sheet range for the Excel file.
i.e. if Collabion keeps on sourcing data from the same range, it would not update the chart with new data, added in the Excel sheet later.
Smart Sheet Range For Excel| Collabion Charts For SharePoint
But first, let’s see what happens when we define
Sta>c ‘Sheet Range’ For Excel
Smart Sheet Range For Excel| Collabion Charts For SharePoint
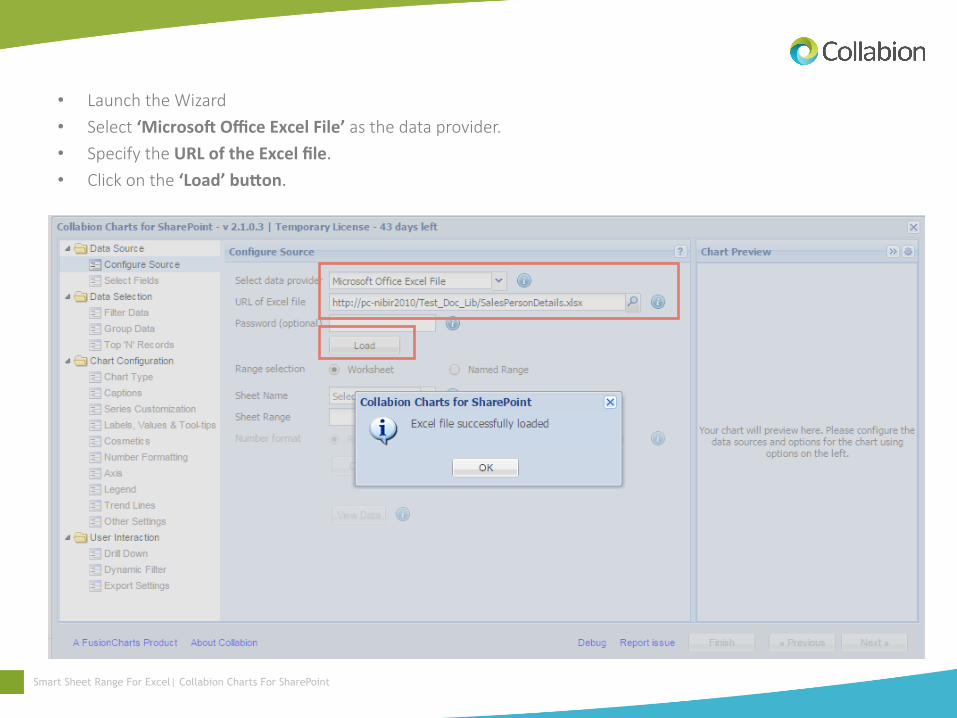
• Launch the Wizard • Select ‘MicrosoB Office Excel File’ as the data provider. • Specify the URL of the Excel file. • Click on the ‘Load’ buGon.
Smart Sheet Range For Excel| Collabion Charts For SharePoint
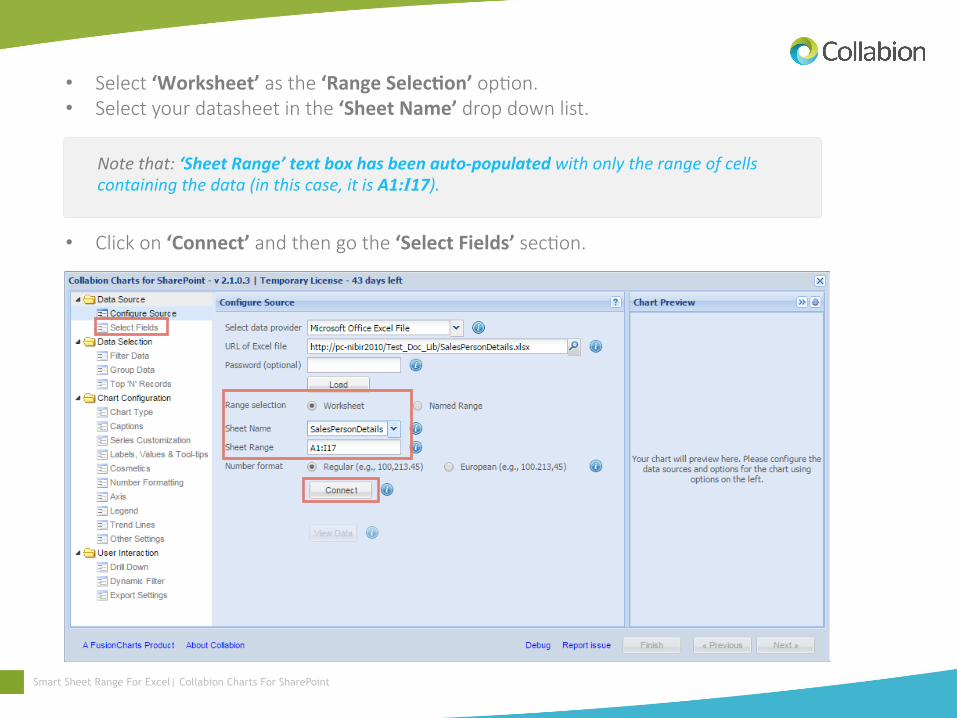
• Select ‘Worksheet’ as the ‘Range Selec>on’ opBon. • Select your datasheet in the ‘Sheet Name’ drop down list.
Note that: ‘Sheet Range’ text box has been auto-‐populated with only the range of cells containing the data (in this case, it is A1:I17).
• Click on ‘Connect’ and then go the ‘Select Fields’ secBon.
Smart Sheet Range For Excel| Collabion Charts For SharePoint
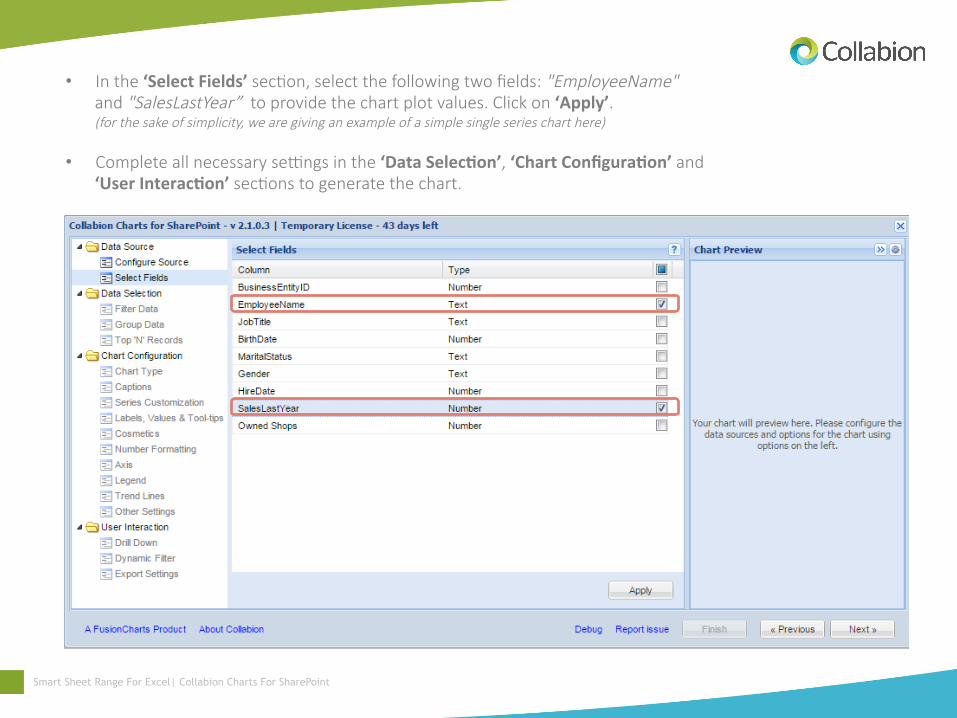
• In the ‘Select Fields’ secBon, select the following two fields: "EmployeeName" and "SalesLastYear” to provide the chart plot values. Click on ‘Apply’. (for the sake of simplicity, we are giving an example of a simple single series chart here)
• Complete all necessary seHngs in the ‘Data Selec>on’, ‘Chart Configura>on’ and ‘User Interac>on’ secBons to generate the chart.
Smart Sheet Range For Excel| Collabion Charts For SharePoint
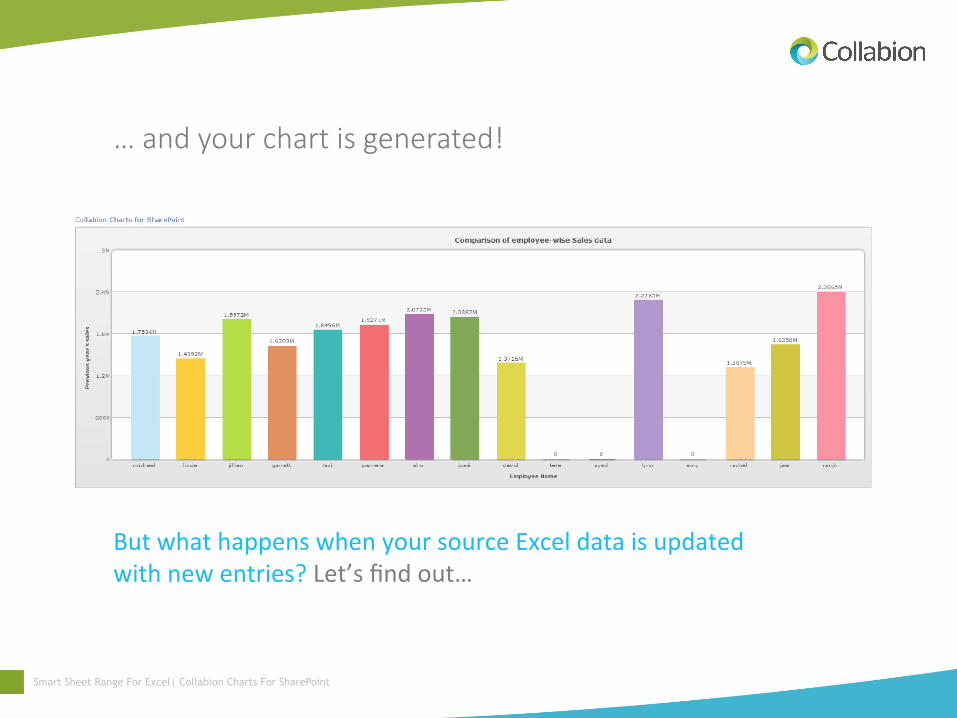
… and your chart is generated!
But what happens when your source Excel data is updated with new entries? Let’s find out…
Smart Sheet Range For Excel| Collabion Charts For SharePoint
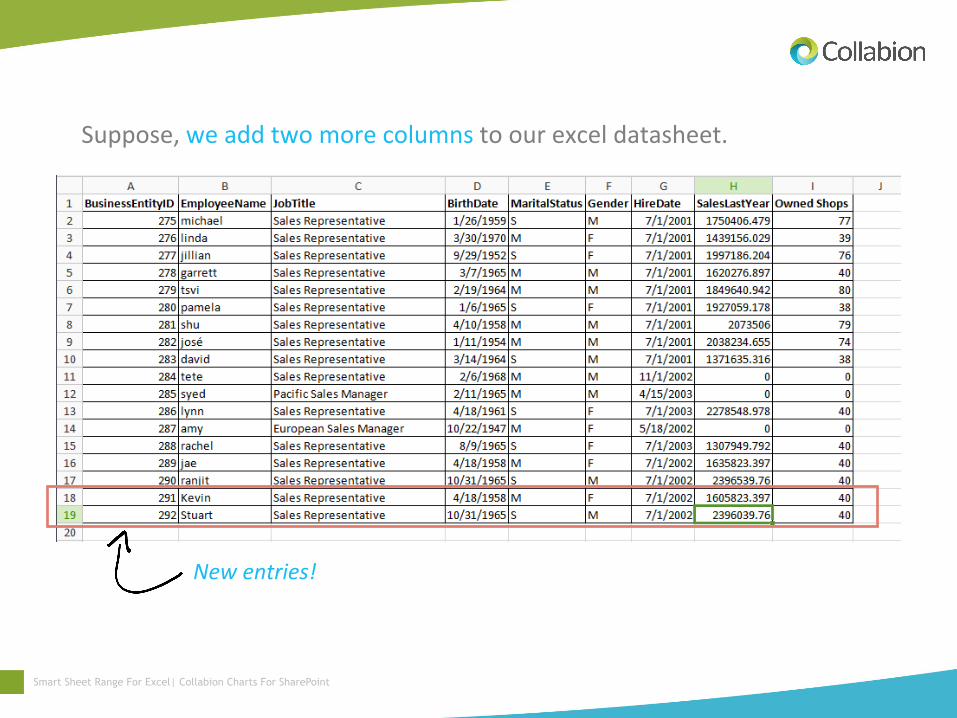
Suppose, we add two more columns to our excel datasheet.
New entries!
Smart Sheet Range For Excel| Collabion Charts For SharePoint
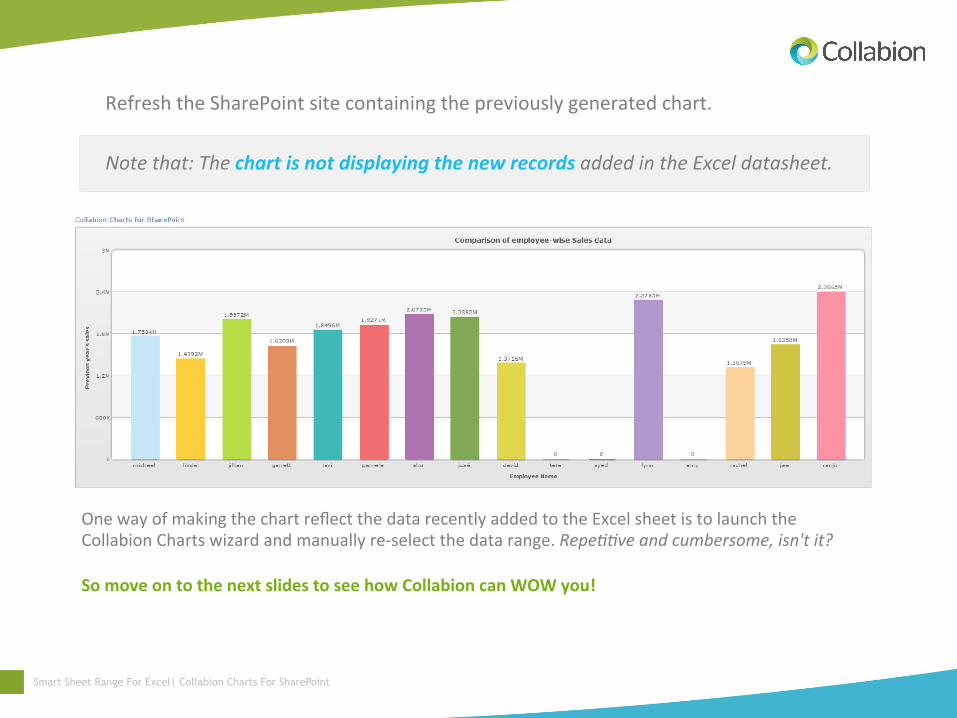
Refresh the SharePoint site containing the previously generated chart.
Note that: The chart is not displaying the new records added in the Excel datasheet.
One way of making the chart reflect the data recently added to the Excel sheet is to launch the Collabion Charts wizard and manually re-‐select the data range. Repe??ve and cumbersome, isn't it? So move on to the next slides to see how Collabion can WOW you!
Smart Sheet Range For Excel| Collabion Charts For SharePoint
Smart ‘Sheet Range’ for Excel
Smart Sheet Range For Excel| Collabion Charts For SharePoint
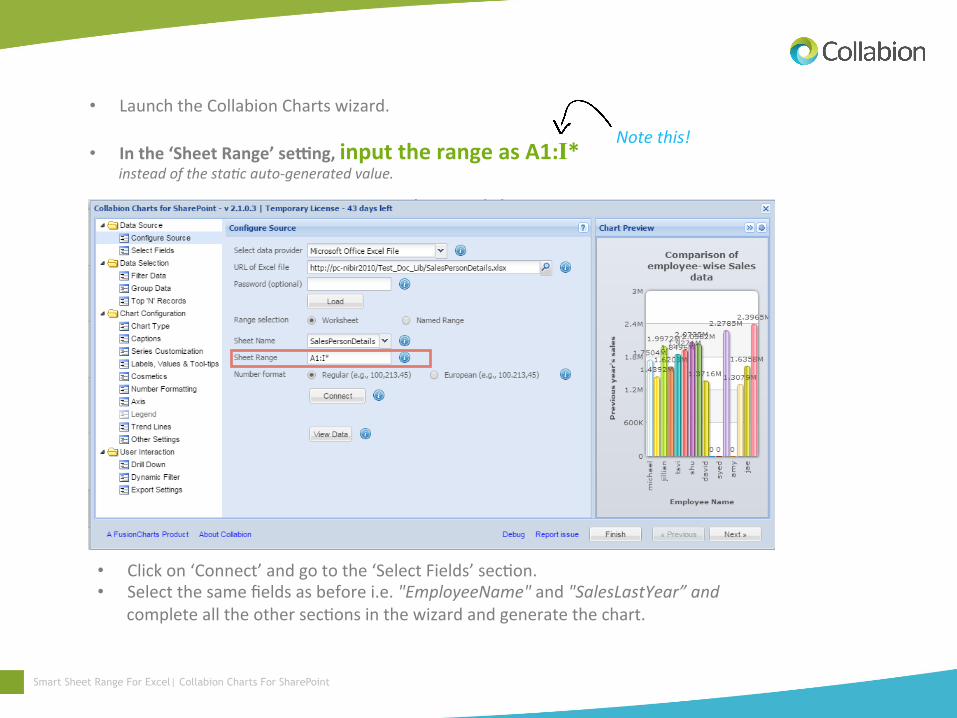
• Launch the Collabion Charts wizard.
• In the ‘Sheet Range’ sePng, input the range as A1:I* instead of the sta?c auto-‐generated value.
Note this!
• Click on ‘Connect’ and go to the ‘Select Fields’ sec?on. • Select the same fields as before i.e. "EmployeeName" and "SalesLastYear” and
complete all the other sec?ons in the wizard and generate the chart.
Smart Sheet Range For Excel| Collabion Charts For SharePoint
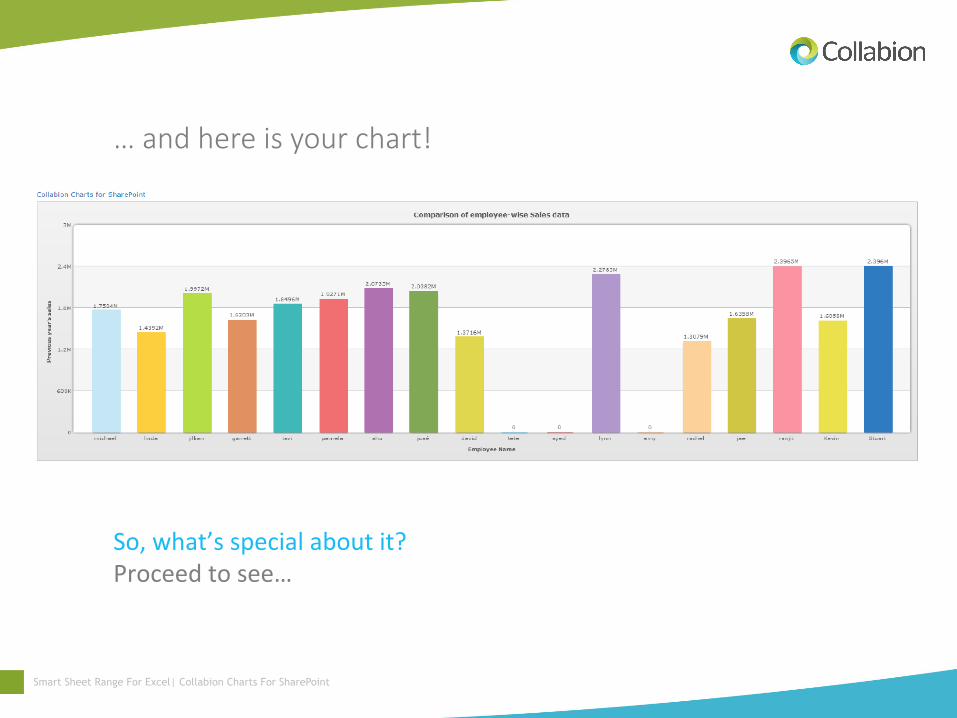
… and here is your chart!
So, what’s special about it? Proceed to see…
Smart Sheet Range For Excel| Collabion Charts For SharePoint
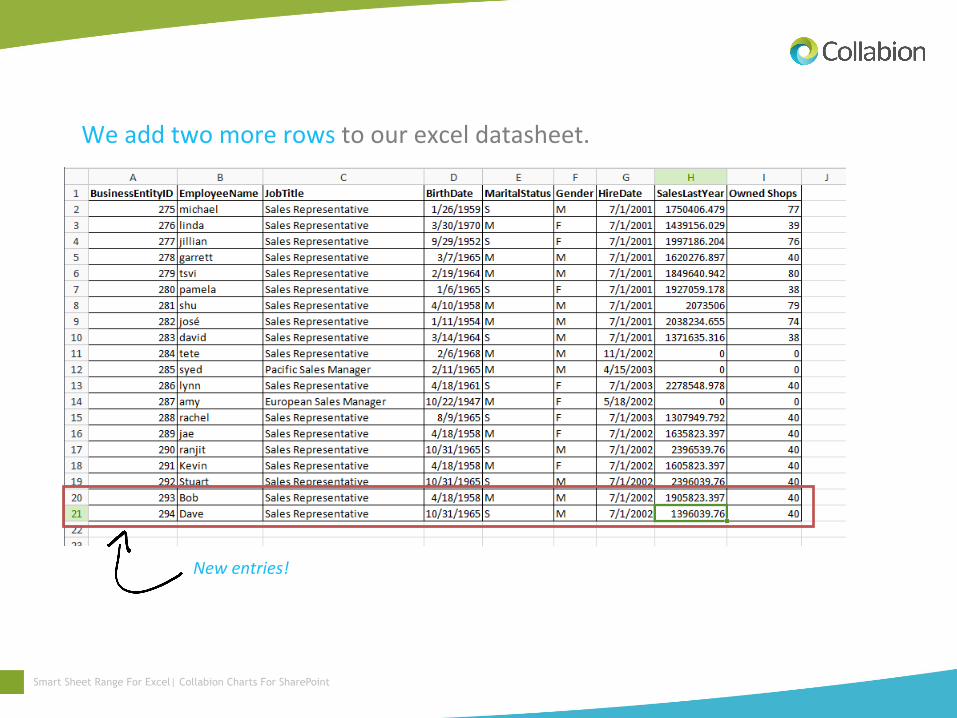
We add two more rows to our excel datasheet.
New entries!
Smart Sheet Range For Excel| Collabion Charts For SharePoint
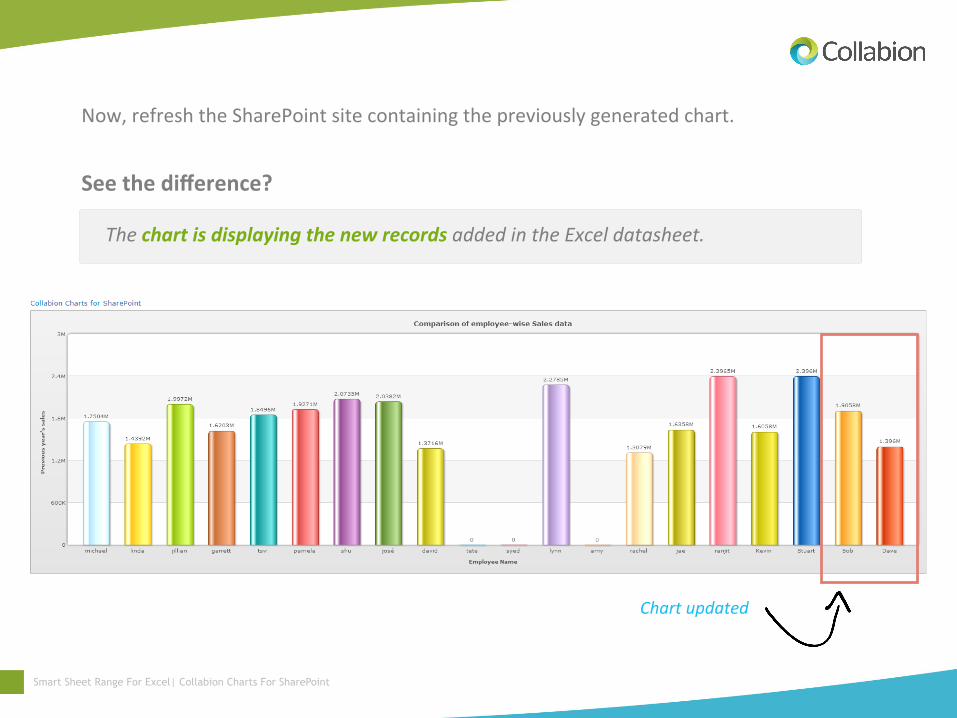
Chart updated
Now, refresh the SharePoint site containing the previously generated chart.
See the difference?
The chart is displaying the new records added in the Excel datasheet.
Smart Sheet Range For Excel| Collabion Charts For SharePoint
You can check by applying even more records to your excel datasheet and refreshing the page. Every @me you will get a chart reflec@ng the updated data! No need to go through the en?re chart genera?ng process again.
WOW-‐some! Isn’t it?
Smart Sheet Range For Excel| Collabion Charts For SharePoint

Happy char>ng!!
Hope this was useful and fun! We’re anyway a shout away and always ready to hear you out.
/collabion @collabion [email protected]
www.collabion.com