smart cars: who has the head start? -...
TRANSCRIPT
See important disclosures, including any required research certifications, beginning on page 70
26 June 2015
Smart cars: who has the head start?
• Smart cars now look set to hit the roads from 2025 • Over time we foresee the auto OEMs integrating the smart-car
value chain, led by Toyota, then GM and Ford • In order, our preferred Pan-Asia smart-car plays today are
Toyota, Denso and Hyundai Mobis
Pan-Asia Autos
Consumer Discretionary / Pan Asia
How do we justify our view?How do we justify our view?
Pan-Asia Autos 26 June 2015
- 2 -
Contents
Smart cars: changing the landscape ............................................................................................ 8
What will be the next smart device? ........................................................................................ 8
Smart cars: the industry’s next response to consumer needs ................................................ 10
What is a smart car? ................................................................................................................ 11
When will self-driving cars take to the roads? ....................................................................... 13
Smart-car market outlook more promising than ever ........................................................... 15
Smart-car market: OEM-leading value chain established .................................................... 20
Korea’s smart-car industry: currently behind the curve ........................................................ 27
Korea’s smart-car industry: who are the major beneficiaries? ............................................. 29
Valuations and recommendations ......................................................................................... 30
Risks to our investment case ................................................................................................. 38
Appendices ............................................................................................................................. 39
Company Section
Toyota Motor ...........................................................................................................................41
Denso ......................................................................................................................................45
Hyundai Mobis ....................................................................................................................... 49
Hyundai Motor ........................................................................................................................ 53
Kia Motors ...............................................................................................................................59
See important disclosures, including any required research certifications, beginning on page 70
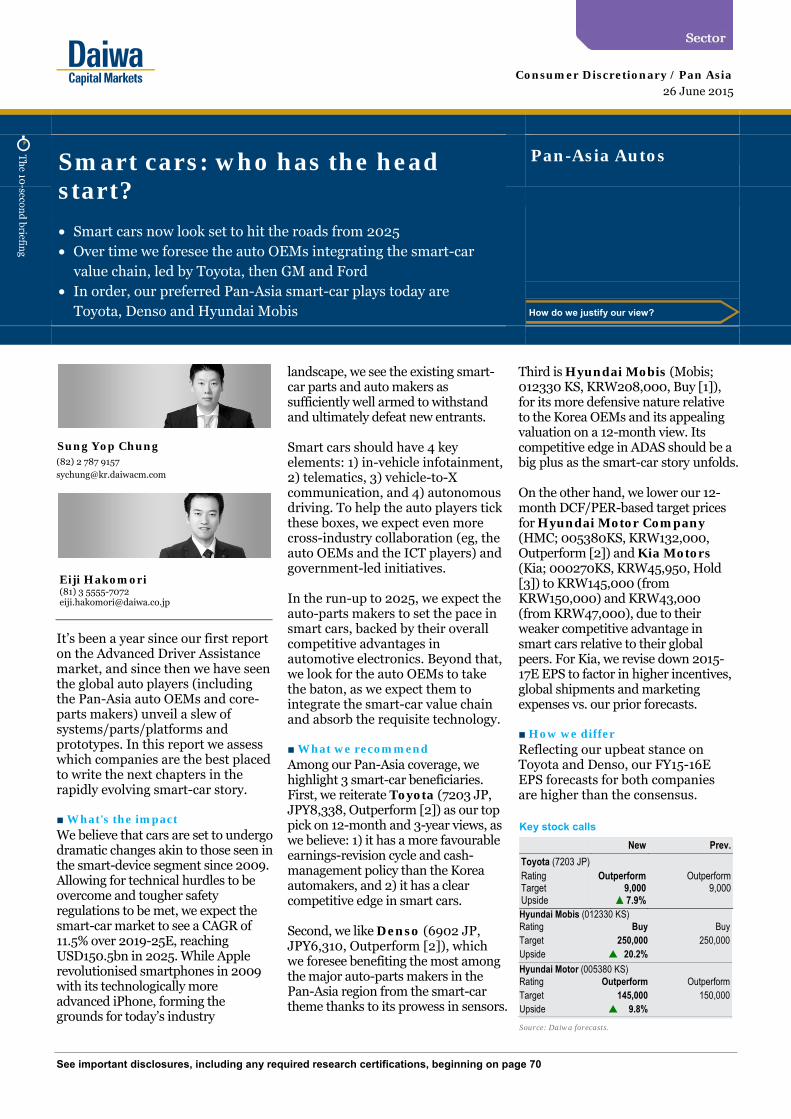
It’s been a year since our first report on the Advanced Driver Assistance market, and since then we have seen the global auto players (including the Pan-Asia auto OEMs and core-parts makers) unveil a slew of systems/parts/platforms and prototypes. In this report we assess which companies are the best placed to write the next chapters in the rapidly evolving smart-car story. ■ What's the impact We believe that cars are set to undergo dramatic changes akin to those seen in the smart-device segment since 2009. Allowing for technical hurdles to be overcome and tougher safety regulations to be met, we expect the smart-car market to see a CAGR of 11.5% over 2019-25E, reaching USD150.5bn in 2025. While Apple revolutionised smartphones in 2009 with its technologically more advanced iPhone, forming the grounds for today’s industry
landscape, we see the existing smart-car parts and auto makers as sufficiently well armed to withstand and ultimately defeat new entrants. Smart cars should have 4 key elements: 1) in-vehicle infotainment, 2) telematics, 3) vehicle-to-X communication, and 4) autonomous driving. To help the auto players tick these boxes, we expect even more cross-industry collaboration (eg, the auto OEMs and the ICT players) and government-led initiatives. In the run-up to 2025, we expect the auto-parts makers to set the pace in smart cars, backed by their overall competitive advantages in automotive electronics. Beyond that, we look for the auto OEMs to take the baton, as we expect them to integrate the smart-car value chain and absorb the requisite technology. ■ What we recommend Among our Pan-Asia coverage, we highlight 3 smart-car beneficiaries. First, we reiterate Toyota (7203 JP, JPY8,338, Outperform [2]) as our top pick on 12-month and 3-year views, as we believe: 1) it has a more favourable earnings-revision cycle and cash-management policy than the Korea automakers, and 2) it has a clear competitive edge in smart cars. Second, we like Denso (6902 JP, JPY6,310, Outperform [2]), which we foresee benefiting the most among the major auto-parts makers in the Pan-Asia region from the smart-car theme thanks to its prowess in sensors.
Third is Hyundai Mobis (Mobis; 012330 KS, KRW208,000, Buy [1]), for its more defensive nature relative to the Korea OEMs and its appealing valuation on a 12-month view. Its competitive edge in ADAS should be a big plus as the smart-car story unfolds. On the other hand, we lower our 12-month DCF/PER-based target prices for Hyundai Motor Company (HMC; 005380KS, KRW132,000, Outperform [2]) and Kia Motors (Kia; 000270KS, KRW45,950, Hold [3]) to KRW145,000 (from KRW150,000) and KRW43,000 (from KRW47,000), due to their weaker competitive advantage in smart cars relative to their global peers. For Kia, we revise down 2015-17E EPS to factor in higher incentives, global shipments and marketing expenses vs. our prior forecasts. ■ How we differ Reflecting our upbeat stance on Toyota and Denso, our FY15-16E EPS forecasts for both companies are higher than the consensus.
26 June 2015
Smart cars: who has the head start?
• Smart cars now look set to hit the roads from 2025 • Over time we foresee the auto OEMs integrating the smart-car
value chain, led by Toyota, then GM and Ford • In order, our preferred Pan-Asia smart-car plays today are
Toyota, Denso and Hyundai Mobis
Pan-Asia Autos
Eiji Hakomori (81) 3 5555-7072 [email protected]
Key stock calls
New Prev.
Toyota (7203 JP) RatingTarget Upside
Outperform 9,000
7.9%
Outperform9,000
Source: Daiwa forecasts.
Consumer Discretionary / Pan Asia
Sung Yop Chung(82) 2 787 [email protected]
Hyundai Mobis (012330 KS)Rating Buy BuyTarget 250,000 250,000Upside 20.2%
Hyundai Motor (005380 KS)Rating Outperform OutperformTarget 145,000 150,000Upside 9.8%
How do we justify our view?How do we justify our view?
Pan-Asia Autos 26 June 2015
- 4 -
How do we justify our view?
Growth outlook
Valuation
Earnings revisions
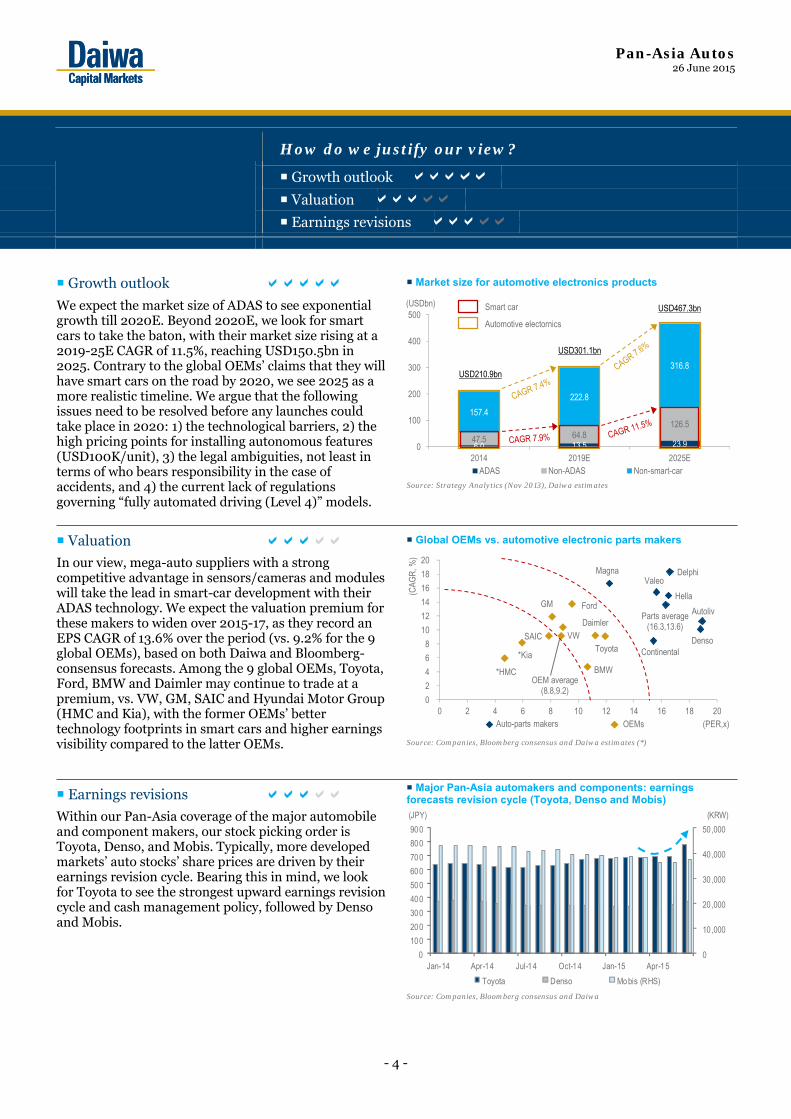
Growth outlook Market size for automotive electronics products
We expect the market size of ADAS to see exponentialgrowth till 2020E. Beyond 2020E, we look for smart cars to take the baton, with their market size rising at a 2019-25E CAGR of 11.5%, reaching USD150.5bn in 2025. Contrary to the global OEMs’ claims that they will have smart cars on the road by 2020, we see 2025 as a more realistic timeline. We argue that the following issues need to be resolved before any launches could take place in 2020: 1) the technological barriers, 2) the high pricing points for installing autonomous features (USD100K/unit), 3) the legal ambiguities, not least in terms of who bears responsibility in the case of accidents, and 4) the current lack of regulations governing “fully automated driving (Level 4)” models.
Source: Strategy Analytics (Nov 2013), Daiwa estimates
Valuation Global OEMs vs. automotive electronic parts makers
In our view, mega-auto suppliers with a strong competitive advantage in sensors/cameras and modules will take the lead in smart-car development with their ADAS technology. We expect the valuation premium for these makers to widen over 2015-17, as they record an EPS CAGR of 13.6% over the period (vs. 9.2% for the 9 global OEMs), based on both Daiwa and Bloomberg-consensus forecasts. Among the 9 global OEMs, Toyota, Ford, BMW and Daimler may continue to trade at a premium, vs. VW, GM, SAIC and Hyundai Motor Group (HMC and Kia), with the former OEMs’ better technology footprints in smart cars and higher earnings visibility compared to the latter OEMs.
Source: Companies, Bloomberg consensus and Daiwa estimates (*)
Earnings revisions Major Pan-Asia automakers and components: earnings forecasts revision cycle (Toyota, Denso and Mobis)
Within our Pan-Asia coverage of the major automobile and component makers, our stock picking order is Toyota, Denso, and Mobis. Typically, more developed markets’ auto stocks’ share prices are driven by their earnings revision cycle. Bearing this in mind, we look for Toyota to see the strongest upward earnings revision cycle and cash management policy, followed by Denso and Mobis.
Source: Companies, Bloomberg consensus and Daiwa
6.0 13.5 23.9 47.5 64.8 126.5
157.4
222.8
316.8
0
100
200
300
400
500
2014 2019E 2025EADAS Non-ADAS Non-smart-car
(USDbn)
USD210.9bn
USD301.1bn
USD467.3bnSmart car
Automotive electornics
FordGM
Daimler
BMW
VW
OEM average(8.8,9.2)
SAICToyota
*HMC
*Kia
Delphi
Autoliv
DensoContinental
MagnaValeo
Hella
Parts average(16.3,13.6)
0
2
4
6
8
10
12
14
16
18
20
0 2 4 6 8 10 12 14 16 18 20Auto-parts makers OEMs (PER,x)
(CAG
R, %
)
0
10 ,000
20,000
30,000
40,000
50,000
0
100
200
300
400
500
600
700
800
900
Jan-14 Apr-14 Jul-14 Oct-14 Jan-15 Apr-15
Toyota Denso Mobis (RHS)
(JPY) (KRW)
Pan-Asia Autos 26 June 2015
- 5 -
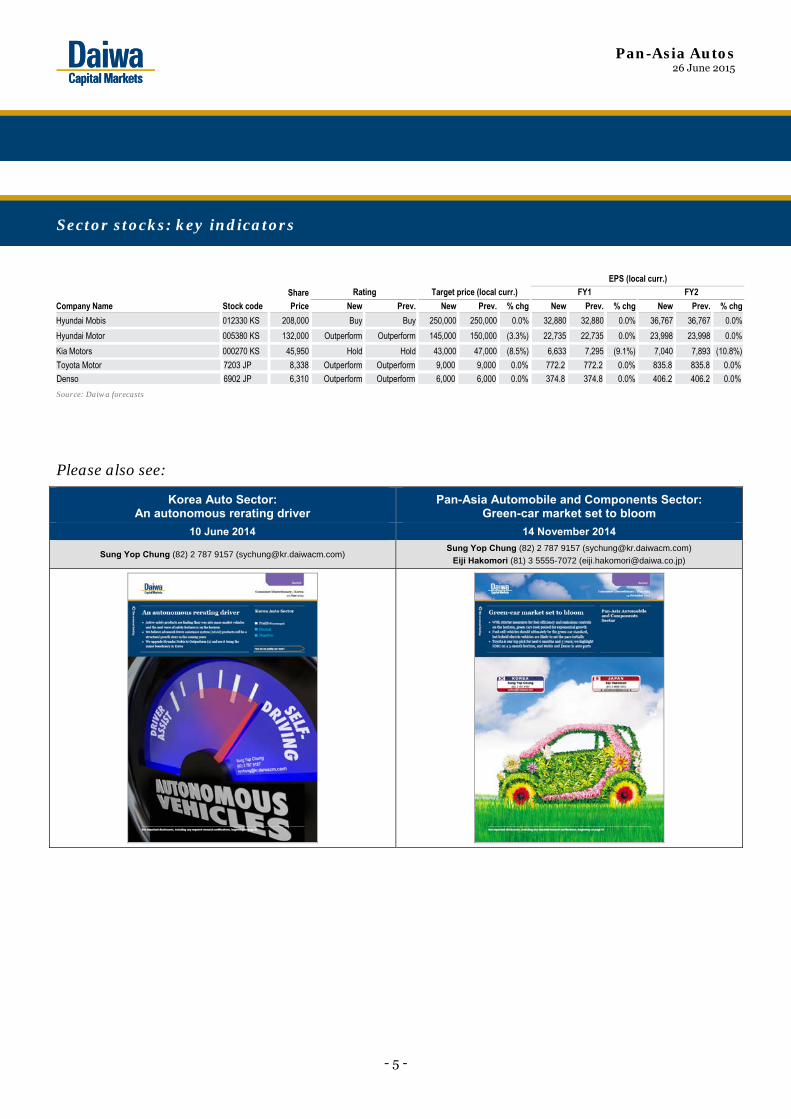
Toyota Motor 7203 JP 8,338 Outperform Outperform 9,000 9,000 0.0% 772.2 772.2 0.0% 835.8 835.8 0.0%
Denso 6902 JP 6,310 Outperform Outperform 6,000 6,000 0.0% 374.8 374.8 0.0% 406.2 406.2 0.0%
Source: Daiwa forecasts
Please also see:
Korea Auto Sector: An autonomous rerating driver
Pan-Asia Automobile and Components Sector: Green-car market set to bloom
10 June 2014 14 November 2014
Sung Yop Chung (82) 2 787 9157 ([email protected]) Sung Yop Chung (82) 2 787 9157 ([email protected])
Eiji Hakomori (81) 3 5555-7072 ([email protected])
Sector stocks: key indicators
Share
Company Name Stock code Price New Prev. New Prev. % chg New Prev. % chg New Prev. % chg
Hyundai Mobis 012330 KS 208,000 Buy Buy 250,000 250,000 0.0% 32,880 32,880 0.0% 36,767 36,767 0.0%
Hyundai Motor 005380 KS 132,000 Outperform Outperform 145,000 150,000 (3.3%) 22,735 22,735 0.0% 23,998 23,998 0.0%
Kia Motors 000270 KS 45,950 Hold Hold 43,000 47,000 (8.5%) 6,633 7,295 (9.1%) 7,040 7,893 (10.8%)
Rating Target price (local curr.) FY1
EPS (local curr.)
FY2
Pan-Asia Autos 26 June 2015
- 6 -
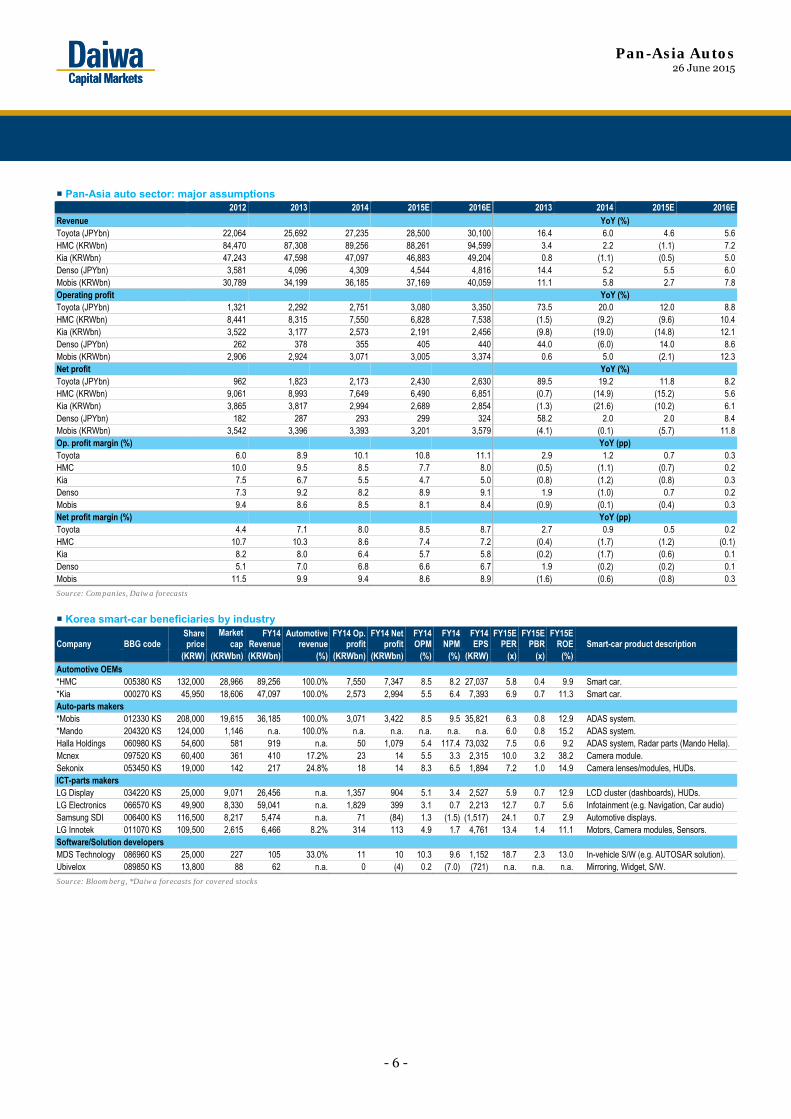
Pan-Asia auto sector: major assumptions 2012 2013 2014 2015E 2016E 2013 2014 2015E 2016ERevenue YoY (%) Toyota (JPYbn) 22,064 25,692 27,235 28,500 30,100 16.4 6.0 4.6 5.6 HMC (KRWbn) 84,470 87,308 89,256 88,261 94,599 3.4 2.2 (1.1) 7.2 Kia (KRWbn) 47,243 47,598 47,097 46,883 49,204 0.8 (1.1) (0.5) 5.0 Denso (JPYbn) 3,581 4,096 4,309 4,544 4,816 14.4 5.2 5.5 6.0 Mobis (KRWbn) 30,789 34,199 36,185 37,169 40,059 11.1 5.8 2.7 7.8 Operating profit YoY (%) Toyota (JPYbn) 1,321 2,292 2,751 3,080 3,350 73.5 20.0 12.0 8.8 HMC (KRWbn) 8,441 8,315 7,550 6,828 7,538 (1.5) (9.2) (9.6) 10.4 Kia (KRWbn) 3,522 3,177 2,573 2,191 2,456 (9.8) (19.0) (14.8) 12.1 Denso (JPYbn) 262 378 355 405 440 44.0 (6.0) 14.0 8.6 Mobis (KRWbn) 2,906 2,924 3,071 3,005 3,374 0.6 5.0 (2.1) 12.3 Net profit YoY (%) Toyota (JPYbn) 962 1,823 2,173 2,430 2,630 89.5 19.2 11.8 8.2 HMC (KRWbn) 9,061 8,993 7,649 6,490 6,851 (0.7) (14.9) (15.2) 5.6 Kia (KRWbn) 3,865 3,817 2,994 2,689 2,854 (1.3) (21.6) (10.2) 6.1 Denso (JPYbn) 182 287 293 299 324 58.2 2.0 2.0 8.4 Mobis (KRWbn) 3,542 3,396 3,393 3,201 3,579 (4.1) (0.1) (5.7) 11.8 Op. profit margin (%) YoY (pp) Toyota 6.0 8.9 10.1 10.8 11.1 2.9 1.2 0.7 0.3 HMC 10.0 9.5 8.5 7.7 8.0 (0.5) (1.1) (0.7) 0.2 Kia 7.5 6.7 5.5 4.7 5.0 (0.8) (1.2) (0.8) 0.3 Denso 7.3 9.2 8.2 8.9 9.1 1.9 (1.0) 0.7 0.2 Mobis 9.4 8.6 8.5 8.1 8.4 (0.9) (0.1) (0.4) 0.3 Net profit margin (%) YoY (pp) Toyota 4.4 7.1 8.0 8.5 8.7 2.7 0.9 0.5 0.2 HMC 10.7 10.3 8.6 7.4 7.2 (0.4) (1.7) (1.2) (0.1)Kia 8.2 8.0 6.4 5.7 5.8 (0.2) (1.7) (0.6) 0.1 Denso 5.1 7.0 6.8 6.6 6.7 1.9 (0.2) (0.2) 0.1 Mobis 11.5 9.9 9.4 8.6 8.9 (1.6) (0.6) (0.8) 0.3
Source: Companies, Daiwa forecasts
Korea smart-car beneficiaries by industry
Company BBG code Share price
Market cap
FY14 Revenue
Automotiverevenue
FY14 Op. profit
FY14 Net profit
FY14 OPM
FY14 NPM
FY14 EPS
FY15E PER
FY15EPBR
FY15E ROE Smart-car product description
(KRW) (KRWbn) (KRWbn) (%) (KRWbn) (KRWbn) (%) (%) (KRW) (x) (x) (%) Automotive OEMs *HMC 005380 KS 132,000 28,966 89,256 100.0% 7,550 7,347 8.5 8.2 27,037 5.8 0.4 9.9 Smart car. *Kia 000270 KS 45,950 18,606 47,097 100.0% 2,573 2,994 5.5 6.4 7,393 6.9 0.7 11.3 Smart car. Auto-parts makers *Mobis 012330 KS 208,000 19,615 36,185 100.0% 3,071 3,422 8.5 9.5 35,821 6.3 0.8 12.9 ADAS system. *Mando 204320 KS 124,000 1,146 n.a. 100.0% n.a. n.a. n.a. n.a. n.a. 6.0 0.8 15.2 ADAS system. Halla Holdings 060980 KS 54,600 581 919 n.a. 50 1,079 5.4 117.4 73,032 7.5 0.6 9.2 ADAS system, Radar parts (Mando Hella). Mcnex 097520 KS 60,400 361 410 17.2% 23 14 5.5 3.3 2,315 10.0 3.2 38.2 Camera module. Sekonix 053450 KS 19,000 142 217 24.8% 18 14 8.3 6.5 1,894 7.2 1.0 14.9 Camera lenses/modules, HUDs. ICT-parts makers LG Display 034220 KS 25,000 9,071 26,456 n.a. 1,357 904 5.1 3.4 2,527 5.9 0.7 12.9 LCD cluster (dashboards), HUDs. LG Electronics 066570 KS 49,900 8,330 59,041 n.a. 1,829 399 3.1 0.7 2,213 12.7 0.7 5.6 Infotainment (e.g. Navigation, Car audio) Samsung SDI 006400 KS 116,500 8,217 5,474 n.a. 71 (84) 1.3 (1.5) (1,517) 24.1 0.7 2.9 Automotive displays. LG Innotek 011070 KS 109,500 2,615 6,466 8.2% 314 113 4.9 1.7 4,761 13.4 1.4 11.1 Motors, Camera modules, Sensors. Software/Solution developers MDS Technology 086960 KS 25,000 227 105 33.0% 11 10 10.3 9.6 1,152 18.7 2.3 13.0 In-vehicle S/W (e.g. AUTOSAR solution). Ubivelox 089850 KS 13,800 88 62 n.a. 0 (4) 0.2 (7.0) (721) n.a. n.a. n.a. Mirroring, Widget, S/W.
Source: Bloomberg, *Daiwa forecasts for covered stocks
Pan-Asia Autos 26 June 2015
- 7 -
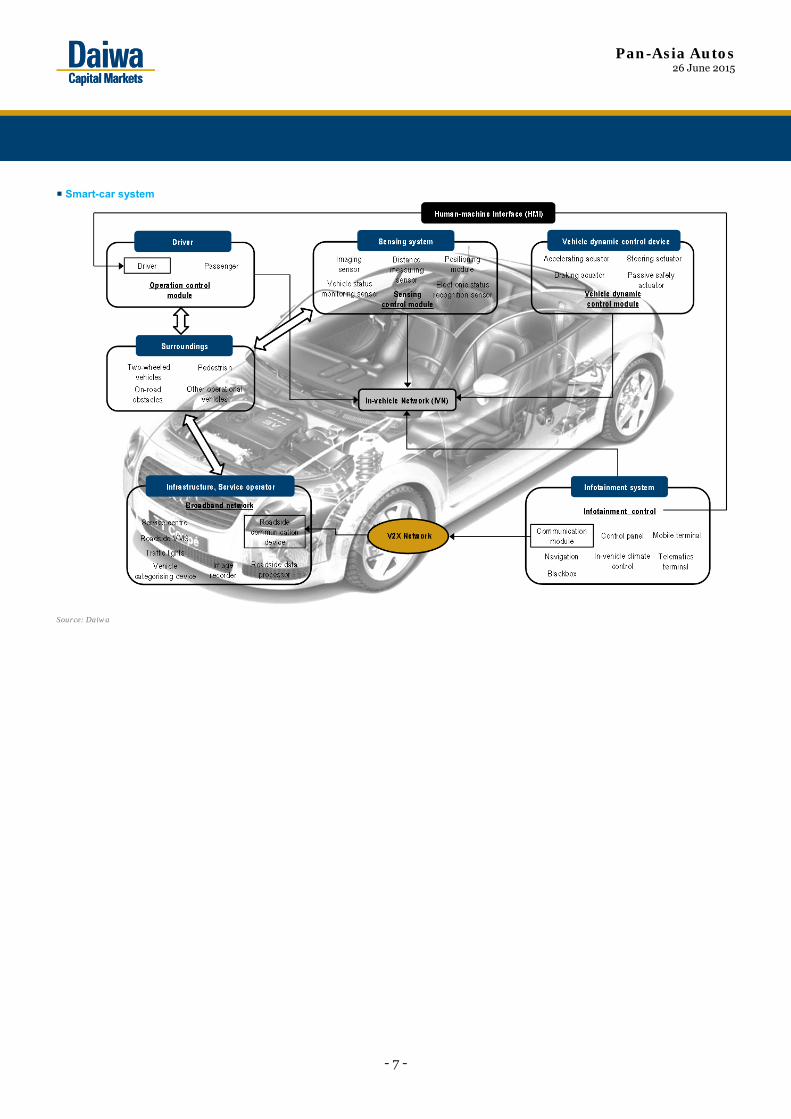
Smart-car system
Source: Daiwa
Pan-Asia Autos 26 June 2015
- 8 -
Smart cars: changing the landscape
What will be the next smart device?
Smartphones: successful after creating their own demand In the early 1990s, IT companies introduced the concept of the smartphone. The smartphone was based on an independent operating system (OS) that offered Internet-based utilities with the basic functions of an ordinary mobile device. However, due to its high price relative to its compatibility with consumers’ lifestyles at the time, the initial models failed to draw commercial attention from the market. IBM Simon: first smartphone ever made (1994)
Source: androidauthority
A decade later, the industry resumed its attempt to penetrate the market. However this time, the trend was led by mobile companies which were more aware of its target consumers. Starting with the Blackberry from RIM in the mid-2000s, smartphones began to be perceived as both a mobile device and a personal digital assistant (PDA). Then, in 2009, Apple introduced the iPhone with more advanced options such as touch screens and its application-oriented iOS, paving the way for today’s industry landscape.
As shown in the following chart, the penetration rate of smartphones globally is expected to reach 51.7% in 2018, from 38.4% in 2014. Smartphone users and penetration rate worldwide
Source: eMarketer
For the US market, the penetration rates for smartphones are much higher. The latest research by AC Nielsen indicates that smartphones accounted for 55% of phones. Smartphone and feature phone penetration in the US
Source: Nielsen.
Note: limited to mobile subscribers aged over 18
The statistics are even higher for Asia-Pacific countries. The Consumer Barometer’s survey in 2014 listed 5 APAC countries on its top-10 smartphone-penetrated markets with the average rate above 75%, whilst the US rate stayed at 57% in 2014. The 20 companies with highest smartphone penetration (2014) Country Penetration rate Country Penetration rateSingapore 85% Australia 66%South Korea 80% Netherlands 65%Sweden 75% Ireland 65%Hong Kong 74% Israel 62%Spain 72% Switzerland 58%China 70% New Zealand 57%Denmark 69% USA 57%UK 68% Canada 57%Norway 68% Austria 56%Taiwan 67% Italy 53%
Source: Consumer Barometer (2014)
34.338.4
42.946.4
49.5 51.7
0
10
20
30
40
50
60
0
1,000
2,000
3,000
4,000
5,000
6,000
2013 2014 2015E 2016E 2017E 2018E
Mobile phone users Smartphone users % smartphone users (RHS)
(Mil.) (%)
29 31 3035 36 38 37 38 41 42 43 44 44 46 48 48 50
51 52 53 55
71 69 7065 64 62 63 62 59 58 57 56 56 54 52 52 50
49 48 47 45
0
10
20
30
40
50
60
70
80
Oct
-10
Nov
-10
Dec
-10
Jan-
11
Feb-
11
Mar
-11
Apr-1
1
May
-11
Jun-
11
Jul-1
1
Aug-
11
Sep-
11
Oct
-11
Nov
-11
Dec
-11
Jan-
12
Feb-
12
Mar
-12
Apr-1
2
May
-12
Jun-
12Smartphone Feature phone
(%)
Pan-Asia Autos 26 June 2015
- 9 -
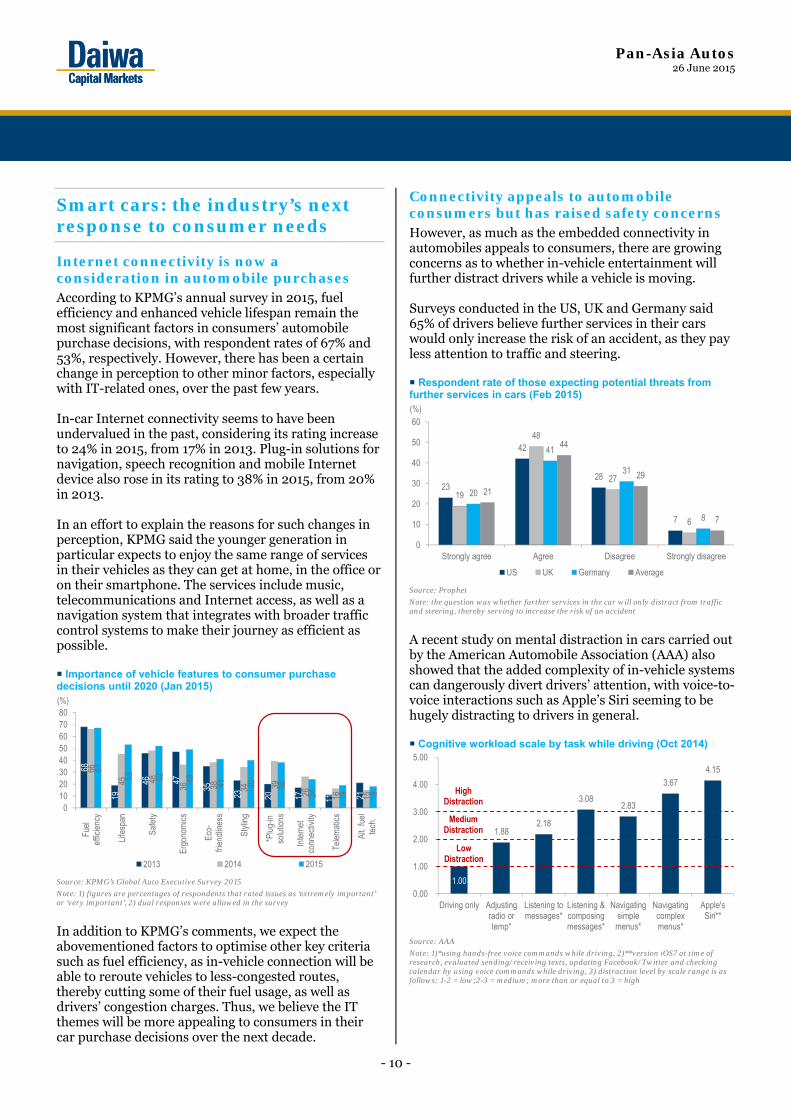
Smartphones: a new platform for Internet connection We believe the top feature that led the transition in the mobile device industry to the smartphone phase was the devices’ Internet-connectivity. According to the survey in 2011 (a period widely perceived as the early transition phase, from the feature phone phase to the smartphone phase), 60% of market respondents said they would purchase smartphones for their easier accessibility to PC sites compared to that of feature phones. Reasons feature phone users want to purchase smartphones (2011)
Source: D2 Communications
Note: 1) the survey was subject to feature phone-only users intending to purchase a smartphone, 2) the sample sizes were 1,201, 1,131 and 1,162 for Jan 2011, Jul 2011 and Oct 2011 surveys, respectively.
For those who responded that they had no intention of buying a smartphone in 2011, high expenses appeared to be one of the largest hurdles for purchase. Back in 1995, the Simon from IBM, the first smartphone ever introduced, sold for USD890, which is equivalent to around USD1,400 today. However, as the industry repeated its efforts to improve price efficiency, the ASPs of smartphones declined by 20%, compared to 2008.
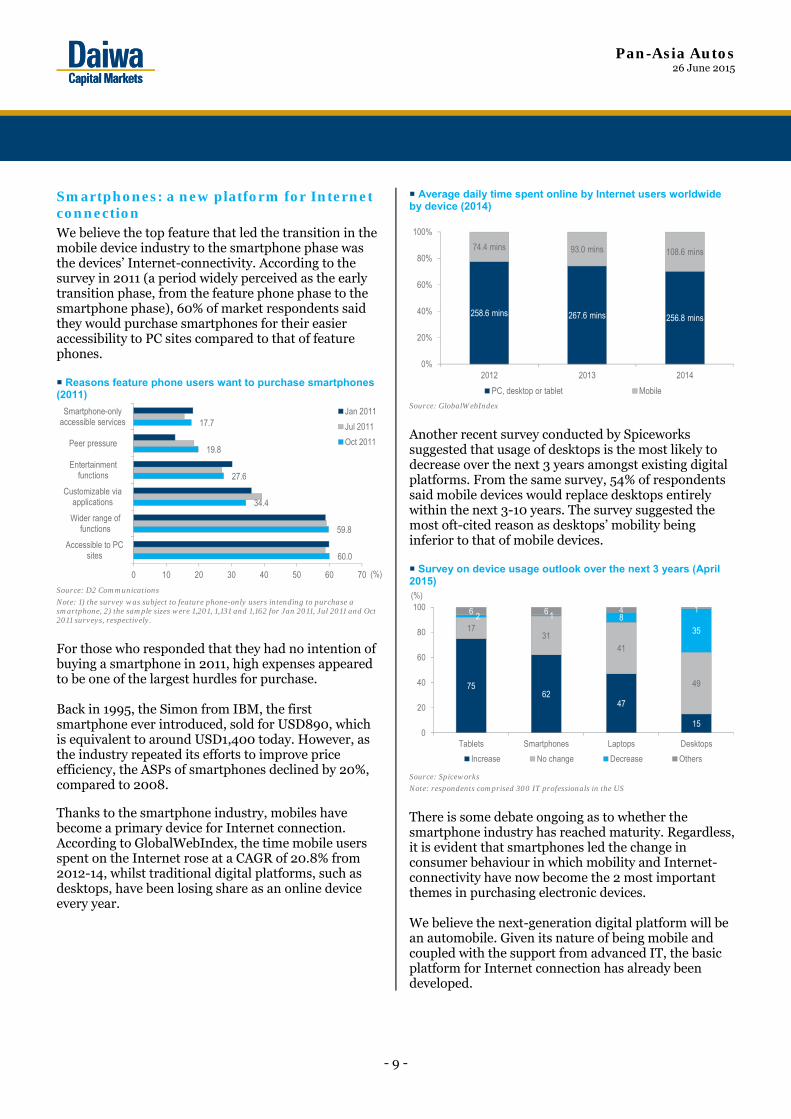
Thanks to the smartphone industry, mobiles have become a primary device for Internet connection. According to GlobalWebIndex, the time mobile users spent on the Internet rose at a CAGR of 20.8% from 2012-14, whilst traditional digital platforms, such as desktops, have been losing share as an online device every year.
Average daily time spent online by Internet users worldwide by device (2014)
Source: GlobalWebIndex
Another recent survey conducted by Spiceworks suggested that usage of desktops is the most likely to decrease over the next 3 years amongst existing digital platforms. From the same survey, 54% of respondents said mobile devices would replace desktops entirely within the next 3-10 years. The survey suggested the most oft-cited reason as desktops’ mobility being inferior to that of mobile devices. Survey on device usage outlook over the next 3 years (April 2015)
Source: Spiceworks
Note: respondents comprised 300 IT professionals in the US
There is some debate ongoing as to whether the smartphone industry has reached maturity. Regardless, it is evident that smartphones led the change in consumer behaviour in which mobility and Internet-connectivity have now become the 2 most important themes in purchasing electronic devices. We believe the next-generation digital platform will be an automobile. Given its nature of being mobile and coupled with the support from advanced IT, the basic platform for Internet connection has already been developed.
60.0
59.8
34.4
27.6
19.8
17.7
0 10 20 30 40 50 60 70
Accessible to PCsites
Wider range offunctions
Customizable viaapplications
Entertainmentfunctions
Peer pressure
Smartphone-onlyaccessible services
Jan 2011
Jul 2011
Oct 2011
(%)
258.6 mins 267.6 mins 256.8 mins
74.4 mins 93.0 mins 108.6 mins
0%
20%
40%
60%
80%
100%
2012 2013 2014
PC, desktop or tablet Mobile
7562
47
15
1731
41
49
2 1 8
35
6 6 4 1
0
20
40
60
80
100
Tablets Smartphones Laptops Desktops
Increase No change Decrease Others
(%)
Pan-Asia Autos 26 June 2015
- 10 -
Smart cars: the industry’s next response to consumer needs
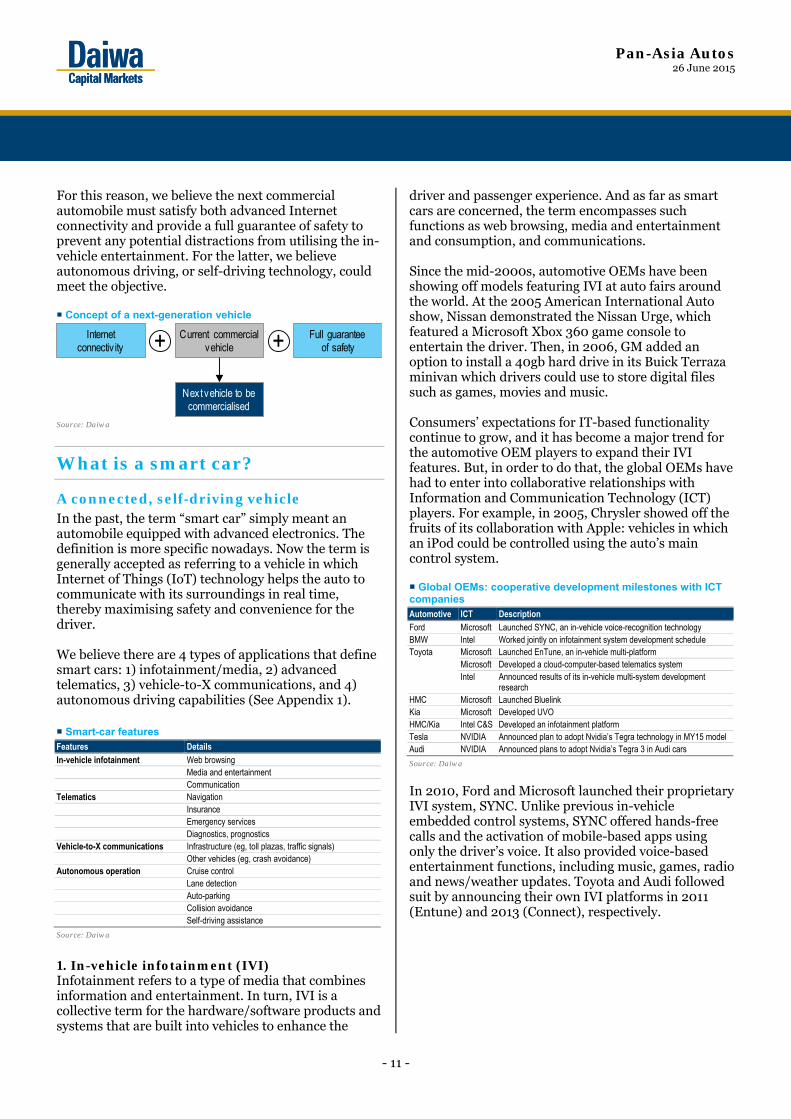
Internet connectivity is now a consideration in automobile purchases According to KPMG’s annual survey in 2015, fuel efficiency and enhanced vehicle lifespan remain the most significant factors in consumers’ automobile purchase decisions, with respondent rates of 67% and 53%, respectively. However, there has been a certain change in perception to other minor factors, especially with IT-related ones, over the past few years. In-car Internet connectivity seems to have been undervalued in the past, considering its rating increase to 24% in 2015, from 17% in 2013. Plug-in solutions for navigation, speech recognition and mobile Internet device also rose in its rating to 38% in 2015, from 20% in 2013. In an effort to explain the reasons for such changes in perception, KPMG said the younger generation in particular expects to enjoy the same range of services in their vehicles as they can get at home, in the office or on their smartphone. The services include music, telecommunications and Internet access, as well as a navigation system that integrates with broader traffic control systems to make their journey as efficient as possible. Importance of vehicle features to consumer purchase decisions until 2020 (Jan 2015)
Source: KPMG’s Global Auto Executive Survey 2015
Note: 1) figures are percentages of respondents that rated issues as ‘extremely important’ or ‘very important’, 2) dual responses were allowed in the survey
In addition to KPMG’s comments, we expect the abovementioned factors to optimise other key criteria such as fuel efficiency, as in-vehicle connection will be able to reroute vehicles to less-congested routes, thereby cutting some of their fuel usage, as well as drivers’ congestion charges. Thus, we believe the IT themes will be more appealing to consumers in their car purchase decisions over the next decade.
Connectivity appeals to automobile consumers but has raised safety concerns However, as much as the embedded connectivity in automobiles appeals to consumers, there are growing concerns as to whether in-vehicle entertainment will further distract drivers while a vehicle is moving. Surveys conducted in the US, UK and Germany said 65% of drivers believe further services in their cars would only increase the risk of an accident, as they pay less attention to traffic and steering. Respondent rate of those expecting potential threats from further services in cars (Feb 2015)
Source: Prophet
Note: the question was whether further services in the car will only distract from traffic and steering, thereby serving to increase the risk of an accident
A recent study on mental distraction in cars carried out by the American Automobile Association (AAA) also showed that the added complexity of in-vehicle systems can dangerously divert drivers’ attention, with voice-to-voice interactions such as Apple’s Siri seeming to be hugely distracting to drivers in general. Cognitive workload scale by task while driving (Oct 2014)
Source: AAA
Note: 1)*using hands-free voice commands while driving, 2)**version iOS7 at time of research, evaluated sending/receiving texts, updating Facebook/Twitter and checking calendar by using voice commands while driving, 3) distraction level by scale range is as follows: 1-2 = low;2-3 = medium; more than or equal to 3 = high
68
19
46 47
35
23 20 17 11 21
66
45 48
36 38 34 39
26 16 15
67
53 52 49 41 40 38
24 19 18
01020304050607080
Fuel
effic
ienc
y
Life
span
Safe
ty
Ergo
nom
ics
Eco-
frien
dlin
ess
Styl
ing
*Plu
g-in
solu
tions
Inte
rnet
conn
ectiv
ity
Tele
mat
ics
Alt.
fuel
tech
.
2013 2014 2015
(%)
23
42
28
7
19
48
27
6
20
41
31
8
21
44
29
7
0
10
20
30
40
50
60
Strongly agree Agree Disagree Strongly disagree
US UK Germany Average
(%)
1.00
1.882.18
3.082.83
3.674.15
0.00
1.00
2.00
3.00
4.00
5.00
Driving only Adjustingradio ortemp*
Listening tomessages*
Listening &composingmessages*
Navigatingsimplemenus*
Navigatingcomplexmenus*
Apple'sSiri**
HighDistraction
MediumDistraction
LowDistraction
Pan-Asia Autos 26 June 2015
- 11 -
For this reason, we believe the next commercial automobile must satisfy both advanced Internet connectivity and provide a full guarantee of safety to prevent any potential distractions from utilising the in-vehicle entertainment. For the latter, we believe autonomous driving, or self-driving technology, could meet the objective. Concept of a next-generation vehicle
Source: Daiwa
What is a smart car?
A connected, self-driving vehicle In the past, the term “smart car” simply meant an automobile equipped with advanced electronics. The definition is more specific nowadays. Now the term is generally accepted as referring to a vehicle in which Internet of Things (IoT) technology helps the auto to communicate with its surroundings in real time, thereby maximising safety and convenience for the driver. We believe there are 4 types of applications that define smart cars: 1) infotainment/media, 2) advanced telematics, 3) vehicle-to-X communications, and 4) autonomous driving capabilities (See Appendix 1). Smart-car features Features Details In-vehicle infotainment Web browsing
Media and entertainment Communication
Telematics Navigation Insurance Emergency services Diagnostics, prognostics
Vehicle-to-X communications Infrastructure (eg, toll plazas, traffic signals) Other vehicles (eg, crash avoidance)
Autonomous operation Cruise control Lane detection Auto-parking Collision avoidance Self-driving assistance
Source: Daiwa
1. In-vehicle infotainment (IVI) Infotainment refers to a type of media that combines information and entertainment. In turn, IVI is a collective term for the hardware/software products and systems that are built into vehicles to enhance the
driver and passenger experience. And as far as smart cars are concerned, the term encompasses such functions as web browsing, media and entertainment and consumption, and communications. Since the mid-2000s, automotive OEMs have been showing off models featuring IVI at auto fairs around the world. At the 2005 American International Auto show, Nissan demonstrated the Nissan Urge, which featured a Microsoft Xbox 360 game console to entertain the driver. Then, in 2006, GM added an option to install a 40gb hard drive in its Buick Terraza minivan which drivers could use to store digital files such as games, movies and music. Consumers’ expectations for IT-based functionality continue to grow, and it has become a major trend for the automotive OEM players to expand their IVI features. But, in order to do that, the global OEMs have had to enter into collaborative relationships with Information and Communication Technology (ICT) players. For example, in 2005, Chrysler showed off the fruits of its collaboration with Apple: vehicles in which an iPod could be controlled using the auto’s main control system. Global OEMs: cooperative development milestones with ICT companies Automotive ICT Description Ford Microsoft Launched SYNC, an in-vehicle voice-recognition technology BMW Intel Worked jointly on infotainment system development schedule Toyota Microsoft Launched EnTune, an in-vehicle multi-platform Microsoft Developed a cloud-computer-based telematics system Intel Announced results of its in-vehicle multi-system development
research HMC Microsoft Launched Bluelink Kia Microsoft Developed UVO HMC/Kia Intel C&S Developed an infotainment platform Tesla NVIDIA Announced plan to adopt Nvidia’s Tegra technology in MY15 model Audi NVIDIA Announced plans to adopt Nvidia’s Tegra 3 in Audi cars
Source: Daiwa
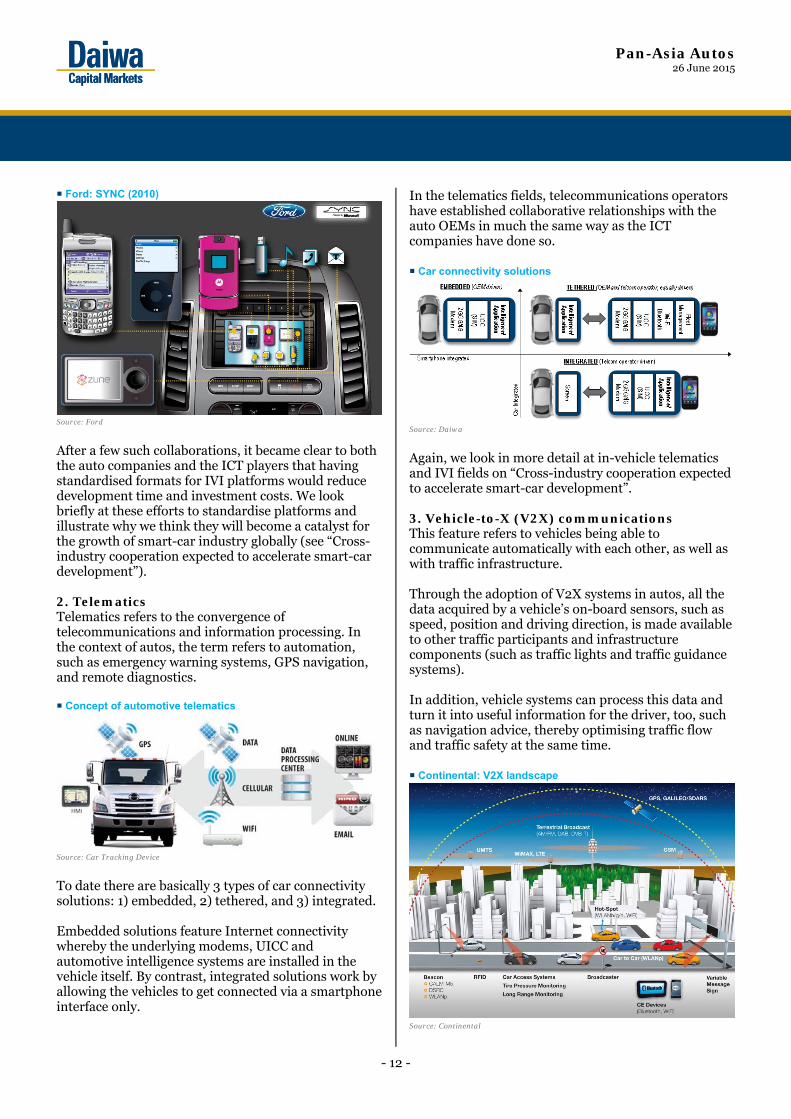
In 2010, Ford and Microsoft launched their proprietary IVI system, SYNC. Unlike previous in-vehicle embedded control systems, SYNC offered hands-free calls and the activation of mobile-based apps using only the driver’s voice. It also provided voice-based entertainment functions, including music, games, radio and news/weather updates. Toyota and Audi followed suit by announcing their own IVI platforms in 2011 (Entune) and 2013 (Connect), respectively.
Current commercial vehicle
Internetconnectiv ity
Full guaranteeof safety
Nextvehicle to be commercialised
+ +
Pan-Asia Autos 26 June 2015
- 12 -
Ford: SYNC (2010)
Source: Ford
After a few such collaborations, it became clear to both the auto companies and the ICT players that having standardised formats for IVI platforms would reduce development time and investment costs. We look briefly at these efforts to standardise platforms and illustrate why we think they will become a catalyst for the growth of smart-car industry globally (see “Cross-industry cooperation expected to accelerate smart-car development”). 2. Telematics Telematics refers to the convergence of telecommunications and information processing. In the context of autos, the term refers to automation, such as emergency warning systems, GPS navigation, and remote diagnostics. Concept of automotive telematics
Source: Car Tracking Device
To date there are basically 3 types of car connectivity solutions: 1) embedded, 2) tethered, and 3) integrated. Embedded solutions feature Internet connectivity whereby the underlying modems, UICC and automotive intelligence systems are installed in the vehicle itself. By contrast, integrated solutions work by allowing the vehicles to get connected via a smartphone interface only.
In the telematics fields, telecommunications operators have established collaborative relationships with the auto OEMs in much the same way as the ICT companies have done so. Car connectivity solutions
Source: Daiwa
Again, we look in more detail at in-vehicle telematics and IVI fields on “Cross-industry cooperation expected to accelerate smart-car development”. 3. Vehicle-to-X (V2X) communications This feature refers to vehicles being able to communicate automatically with each other, as well as with traffic infrastructure. Through the adoption of V2X systems in autos, all the data acquired by a vehicle’s on-board sensors, such as speed, position and driving direction, is made available to other traffic participants and infrastructure components (such as traffic lights and traffic guidance systems). In addition, vehicle systems can process this data and turn it into useful information for the driver, too, such as navigation advice, thereby optimising traffic flow and traffic safety at the same time. Continental: V2X landscape
Source: Continental
Pan-Asia Autos 26 June 2015
- 13 -
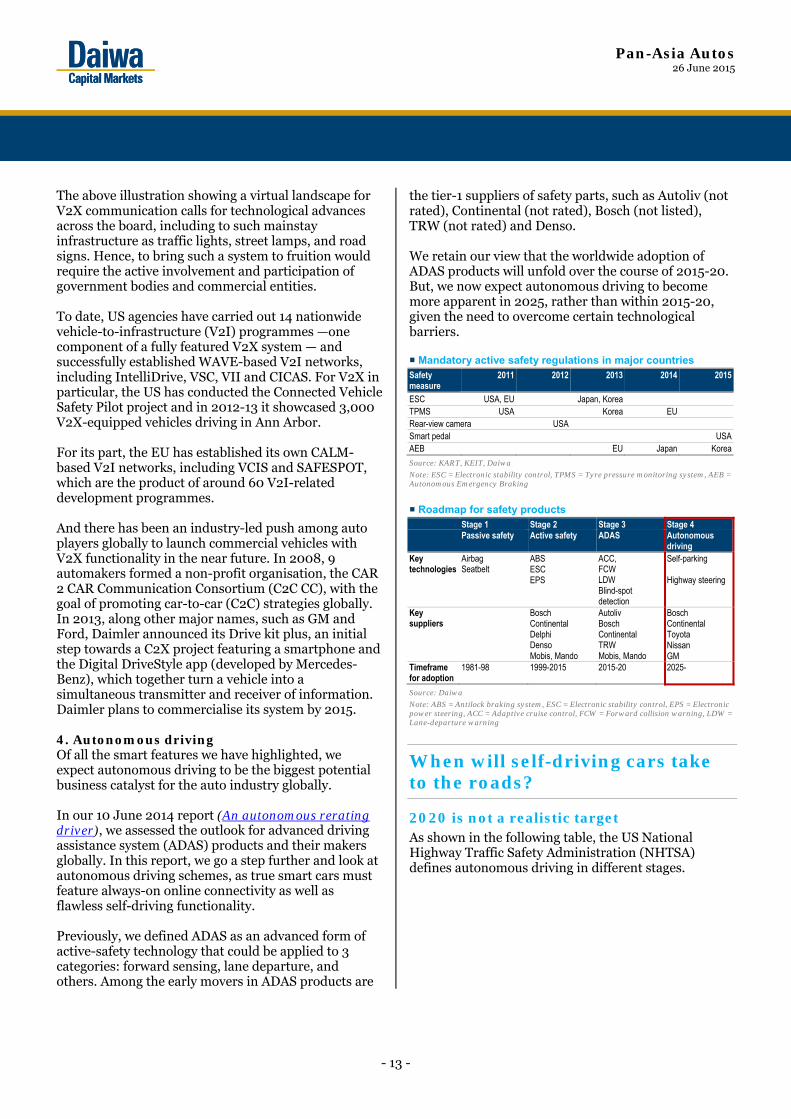
The above illustration showing a virtual landscape for V2X communication calls for technological advances across the board, including to such mainstay infrastructure as traffic lights, street lamps, and road signs. Hence, to bring such a system to fruition would require the active involvement and participation of government bodies and commercial entities. To date, US agencies have carried out 14 nationwide vehicle-to-infrastructure (V2I) programmes —one component of a fully featured V2X system — and successfully established WAVE-based V2I networks, including IntelliDrive, VSC, VII and CICAS. For V2X in particular, the US has conducted the Connected Vehicle Safety Pilot project and in 2012-13 it showcased 3,000 V2X-equipped vehicles driving in Ann Arbor. For its part, the EU has established its own CALM-based V2I networks, including VCIS and SAFESPOT, which are the product of around 60 V2I-related development programmes. And there has been an industry-led push among auto players globally to launch commercial vehicles with V2X functionality in the near future. In 2008, 9 automakers formed a non-profit organisation, the CAR 2 CAR Communication Consortium (C2C CC), with the goal of promoting car-to-car (C2C) strategies globally. In 2013, along other major names, such as GM and Ford, Daimler announced its Drive kit plus, an initial step towards a C2X project featuring a smartphone and the Digital DriveStyle app (developed by Mercedes-Benz), which together turn a vehicle into a simultaneous transmitter and receiver of information. Daimler plans to commercialise its system by 2015. 4. Autonomous driving Of all the smart features we have highlighted, we expect autonomous driving to be the biggest potential business catalyst for the auto industry globally. In our 10 June 2014 report (An autonomous rerating driver), we assessed the outlook for advanced driving assistance system (ADAS) products and their makers globally. In this report, we go a step further and look at autonomous driving schemes, as true smart cars must feature always-on online connectivity as well as flawless self-driving functionality. Previously, we defined ADAS as an advanced form of active-safety technology that could be applied to 3 categories: forward sensing, lane departure, and others. Among the early movers in ADAS products are
the tier-1 suppliers of safety parts, such as Autoliv (not rated), Continental (not rated), Bosch (not listed), TRW (not rated) and Denso. We retain our view that the worldwide adoption of ADAS products will unfold over the course of 2015-20. But, we now expect autonomous driving to become more apparent in 2025, rather than within 2015-20, given the need to overcome certain technological barriers. Mandatory active safety regulations in major countries Safety measure
2011 2012 2013 2014 2015
ESC USA, EU Japan, Korea TPMS USA Korea EURear-view camera USA Smart pedal USAAEB EU Japan Korea
Source: KART, KEIT, Daiwa
Note: ESC = Electronic stability control, TPMS = Tyre pressure monitoring system, AEB = Autonomous Emergency Braking
Roadmap for safety products
Stage 1 Stage 2 Stage 3 Stage 4 Passive safety Active safety ADAS Autonomous
driving Key technologies
Airbag Seatbelt
ABS ESC EPS
ACC, FCW LDW Blind-spot detection
Self-parking Highway steering
Key suppliers
Bosch Continental Delphi Denso Mobis, Mando
Autoliv Bosch Continental TRW Mobis, Mando
Bosch Continental Toyota Nissan GM
Timeframe for adoption
1981-98 1999-2015 2015-20 2025-
Source: Daiwa
Note: ABS = Antilock braking system, ESC = Electronic stability control, EPS = Electronic power steering, ACC = Adaptive cruise control, FCW = Forward collision warning, LDW = Lane-departure warning
When will self-driving cars take to the roads?
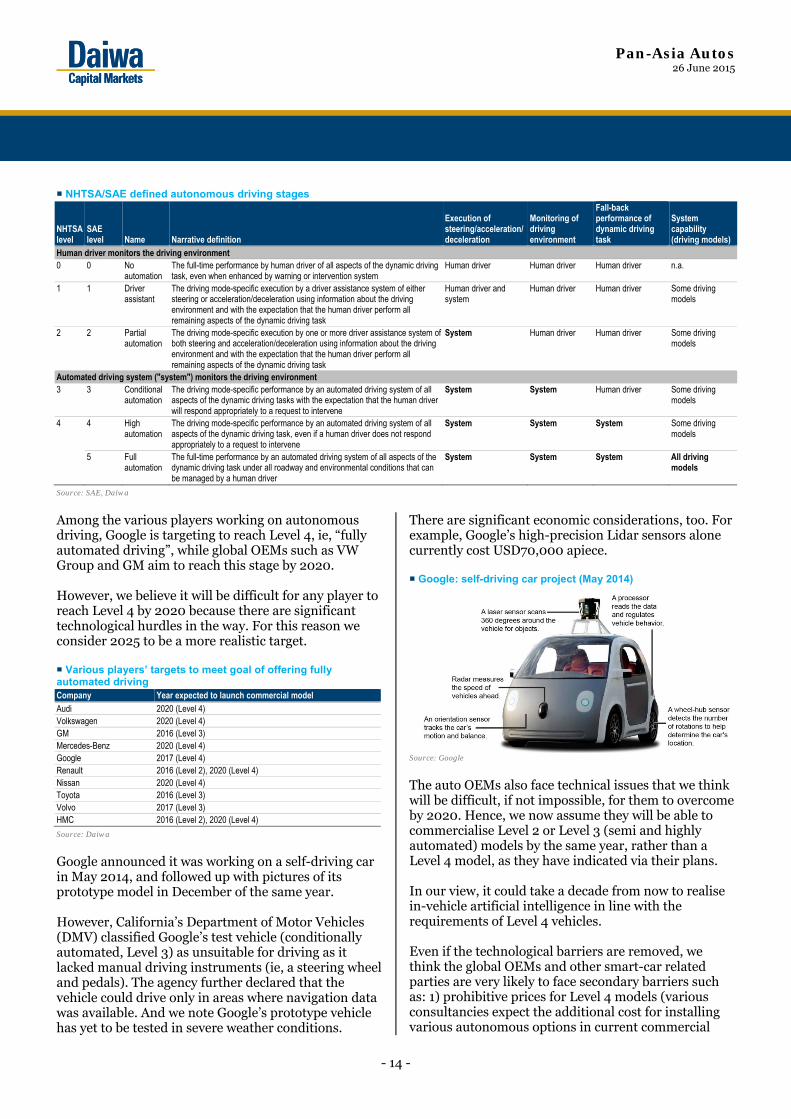
2020 is not a realistic target As shown in the following table, the US National Highway Traffic Safety Administration (NHTSA) defines autonomous driving in different stages.
Pan-Asia Autos 26 June 2015
- 14 -
NHTSA/SAE defined autonomous driving stages
NHTSA level
SAE level Name Narrative definition
Execution of steering/acceleration/deceleration
Monitoring of driving environment
Fall-back performance of dynamic driving task
System capability (driving models)
Human driver monitors the driving environment 0 0 No
automation The full-time performance by human driver of all aspects of the dynamic driving task, even when enhanced by warning or intervention system
Human driver Human driver Human driver n.a.
1 1 Driver assistant
The driving mode-specific execution by a driver assistance system of either steering or acceleration/deceleration using information about the driving environment and with the expectation that the human driver perform all remaining aspects of the dynamic driving task
Human driver and system
Human driver Human driver Some driving models
2 2 Partial automation
The driving mode-specific execution by one or more driver assistance system of both steering and acceleration/deceleration using information about the driving environment and with the expectation that the human driver perform all remaining aspects of the dynamic driving task
System Human driver Human driver Some driving models
Automated driving system ("system") monitors the driving environment 3 3 Conditional
automation The driving mode-specific performance by an automated driving system of all aspects of the dynamic driving tasks with the expectation that the human driver will respond appropriately to a request to intervene
System System Human driver Some driving models
4 4 High automation
The driving mode-specific performance by an automated driving system of all aspects of the dynamic driving task, even if a human driver does not respond appropriately to a request to intervene
System System System Some driving models
5 Full automation
The full-time performance by an automated driving system of all aspects of the dynamic driving task under all roadway and environmental conditions that can be managed by a human driver
System System System All driving models
Source: SAE, Daiwa
Among the various players working on autonomous driving, Google is targeting to reach Level 4, ie, “fully automated driving”, while global OEMs such as VW Group and GM aim to reach this stage by 2020. However, we believe it will be difficult for any player to reach Level 4 by 2020 because there are significant technological hurdles in the way. For this reason we consider 2025 to be a more realistic target. Various players’ targets to meet goal of offering fully automated driving Company Year expected to launch commercial model Audi 2020 (Level 4) Volkswagen 2020 (Level 4) GM 2016 (Level 3) Mercedes-Benz 2020 (Level 4) Google 2017 (Level 4) Renault 2016 (Level 2), 2020 (Level 4) Nissan 2020 (Level 4) Toyota 2016 (Level 3) Volvo 2017 (Level 3) HMC 2016 (Level 2), 2020 (Level 4)
Source: Daiwa
Google announced it was working on a self-driving car in May 2014, and followed up with pictures of its prototype model in December of the same year. However, California’s Department of Motor Vehicles (DMV) classified Google’s test vehicle (conditionally automated, Level 3) as unsuitable for driving as it lacked manual driving instruments (ie, a steering wheel and pedals). The agency further declared that the vehicle could drive only in areas where navigation data was available. And we note Google’s prototype vehicle has yet to be tested in severe weather conditions.
There are significant economic considerations, too. For example, Google’s high-precision Lidar sensors alone currently cost USD70,000 apiece. Google: self-driving car project (May 2014)
Source: Google
The auto OEMs also face technical issues that we think will be difficult, if not impossible, for them to overcome by 2020. Hence, we now assume they will be able to commercialise Level 2 or Level 3 (semi and highly automated) models by the same year, rather than a Level 4 model, as they have indicated via their plans. In our view, it could take a decade from now to realise in-vehicle artificial intelligence in line with the requirements of Level 4 vehicles. Even if the technological barriers are removed, we think the global OEMs and other smart-car related parties are very likely to face secondary barriers such as: 1) prohibitive prices for Level 4 models (various consultancies expect the additional cost for installing various autonomous options in current commercial
Pan-Asia Autos 26 June 2015
- 15 -
models to reach USD100,000/unit), 2) legal ambiguities, not least in terms of who bears responsibility in the case of accidents, 3) the danger of privacy invasion, and 4) the current lack of regulations governing “fully automated driving (Level 4)” models.
Smart-car market outlook more promising than ever
Ingredients for growth already secured Considering the high level of specialisation required for each feature in a smart car, we think the market can only expand in size if its corresponding markets expand in a similar manner. In 2010, automotive electronics accounted for 30% of the total cost of manufacturing a car. Given the encouraging growth of the electricity-reliant car market, including green cars, such as FCVs and HEVs (see our report “Green-car market set to bloom”, published on 17 November 2014), we see strong potential for the cost proportion of automotive electronics parts to reach 50% by 2030. Automotive electronics parts (% of manufacturing costs for cars)
Source: PwC analysis
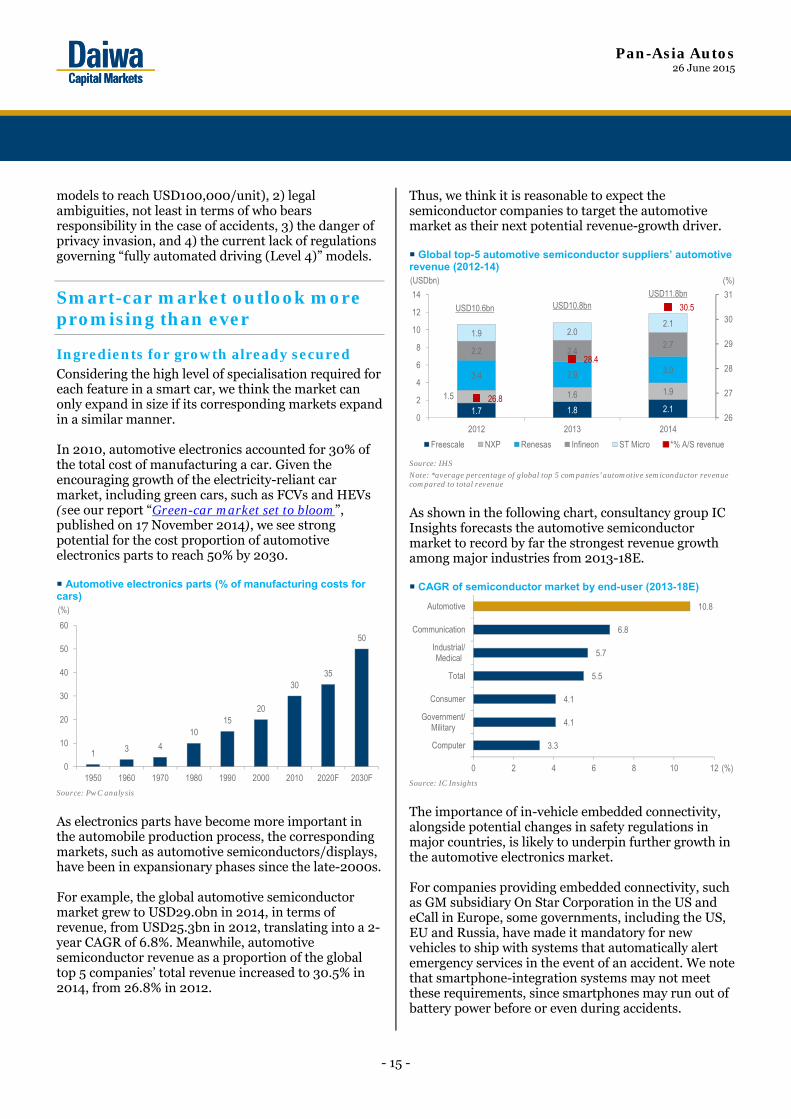
As electronics parts have become more important in the automobile production process, the corresponding markets, such as automotive semiconductors/displays, have been in expansionary phases since the late-2000s. For example, the global automotive semiconductor market grew to USD29.0bn in 2014, in terms of revenue, from USD25.3bn in 2012, translating into a 2-year CAGR of 6.8%. Meanwhile, automotive semiconductor revenue as a proportion of the global top 5 companies’ total revenue increased to 30.5% in 2014, from 26.8% in 2012.
Thus, we think it is reasonable to expect the semiconductor companies to target the automotive market as their next potential revenue-growth driver. Global top-5 automotive semiconductor suppliers’ automotive revenue (2012-14)
Source: IHS
Note: *average percentage of global top 5 companies’ automotive semiconductor revenue compared to total revenue
As shown in the following chart, consultancy group IC Insights forecasts the automotive semiconductor market to record by far the strongest revenue growth among major industries from 2013-18E. CAGR of semiconductor market by end-user (2013-18E)
Source: IC Insights
The importance of in-vehicle embedded connectivity, alongside potential changes in safety regulations in major countries, is likely to underpin further growth in the automotive electronics market. For companies providing embedded connectivity, such as GM subsidiary On Star Corporation in the US and eCall in Europe, some governments, including the US, EU and Russia, have made it mandatory for new vehicles to ship with systems that automatically alert emergency services in the event of an accident. We note that smartphone-integration systems may not meet these requirements, since smartphones may run out of battery power before or even during accidents.
1 3 4
1015
20
3035
50
0
10
20
30
40
50
60
1950 1960 1970 1980 1990 2000 2010 2020F 2030F
(%)
1.7 1.8 2.11.5 1.6 1.9
3.4 2.9 3.0
2.2 2.42.7
1.9 2.02.1
26.8
28.4
30.5
26
27
28
29
30
31
0
2
4
6
8
10
12
14
2012 2013 2014
Freescale NXP Renesas Infineon ST Micro *% A/S revenue
(USDbn) (%)
USD10.6bn USD10.8bnUSD11.8bn
3.3
4.1
4.1
5.5
5.7
6.8
10.8
0 2 4 6 8 10 12
Computer
Government/Military
Consumer
Total
Industrial/Medical
Communication
Automotive
(%)
Pan-Asia Autos 26 June 2015
- 16 -
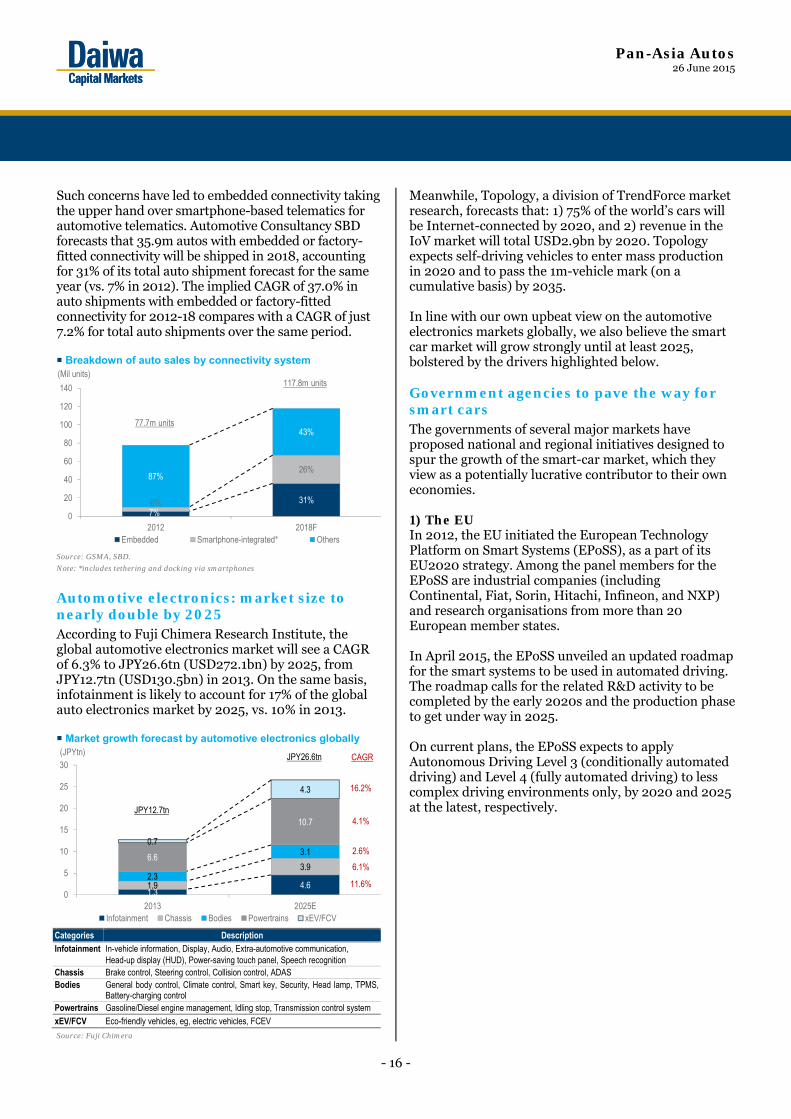
Such concerns have led to embedded connectivity taking the upper hand over smartphone-based telematics for automotive telematics. Automotive Consultancy SBD forecasts that 35.9m autos with embedded or factory-fitted connectivity will be shipped in 2018, accounting for 31% of its total auto shipment forecast for the same year (vs. 7% in 2012). The implied CAGR of 37.0% in auto shipments with embedded or factory-fitted connectivity for 2012-18 compares with a CAGR of just 7.2% for total auto shipments over the same period. Breakdown of auto sales by connectivity system
Source: GSMA, SBD.
Note: *includes tethering and docking via smartphones
Automotive electronics: market size to nearly double by 2025 According to Fuji Chimera Research Institute, the global automotive electronics market will see a CAGR of 6.3% to JPY26.6tn (USD272.1bn) by 2025, from JPY12.7tn (USD130.5bn) in 2013. On the same basis, infotainment is likely to account for 17% of the global auto electronics market by 2025, vs. 10% in 2013. Market growth forecast by automotive electronics globally
Categories Description Infotainment In-vehicle information, Display, Audio, Extra-automotive communication,
Head-up display (HUD), Power-saving touch panel, Speech recognition Chassis Brake control, Steering control, Collision control, ADAS Bodies General body control, Climate control, Smart key, Security, Head lamp, TPMS,
Battery-charging control Powertrains Gasoline/Diesel engine management, Idling stop, Transmission control system xEV/FCV Eco-friendly vehicles, eg, electric vehicles, FCEV
Source: Fuji Chimera
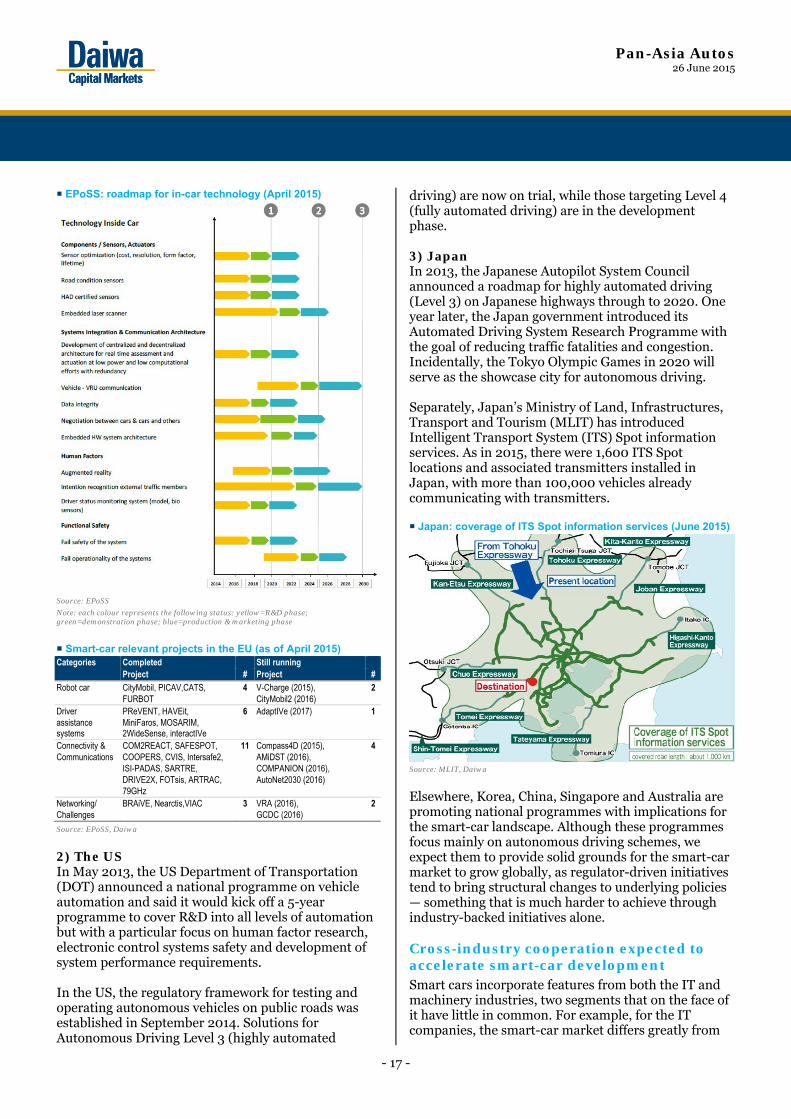
Meanwhile, Topology, a division of TrendForce market research, forecasts that: 1) 75% of the world’s cars will be Internet-connected by 2020, and 2) revenue in the IoV market will total USD2.9bn by 2020. Topology expects self-driving vehicles to enter mass production in 2020 and to pass the 1m-vehicle mark (on a cumulative basis) by 2035. In line with our own upbeat view on the automotive electronics markets globally, we also believe the smart car market will grow strongly until at least 2025, bolstered by the drivers highlighted below. Government agencies to pave the way for smart cars The governments of several major markets have proposed national and regional initiatives designed to spur the growth of the smart-car market, which they view as a potentially lucrative contributor to their own economies. 1) The EU In 2012, the EU initiated the European Technology Platform on Smart Systems (EPoSS), as a part of its EU2020 strategy. Among the panel members for the EPoSS are industrial companies (including Continental, Fiat, Sorin, Hitachi, Infineon, and NXP) and research organisations from more than 20 European member states. In April 2015, the EPoSS unveiled an updated roadmap for the smart systems to be used in automated driving. The roadmap calls for the related R&D activity to be completed by the early 2020s and the production phase to get under way in 2025. On current plans, the EPoSS expects to apply Autonomous Driving Level 3 (conditionally automated driving) and Level 4 (fully automated driving) to less complex driving environments only, by 2020 and 2025 at the latest, respectively.
7%31%6%
26%87%
43%
0
20
40
60
80
100
120
140
2012 2018FEmbedded Smartphone-integrated* Others
(Mil units)
77.7m units
117.8m units
1.34.61.9
3.92.3
3.16.6
10.7
0.7
4.3
0
5
10
15
20
25
30
2013 2025EInfotainment Chassis Bodies Powertrains xEV/FCV
(JPYtn)
JPY12.7tn
JPY26.6tn CAGR
4.1%
2.6%
6.1%
11.6%
16.2%
Pan-Asia Autos 26 June 2015
- 17 -
EPoSS: roadmap for in-car technology (April 2015)
Source: EPoSS
Note: each colour represents the following status: yellow=R&D phase; green=demonstration phase; blue=production & marketing phase
Smart-car relevant projects in the EU (as of April 2015) Categories Completed Still running
Project # Project # Robot car CityMobil, PICAV,CATS,
FURBOT 4 V-Charge (2015),
CityMobil2 (2016) 2
Driver assistance systems
PReVENT, HAVEit, MiniFaros, MOSARIM, 2WideSense, interactIVe
6 AdaptIVe (2017) 1
Connectivity & Communications
COM2REACT, SAFESPOT, COOPERS, CVIS, Intersafe2, ISI-PADAS, SARTRE, DRIVE2X, FOTsis, ARTRAC, 79GHz
11 Compass4D (2015), AMiDST (2016), COMPANION (2016), AutoNet2030 (2016)
4
Networking/ Challenges
BRAiVE, Nearctis,VIAC 3 VRA (2016), GCDC (2016)
2
Source: EPoSS, Daiwa
2) The US In May 2013, the US Department of Transportation (DOT) announced a national programme on vehicle automation and said it would kick off a 5-year programme to cover R&D into all levels of automation but with a particular focus on human factor research, electronic control systems safety and development of system performance requirements. In the US, the regulatory framework for testing and operating autonomous vehicles on public roads was established in September 2014. Solutions for Autonomous Driving Level 3 (highly automated
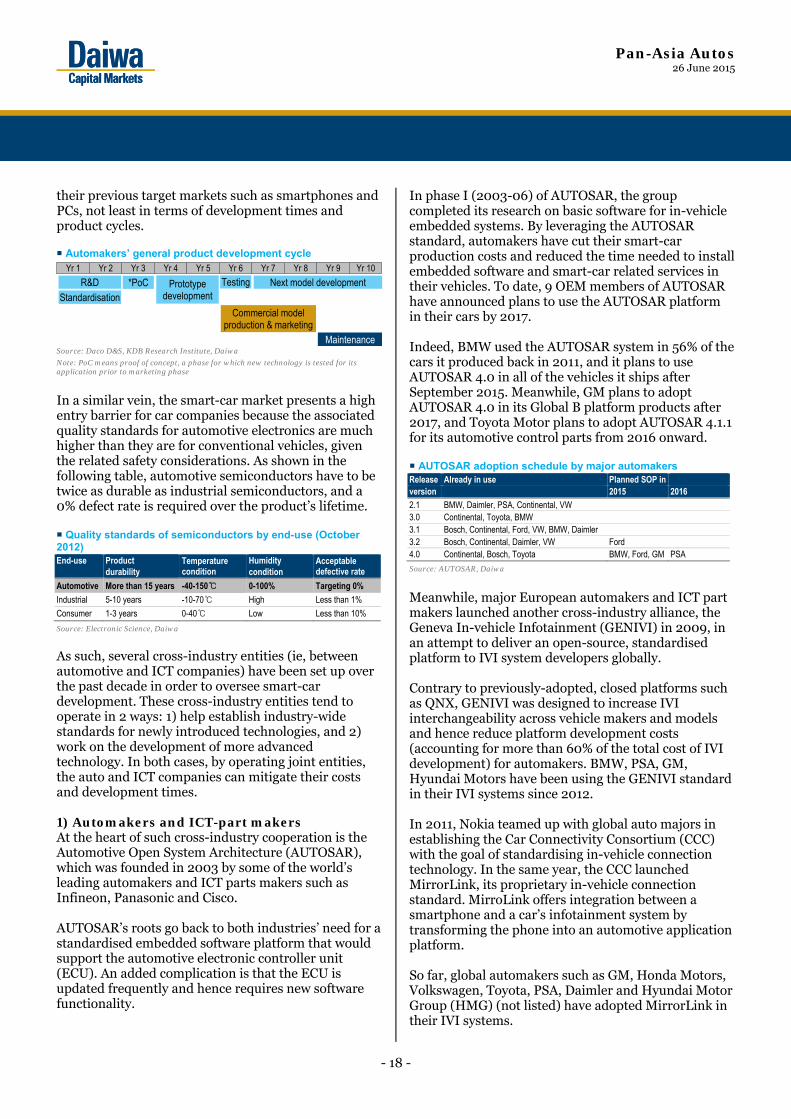
driving) are now on trial, while those targeting Level 4 (fully automated driving) are in the development phase. 3) Japan In 2013, the Japanese Autopilot System Council announced a roadmap for highly automated driving (Level 3) on Japanese highways through to 2020. One year later, the Japan government introduced its Automated Driving System Research Programme with the goal of reducing traffic fatalities and congestion. Incidentally, the Tokyo Olympic Games in 2020 will serve as the showcase city for autonomous driving. Separately, Japan’s Ministry of Land, Infrastructures, Transport and Tourism (MLIT) has introduced Intelligent Transport System (ITS) Spot information services. As in 2015, there were 1,600 ITS Spot locations and associated transmitters installed in Japan, with more than 100,000 vehicles already communicating with transmitters. Japan: coverage of ITS Spot information services (June 2015)
Source: MLIT, Daiwa
Elsewhere, Korea, China, Singapore and Australia are promoting national programmes with implications for the smart-car landscape. Although these programmes focus mainly on autonomous driving schemes, we expect them to provide solid grounds for the smart-car market to grow globally, as regulator-driven initiatives tend to bring structural changes to underlying policies — something that is much harder to achieve through industry-backed initiatives alone. Cross-industry cooperation expected to accelerate smart-car development Smart cars incorporate features from both the IT and machinery industries, two segments that on the face of it have little in common. For example, for the IT companies, the smart-car market differs greatly from
Pan-Asia Autos 26 June 2015
- 18 -
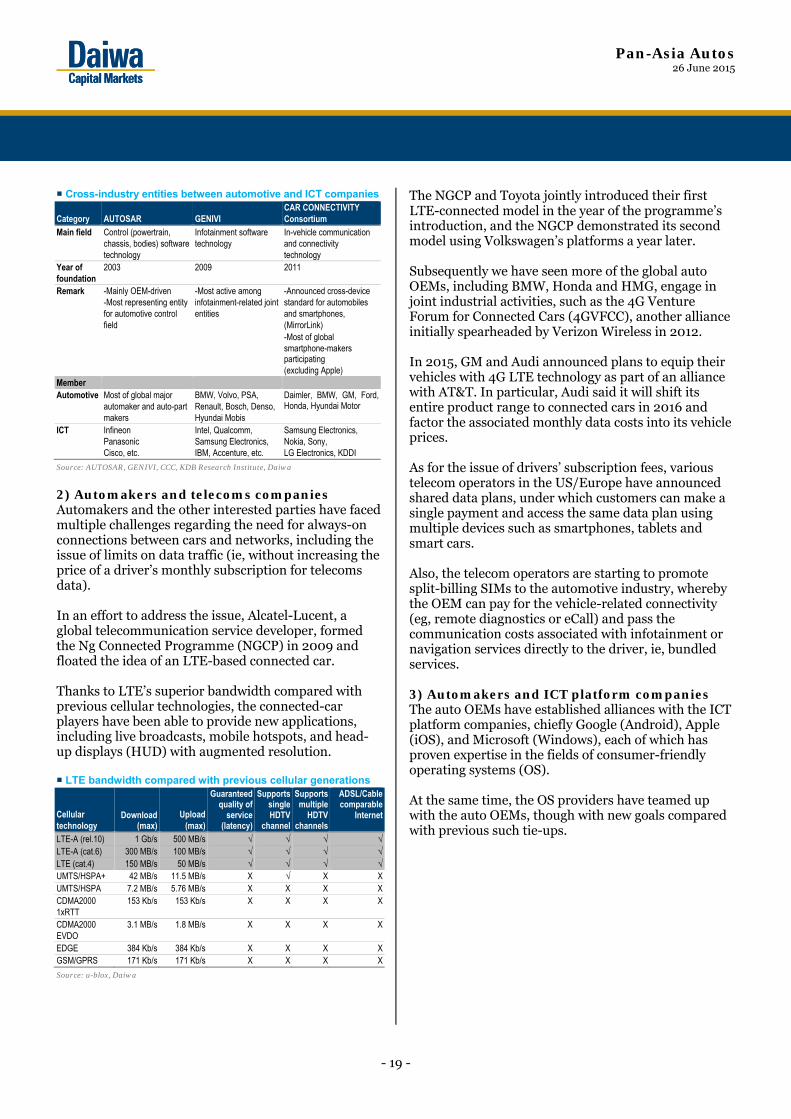
their previous target markets such as smartphones and PCs, not least in terms of development times and product cycles. Automakers’ general product development cycle
Source: Daco D&S, KDB Research Institute, Daiwa
Note: PoC means proof of concept, a phase for which new technology is tested for its application prior to marketing phase
In a similar vein, the smart-car market presents a high entry barrier for car companies because the associated quality standards for automotive electronics are much higher than they are for conventional vehicles, given the related safety considerations. As shown in the following table, automotive semiconductors have to be twice as durable as industrial semiconductors, and a 0% defect rate is required over the product’s lifetime. Quality standards of semiconductors by end-use (October 2012) End-use Product
durability Temperature condition
Humidity condition
Acceptable defective rate
Automotive More than 15 years -40-150℃ 0-100% Targeting 0%
Industrial 5-10 years -10-70℃ High Less than 1%
Consumer 1-3 years 0-40℃ Low Less than 10%
Source: Electronic Science, Daiwa
As such, several cross-industry entities (ie, between automotive and ICT companies) have been set up over the past decade in order to oversee smart-car development. These cross-industry entities tend to operate in 2 ways: 1) help establish industry-wide standards for newly introduced technologies, and 2) work on the development of more advanced technology. In both cases, by operating joint entities, the auto and ICT companies can mitigate their costs and development times. 1) Automakers and ICT-part makers At the heart of such cross-industry cooperation is the Automotive Open System Architecture (AUTOSAR), which was founded in 2003 by some of the world’s leading automakers and ICT parts makers such as Infineon, Panasonic and Cisco. AUTOSAR’s roots go back to both industries’ need for a standardised embedded software platform that would support the automotive electronic controller unit (ECU). An added complication is that the ECU is updated frequently and hence requires new software functionality.
In phase I (2003-06) of AUTOSAR, the group completed its research on basic software for in-vehicle embedded systems. By leveraging the AUTOSAR standard, automakers have cut their smart-car production costs and reduced the time needed to install embedded software and smart-car related services in their vehicles. To date, 9 OEM members of AUTOSAR have announced plans to use the AUTOSAR platform in their cars by 2017. Indeed, BMW used the AUTOSAR system in 56% of the cars it produced back in 2011, and it plans to use AUTOSAR 4.0 in all of the vehicles it ships after September 2015. Meanwhile, GM plans to adopt AUTOSAR 4.0 in its Global B platform products after 2017, and Toyota Motor plans to adopt AUTOSAR 4.1.1 for its automotive control parts from 2016 onward. AUTOSAR adoption schedule by major automakers Release Already in use Planned SOP in version 2015 2016
2.1 BMW, Daimler, PSA, Continental, VW 3.0 Continental, Toyota, BMW 3.1 Bosch, Continental, Ford, VW, BMW, Daimler 3.2 Bosch, Continental, Daimler, VW Ford 4.0 Continental, Bosch, Toyota BMW, Ford, GM PSA
Source: AUTOSAR, Daiwa
Meanwhile, major European automakers and ICT part makers launched another cross-industry alliance, the Geneva In-vehicle Infotainment (GENIVI) in 2009, in an attempt to deliver an open-source, standardised platform to IVI system developers globally. Contrary to previously-adopted, closed platforms such as QNX, GENIVI was designed to increase IVI interchangeability across vehicle makers and models and hence reduce platform development costs (accounting for more than 60% of the total cost of IVI development) for automakers. BMW, PSA, GM, Hyundai Motors have been using the GENIVI standard in their IVI systems since 2012. In 2011, Nokia teamed up with global auto majors in establishing the Car Connectivity Consortium (CCC) with the goal of standardising in-vehicle connection technology. In the same year, the CCC launched MirrorLink, its proprietary in-vehicle connection standard. MirroLink offers integration between a smartphone and a car’s infotainment system by transforming the phone into an automotive application platform. So far, global automakers such as GM, Honda Motors, Volkswagen, Toyota, PSA, Daimler and Hyundai Motor Group (HMG) (not listed) have adopted MirrorLink in their IVI systems.
Yr 2 Yr 3 Yr 4 Yr 5 Yr 6 Yr 7 Yr 8Yr 1 Yr 9 Yr 10
R&DStandardisation
*PoC Prototypedevelopment
Testing Next model development
Commercial model production & marketing
Maintenance
Pan-Asia Autos 26 June 2015
- 19 -
Cross-industry entities between automotive and ICT companies
Category AUTOSAR GENIVI CAR CONNECTIVITY Consortium
Main field Control (powertrain, chassis, bodies) software technology
Infotainment software technology
In-vehicle communication and connectivity technology
Year of foundation
2003 2009 2011
Remark -Mainly OEM-driven -Most representing entity for automotive control field
-Most active among infotainment-related joint entities
-Announced cross-device standard for automobiles and smartphones, (MirrorLink)
-Most of global smartphone-makers participating (excluding Apple)
Member Automotive Most of global major
automaker and auto-part makers
BMW, Volvo, PSA, Renault, Bosch, Denso, Hyundai Mobis
Daimler, BMW, GM, Ford, Honda, Hyundai Motor
ICT Infineon Panasonic Cisco, etc.
Intel, Qualcomm, Samsung Electronics, IBM, Accenture, etc.
Samsung Electronics, Nokia, Sony, LG Electronics, KDDI
Source: AUTOSAR, GENIVI, CCC, KDB Research Institute, Daiwa
2) Automakers and telecoms companies Automakers and the other interested parties have faced multiple challenges regarding the need for always-on connections between cars and networks, including the issue of limits on data traffic (ie, without increasing the price of a driver’s monthly subscription for telecoms data). In an effort to address the issue, Alcatel-Lucent, a global telecommunication service developer, formed the Ng Connected Programme (NGCP) in 2009 and floated the idea of an LTE-based connected car. Thanks to LTE’s superior bandwidth compared with previous cellular technologies, the connected-car players have been able to provide new applications, including live broadcasts, mobile hotspots, and head-up displays (HUD) with augmented resolution. LTE bandwidth compared with previous cellular generations
Cellular technology
Download (max)
Upload (max)
Guaranteed quality of
service (latency)
Supports single HDTV
channel
Supports multiple
HDTV channels
ADSL/Cable comparable
Internet
LTE-A (rel.10) 1 Gb/s 500 MB/s √ √ √ √LTE-A (cat.6) 300 MB/s 100 MB/s √ √ √ √LTE (cat.4) 150 MB/s 50 MB/s √ √ √ √UMTS/HSPA+ 42 MB/s 11.5 MB/s X √ X XUMTS/HSPA 7.2 MB/s 5.76 MB/s X X X XCDMA2000 1xRTT
153 Kb/s 153 Kb/s X X X X
CDMA2000 EVDO
3.1 MB/s 1.8 MB/s X X X X
EDGE 384 Kb/s 384 Kb/s X X X XGSM/GPRS 171 Kb/s 171 Kb/s X X X X
Source: u-blox, Daiwa
The NGCP and Toyota jointly introduced their first LTE-connected model in the year of the programme’s introduction, and the NGCP demonstrated its second model using Volkswagen’s platforms a year later. Subsequently we have seen more of the global auto OEMs, including BMW, Honda and HMG, engage in joint industrial activities, such as the 4G Venture Forum for Connected Cars (4GVFCC), another alliance initially spearheaded by Verizon Wireless in 2012. In 2015, GM and Audi announced plans to equip their vehicles with 4G LTE technology as part of an alliance with AT&T. In particular, Audi said it will shift its entire product range to connected cars in 2016 and factor the associated monthly data costs into its vehicle prices. As for the issue of drivers’ subscription fees, various telecom operators in the US/Europe have announced shared data plans, under which customers can make a single payment and access the same data plan using multiple devices such as smartphones, tablets and smart cars. Also, the telecom operators are starting to promote split-billing SIMs to the automotive industry, whereby the OEM can pay for the vehicle-related connectivity (eg, remote diagnostics or eCall) and pass the communication costs associated with infotainment or navigation services directly to the driver, ie, bundled services. 3) Automakers and ICT platform companies The auto OEMs have established alliances with the ICT platform companies, chiefly Google (Android), Apple (iOS), and Microsoft (Windows), each of which has proven expertise in the fields of consumer-friendly operating systems (OS). At the same time, the OS providers have teamed up with the auto OEMs, though with new goals compared with previous such tie-ups.
Pan-Asia Autos 26 June 2015
- 20 -
Cross-industry entities between automotive and ICT companies [2]
Google Apple Microsoft
Smart-car platform OAA CarPlay Window Automotive Concept Industrial alliance
seeking to develop Android-based automotive OS
Seeking to link its products to automobiles
Similar to CarPlay
Year of commercialisation
1H14 2H14 On progress
Automotive alliances
GM, Ford, FCA, Audi, Nissan, Honda, Hyundai/Kia Motors,
BMW, Toyota, Ford, Hyundai Motor
FCA
Characteristics Competing with OEM-developed OS
Seeking industrial cooperation with global OEMs
Less market-leading than Google/Apple
Source: OAA, Apple, Microsoft, KDB Research Institute, Daiwa
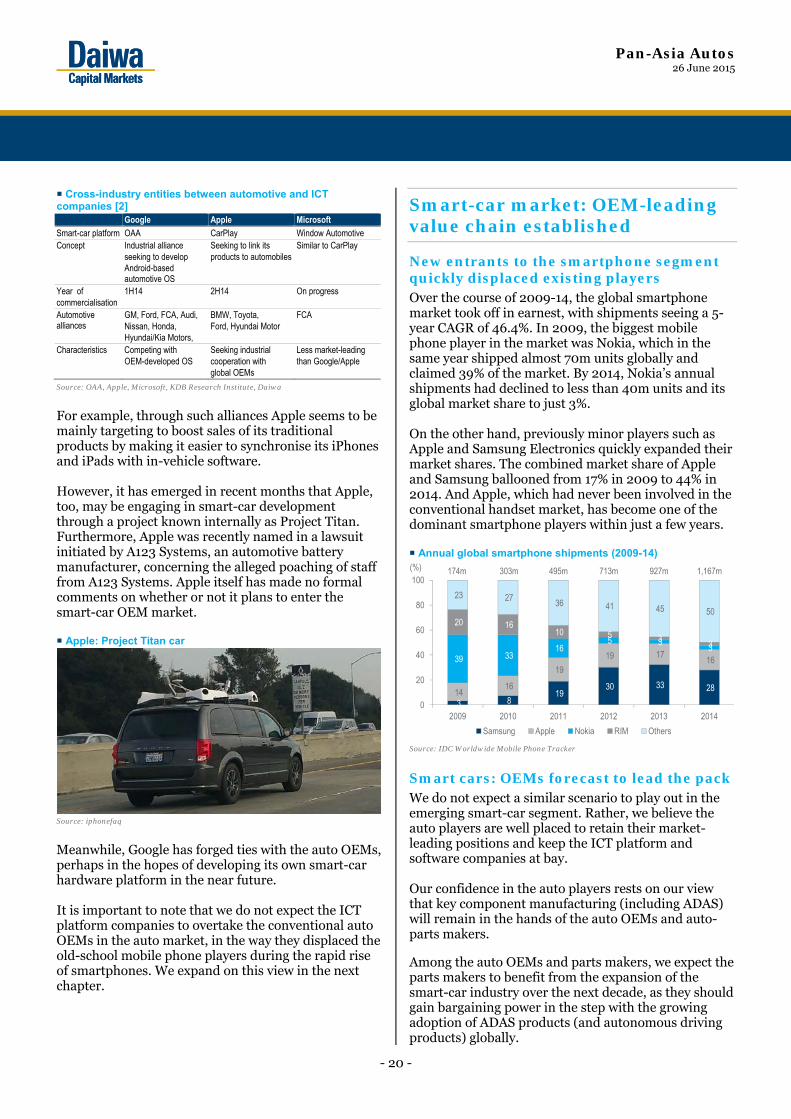
For example, through such alliances Apple seems to be mainly targeting to boost sales of its traditional products by making it easier to synchronise its iPhones and iPads with in-vehicle software. However, it has emerged in recent months that Apple, too, may be engaging in smart-car development through a project known internally as Project Titan. Furthermore, Apple was recently named in a lawsuit initiated by A123 Systems, an automotive battery manufacturer, concerning the alleged poaching of staff from A123 Systems. Apple itself has made no formal comments on whether or not it plans to enter the smart-car OEM market. Apple: Project Titan car
Source: iphonefaq
Meanwhile, Google has forged ties with the auto OEMs, perhaps in the hopes of developing its own smart-car hardware platform in the near future. It is important to note that we do not expect the ICT platform companies to overtake the conventional auto OEMs in the auto market, in the way they displaced the old-school mobile phone players during the rapid rise of smartphones. We expand on this view in the next chapter.
Smart-car market: OEM-leading value chain established
New entrants to the smartphone segment quickly displaced existing players Over the course of 2009-14, the global smartphone market took off in earnest, with shipments seeing a 5-year CAGR of 46.4%. In 2009, the biggest mobile phone player in the market was Nokia, which in the same year shipped almost 70m units globally and claimed 39% of the market. By 2014, Nokia’s annual shipments had declined to less than 40m units and its global market share to just 3%. On the other hand, previously minor players such as Apple and Samsung Electronics quickly expanded their market shares. The combined market share of Apple and Samsung ballooned from 17% in 2009 to 44% in 2014. And Apple, which had never been involved in the conventional handset market, has become one of the dominant smartphone players within just a few years. Annual global smartphone shipments (2009-14)
Source: IDC Worldwide Mobile Phone Tracker
Smart cars: OEMs forecast to lead the pack We do not expect a similar scenario to play out in the emerging smart-car segment. Rather, we believe the auto players are well placed to retain their market-leading positions and keep the ICT platform and software companies at bay. Our confidence in the auto players rests on our view that key component manufacturing (including ADAS) will remain in the hands of the auto OEMs and auto-parts makers.
Among the auto OEMs and parts makers, we expect the parts makers to benefit from the expansion of the smart-car industry over the next decade, as they should gain bargaining power in the step with the growing adoption of ADAS products (and autonomous driving products) globally.
3 8 19
30 33 28 14 16
19
19 17 16 39 33
16 5 3
3
20 16 10 5 3
3
23 27 36 41 45 50
0
20
40
60
80
100
2009 2010 2011 2012 2013 2014
Samsung Apple Nokia RIM Others
174m 303m 495m 713m 927m 1,167m(%)
Pan-Asia Autos 26 June 2015
- 21 -
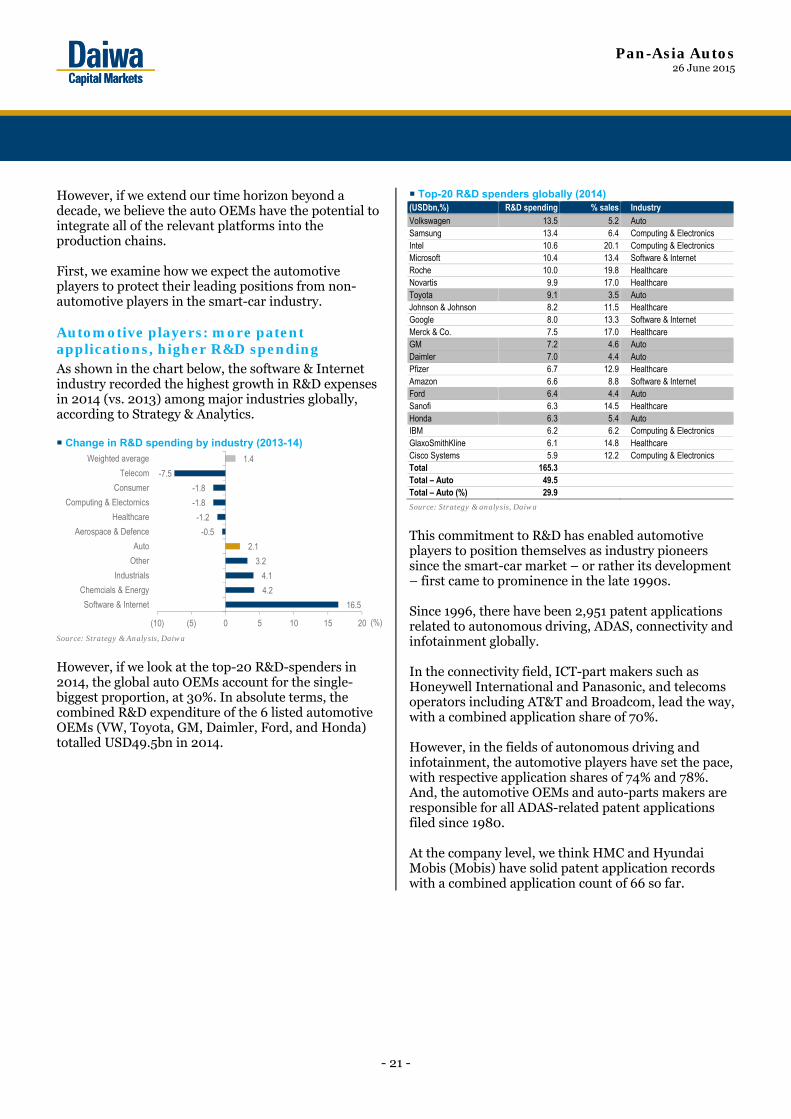
However, if we extend our time horizon beyond a decade, we believe the auto OEMs have the potential to integrate all of the relevant platforms into the production chains. First, we examine how we expect the automotive players to protect their leading positions from non-automotive players in the smart-car industry. Automotive players: more patent applications, higher R&D spending As shown in the chart below, the software & Internet industry recorded the highest growth in R&D expenses in 2014 (vs. 2013) among major industries globally, according to Strategy & Analytics. Change in R&D spending by industry (2013-14)
Source: Strategy & Analysis, Daiwa
However, if we look at the top-20 R&D-spenders in 2014, the global auto OEMs account for the single-biggest proportion, at 30%. In absolute terms, the combined R&D expenditure of the 6 listed automotive OEMs (VW, Toyota, GM, Daimler, Ford, and Honda) totalled USD49.5bn in 2014.
Top-20 R&D spenders globally (2014) (USDbn,%) R&D spending % sales Industry Volkswagen 13.5 5.2 Auto Samsung 13.4 6.4 Computing & Electronics Intel 10.6 20.1 Computing & Electronics Microsoft 10.4 13.4 Software & Internet Roche 10.0 19.8 Healthcare Novartis 9.9 17.0 Healthcare Toyota 9.1 3.5 Auto Johnson & Johnson 8.2 11.5 Healthcare Google 8.0 13.3 Software & Internet Merck & Co. 7.5 17.0 Healthcare GM 7.2 4.6 Auto Daimler 7.0 4.4 Auto Pfizer 6.7 12.9 Healthcare Amazon 6.6 8.8 Software & Internet Ford 6.4 4.4 Auto Sanofi 6.3 14.5 Healthcare Honda 6.3 5.4 Auto IBM 6.2 6.2 Computing & Electronics GlaxoSmithKline 6.1 14.8 Healthcare Cisco Systems 5.9 12.2 Computing & Electronics Total 165.3 Total – Auto 49.5 Total – Auto (%) 29.9
Source: Strategy & analysis, Daiwa
This commitment to R&D has enabled automotive players to position themselves as industry pioneers since the smart-car market – or rather its development – first came to prominence in the late 1990s. Since 1996, there have been 2,951 patent applications related to autonomous driving, ADAS, connectivity and infotainment globally. In the connectivity field, ICT-part makers such as Honeywell International and Panasonic, and telecoms operators including AT&T and Broadcom, lead the way, with a combined application share of 70%. However, in the fields of autonomous driving and infotainment, the automotive players have set the pace, with respective application shares of 74% and 78%. And, the automotive OEMs and auto-parts makers are responsible for all ADAS-related patent applications filed since 1980. At the company level, we think HMC and Hyundai Mobis (Mobis) have solid patent application records with a combined application count of 66 so far.
16.5
4.2
4.1
3.2
2.1
-0.5
-1.2
-1.8
-1.8
-7.5
1.4
(10) (5) 0 5 10 15 20
Software & Internet
Chemcials & Energy
Industrials
Other
Auto
Aerospace & Defence
Healthcare
Computing & Electornics
Consumer
Telecom
Weighted average
(%)
Pan-Asia Autos 26 June 2015
- 22 -
Patent application trend by smart-car features
Source: KATS, KSA, Daiwa
Note: *patents applied during 2013-14 are not fully disclosed yet
Patent application composition by candidate’s field
Source: KATS, KSA, Daiwa
Note: based on cumulative figures during 1980-2014
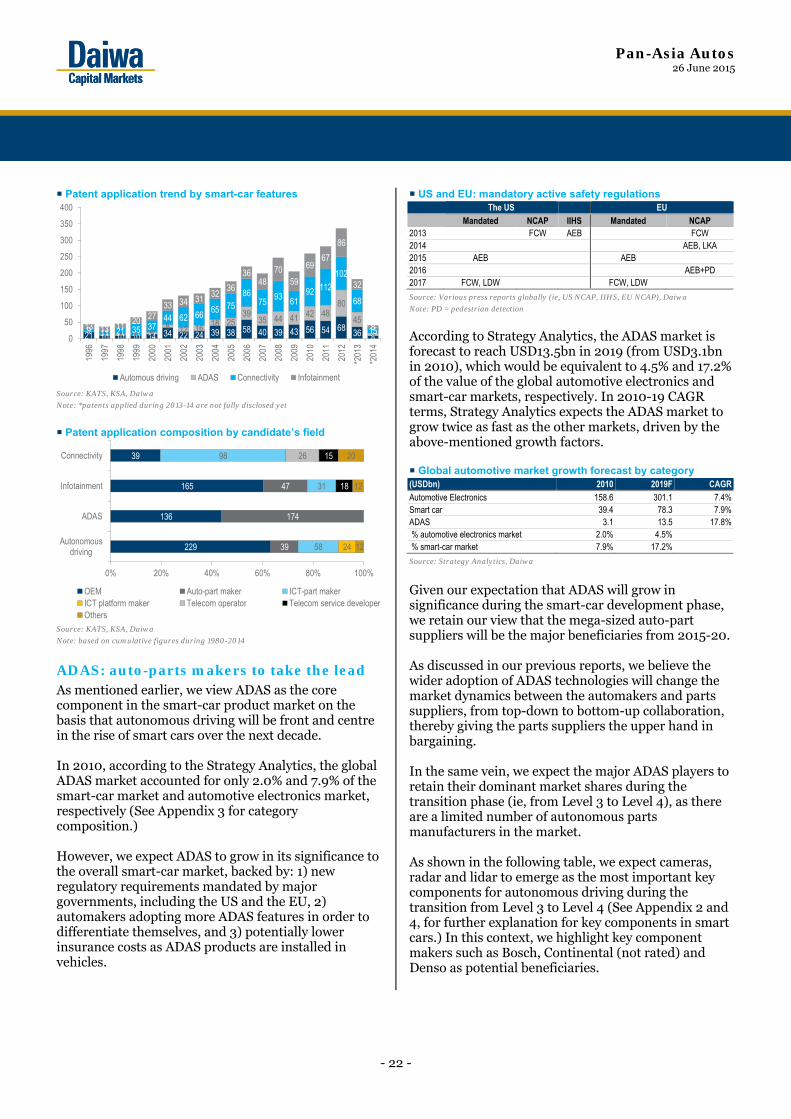
ADAS: auto-parts makers to take the lead As mentioned earlier, we view ADAS as the core component in the smart-car product market on the basis that autonomous driving will be front and centre in the rise of smart cars over the next decade. In 2010, according to the Strategy Analytics, the global ADAS market accounted for only 2.0% and 7.9% of the smart-car market and automotive electronics market, respectively (See Appendix 3 for category composition.) However, we expect ADAS to grow in its significance to the overall smart-car market, backed by: 1) new regulatory requirements mandated by major governments, including the US and the EU, 2) automakers adopting more ADAS features in order to differentiate themselves, and 3) potentially lower insurance costs as ADAS products are installed in vehicles.
US and EU: mandatory active safety regulations The US EU
Mandated NCAP IIHS Mandated NCAP 2013 FCW AEB FCW 2014 AEB, LKA 2015 AEB AEB 2016 AEB+PD 2017 FCW, LDW FCW, LDW
Source: Various press reports globally (ie, US NCAP, IIHS, EU NCAP), Daiwa
Note: PD = pedestrian detection
According to Strategy Analytics, the ADAS market is forecast to reach USD13.5bn in 2019 (from USD3.1bn in 2010), which would be equivalent to 4.5% and 17.2% of the value of the global automotive electronics and smart-car markets, respectively. In 2010-19 CAGR terms, Strategy Analytics expects the ADAS market to grow twice as fast as the other markets, driven by the above-mentioned growth factors. Global automotive market growth forecast by category (USDbn) 2010 2019F CAGRAutomotive Electronics 158.6 301.1 7.4%Smart car 39.4 78.3 7.9%ADAS 3.1 13.5 17.8% % automotive electronics market 2.0% 4.5% % smart-car market 7.9% 17.2%
Source: Strategy Analytics, Daiwa
Given our expectation that ADAS will grow in significance during the smart-car development phase, we retain our view that the mega-sized auto-part suppliers will be the major beneficiaries from 2015-20. As discussed in our previous reports, we believe the wider adoption of ADAS technologies will change the market dynamics between the automakers and parts suppliers, from top-down to bottom-up collaboration, thereby giving the parts suppliers the upper hand in bargaining. In the same vein, we expect the major ADAS players to retain their dominant market shares during the transition phase (ie, from Level 3 to Level 4), as there are a limited number of autonomous parts manufacturers in the market. As shown in the following table, we expect cameras, radar and lidar to emerge as the most important key components for autonomous driving during the transition from Level 3 to Level 4 (See Appendix 2 and 4, for further explanation for key components in smart cars.) In this context, we highlight key component makers such as Bosch, Continental (not rated) and Denso as potential beneficiaries.
21 10 10 10 14 34 22 24 39 38 58 40 39 43 56 54 68 36 81 2 3 0 5
8 12 16 18 2539
35 44 41 42 4880
45
99 11 21 35 3744 62 66
65 7586
7593 61
92 112
102
68
1513 13 11 20 2733 34 31
3236
3648
7059
6967
86
32
80
50
100
150
200
250
300
350
400
1996
1997
1998
1999
2000
2001
2002
2003
2004
2005
2006
2007
2008
2009
2010
2011
2012
*201
3
*201
4Automous driving ADAS Connectivity Infotainment
229
136
165
39
39
174
47
58
31
98
24
26
18
15
12
12
20
0% 20% 40% 60% 80% 100%
Autonomousdriving
ADAS
Infotainment
Connectivity
OEM Auto-part maker ICT-part makerICT platform maker Telecom operator Telecom service developerOthers
Pan-Asia Autos 26 June 2015
- 23 -
Core systems for fully automated vehicles
Level of automation Assistance
(Lv. 1)
Semi-automated
(Lv. 2)
Highly Automated
(Lv. 3)
Fully Automated
(Lv. 4) Adaptive headlamp control Optional Optional Imperative Optional Radar Imperative Imperative Imperative Imperative Ultrasonic sensors Optional Imperative Imperative Imperative Forward-looking camera Imperative Imperative Imperative Imperative Rear-vision camera Optional Imperative Imperative Imperative Surround view camera Optional Imperative Imperative Imperative Night vision Optional Optional Imperative Imperative Lidar Optional Optional Imperative Imperative Map-supported ADAS Optional Optional Imperative Imperative Steering & braking automation Optional Imperative Imperative Imperative Artificial intelligence Optional Optional Optional Imperative Multiple redundancies Optional Optional Optional Imperative Self-healing systems Optional Optional Optional Imperative
Source: KATECH, Daiwa
Smart-car components: major manufacturers
Company 24Ghz radar
77Ghz radar
Lidar Laser scanner
IR sensor
Ultra-sonic
Mono. camera
Stereo camera
Bosch - √ - - √ √ √ √Continental √ √ √ - √ - √ √Denso - √ - - - √ √ √Delphi √ √ - - - - √ -TRW √ √ - - - - √ -Autoliv √ √ - - √ - √ √Valeo √ - - √ - √ √ -Hella √ - - - - - √ -
Source: Companies, Daiwa
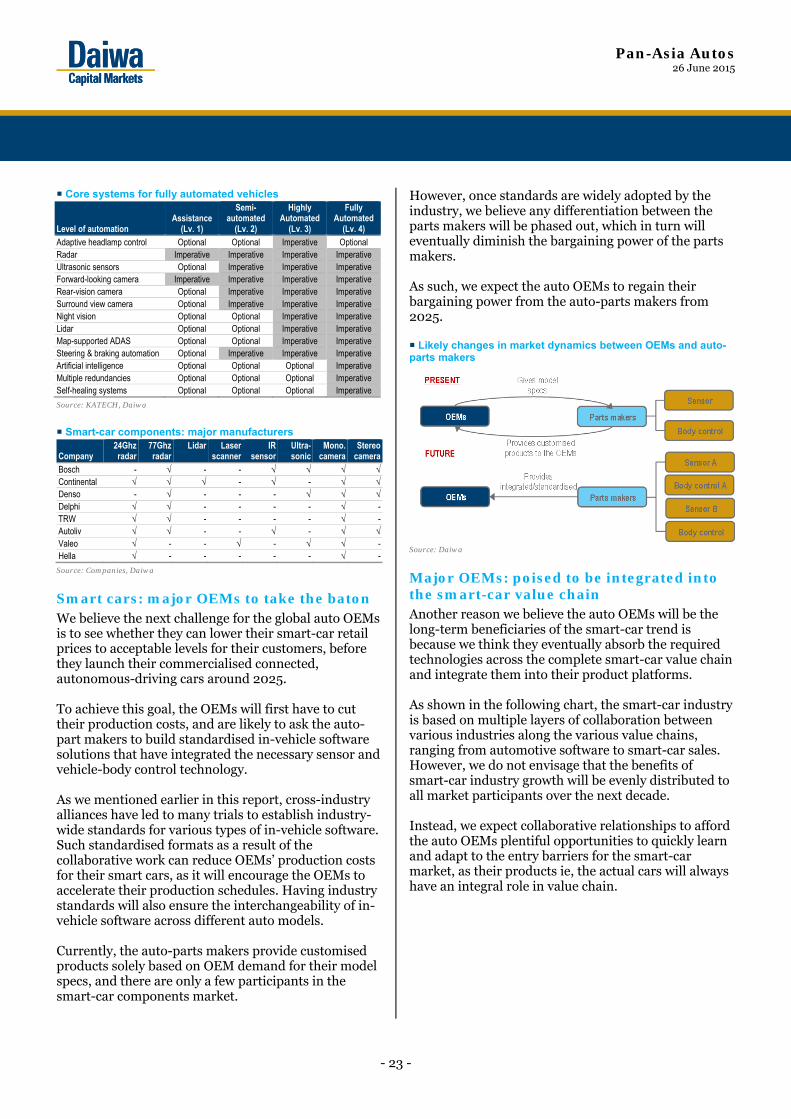
Smart cars: major OEMs to take the baton We believe the next challenge for the global auto OEMs is to see whether they can lower their smart-car retail prices to acceptable levels for their customers, before they launch their commercialised connected, autonomous-driving cars around 2025. To achieve this goal, the OEMs will first have to cut their production costs, and are likely to ask the auto-part makers to build standardised in-vehicle software solutions that have integrated the necessary sensor and vehicle-body control technology. As we mentioned earlier in this report, cross-industry alliances have led to many trials to establish industry-wide standards for various types of in-vehicle software. Such standardised formats as a result of the collaborative work can reduce OEMs’ production costs for their smart cars, as it will encourage the OEMs to accelerate their production schedules. Having industry standards will also ensure the interchangeability of in-vehicle software across different auto models. Currently, the auto-parts makers provide customised products solely based on OEM demand for their model specs, and there are only a few participants in the smart-car components market.
However, once standards are widely adopted by the industry, we believe any differentiation between the parts makers will be phased out, which in turn will eventually diminish the bargaining power of the parts makers. As such, we expect the auto OEMs to regain their bargaining power from the auto-parts makers from 2025. Likely changes in market dynamics between OEMs and auto-parts makers
Source: Daiwa
Major OEMs: poised to be integrated into the smart-car value chain Another reason we believe the auto OEMs will be the long-term beneficiaries of the smart-car trend is because we think they eventually absorb the required technologies across the complete smart-car value chain and integrate them into their product platforms. As shown in the following chart, the smart-car industry is based on multiple layers of collaboration between various industries along the various value chains, ranging from automotive software to smart-car sales. However, we do not envisage that the benefits of smart-car industry growth will be evenly distributed to all market participants over the next decade. Instead, we expect collaborative relationships to afford the auto OEMs plentiful opportunities to quickly learn and adapt to the entry barriers for the smart-car market, as their products ie, the actual cars will always have an integral role in value chain.
Pan-Asia Autos 26 June 2015
- 24 -
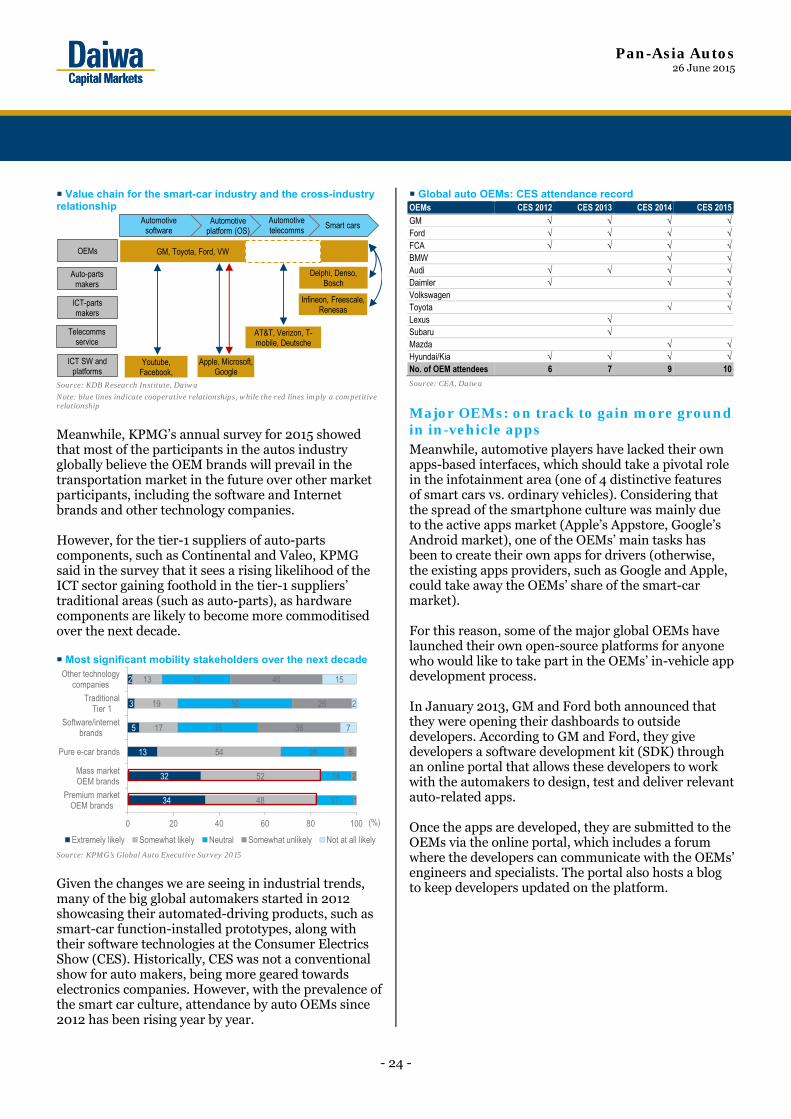
Value chain for the smart-car industry and the cross-industry relationship
Source: KDB Research Institute, Daiwa
Note: blue lines indicate cooperative relationships, while the red lines imply a competitive relationship
Meanwhile, KPMG’s annual survey for 2015 showed that most of the participants in the autos industry globally believe the OEM brands will prevail in the transportation market in the future over other market participants, including the software and Internet brands and other technology companies. However, for the tier-1 suppliers of auto-parts components, such as Continental and Valeo, KPMG said in the survey that it sees a rising likelihood of the ICT sector gaining foothold in the tier-1 suppliers’ traditional areas (such as auto-parts), as hardware components are likely to become more commoditised over the next decade. Most significant mobility stakeholders over the next decade
Source: KPMG’s Global Auto Executive Survey 2015
Given the changes we are seeing in industrial trends, many of the big global automakers started in 2012 showcasing their automated-driving products, such as smart-car function-installed prototypes, along with their software technologies at the Consumer Electrics Show (CES). Historically, CES was not a conventional show for auto makers, being more geared towards electronics companies. However, with the prevalence of the smart car culture, attendance by auto OEMs since 2012 has been rising year by year.
Global auto OEMs: CES attendance record OEMs CES 2012 CES 2013 CES 2014 CES 2015GM √ √ √ √Ford √ √ √ √FCA √ √ √ √BMW √ √Audi √ √ √ √Daimler √ √ √Volkswagen √Toyota √ √Lexus √ Subaru √ Mazda √ √Hyundai/Kia √ √ √ √No. of OEM attendees 6 7 9 10
Source: CEA, Daiwa
Major OEMs: on track to gain more ground in in-vehicle apps Meanwhile, automotive players have lacked their own apps-based interfaces, which should take a pivotal role in the infotainment area (one of 4 distinctive features of smart cars vs. ordinary vehicles). Considering that the spread of the smartphone culture was mainly due to the active apps market (Apple’s Appstore, Google’s Android market), one of the OEMs’ main tasks has been to create their own apps for drivers (otherwise, the existing apps providers, such as Google and Apple, could take away the OEMs’ share of the smart-car market). For this reason, some of the major global OEMs have launched their own open-source platforms for anyone who would like to take part in the OEMs’ in-vehicle app development process. In January 2013, GM and Ford both announced that they were opening their dashboards to outside developers. According to GM and Ford, they give developers a software development kit (SDK) through an online portal that allows these developers to work with the automakers to design, test and deliver relevant auto-related apps. Once the apps are developed, they are submitted to the OEMs via the online portal, which includes a forum where the developers can communicate with the OEMs’ engineers and specialists. The portal also hosts a blog to keep developers updated on the platform.
Automotive software
Automotive platform (OS)
Automotive telecomms
Smart cars
OEMs
Auto-partsmakers
ICT-partsmakers
Telecomms service
ICT SW and platforms
Youtube, Facebook,
Apple, Microsoft, Google
AT&T, Verizon, T-mobile, Deutsche
GM, Toyota, Ford, VW
Delphi, Denso, Bosch
Infineon, Freescale, Renesas
34
32
13
5
3
2
48
52
54
17
19
13
17
14
28
35
50
30
1
2
5
36
26
40
7
2
15
0 20 40 60 80 100
Premium marketOEM brands
Mass marketOEM brands
Pure e-car brands
Software/internetbrands
TraditionalTier 1
Other technologycompanies
Extremely likely Somewhat likely Neutral Somewhat unlikely Not at all likely
(%)
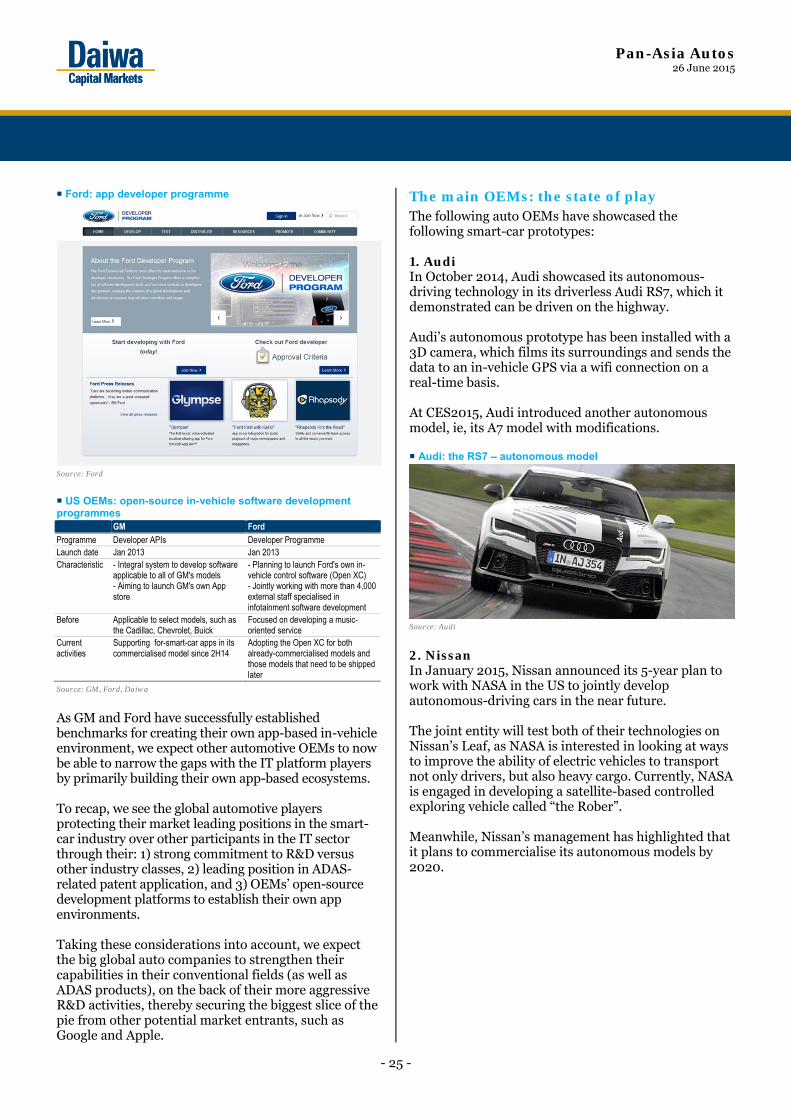
Pan-Asia Autos 26 June 2015
- 25 -
Ford: app developer programme
Source: Ford
US OEMs: open-source in-vehicle software development programmes GM Ford Programme Developer APIs Developer Programme Launch date Jan 2013 Jan 2013 Characteristic - Integral system to develop software
applicable to all of GM's models - Aiming to launch GM's own App store
- Planning to launch Ford's own in-vehicle control software (Open XC) - Jointly working with more than 4,000 external staff specialised in infotainment software development
Before Applicable to select models, such as the Cadillac, Chevrolet, Buick
Focused on developing a music-oriented service
Current activities
Supporting for-smart-car apps in its commercialised model since 2H14
Adopting the Open XC for both already-commercialised models and those models that need to be shipped later
Source: GM, Ford, Daiwa
As GM and Ford have successfully established benchmarks for creating their own app-based in-vehicle environment, we expect other automotive OEMs to now be able to narrow the gaps with the IT platform players by primarily building their own app-based ecosystems. To recap, we see the global automotive players protecting their market leading positions in the smart-car industry over other participants in the IT sector through their: 1) strong commitment to R&D versus other industry classes, 2) leading position in ADAS-related patent application, and 3) OEMs’ open-source development platforms to establish their own app environments. Taking these considerations into account, we expect the big global auto companies to strengthen their capabilities in their conventional fields (as well as ADAS products), on the back of their more aggressive R&D activities, thereby securing the biggest slice of the pie from other potential market entrants, such as Google and Apple.
The main OEMs: the state of play The following auto OEMs have showcased the following smart-car prototypes: 1. Audi In October 2014, Audi showcased its autonomous-driving technology in its driverless Audi RS7, which it demonstrated can be driven on the highway. Audi’s autonomous prototype has been installed with a 3D camera, which films its surroundings and sends the data to an in-vehicle GPS via a wifi connection on a real-time basis. At CES2015, Audi introduced another autonomous model, ie, its A7 model with modifications. Audi: the RS7 – autonomous model
Source: Audi
2. Nissan In January 2015, Nissan announced its 5-year plan to work with NASA in the US to jointly develop autonomous-driving cars in the near future. The joint entity will test both of their technologies on Nissan’s Leaf, as NASA is interested in looking at ways to improve the ability of electric vehicles to transport not only drivers, but also heavy cargo. Currently, NASA is engaged in developing a satellite-based controlled exploring vehicle called “the Rober”. Meanwhile, Nissan’s management has highlighted that it plans to commercialise its autonomous models by 2020.
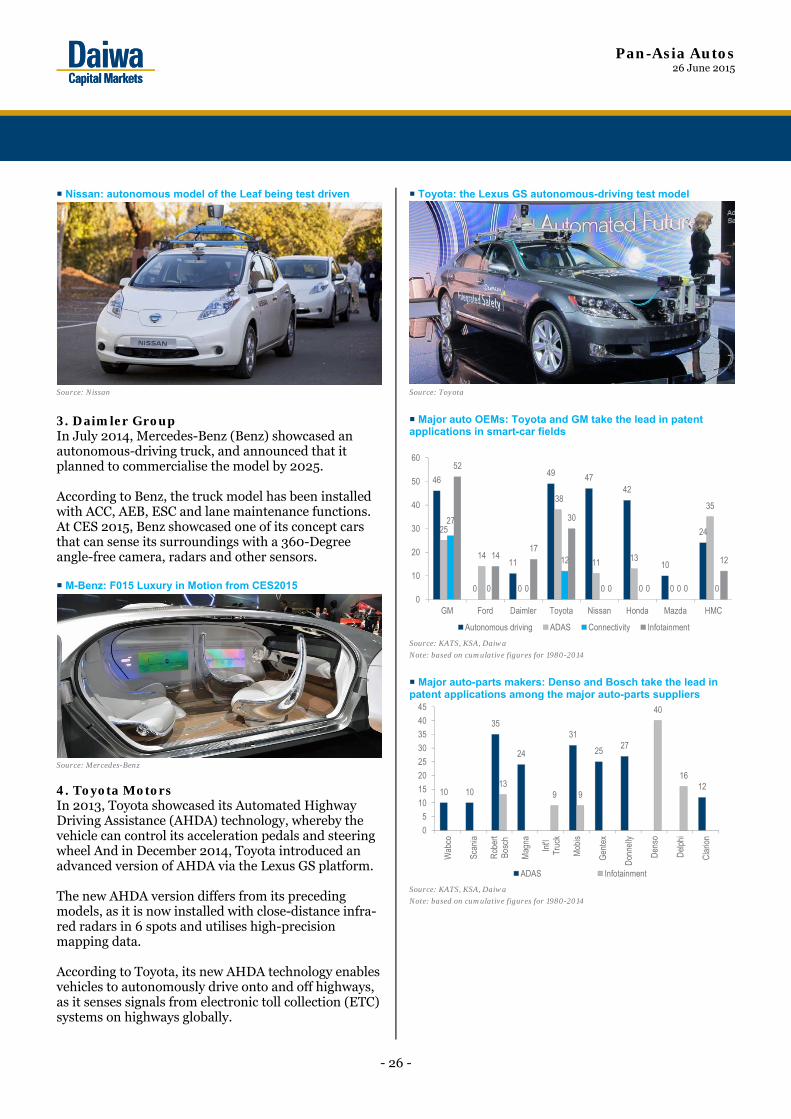
Pan-Asia Autos 26 June 2015
- 26 -
Nissan: autonomous model of the Leaf being test driven
Source: Nissan
3. Daimler Group In July 2014, Mercedes-Benz (Benz) showcased an autonomous-driving truck, and announced that it planned to commercialise the model by 2025. According to Benz, the truck model has been installed with ACC, AEB, ESC and lane maintenance functions. At CES 2015, Benz showcased one of its concept cars that can sense its surroundings with a 360-Degree angle-free camera, radars and other sensors. M-Benz: F015 Luxury in Motion from CES2015
Source: Mercedes-Benz
4. Toyota Motors In 2013, Toyota showcased its Automated Highway Driving Assistance (AHDA) technology, whereby the vehicle can control its acceleration pedals and steering wheel And in December 2014, Toyota introduced an advanced version of AHDA via the Lexus GS platform. The new AHDA version differs from its preceding models, as it is now installed with close-distance infra-red radars in 6 spots and utilises high-precision mapping data. According to Toyota, its new AHDA technology enables vehicles to autonomously drive onto and off highways, as it senses signals from electronic toll collection (ETC) systems on highways globally.
Toyota: the Lexus GS autonomous-driving test model
Source: Toyota
Major auto OEMs: Toyota and GM take the lead in patent applications in smart-car fields
Source: KATS, KSA, Daiwa
Note: based on cumulative figures for 1980-2014
Major auto-parts makers: Denso and Bosch take the lead in patent applications among the major auto-parts suppliers
Source: KATS, KSA, Daiwa
Note: based on cumulative figures for 1980-2014
46
0
11
49 4742
10
2425
14
0
38
11 13
0
35
27
0 0
12
0 0 0 0
52
1417
30
0 0 0
12
0
10
20
30
40
50
60
GM Ford Daimler Toyota Nissan Honda Mazda HMC
Autonomous driving ADAS Connectivity Infotainment
10 10
35
24
31
2527
12139 9
40
16
0
5
10
15
20
25
30
35
40
45
Wab
co
Scan
ia
Rob
ert
Bosc
h
Mag
na
Int'l
Truc
k
Mob
is
Gen
tex
Don
nelly
Den
so
Del
phi
Cla
rion
ADAS Infotainment
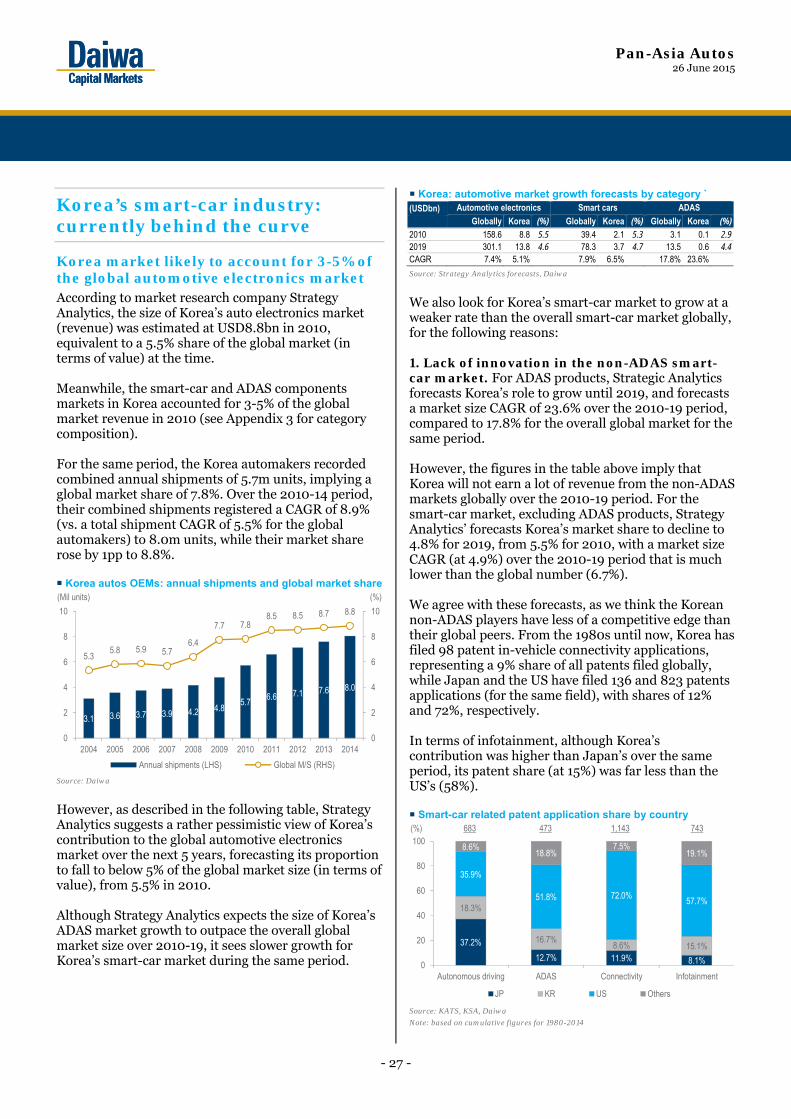
Pan-Asia Autos 26 June 2015
- 27 -
Korea’s smart-car industry: currently behind the curve
Korea market likely to account for 3-5% of the global automotive electronics market According to market research company Strategy Analytics, the size of Korea’s auto electronics market (revenue) was estimated at USD8.8bn in 2010, equivalent to a 5.5% share of the global market (in terms of value) at the time. Meanwhile, the smart-car and ADAS components markets in Korea accounted for 3-5% of the global market revenue in 2010 (see Appendix 3 for category composition). For the same period, the Korea automakers recorded combined annual shipments of 5.7m units, implying a global market share of 7.8%. Over the 2010-14 period, their combined shipments registered a CAGR of 8.9% (vs. a total shipment CAGR of 5.5% for the global automakers) to 8.0m units, while their market share rose by 1pp to 8.8%. Korea autos OEMs: annual shipments and global market share
Source: Daiwa
However, as described in the following table, Strategy Analytics suggests a rather pessimistic view of Korea’s contribution to the global automotive electronics market over the next 5 years, forecasting its proportion to fall to below 5% of the global market size (in terms of value), from 5.5% in 2010. Although Strategy Analytics expects the size of Korea’s ADAS market growth to outpace the overall global market size over 2010-19, it sees slower growth for Korea’s smart-car market during the same period.
Korea: automotive market growth forecasts by category ` (USDbn) Automotive electronics Smart cars ADAS
Globally Korea (%) Globally Korea (%) Globally Korea (%)2010 158.6 8.8 5.5 39.4 2.1 5.3 3.1 0.1 2.92019 301.1 13.8 4.6 78.3 3.7 4.7 13.5 0.6 4.4CAGR 7.4% 5.1% 7.9% 6.5% 17.8% 23.6%
Source: Strategy Analytics forecasts, Daiwa
We also look for Korea’s smart-car market to grow at a weaker rate than the overall smart-car market globally, for the following reasons: 1. Lack of innovation in the non-ADAS smart-car market. For ADAS products, Strategic Analytics forecasts Korea’s role to grow until 2019, and forecasts a market size CAGR of 23.6% over the 2010-19 period, compared to 17.8% for the overall global market for the same period. However, the figures in the table above imply that Korea will not earn a lot of revenue from the non-ADAS markets globally over the 2010-19 period. For the smart-car market, excluding ADAS products, Strategy Analytics’ forecasts Korea’s market share to decline to 4.8% for 2019, from 5.5% for 2010, with a market size CAGR (at 4.9%) over the 2010-19 period that is much lower than the global number (6.7%). We agree with these forecasts, as we think the Korean non-ADAS players have less of a competitive edge than their global peers. From the 1980s until now, Korea has filed 98 patent in-vehicle connectivity applications, representing a 9% share of all patents filed globally, while Japan and the US have filed 136 and 823 patents applications (for the same field), with shares of 12% and 72%, respectively. In terms of infotainment, although Korea’s contribution was higher than Japan’s over the same period, its patent share (at 15%) was far less than the US’s (58%). Smart-car related patent application share by country
Source: KATS, KSA, Daiwa
Note: based on cumulative figures for 1980-2014
3.1 3.6 3.7 3.9 4.2 4.85.7
6.6 7.1 7.6 8.0
5.35.8 5.9 5.7
6.4
7.7 7.88.5 8.5 8.7 8.8
0
2
4
6
8
10
0
2
4
6
8
10
2004 2005 2006 2007 2008 2009 2010 2011 2012 2013 2014
Annual shipments (LHS) Global M/S (RHS)
(Mil units) (%)
37.2%
12.7% 11.9% 8.1%
18.3%
16.7%8.6% 15.1%
35.9%
51.8% 72.0%57.7%
8.6%18.8%
7.5%19.1%
0
20
40
60
80
100
Autonomous driving ADAS Connectivity Infotainment
JP KR US Others
(%) 683 473 1,143 743
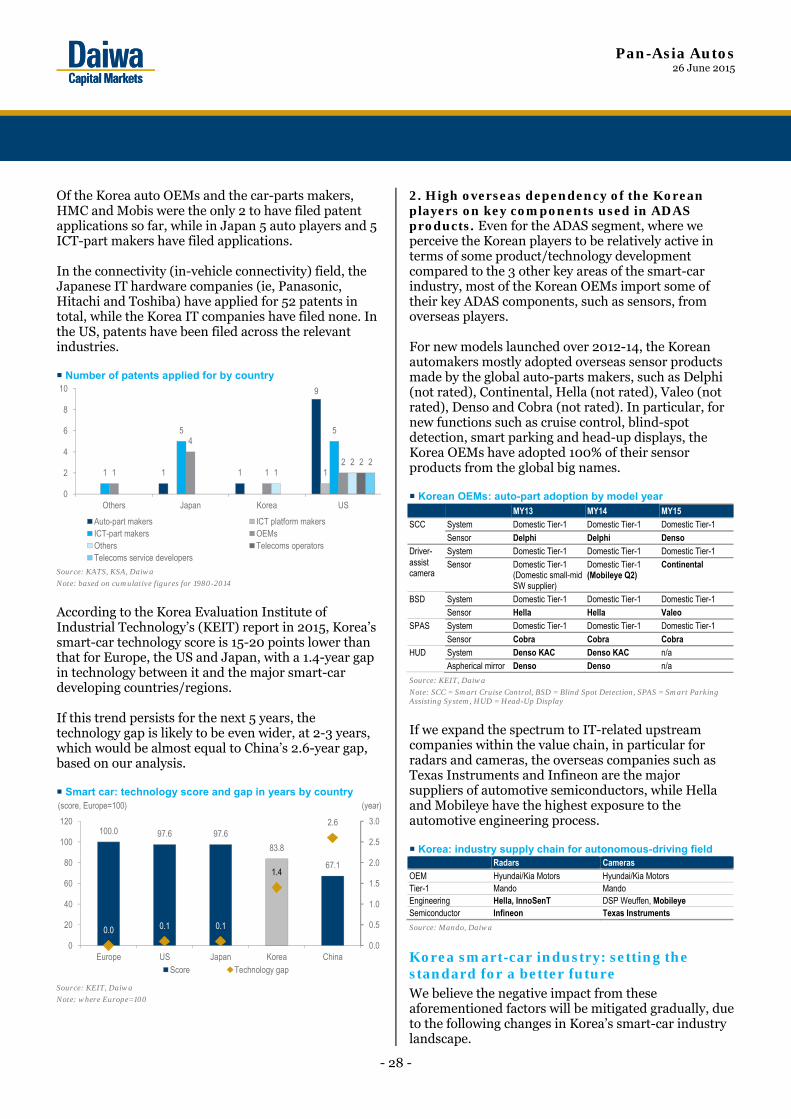
Pan-Asia Autos 26 June 2015
- 28 -
Of the Korea auto OEMs and the car-parts makers, HMC and Mobis were the only 2 to have filed patent applications so far, while in Japan 5 auto players and 5 ICT-part makers have filed applications. In the connectivity (in-vehicle connectivity) field, the Japanese IT hardware companies (ie, Panasonic, Hitachi and Toshiba) have applied for 52 patents in total, while the Korea IT companies have filed none. In the US, patents have been filed across the relevant industries. Number of patents applied for by country
Source: KATS, KSA, Daiwa
Note: based on cumulative figures for 1980-2014
According to the Korea Evaluation Institute of Industrial Technology’s (KEIT) report in 2015, Korea’s smart-car technology score is 15-20 points lower than that for Europe, the US and Japan, with a 1.4-year gap in technology between it and the major smart-car developing countries/regions. If this trend persists for the next 5 years, the technology gap is likely to be even wider, at 2-3 years, which would be almost equal to China’s 2.6-year gap, based on our analysis. Smart car: technology score and gap in years by country
Source: KEIT, Daiwa
Note: where Europe=100
2. High overseas dependency of the Korean players on key components used in ADAS products. Even for the ADAS segment, where we perceive the Korean players to be relatively active in terms of some product/technology development compared to the 3 other key areas of the smart-car industry, most of the Korean OEMs import some of their key ADAS components, such as sensors, from overseas players. For new models launched over 2012-14, the Korean automakers mostly adopted overseas sensor products made by the global auto-parts makers, such as Delphi (not rated), Continental, Hella (not rated), Valeo (not rated), Denso and Cobra (not rated). In particular, for new functions such as cruise control, blind-spot detection, smart parking and head-up displays, the Korea OEMs have adopted 100% of their sensor products from the global big names. Korean OEMs: auto-part adoption by model year MY13 MY14 MY15 SCC System Domestic Tier-1 Domestic Tier-1 Domestic Tier-1
Sensor Delphi Delphi Denso Driver- assist camera
System Domestic Tier-1 Domestic Tier-1 Domestic Tier-1 Sensor Domestic Tier-1
(Domestic small-mid SW supplier)
Domestic Tier-1 (Mobileye Q2)
Continental
BSD System Domestic Tier-1 Domestic Tier-1 Domestic Tier-1 Sensor Hella Hella Valeo SPAS System Domestic Tier-1 Domestic Tier-1 Domestic Tier-1
Sensor Cobra Cobra Cobra HUD System Denso KAC Denso KAC n/a Aspherical mirror Denso Denso n/a
Source: KEIT, Daiwa
Note: SCC = Smart Cruise Control, BSD = Blind Spot Detection, SPAS = Smart Parking Assisting System, HUD = Head-Up Display
If we expand the spectrum to IT-related upstream companies within the value chain, in particular for radars and cameras, the overseas companies such as Texas Instruments and Infineon are the major suppliers of automotive semiconductors, while Hella and Mobileye have the highest exposure to the automotive engineering process. Korea: industry supply chain for autonomous-driving field Radars Cameras OEM Hyundai/Kia Motors Hyundai/Kia Motors Tier-1 Mando Mando Engineering Hella, InnoSenT DSP Weuffen, Mobileye Semiconductor Infineon Texas Instruments
Source: Mando, Daiwa
Korea smart-car industry: setting the standard for a better future We believe the negative impact from these aforementioned factors will be mitigated gradually, due to the following changes in Korea’s smart-car industry landscape.
1 1
9
11
5 5
1
4
12
12 2 2
0
2
4
6
8
10
Others Japan Korea US
Auto-part makers ICT platform makersICT-part makers OEMsOthers Telecoms operatorsTelecoms service developers
100.0 97.6 97.6
83.8
67.1
0.0 0.1 0.1
1.4
2.6
0.0
0.5
1.0
1.5
2.0
2.5
3.0
0
20
40
60
80
100
120
Europe US Japan Korea ChinaScore Technology gap
(year)(score, Europe=100)
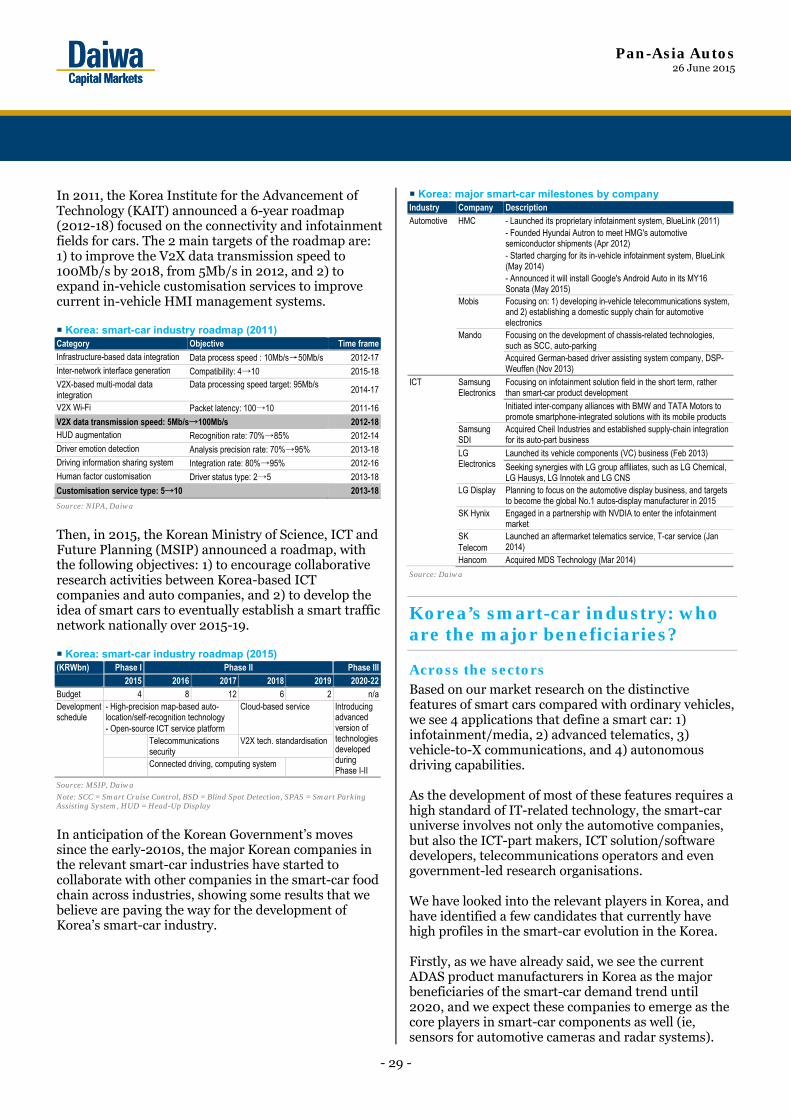
Pan-Asia Autos 26 June 2015
- 29 -
In 2011, the Korea Institute for the Advancement of Technology (KAIT) announced a 6-year roadmap (2012-18) focused on the connectivity and infotainment fields for cars. The 2 main targets of the roadmap are: 1) to improve the V2X data transmission speed to 100Mb/s by 2018, from 5Mb/s in 2012, and 2) to expand in-vehicle customisation services to improve current in-vehicle HMI management systems. Korea: smart-car industry roadmap (2011) Category Objective Time frameInfrastructure-based data integration Data process speed : 10Mb/s→50Mb/s 2012-17Inter-network interface generation Compatibility: 4→10 2015-18V2X-based multi-modal data integration
Data processing speed target: 95Mb/s 2014-17
V2X Wi-Fi Packet latency: 100→10 2011-16
V2X data transmission speed: 5Mb/s→100Mb/s 2012-18HUD augmentation Recognition rate: 70%→85% 2012-14Driver emotion detection Analysis precision rate: 70%→95% 2013-18Driving information sharing system Integration rate: 80%→95% 2012-16Human factor customisation Driver status type: 2→5 2013-18
Customisation service type: 5→10 2013-18
Source: NIPA, Daiwa
Then, in 2015, the Korean Ministry of Science, ICT and Future Planning (MSIP) announced a roadmap, with the following objectives: 1) to encourage collaborative research activities between Korea-based ICT companies and auto companies, and 2) to develop the idea of smart cars to eventually establish a smart traffic network nationally over 2015-19. Korea: smart-car industry roadmap (2015) (KRWbn) Phase I Phase II Phase III
2015 2016 2017 2018 2019 2020-22Budget 4 8 12 6 2 n/aDevelopment schedule
- High-precision map-based auto-location/self-recognition technology - Open-source ICT service platform
Cloud-based service Introducing advanced version of technologies developed during Phase I-II
Telecommunications security
V2X tech. standardisation
Connected driving, computing system
Source: MSIP, Daiwa
Note: SCC = Smart Cruise Control, BSD = Blind Spot Detection, SPAS = Smart Parking Assisting System, HUD = Head-Up Display
In anticipation of the Korean Government’s moves since the early-2010s, the major Korean companies in the relevant smart-car industries have started to collaborate with other companies in the smart-car food chain across industries, showing some results that we believe are paving the way for the development of Korea’s smart-car industry.
Korea: major smart-car milestones by company Industry Company Description Automotive HMC - Launched its proprietary infotainment system, BlueLink (2011) - Founded Hyundai Autron to meet HMG's automotive
semiconductor shipments (Apr 2012) - Started charging for its in-vehicle infotainment system, BlueLink
(May 2014) - Announced it will install Google's Android Auto in its MY16
Sonata (May 2015) Mobis Focusing on: 1) developing in-vehicle telecommunications system,
and 2) establishing a domestic supply chain for automotive electronics
Mando Focusing on the development of chassis-related technologies, such as SCC, auto-parking
Acquired German-based driver assisting system company, DSP-Weuffen (Nov 2013)
ICT Samsung Electronics
Focusing on infotainment solution field in the short term, rather than smart-car product development
Initiated inter-company alliances with BMW and TATA Motors to promote smartphone-integrated solutions with its mobile products
Samsung SDI
Acquired Cheil Industries and established supply-chain integration for its auto-part business
LG Electronics
Launched its vehicle components (VC) business (Feb 2013)
Seeking synergies with LG group affiliates, such as LG Chemical, LG Hausys, LG Innotek and LG CNS
LG Display Planning to focus on the automotive display business, and targets to become the global No.1 autos-display manufacturer in 2015
SK Hynix Engaged in a partnership with NVDIA to enter the infotainment market
SK Telecom
Launched an aftermarket telematics service, T-car service (Jan 2014)
Hancom Acquired MDS Technology (Mar 2014)
Source: Daiwa
Korea’s smart-car industry: who are the major beneficiaries?
Across the sectors Based on our market research on the distinctive features of smart cars compared with ordinary vehicles, we see 4 applications that define a smart car: 1) infotainment/media, 2) advanced telematics, 3) vehicle-to-X communications, and 4) autonomous driving capabilities. As the development of most of these features requires a high standard of IT-related technology, the smart-car universe involves not only the automotive companies, but also the ICT-part makers, ICT solution/software developers, telecommunications operators and even government-led research organisations. We have looked into the relevant players in Korea, and have identified a few candidates that currently have high profiles in the smart-car evolution in the Korea. Firstly, as we have already said, we see the current ADAS product manufacturers in Korea as the major beneficiaries of the smart-car demand trend until 2020, and we expect these companies to emerge as the core players in smart-car components as well (ie, sensors for automotive cameras and radar systems).
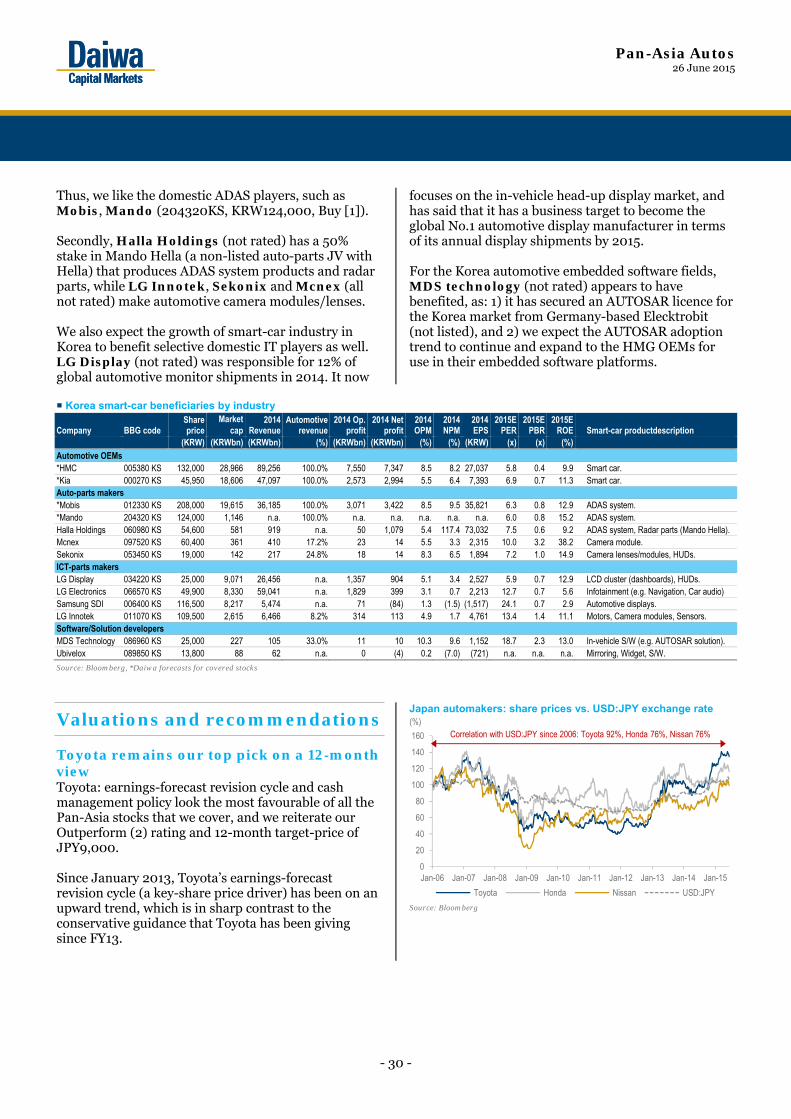
Pan-Asia Autos 26 June 2015
- 30 -
Thus, we like the domestic ADAS players, such as Mobis, Mando (204320KS, KRW124,000, Buy [1]). Secondly, Halla Holdings (not rated) has a 50% stake in Mando Hella (a non-listed auto-parts JV with Hella) that produces ADAS system products and radar parts, while LG Innotek, Sekonix and Mcnex (all not rated) make automotive camera modules/lenses. We also expect the growth of smart-car industry in Korea to benefit selective domestic IT players as well. LG Display (not rated) was responsible for 12% of global automotive monitor shipments in 2014. It now
focuses on the in-vehicle head-up display market, and has said that it has a business target to become the global No.1 automotive display manufacturer in terms of its annual display shipments by 2015. For the Korea automotive embedded software fields, MDS technology (not rated) appears to have benefited, as: 1) it has secured an AUTOSAR licence for the Korea market from Germany-based Elecktrobit (not listed), and 2) we expect the AUTOSAR adoption trend to continue and expand to the HMG OEMs for use in their embedded software platforms.
Korea smart-car beneficiaries by industry
Company BBG code Share price
Market cap
2014 Revenue
Automotiverevenue
2014 Op. profit
2014 Net profit
2014 OPM
2014 NPM
2014 EPS
2015E PER
2015E PBR
2015E ROE Smart-car productdescription
(KRW) (KRWbn) (KRWbn) (%) (KRWbn) (KRWbn) (%) (%) (KRW) (x) (x) (%) Automotive OEMs *HMC 005380 KS 132,000 28,966 89,256 100.0% 7,550 7,347 8.5 8.2 27,037 5.8 0.4 9.9 Smart car. *Kia 000270 KS 45,950 18,606 47,097 100.0% 2,573 2,994 5.5 6.4 7,393 6.9 0.7 11.3 Smart car. Auto-parts makers *Mobis 012330 KS 208,000 19,615 36,185 100.0% 3,071 3,422 8.5 9.5 35,821 6.3 0.8 12.9 ADAS system. *Mando 204320 KS 124,000 1,146 n.a. 100.0% n.a. n.a. n.a. n.a. n.a. 6.0 0.8 15.2 ADAS system. Halla Holdings 060980 KS 54,600 581 919 n.a. 50 1,079 5.4 117.4 73,032 7.5 0.6 9.2 ADAS system, Radar parts (Mando Hella). Mcnex 097520 KS 60,400 361 410 17.2% 23 14 5.5 3.3 2,315 10.0 3.2 38.2 Camera module. Sekonix 053450 KS 19,000 142 217 24.8% 18 14 8.3 6.5 1,894 7.2 1.0 14.9 Camera lenses/modules, HUDs. ICT-parts makers LG Display 034220 KS 25,000 9,071 26,456 n.a. 1,357 904 5.1 3.4 2,527 5.9 0.7 12.9 LCD cluster (dashboards), HUDs. LG Electronics 066570 KS 49,900 8,330 59,041 n.a. 1,829 399 3.1 0.7 2,213 12.7 0.7 5.6 Infotainment (e.g. Navigation, Car audio) Samsung SDI 006400 KS 116,500 8,217 5,474 n.a. 71 (84) 1.3 (1.5) (1,517) 24.1 0.7 2.9 Automotive displays. LG Innotek 011070 KS 109,500 2,615 6,466 8.2% 314 113 4.9 1.7 4,761 13.4 1.4 11.1 Motors, Camera modules, Sensors. Software/Solution developers MDS Technology 086960 KS 25,000 227 105 33.0% 11 10 10.3 9.6 1,152 18.7 2.3 13.0 In-vehicle S/W (e.g. AUTOSAR solution). Ubivelox 089850 KS 13,800 88 62 n.a. 0 (4) 0.2 (7.0) (721) n.a. n.a. n.a. Mirroring, Widget, S/W.
Source: Bloomberg, *Daiwa forecasts for covered stocks
Valuations and recommendations
Toyota remains our top pick on a 12-month view Toyota: earnings-forecast revision cycle and cash management policy look the most favourable of all the Pan-Asia stocks that we cover, and we reiterate our Outperform (2) rating and 12-month target-price of JPY9,000. Since January 2013, Toyota’s earnings-forecast revision cycle (a key-share price driver) has been on an upward trend, which is in sharp contrast to the conservative guidance that Toyota has been giving since FY13.
Japan automakers: share prices vs. USD:JPY exchange rate
Source: Bloomberg
0
20
40
60
80
100
120
140
160
Jan-06 Jan-07 Jan-08 Jan-09 Jan-10 Jan-11 Jan-12 Jan-13 Jan-14 Jan-15
Toyota Honda Nissan USD:JPY
(%)Correlation with USD:JPY since 2006: Toyota 92%, Honda 76%, Nissan 76%
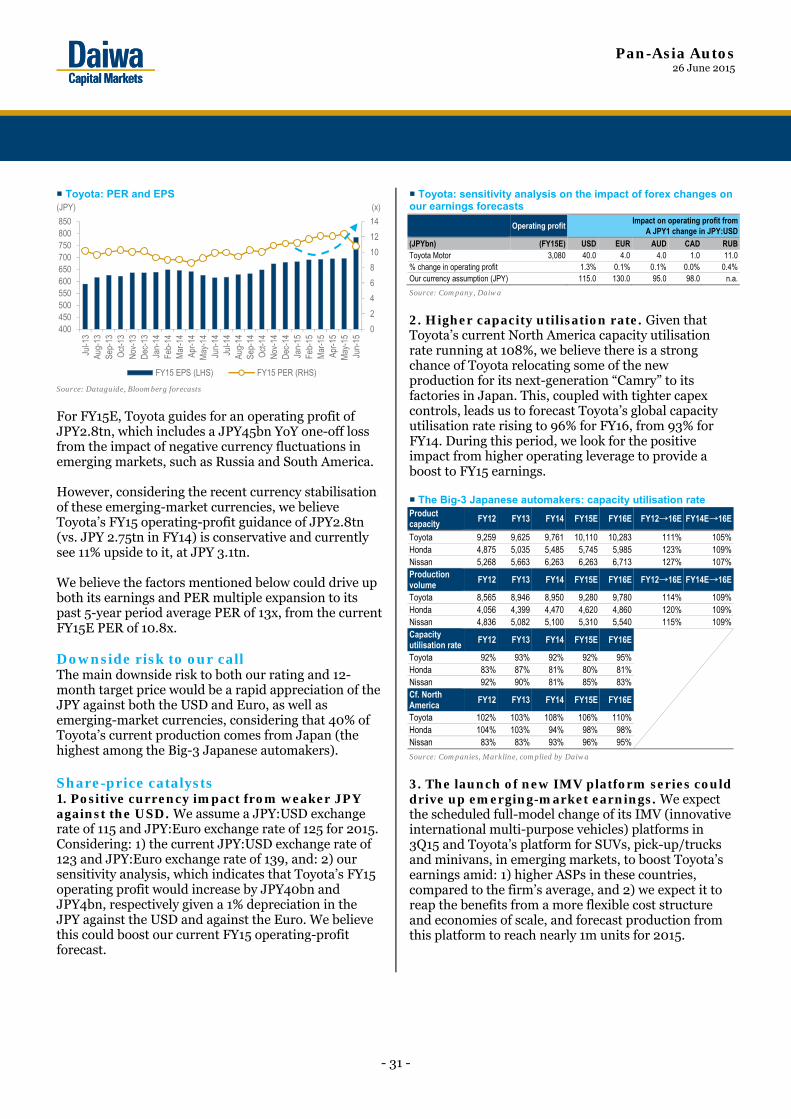
Pan-Asia Autos 26 June 2015
- 31 -
Toyota: PER and EPS
Source: Dataguide, Bloomberg forecasts
For FY15E, Toyota guides for an operating profit of JPY2.8tn, which includes a JPY45bn YoY one-off loss from the impact of negative currency fluctuations in emerging markets, such as Russia and South America. However, considering the recent currency stabilisation of these emerging-market currencies, we believe Toyota’s FY15 operating-profit guidance of JPY2.8tn (vs. JPY 2.75tn in FY14) is conservative and currently see 11% upside to it, at JPY 3.1tn. We believe the factors mentioned below could drive up both its earnings and PER multiple expansion to its past 5-year period average PER of 13x, from the current FY15E PER of 10.8x. Downside risk to our call The main downside risk to both our rating and 12-month target price would be a rapid appreciation of the JPY against both the USD and Euro, as well as emerging-market currencies, considering that 40% of Toyota’s current production comes from Japan (the highest among the Big-3 Japanese automakers). Share-price catalysts 1. Positive currency impact from weaker JPY against the USD. We assume a JPY:USD exchange rate of 115 and JPY:Euro exchange rate of 125 for 2015. Considering: 1) the current JPY:USD exchange rate of 123 and JPY:Euro exchange rate of 139, and: 2) our sensitivity analysis, which indicates that Toyota’s FY15 operating profit would increase by JPY40bn and JPY4bn, respectively given a 1% depreciation in the JPY against the USD and against the Euro. We believe this could boost our current FY15 operating-profit forecast.
Toyota: sensitivity analysis on the impact of forex changes on our earnings forecasts
Operating profit
Impact on operating profit from A JPY1 change in JPY:USD
(JPYbn) (FY15E) USD EUR AUD CAD RUBToyota Motor 3,080 40.0 4.0 4.0 1.0 11.0% change in operating profit 1.3% 0.1% 0.1% 0.0% 0.4%Our currency assumption (JPY) 115.0 130.0 95.0 98.0 n.a.
Source: Company, Daiwa
2. Higher capacity utilisation rate. Given that Toyota’s current North America capacity utilisation rate running at 108%, we believe there is a strong chance of Toyota relocating some of the new production for its next-generation “Camry” to its factories in Japan. This, coupled with tighter capex controls, leads us to forecast Toyota’s global capacity utilisation rate rising to 96% for FY16, from 93% for FY14. During this period, we look for the positive impact from higher operating leverage to provide a boost to FY15 earnings.
The Big-3 Japanese automakers: capacity utilisation rate Product capacity FY12 FY13 FY14 FY15E FY16E FY12→16E FY14E→16E
Toyota 9,259 9,625 9,761 10,110 10,283 111% 105%Honda 4,875 5,035 5,485 5,745 5,985 123% 109%Nissan 5,268 5,663 6,263 6,263 6,713 127% 107%Production volume
FY12 FY13 FY14 FY15E FY16E FY12→16E FY14E→16E
Toyota 8,565 8,946 8,950 9,280 9,780 114% 109%Honda 4,056 4,399 4,470 4,620 4,860 120% 109%Nissan 4,836 5,082 5,100 5,310 5,540 115% 109%Capacity utilisation rate FY12 FY13 FY14 FY15E FY16E
Toyota 92% 93% 92% 92% 95% Honda 83% 87% 81% 80% 81% Nissan 92% 90% 81% 85% 83% Cf. North America FY12 FY13 FY14 FY15E FY16E
Toyota 102% 103% 108% 106% 110% Honda 104% 103% 94% 98% 98% Nissan 83% 83% 93% 96% 95%
Source: Companies, Markline, complied by Daiwa
3. The launch of new IMV platform series could drive up emerging-market earnings. We expect the scheduled full-model change of its IMV (innovative international multi-purpose vehicles) platforms in 3Q15 and Toyota’s platform for SUVs, pick-up/trucks and minivans, in emerging markets, to boost Toyota’s earnings amid: 1) higher ASPs in these countries, compared to the firm’s average, and 2) we expect it to reap the benefits from a more flexible cost structure and economies of scale, and forecast production from this platform to reach nearly 1m units for 2015.
0
2
4
6
8
10
12
14
400450500550600650700750800850
Jul-1
3Au
g-13
Sep-
13O
ct-1
3N
ov-1
3D
ec-1
3Ja
n-14
Feb-
14M
ar-1
4Ap
r-14
May
-14
Jun-
14Ju
l-14
Aug-
14Se
p-14
Oct
-14
Nov
-14
Dec
-14
Jan-
15Fe
b-15
Mar
-15
Apr-1
5M
ay-1
5Ju
n-15
FY15 EPS (LHS) FY15 PER (RHS)
(JPY) (x)
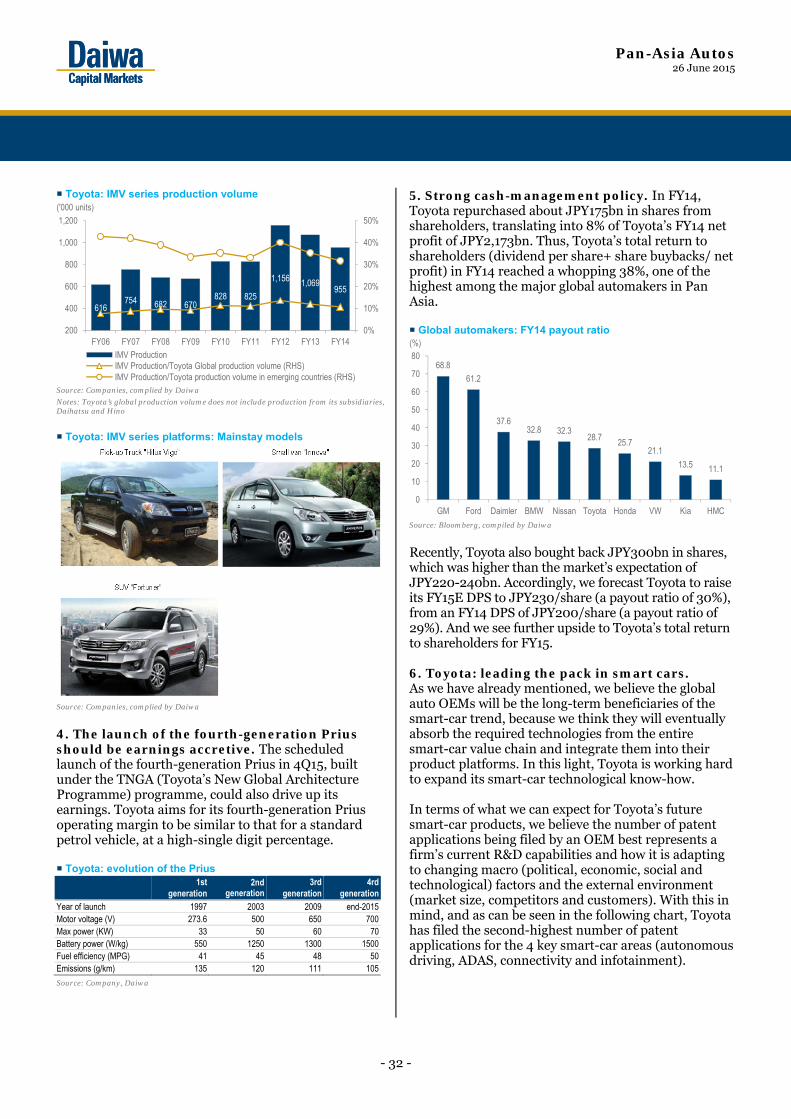
Pan-Asia Autos 26 June 2015
- 32 -
Toyota: IMV series production volume
Source: Companies, complied by Daiwa
Notes: Toyota’s global production volume does not include production from its subsidiaries, Daihatsu and Hino
Toyota: IMV series platforms: Mainstay models
Source: Companies, complied by Daiwa
4. The launch of the fourth-generation Prius should be earnings accretive. The scheduled launch of the fourth-generation Prius in 4Q15, built under the TNGA (Toyota’s New Global Architecture Programme) programme, could also drive up its earnings. Toyota aims for its fourth-generation Prius operating margin to be similar to that for a standard petrol vehicle, at a high-single digit percentage. Toyota: evolution of the Prius
1st
generation 2nd
generation 3rd
generation 4rd
generationYear of launch 1997 2003 2009 end-2015Motor voltage (V) 273.6 500 650 700Max power (KW) 33 50 60 70Battery power (W/kg) 550 1250 1300 1500Fuel efficiency (MPG) 41 45 48 50Emissions (g/km) 135 120 111 105
Source: Company, Daiwa
5. Strong cash-management policy. In FY14, Toyota repurchased about JPY175bn in shares from shareholders, translating into 8% of Toyota’s FY14 net profit of JPY2,173bn. Thus, Toyota’s total return to shareholders (dividend per share+ share buybacks/ net profit) in FY14 reached a whopping 38%, one of the highest among the major global automakers in Pan Asia. Global automakers: FY14 payout ratio
Source: Bloomberg, compiled by Daiwa
Recently, Toyota also bought back JPY300bn in shares, which was higher than the market’s expectation of JPY220-240bn. Accordingly, we forecast Toyota to raise its FY15E DPS to JPY230/share (a payout ratio of 30%), from an FY14 DPS of JPY200/share (a payout ratio of 29%). And we see further upside to Toyota’s total return to shareholders for FY15. 6. Toyota: leading the pack in smart cars. As we have already mentioned, we believe the global auto OEMs will be the long-term beneficiaries of the smart-car trend, because we think they will eventually absorb the required technologies from the entire smart-car value chain and integrate them into their product platforms. In this light, Toyota is working hard to expand its smart-car technological know-how. In terms of what we can expect for Toyota’s future smart-car products, we believe the number of patent applications being filed by an OEM best represents a firm’s current R&D capabilities and how it is adapting to changing macro (political, economic, social and technological) factors and the external environment (market size, competitors and customers). With this in mind, and as can be seen in the following chart, Toyota has filed the second-highest number of patent applications for the 4 key smart-car areas (autonomous driving, ADAS, connectivity and infotainment).
616754 682 670
828 825
1,156 1,069955
0%
10%
20%
30%
40%
50%
200
400
600
800
1,000
1,200
FY06 FY07 FY08 FY09 FY10 FY11 FY12 FY13 FY14IMV ProductionIMV Production/Toyota Global production volume (RHS)IMV Production/Toyota production volume in emerging countries (RHS)
('000 units)
68.8
61.2
37.632.8 32.3
28.7 25.721.1
13.5 11.1
0
10
20
30
40
50
60
70
80
GM Ford Daimler BMW Nissan Toyota Honda VW Kia HMC
(%)
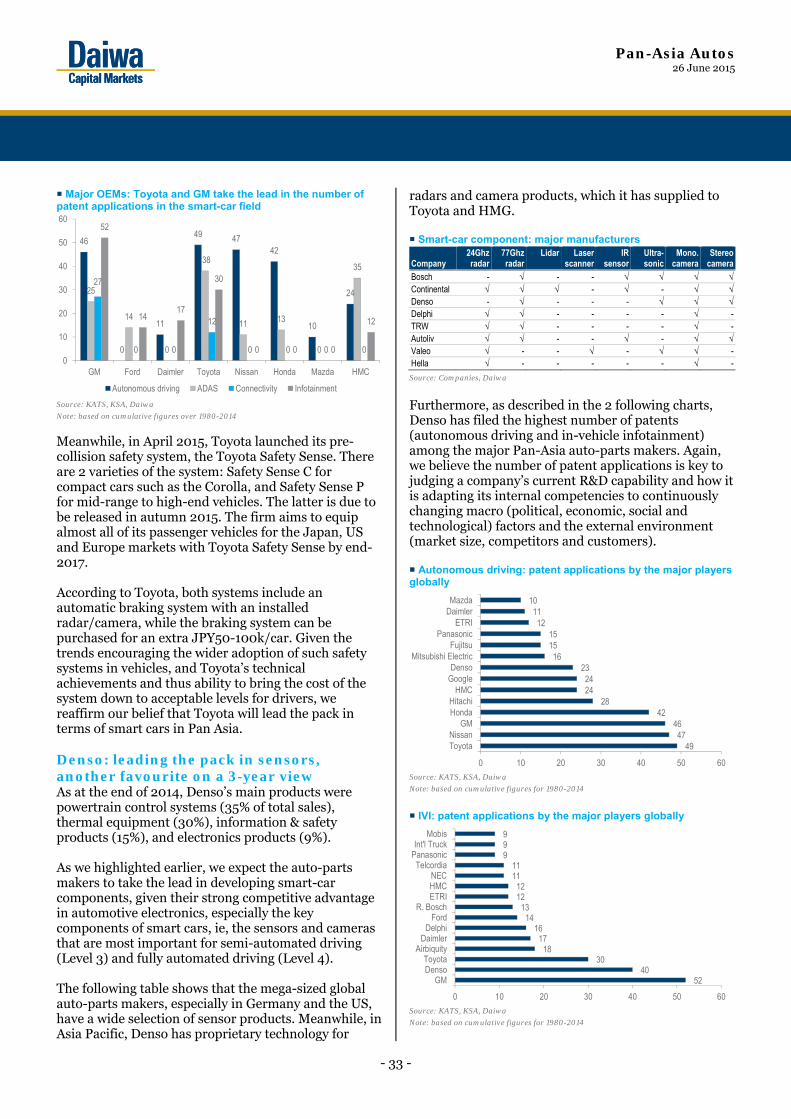
Pan-Asia Autos 26 June 2015
- 33 -
Major OEMs: Toyota and GM take the lead in the number of patent applications in the smart-car field
Source: KATS, KSA, Daiwa
Note: based on cumulative figures over 1980-2014
Meanwhile, in April 2015, Toyota launched its pre-collision safety system, the Toyota Safety Sense. There are 2 varieties of the system: Safety Sense C for compact cars such as the Corolla, and Safety Sense P for mid-range to high-end vehicles. The latter is due to be released in autumn 2015. The firm aims to equip almost all of its passenger vehicles for the Japan, US and Europe markets with Toyota Safety Sense by end-2017. According to Toyota, both systems include an automatic braking system with an installed radar/camera, while the braking system can be purchased for an extra JPY50-100k/car. Given the trends encouraging the wider adoption of such safety systems in vehicles, and Toyota’s technical achievements and thus ability to bring the cost of the system down to acceptable levels for drivers, we reaffirm our belief that Toyota will lead the pack in terms of smart cars in Pan Asia. Denso: leading the pack in sensors, another favourite on a 3-year view As at the end of 2014, Denso’s main products were powertrain control systems (35% of total sales), thermal equipment (30%), information & safety products (15%), and electronics products (9%). As we highlighted earlier, we expect the auto-parts makers to take the lead in developing smart-car components, given their strong competitive advantage in automotive electronics, especially the key components of smart cars, ie, the sensors and cameras that are most important for semi-automated driving (Level 3) and fully automated driving (Level 4). The following table shows that the mega-sized global auto-parts makers, especially in Germany and the US, have a wide selection of sensor products. Meanwhile, in Asia Pacific, Denso has proprietary technology for
radars and camera products, which it has supplied to Toyota and HMG. Smart-car component: major manufacturers
Company 24Ghz radar
77Ghz radar
Lidar Laser scanner
IR sensor
Ultra-sonic
Mono. camera
Stereo camera
Bosch - √ - - √ √ √ √Continental √ √ √ - √ - √ √Denso - √ - - - √ √ √Delphi √ √ - - - - √ -TRW √ √ - - - - √ -Autoliv √ √ - - √ - √ √Valeo √ - - √ - √ √ -Hella √ - - - - - √ -
Source: Companies, Daiwa
Furthermore, as described in the 2 following charts, Denso has filed the highest number of patents (autonomous driving and in-vehicle infotainment) among the major Pan-Asia auto-parts makers. Again, we believe the number of patent applications is key to judging a company’s current R&D capability and how it is adapting its internal competencies to continuously changing macro (political, economic, social and technological) factors and the external environment (market size, competitors and customers). Autonomous driving: patent applications by the major players globally
Source: KATS, KSA, Daiwa
Note: based on cumulative figures for 1980-2014
IVI: patent applications by the major players globally
Source: KATS, KSA, Daiwa
Note: based on cumulative figures for 1980-2014
46
0
11
49 4742
10
2425
14
0
38
11 13
0
35
27
0 0
12
0 0 0 0
52
1417
30
0 0 0
12
0
10
20
30
40
50
60
GM Ford Daimler Toyota Nissan Honda Mazda HMC
Autonomous driving ADAS Connectivity Infotainment
4947
4642
282424
2316
1515
1211
10
0 10 20 30 40 50 60
ToyotaNissan
GMHondaHitachi
HMCGoogleDenso
Mitsubishi ElectricFujitsu
PanasonicETRI
DaimlerMazda
5240
3018
1716
1413
1212
1111
999
0 10 20 30 40 50 60
GMDensoToyota
AirbiquityDaimler
DelphiFord
R. BoschETRIHMCNEC
TelcordiaPanasonicInt'l Truck
Mobis
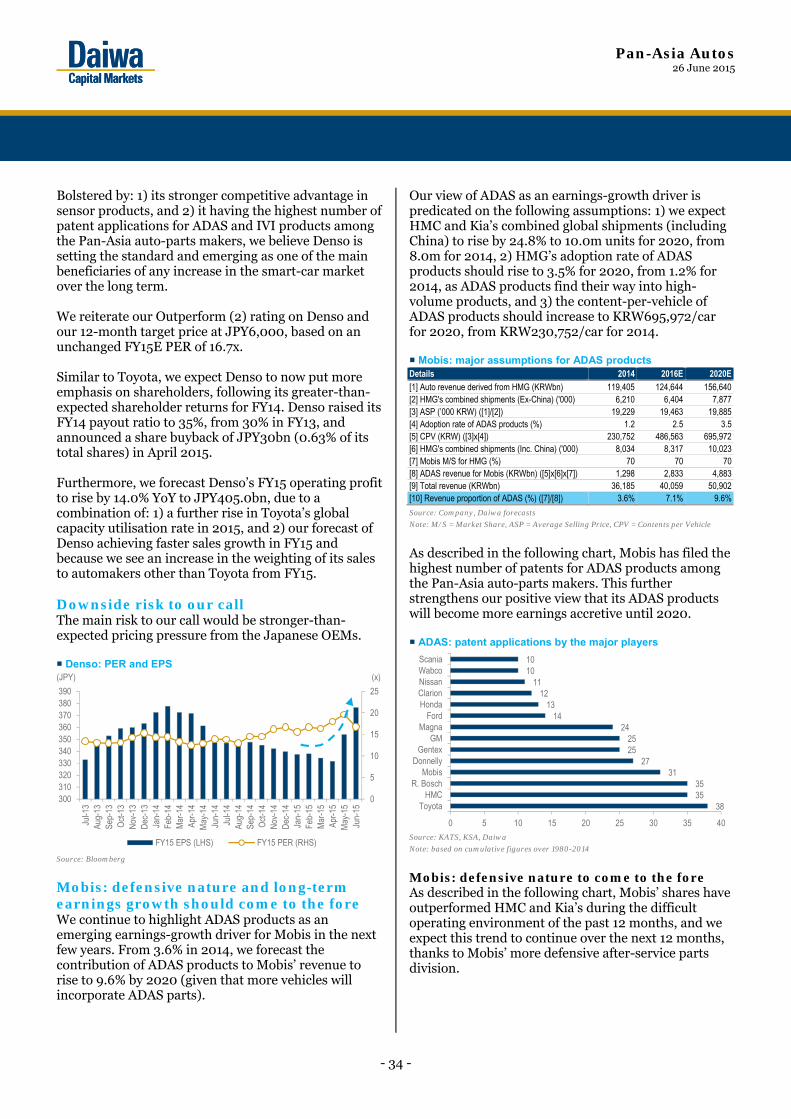
Pan-Asia Autos 26 June 2015
- 34 -
Bolstered by: 1) its stronger competitive advantage in sensor products, and 2) it having the highest number of patent applications for ADAS and IVI products among the Pan-Asia auto-parts makers, we believe Denso is setting the standard and emerging as one of the main beneficiaries of any increase in the smart-car market over the long term. We reiterate our Outperform (2) rating on Denso and our 12-month target price at JPY6,000, based on an unchanged FY15E PER of 16.7x. Similar to Toyota, we expect Denso to now put more emphasis on shareholders, following its greater-than-expected shareholder returns for FY14. Denso raised its FY14 payout ratio to 35%, from 30% in FY13, and announced a share buyback of JPY30bn (0.63% of its total shares) in April 2015. Furthermore, we forecast Denso’s FY15 operating profit to rise by 14.0% YoY to JPY405.0bn, due to a combination of: 1) a further rise in Toyota’s global capacity utilisation rate in 2015, and 2) our forecast of Denso achieving faster sales growth in FY15 and because we see an increase in the weighting of its sales to automakers other than Toyota from FY15. Downside risk to our call The main risk to our call would be stronger-than-expected pricing pressure from the Japanese OEMs. Denso: PER and EPS
Source: Bloomberg
Mobis: defensive nature and long-term earnings growth should come to the fore We continue to highlight ADAS products as an emerging earnings-growth driver for Mobis in the next few years. From 3.6% in 2014, we forecast the contribution of ADAS products to Mobis’ revenue to rise to 9.6% by 2020 (given that more vehicles will incorporate ADAS parts).
Our view of ADAS as an earnings-growth driver is predicated on the following assumptions: 1) we expect HMC and Kia’s combined global shipments (including China) to rise by 24.8% to 10.0m units for 2020, from 8.0m for 2014, 2) HMG’s adoption rate of ADAS products should rise to 3.5% for 2020, from 1.2% for 2014, as ADAS products find their way into high-volume products, and 3) the content-per-vehicle of ADAS products should increase to KRW695,972/car for 2020, from KRW230,752/car for 2014. Mobis: major assumptions for ADAS products Details 2014 2016E 2020E[1] Auto revenue derived from HMG (KRWbn) 119,405 124,644 156,640[2] HMG's combined shipments (Ex-China) ('000) 6,210 6,404 7,877[3] ASP (’000 KRW) ([1]/[2]) 19,229 19,463 19,885[4] Adoption rate of ADAS products (%) 1.2 2.5 3.5[5] CPV (KRW) ([3]x[4]) 230,752 486,563 695,972[6] HMG's combined shipments (Inc. China) ('000) 8,034 8,317 10,023 [7] Mobis M/S for HMG (%) 70 70 70[8] ADAS revenue for Mobis (KRWbn) ([5]x[6]x[7]) 1,298 2,833 4,883[9] Total revenue (KRWbn) 36,185 40,059 50,902[10] Revenue proportion of ADAS (%) ([7]/[8]) 3.6% 7.1% 9.6%
Source: Company, Daiwa forecasts
Note: M/S = Market Share, ASP = Average Selling Price, CPV = Contents per Vehicle
As described in the following chart, Mobis has filed the highest number of patents for ADAS products among the Pan-Asia auto-parts makers. This further strengthens our positive view that its ADAS products will become more earnings accretive until 2020. ADAS: patent applications by the major players
Source: KATS, KSA, Daiwa
Note: based on cumulative figures over 1980-2014
Mobis: defensive nature to come to the fore As described in the following chart, Mobis’ shares have outperformed HMC and Kia’s during the difficult operating environment of the past 12 months, and we expect this trend to continue over the next 12 months, thanks to Mobis’ more defensive after-service parts division.
0
5
10
15
20
25
300310320330340350360370380390
Jul-1
3Au
g-13
Sep-
13O
ct-1
3N
ov-1
3D
ec-1
3Ja
n-14
Feb-
14M
ar-1
4Ap
r-14
May
-14
Jun-
14Ju
l-14
Aug-
14Se
p-14
Oct
-14
Nov
-14
Dec
-14
Jan-
15Fe
b-15
Mar
-15
Apr-1
5M
ay-1
5Ju
n-15
FY15 EPS (LHS) FY15 PER (RHS)
(JPY) (x)
383535
3127
2525
2414
1312
111010
0 5 10 15 20 25 30 35 40
ToyotaHMC
R. BoschMobis
DonnellyGentex
GMMagna
FordHondaClarionNissanWabcoScania
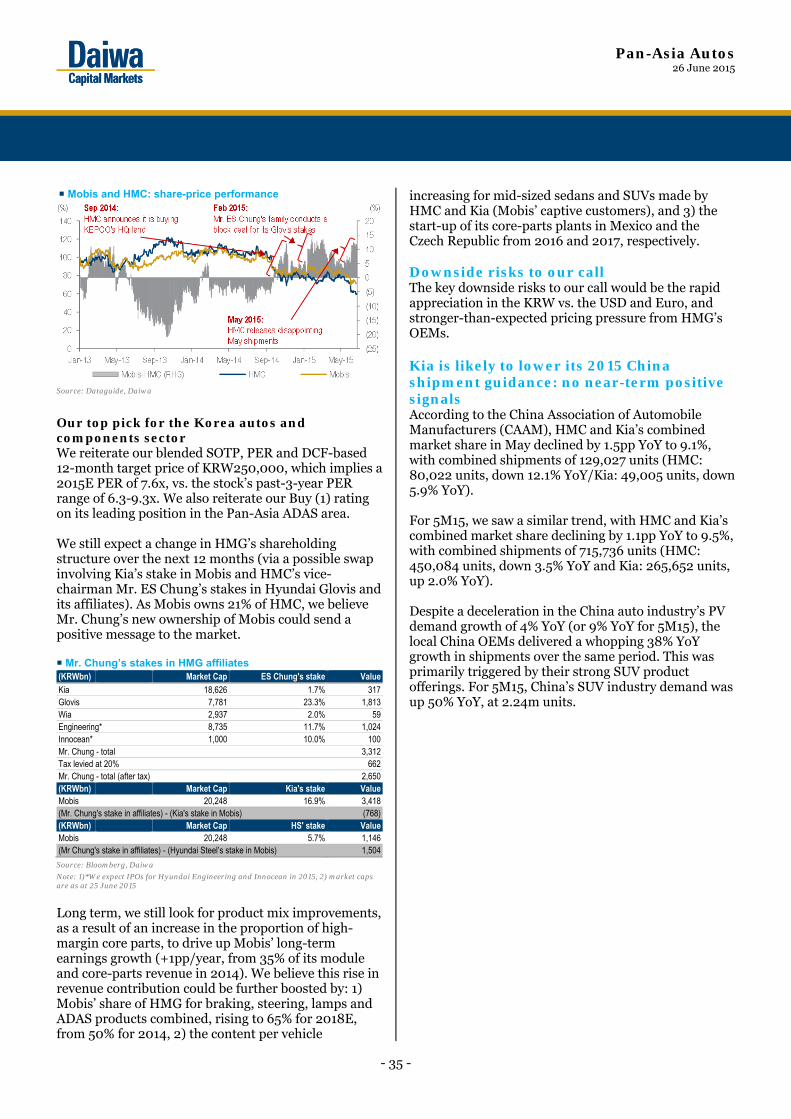
Pan-Asia Autos 26 June 2015
- 35 -
Mobis and HMC: share-price performance
Source: Dataguide, Daiwa
Our top pick for the Korea autos and components sector We reiterate our blended SOTP, PER and DCF-based 12-month target price of KRW250,000, which implies a 2015E PER of 7.6x, vs. the stock’s past-3-year PER range of 6.3-9.3x. We also reiterate our Buy (1) rating on its leading position in the Pan-Asia ADAS area. We still expect a change in HMG’s shareholding structure over the next 12 months (via a possible swap involving Kia’s stake in Mobis and HMC’s vice-chairman Mr. ES Chung’s stakes in Hyundai Glovis and its affiliates). As Mobis owns 21% of HMC, we believe Mr. Chung’s new ownership of Mobis could send a positive message to the market. Mr. Chung’s stakes in HMG affiliates (KRWbn) Market Cap ES Chung's stake ValueKia 18,626 1.7% 317Glovis 7,781 23.3% 1,813Wia 2,937 2.0% 59Engineering* 8,735 11.7% 1,024Innocean* 1,000 10.0% 100Mr. Chung - total 3,312Tax levied at 20% 662Mr. Chung - total (after tax) 2,650(KRWbn) Market Cap Kia's stake ValueMobis 20,248 16.9% 3,418(Mr. Chung's stake in affiliates) - (Kia's stake in Mobis) (768)(KRWbn) Market Cap HS' stake ValueMobis 20,248 5.7% 1,146(Mr Chung's stake in affiliates) - (Hyundai Steel’s stake in Mobis) 1,504
Source: Bloomberg, Daiwa
Note: 1)*We expect IPOs for Hyundai Engineering and Innocean in 2015, 2) market caps are as at 25 June 2015
Long term, we still look for product mix improvements, as a result of an increase in the proportion of high-margin core parts, to drive up Mobis’ long-term earnings growth (+1pp/year, from 35% of its module and core-parts revenue in 2014). We believe this rise in revenue contribution could be further boosted by: 1) Mobis’ share of HMG for braking, steering, lamps and ADAS products combined, rising to 65% for 2018E, from 50% for 2014, 2) the content per vehicle
increasing for mid-sized sedans and SUVs made by HMC and Kia (Mobis’ captive customers), and 3) the start-up of its core-parts plants in Mexico and the Czech Republic from 2016 and 2017, respectively. Downside risks to our call The key downside risks to our call would be the rapid appreciation in the KRW vs. the USD and Euro, and stronger-than-expected pricing pressure from HMG’s OEMs. Kia is likely to lower its 2015 China shipment guidance: no near-term positive signals According to the China Association of Automobile Manufacturers (CAAM), HMC and Kia’s combined market share in May declined by 1.5pp YoY to 9.1%, with combined shipments of 129,027 units (HMC: 80,022 units, down 12.1% YoY/Kia: 49,005 units, down 5.9% YoY). For 5M15, we saw a similar trend, with HMC and Kia’s combined market share declining by 1.1pp YoY to 9.5%, with combined shipments of 715,736 units (HMC: 450,084 units, down 3.5% YoY and Kia: 265,652 units, up 2.0% YoY). Despite a deceleration in the China auto industry’s PV demand growth of 4% YoY (or 9% YoY for 5M15), the local China OEMs delivered a whopping 38% YoY growth in shipments over the same period. This was primarily triggered by their strong SUV product offerings. For 5M15, China’s SUV industry demand was up 50% YoY, at 2.24m units.
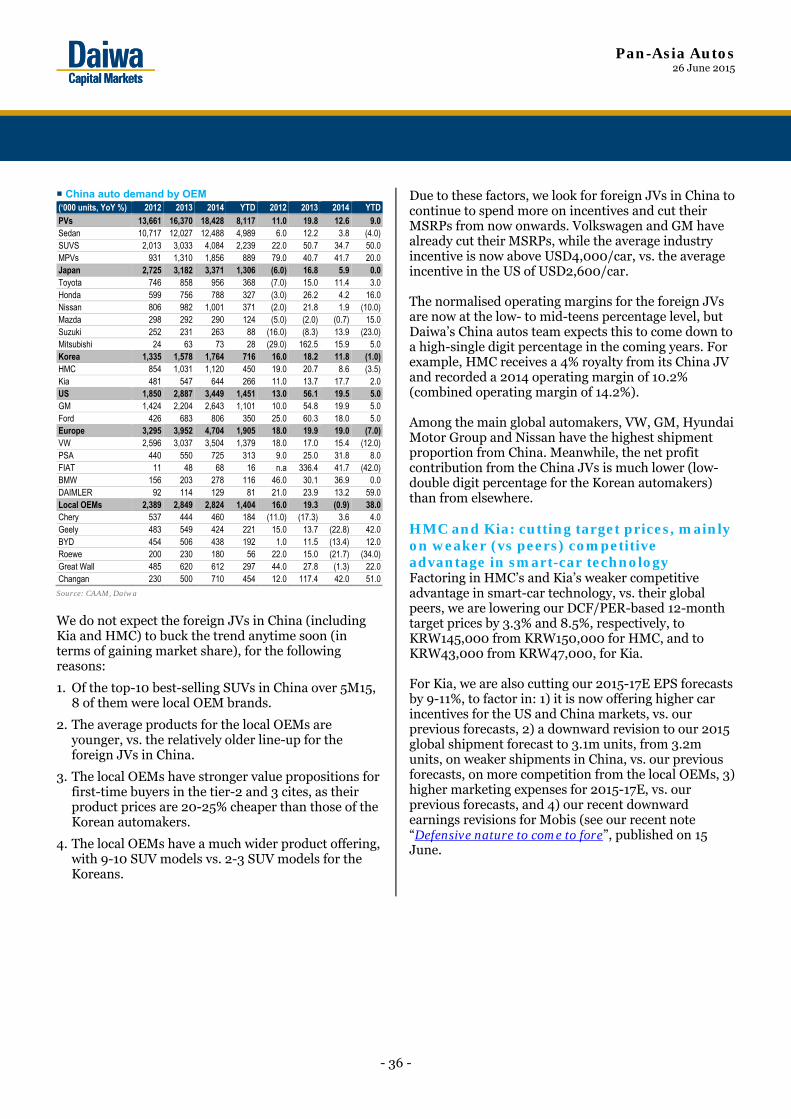
Pan-Asia Autos 26 June 2015
- 36 -
China auto demand by OEM (‘000 units, YoY %) 2012 2013 2014 YTD 2012 2013 2014 YTD PVs 13,661 16,370 18,428 8,117 11.0 19.8 12.6 9.0 Sedan 10,717 12,027 12,488 4,989 6.0 12.2 3.8 (4.0)SUVS 2,013 3,033 4,084 2,239 22.0 50.7 34.7 50.0 MPVs 931 1,310 1,856 889 79.0 40.7 41.7 20.0 Japan 2,725 3,182 3,371 1,306 (6.0) 16.8 5.9 0.0 Toyota 746 858 956 368 (7.0) 15.0 11.4 3.0 Honda 599 756 788 327 (3.0) 26.2 4.2 16.0 Nissan 806 982 1,001 371 (2.0) 21.8 1.9 (10.0)Mazda 298 292 290 124 (5.0) (2.0) (0.7) 15.0 Suzuki 252 231 263 88 (16.0) (8.3) 13.9 (23.0)Mitsubishi 24 63 73 28 (29.0) 162.5 15.9 5.0 Korea 1,335 1,578 1,764 716 16.0 18.2 11.8 (1.0)HMC 854 1,031 1,120 450 19.0 20.7 8.6 (3.5)Kia 481 547 644 266 11.0 13.7 17.7 2.0 US 1,850 2,887 3,449 1,451 13.0 56.1 19.5 5.0 GM 1,424 2,204 2,643 1,101 10.0 54.8 19.9 5.0 Ford 426 683 806 350 25.0 60.3 18.0 5.0 Europe 3,295 3,952 4,704 1,905 18.0 19.9 19.0 (7.0)VW 2,596 3,037 3,504 1,379 18.0 17.0 15.4 (12.0)PSA 440 550 725 313 9.0 25.0 31.8 8.0 FIAT 11 48 68 16 n.a 336.4 41.7 (42.0)BMW 156 203 278 116 46.0 30.1 36.9 0.0 DAIMLER 92 114 129 81 21.0 23.9 13.2 59.0 Local OEMs 2,389 2,849 2,824 1,404 16.0 19.3 (0.9) 38.0 Chery 537 444 460 184 (11.0) (17.3) 3.6 4.0 Geely 483 549 424 221 15.0 13.7 (22.8) 42.0 BYD 454 506 438 192 1.0 11.5 (13.4) 12.0 Roewe 200 230 180 56 22.0 15.0 (21.7) (34.0)Great Wall 485 620 612 297 44.0 27.8 (1.3) 22.0 Changan 230 500 710 454 12.0 117.4 42.0 51.0
Source: CAAM, Daiwa
We do not expect the foreign JVs in China (including Kia and HMC) to buck the trend anytime soon (in terms of gaining market share), for the following reasons:
1. Of the top-10 best-selling SUVs in China over 5M15, 8 of them were local OEM brands.
2. The average products for the local OEMs are younger, vs. the relatively older line-up for the foreign JVs in China.
3. The local OEMs have stronger value propositions for first-time buyers in the tier-2 and 3 cites, as their product prices are 20-25% cheaper than those of the Korean automakers.
4. The local OEMs have a much wider product offering, with 9-10 SUV models vs. 2-3 SUV models for the Koreans.
Due to these factors, we look for foreign JVs in China to continue to spend more on incentives and cut their MSRPs from now onwards. Volkswagen and GM have already cut their MSRPs, while the average industry incentive is now above USD4,000/car, vs. the average incentive in the US of USD2,600/car. The normalised operating margins for the foreign JVs are now at the low- to mid-teens percentage level, but Daiwa’s China autos team expects this to come down to a high-single digit percentage in the coming years. For example, HMC receives a 4% royalty from its China JV and recorded a 2014 operating margin of 10.2% (combined operating margin of 14.2%). Among the main global automakers, VW, GM, Hyundai Motor Group and Nissan have the highest shipment proportion from China. Meanwhile, the net profit contribution from the China JVs is much lower (low-double digit percentage for the Korean automakers) than from elsewhere. HMC and Kia: cutting target prices, mainly on weaker (vs peers) competitive advantage in smart-car technology Factoring in HMC’s and Kia’s weaker competitive advantage in smart-car technology, vs. their global peers, we are lowering our DCF/PER-based 12-month target prices by 3.3% and 8.5%, respectively, to KRW145,000 from KRW150,000 for HMC, and to KRW43,000 from KRW47,000, for Kia. For Kia, we are also cutting our 2015-17E EPS forecasts by 9-11%, to factor in: 1) it is now offering higher car incentives for the US and China markets, vs. our previous forecasts, 2) a downward revision to our 2015 global shipment forecast to 3.1m units, from 3.2m units, on weaker shipments in China, vs. our previous forecasts, on more competition from the local OEMs, 3) higher marketing expenses for 2015-17E, vs. our previous forecasts, and 4) our recent downward earnings revisions for Mobis (see our recent note “Defensive nature to come to fore”, published on 15 June.
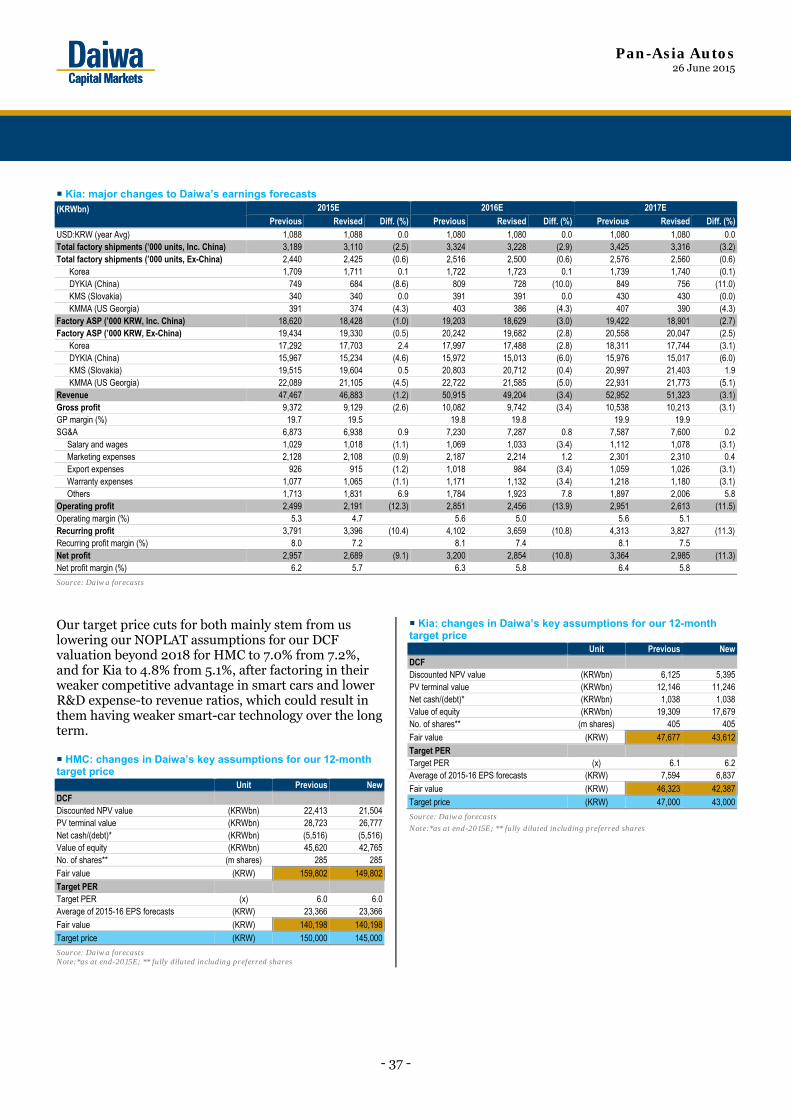
Pan-Asia Autos 26 June 2015
- 37 -
Kia: major changes to Daiwa’s earnings forecasts (KRWbn) 2015E 2016E 2017E
Previous Revised Diff. (%) Previous Revised Diff. (%) Previous Revised Diff. (%)USD:KRW (year Avg) 1,088 1,088 0.0 1,080 1,080 0.0 1,080 1,080 0.0 Total factory shipments (’000 units, Inc. China) 3,189 3,110 (2.5) 3,324 3,228 (2.9) 3,425 3,316 (3.2)Total factory shipments (’000 units, Ex-China) 2,440 2,425 (0.6) 2,516 2,500 (0.6) 2,576 2,560 (0.6) Korea 1,709 1,711 0.1 1,722 1,723 0.1 1,739 1,740 (0.1) DYKIA (China) 749 684 (8.6) 809 728 (10.0) 849 756 (11.0) KMS (Slovakia) 340 340 0.0 391 391 0.0 430 430 (0.0) KMMA (US Georgia) 391 374 (4.3) 403 386 (4.3) 407 390 (4.3)Factory ASP (’000 KRW, Inc. China) 18,620 18,428 (1.0) 19,203 18,629 (3.0) 19,422 18,901 (2.7)Factory ASP (’000 KRW, Ex-China) 19,434 19,330 (0.5) 20,242 19,682 (2.8) 20,558 20,047 (2.5) Korea 17,292 17,703 2.4 17,997 17,488 (2.8) 18,311 17,744 (3.1) DYKIA (China) 15,967 15,234 (4.6) 15,972 15,013 (6.0) 15,976 15,017 (6.0) KMS (Slovakia) 19,515 19,604 0.5 20,803 20,712 (0.4) 20,997 21,403 1.9 KMMA (US Georgia) 22,089 21,105 (4.5) 22,722 21,585 (5.0) 22,931 21,773 (5.1)Revenue 47,467 46,883 (1.2) 50,915 49,204 (3.4) 52,952 51,323 (3.1)Gross profit 9,372 9,129 (2.6) 10,082 9,742 (3.4) 10,538 10,213 (3.1)GP margin (%) 19.7 19.5 19.8 19.8 19.9 19.9 SG&A 6,873 6,938 0.9 7,230 7,287 0.8 7,587 7,600 0.2 Salary and wages 1,029 1,018 (1.1) 1,069 1,033 (3.4) 1,112 1,078 (3.1) Marketing expenses 2,128 2,108 (0.9) 2,187 2,214 1.2 2,301 2,310 0.4 Export expenses 926 915 (1.2) 1,018 984 (3.4) 1,059 1,026 (3.1) Warranty expenses 1,077 1,065 (1.1) 1,171 1,132 (3.4) 1,218 1,180 (3.1) Others 1,713 1,831 6.9 1,784 1,923 7.8 1,897 2,006 5.8 Operating profit 2,499 2,191 (12.3) 2,851 2,456 (13.9) 2,951 2,613 (11.5)Operating margin (%) 5.3 4.7 5.6 5.0 5.6 5.1Recurring profit 3,791 3,396 (10.4) 4,102 3,659 (10.8) 4,313 3,827 (11.3)Recurring profit margin (%) 8.0 7.2 8.1 7.4 8.1 7.5Net profit 2,957 2,689 (9.1) 3,200 2,854 (10.8) 3,364 2,985 (11.3)Net profit margin (%) 6.2 5.7 6.3 5.8 6.4 5.8
Source: Daiwa forecasts
Our target price cuts for both mainly stem from us lowering our NOPLAT assumptions for our DCF valuation beyond 2018 for HMC to 7.0% from 7.2%, and for Kia to 4.8% from 5.1%, after factoring in their weaker competitive advantage in smart cars and lower R&D expense-to revenue ratios, which could result in them having weaker smart-car technology over the long term. HMC: changes in Daiwa’s key assumptions for our 12-month target price Unit Previous NewDCF Discounted NPV value (KRWbn) 22,413 21,504PV terminal value (KRWbn) 28,723 26,777Net cash/(debt)* (KRWbn) (5,516) (5,516)Value of equity (KRWbn) 45,620 42,765No. of shares** (m shares) 285 285 Fair value (KRW) 159,802 149,802Target PER Target PER (x) 6.0 6.0Average of 2015-16 EPS forecasts (KRW) 23,366 23,366Fair value (KRW) 140,198 140,198Target price (KRW) 150,000 145,000
Source: Daiwa forecasts Note:*as at end-2015E; ** fully diluted including preferred shares
Kia: changes in Daiwa’s key assumptions for our 12-month target price Unit Previous NewDCF Discounted NPV value (KRWbn) 6,125 5,395PV terminal value (KRWbn) 12,146 11,246Net cash/(debt)* (KRWbn) 1,038 1,038Value of equity (KRWbn) 19,309 17,679No. of shares** (m shares) 405 405Fair value (KRW) 47,677 43,612Target PER Target PER (x) 6.1 6.2Average of 2015-16 EPS forecasts (KRW) 7,594 6,837
Fair value (KRW) 46,323 42,387Target price (KRW) 47,000 43,000
Source: Daiwa forecasts
Note:*as at end-2015E; ** fully diluted including preferred shares
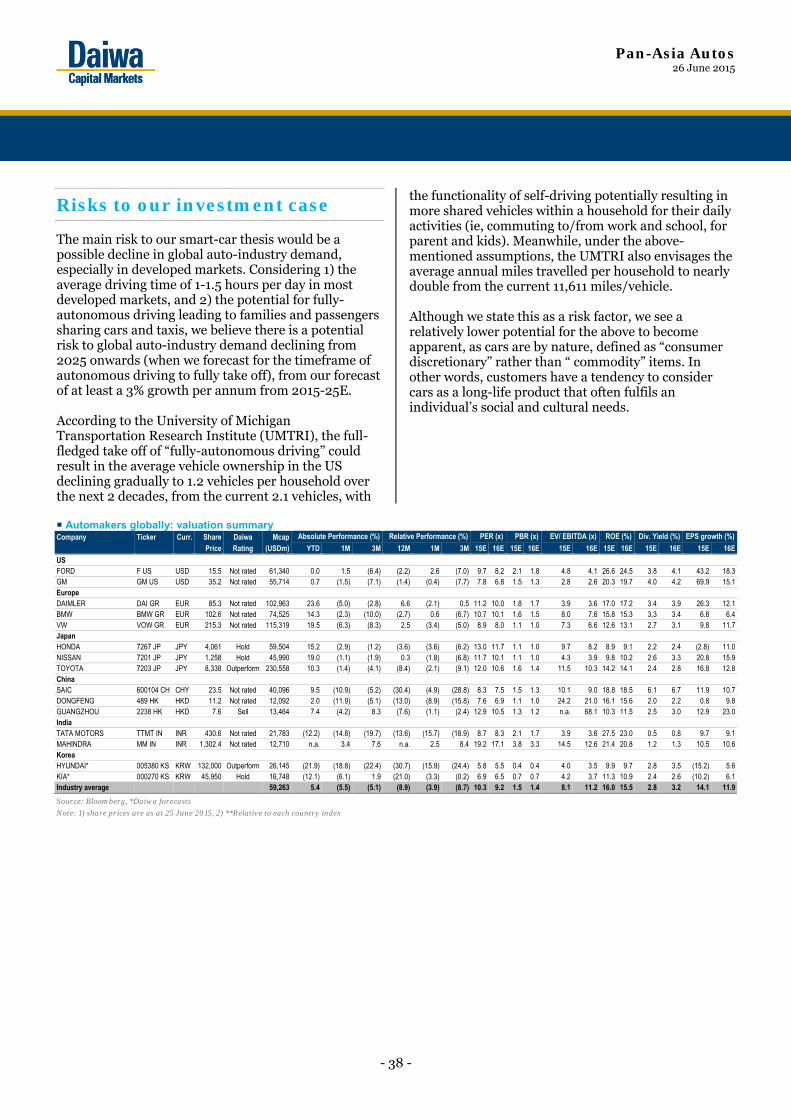
Pan-Asia Autos 26 June 2015
- 38 -
Risks to our investment case
The main risk to our smart-car thesis would be a possible decline in global auto-industry demand, especially in developed markets. Considering 1) the average driving time of 1-1.5 hours per day in most developed markets, and 2) the potential for fully-autonomous driving leading to families and passengers sharing cars and taxis, we believe there is a potential risk to global auto-industry demand declining from 2025 onwards (when we forecast for the timeframe of autonomous driving to fully take off), from our forecast of at least a 3% growth per annum from 2015-25E. According to the University of Michigan Transportation Research Institute (UMTRI), the full-fledged take off of “fully-autonomous driving” could result in the average vehicle ownership in the US declining gradually to 1.2 vehicles per household over the next 2 decades, from the current 2.1 vehicles, with
the functionality of self-driving potentially resulting in more shared vehicles within a household for their daily activities (ie, commuting to/from work and school, for parent and kids). Meanwhile, under the above-mentioned assumptions, the UMTRI also envisages the average annual miles travelled per household to nearly double from the current 11,611 miles/vehicle. Although we state this as a risk factor, we see a relatively lower potential for the above to become apparent, as cars are by nature, defined as “consumer discretionary” rather than “ commodity” items. In other words, customers have a tendency to consider cars as a long-life product that often fulfils an individual’s social and cultural needs.
Automakers globally: valuation summary Company Ticker Curr. Share Daiwa Mcap Absolute Performance (%) Relative Performance (%) PER (x) PBR (x) EV/ EBITDA (x) ROE (%) Div. Yield (%) EPS growth (%)
Price Rating (USDm) YTD 1M 3M 12M 1M 3M 15E 16E 15E 16E 15E 16E 15E 16E 15E 16E 15E 16E
US
FORD F US USD 15.5 Not rated 61,340 0.0 1.5 (6.4) (2.2) 2.6 (7.0) 9.7 8.2 2.1 1.8 4.8 4.1 26.6 24.5 3.8 4.1 43.2 18.3 GM GM US USD 35.2 Not rated 55,714 0.7 (1.5) (7.1) (1.4) (0.4) (7.7) 7.8 6.8 1.5 1.3 2.8 2.6 20.3 19.7 4.0 4.2 69.9 15.1 Europe
DAIMLER DAI GR EUR 85.3 Not rated 102,963 23.6 (5.0) (2.8) 6.6 (2.1) 0.5 11.2 10.0 1.8 1.7 3.9 3.6 17.0 17.2 3.4 3.9 26.3 12.1 BMW BMW GR EUR 102.6 Not rated 74,525 14.3 (2.3) (10.0) (2.7) 0.6 (6.7) 10.7 10.1 1.6 1.5 8.0 7.6 15.8 15.3 3.3 3.4 6.8 6.4 VW VOW GR EUR 215.3 Not rated 115,319 19.5 (6.3) (8.3) 2.5 (3.4) (5.0) 8.9 8.0 1.1 1.0 7.3 6.6 12.6 13.1 2.7 3.1 9.8 11.7 Japan
HONDA 7267 JP JPY 4,061 Hold 59,504 15.2 (2.9) (1.2) (3.6) (3.6) (6.2) 13.0 11.7 1.1 1.0 9.7 8.2 8.9 9.1 2.2 2.4 (2.8) 11.0 NISSAN 7201 JP JPY 1,258 Hold 45,990 19.0 (1.1) (1.9) 0.3 (1.8) (6.8) 11.7 10.1 1.1 1.0 4.3 3.9 9.8 10.2 2.6 3.3 20.8 15.9 TOYOTA 7203 JP JPY 8,338 Outperform 230,558 10.3 (1.4) (4.1) (8.4) (2.1) (9.1) 12.0 10.6 1.6 1.4 11.5 10.3 14.2 14.1 2.4 2.8 16.8 12.8 China
SAIC 600104 CH CHY 23.5 Not rated 40,096 9.5 (10.9) (5.2) (30.4) (4.9) (28.8) 8.3 7.5 1.5 1.3 10.1 9.0 18.8 18.5 6.1 6.7 11.9 10.7 DONGFENG 489 HK HKD 11.2 Not rated 12,092 2.0 (11.9) (5.1) (13.0) (8.9) (15.8) 7.6 6.9 1.1 1.0 24.2 21.0 16.1 15.6 2.0 2.2 0.8 9.8 GUANGZHOU 2238 HK HKD 7.6 Sell 13,464 7.4 (4.2) 8.3 (7.6) (1.1) (2.4) 12.9 10.5 1.3 1.2 n.a. 68.1 10.3 11.5 2.5 3.0 12.9 23.0 India
TATA MOTORS TTMT IN INR 430.6 Not rated 21,783 (12.2) (14.8) (19.7) (13.6) (15.7) (18.9) 8.7 8.3 2.1 1.7 3.9 3.6 27.5 23.0 0.5 0.8 9.7 9.1 MAHINDRA MM IN INR 1,302.4 Not rated 12,710 n.a. 3.4 7.6 n.a. 2.5 8.4 19.2 17.1 3.8 3.3 14.5 12.6 21.4 20.8 1.2 1.3 10.5 10.6 Korea
HYUNDAI* 005380 KS KRW 132,000 Outperform 26,145 (21.9) (18.8) (22.4) (30.7) (15.9) (24.4) 5.8 5.5 0.4 0.4 4.0 3.5 9.9 9.7 2.8 3.5 (15.2) 5.6 KIA* 000270 KS KRW 45,950 Hold 16,748 (12.1) (6.1) 1.9 (21.0) (3.3) (0.2) 6.9 6.5 0.7 0.7 4.2 3.7 11.3 10.9 2.4 2.6 (10.2) 6.1 Industry average 59,263 5.4 (5.5) (5.1) (8.9) (3.9) (8.7) 10.3 9.2 1.5 1.4 8.1 11.2 16.0 15.5 2.8 3.2 14.1 11.9
Source: Bloomberg, *Daiwa forecasts
Note: 1) share prices are as at 25 June 2015, 2) **Relative to each country index
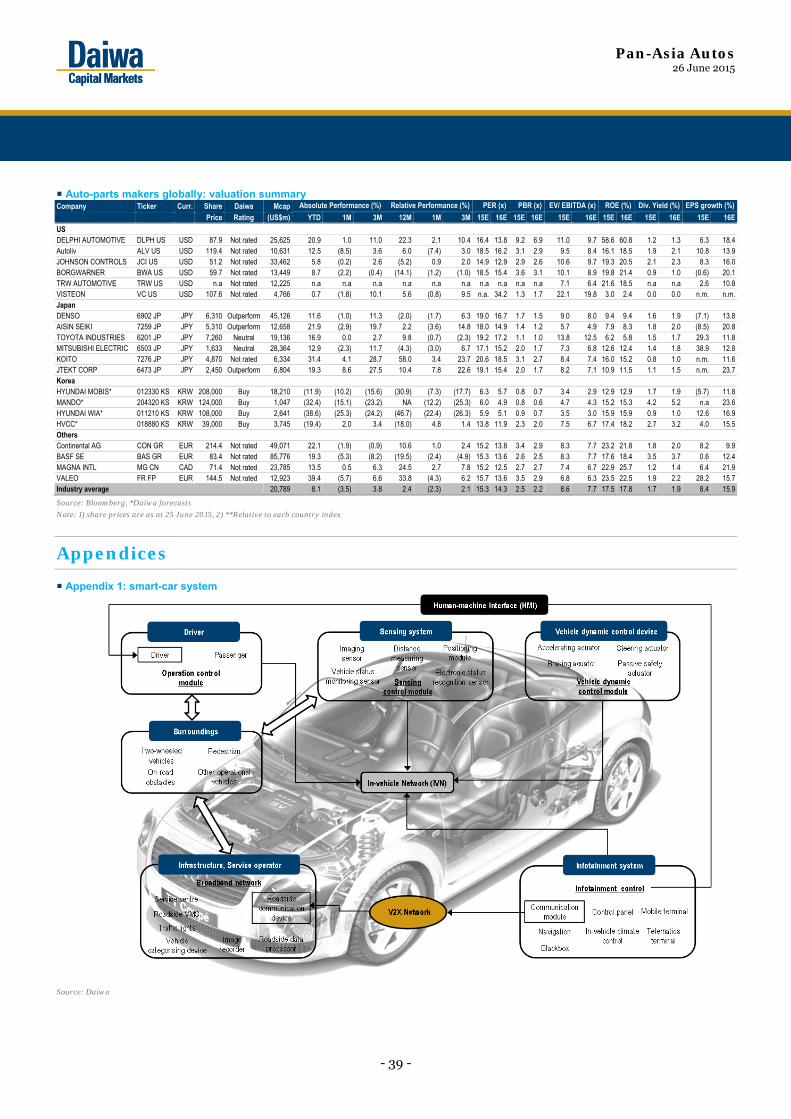
Pan-Asia Autos 26 June 2015
- 39 -
Auto-parts makers globally: valuation summary Company Ticker Curr. Share Daiwa Mcap Absolute Performance (%) Relative Performance (%) PER (x) PBR (x) EV/ EBITDA (x) ROE (%) Div. Yield (%) EPS growth (%)
Price Rating (US$m) YTD 1M 3M 12M 1M 3M 15E 16E 15E 16E 15E 16E 15E 16E 15E 16E 15E 16E
US
DELPHI AUTOMOTIVE DLPH US USD 87.9 Not rated 25,625 20.9 1.0 11.0 22.3 2.1 10.4 16.4 13.8 9.2 6.9 11.0 9.7 58.6 60.8 1.2 1.3 6.3 18.4 Autoliv ALV US USD 119.4 Not rated 10,631 12.5 (8.5) 3.6 6.0 (7.4) 3.0 18.5 16.2 3.1 2.9 9.5 8.4 16.1 18.5 1.9 2.1 10.8 13.9 JOHNSON CONTROLS JCI US USD 51.2 Not rated 33,462 5.8 (0.2) 2.6 (5.2) 0.9 2.0 14.9 12.9 2.9 2.6 10.6 9.7 19.3 20.5 2.1 2.3 8.3 16.0 BORGWARNER BWA US USD 59.7 Not rated 13,449 8.7 (2.2) (0.4) (14.1) (1.2) (1.0) 18.5 15.4 3.6 3.1 10.1 8.9 19.8 21.4 0.9 1.0 (0.6) 20.1 TRW AUTOMOTIVE TRW US USD n.a Not rated 12,225 n.a n.a n.a n.a n.a n.a n.a n.a n.a n.a 7.1 6.4 21.6 18.5 n.a n.a 2.6 10.8 VISTEON VC US USD 107.6 Not rated 4,766 0.7 (1.8) 10.1 5.6 (0.8) 9.5 n.a. 34.2 1.3 1.7 22.1 19.8 3.0 2.4 0.0 0.0 n.m. n.m.Japan
DENSO 6902 JP JPY 6,310 Outperform 45,126 11.6 (1.0) 11.3 (2.0) (1.7) 6.3 19.0 16.7 1.7 1.5 9.0 8.0 9.4 9.4 1.6 1.9 (7.1) 13.8 AISIN SEIKI 7259 JP JPY 5,310 Outperform 12,658 21.9 (2.9) 19.7 2.2 (3.6) 14.8 18.0 14.9 1.4 1.2 5.7 4.9 7.9 8.3 1.8 2.0 (8.5) 20.8 TOYOTA INDUSTRIES 6201 JP JPY 7,260 Neutral 19,136 16.9 0.0 2.7 9.8 (0.7) (2.3) 19.2 17.2 1.1 1.0 13.8 12.5 6.2 5.8 1.5 1.7 29.3 11.8 MITSUBISHI ELECTRIC 6503 JP JPY 1,633 Neutral 28,364 12.9 (2.3) 11.7 (4.3) (3.0) 6.7 17.1 15.2 2.0 1.7 7.3 6.8 12.6 12.4 1.4 1.8 38.9 12.8 KOITO 7276 JP JPY 4,870 Not rated 6,334 31.4 4.1 28.7 58.0 3.4 23.7 20.6 18.5 3.1 2.7 8.4 7.4 16.0 15.2 0.8 1.0 n.m. 11.6 JTEKT CORP 6473 JP JPY 2,450 Outperform 6,804 19.3 8.6 27.5 10.4 7.8 22.6 19.1 15.4 2.0 1.7 8.2 7.1 10.9 11.5 1.1 1.5 n.m. 23.7 Korea
HYUNDAI MOBIS* 012330 KS KRW 208,000 Buy 18,210 (11.9) (10.2) (15.6) (30.9) (7.3) (17.7) 6.3 5.7 0.8 0.7 3.4 2.9 12.9 12.9 1.7 1.9 (5.7) 11.8 MANDO* 204320 KS KRW 124,000 Buy 1,047 (32.4) (15.1) (23.2) NA (12.2) (25.3) 6.0 4.9 0.8 0.6 4.7 4.3 15.2 15.3 4.2 5.2 n.a 23.6 HYUNDAI WIA* 011210 KS KRW 108,000 Buy 2,641 (38.6) (25.3) (24.2) (46.7) (22.4) (26.3) 5.9 5.1 0.9 0.7 3.5 3.0 15.9 15.9 0.9 1.0 12.6 16.9 HVCC* 018880 KS KRW 39,000 Buy 3,745 (19.4) 2.0 3.4 (18.0) 4.8 1.4 13.8 11.9 2.3 2.0 7.5 6.7 17.4 18.2 2.7 3.2 4.0 15.5 Others
Continental AG CON GR EUR 214.4 Not rated 49,071 22.1 (1.9) (0.9) 10.6 1.0 2.4 15.2 13.8 3.4 2.9 8.3 7.7 23.2 21.8 1.8 2.0 8.2 9.9 BASF SE BAS GR EUR 83.4 Not rated 85,776 19.3 (5.3) (8.2) (19.5) (2.4) (4.9) 15.3 13.6 2.6 2.5 8.3 7.7 17.6 18.4 3.5 3.7 0.6 12.4 MAGNA INTL MG CN CAD 71.4 Not rated 23,785 13.5 0.5 6.3 24.5 2.7 7.8 15.2 12.5 2.7 2.7 7.4 6.7 22.9 25.7 1.2 1.4 6.4 21.9 VALEO FR FP EUR 144.5 Not rated 12,923 39.4 (5.7) 6.6 33.8 (4.3) 6.2 15.7 13.6 3.5 2.9 6.8 6.3 23.5 22.5 1.9 2.2 28.2 15.7 Industry average 20,789 8.1 (3.5) 3.8 2.4 (2.3) 2.1 15.3 14.3 2.5 2.2 8.6 7.7 17.5 17.8 1.7 1.9 8.4 15.9
Source: Bloomberg, *Daiwa forecasts
Note: 1) share prices are as at 25 June 2015, 2) **Relative to each country index
Appendices
Appendix 1: smart-car system
Source: Daiwa
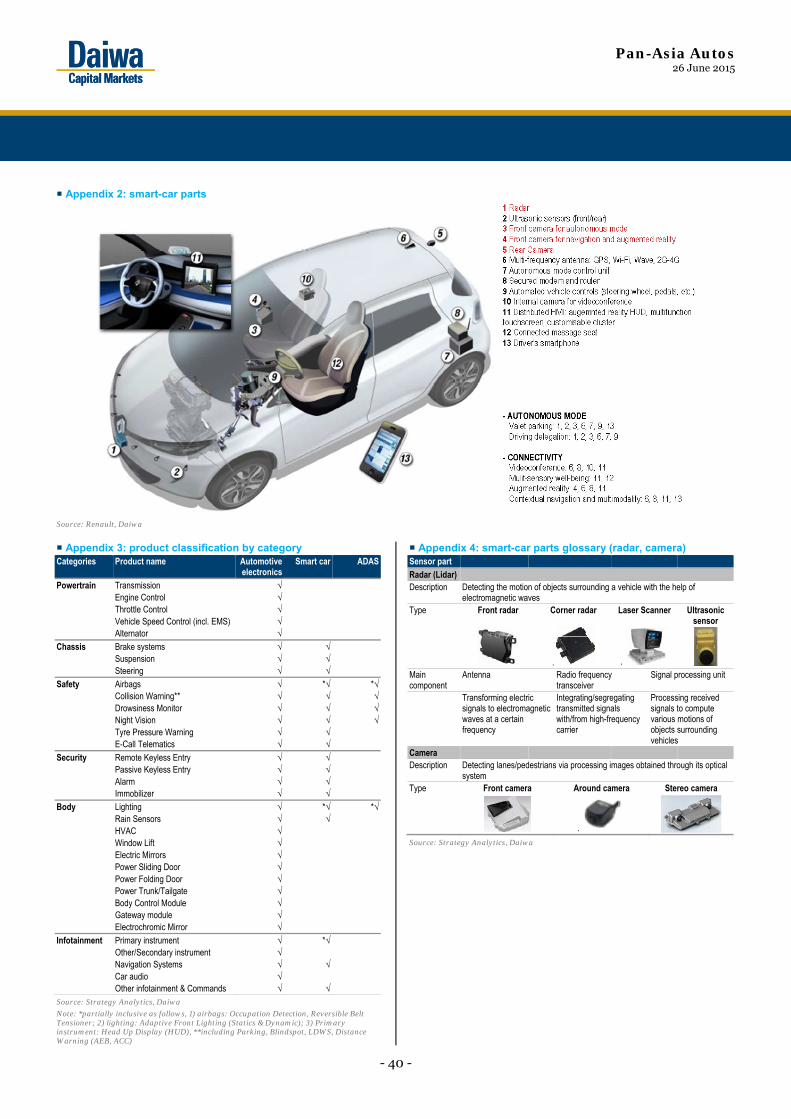
Pan-Asia Autos 26 June 2015
- 40 -
Appendix 2: smart-car parts
Source: Renault, Daiwa
Appendix 3: product classification by category Categories Product name Automotive
electronics Smart car ADAS
Powertrain Transmission √ Engine Control √ Throttle Control √ Vehicle Speed Control (incl. EMS) √ Alternator √
Chassis Brake systems √ √Suspension √ √Steering √ √
Safety Airbags √ *√ *√Collision Warning** √ √ √Drowsiness Monitor √ √ √Night Vision √ √ √Tyre Pressure Warning √ √E-Call Telematics √ √
Security Remote Keyless Entry √ √Passive Keyless Entry √ √Alarm √ √Immobilizer √ √
Body Lighting √ *√ *√Rain Sensors √ √HVAC √ Window Lift √ Electric Mirrors √ Power Sliding Door √ Power Folding Door √ Power Trunk/Tailgate √ Body Control Module √ Gateway module √ Electrochromic Mirror √
Infotainment Primary instrument √ *√Other/Secondary instrument √ Navigation Systems √ √Car audio √ Other infotainment & Commands √ √
Source: Strategy Analytics, Daiwa
Note: *partially inclusive as follows, 1) airbags: Occupation Detection, Reversible Belt Tensioner; 2) lighting: Adaptive Front Lighting (Statics & Dynamic); 3) Primary instrument: Head Up Display (HUD), **including Parking, Blindspot, LDWS, Distance Warning (AEB, ACC)
Appendix 4: smart-car parts glossary (radar, camera) Sensor part Radar (Lidar) Description Detecting the motion of objects surrounding a vehicle with the help of
electromagnetic waves Type Front radar Corner radar Laser Scanner Ultrasonic
sensor
. . Main component
Antenna Radio frequency transceiver
Signal processing unit
Transforming electric signals to electromagnetic waves at a certain frequency
Integrating/segregating transmitted signals with/from high-frequency carrier
Processing received signals to compute various motions of objects surrounding vehicles
Camera Description Detecting lanes/pedestrians via processing images obtained through its optical
system Type Front camera Around camera Stereo camera
.
Source: Strategy Analytics, Daiwa
See important disclosures, including any required research certifications, beginning on page 70
Share Price Chart
Source: Compiled by Daiwa.
Market Data 12-month range (Y) 5,710-8,783
Market cap (Y mn; 25 Jun) 26,238,132
Shares outstanding (000; 6/15) 3,146,814
Investment Indicators
3/15 3/16 E 3/17 E
P/E (X) 12.1 10.8 10.0
EV/EBITDA (X) 9.6 9.1 8.3
P/B (X) 1.56 1.42 1.29
Dividend yield (%) 2.40 2.76 3.00
ROE (%) 13.9 13.8 13.5
Net debt/equity (X) 0.8 0.7 0.6 Income Summary
(SEC; Y mn) 3/15 3/16 E 3/17 E
Sales 27,234,521 28,500,000 30,100,000
Op profit 2,750,564 3,080,000 3,350,000
Pretax income 2,892,828 3,240,000 3,510,000
Net income 2,173,338 2,430,000 2,630,000
EPS (Y) 688.0 772.2 835.8
DPS (Y) 200.00 230.00 250.00
Source: Company, Daiwa forecasts
See end of report for notes concerning indicators.
2,300
4,000
5,700
7,400
9,100
6/12 2/13 9/13 4/14 11/14 6/15
(Y)
80
100
120
140
160Relative to TOPIX
Eiji Hakomori (81) 3 5555-7072 [email protected] What’s new Toyota launched its pre-collision safety system, Toyota Safety Sense, in April 2015. Coupled with our research showing it has filed the most smart-car-related patent applications among players in the Pan-Asia auto sector, this leads us to see Toyota as a key beneficiary of the smart-car industry globally in the long-term. What’s the impact The safety system was first put in new-model Corolla vehicles launched in May 2014 for the domestic market. There are 2 varieties of the system: Safety Sense C for compact cars (ie, Corolla), and Safety Sense P for mid-range to high-end vehicles. The latter is due to be released in autumn 2015. The firm aims to equip almost all of its passenger vehicles for the Japan, US, and Europe markets with the Toyota Safety Sense system by end-2017. The C-model system used for the Corolla vehicles includes an automatic braking system with a laser radar and single-lens camera, and can be bought as an added extra for JPY50,000. It is a simpler version of the P-model
system, which features a millimetre-wave radar and single-lens camera. The new-model Corolla was awarded the Japan New Car Assessment Program’s (JNCAP) highest ranking of ASV+. From our market research, Toyota also intends to sell P-model systems at a price to promote market penetration. From peer comparisons, we see a retail price of ca. JPY100,000. Also, Fuji Heavy Industries (7270JP, JPY4,501, Outperform [2]) is equipping ca. 90% of its high-end vehicles for the domestic market with the automatic braking system EyeSight. It is also using the system in a growing number of mini-vehicle models. Models with this system have seen rapid market penetration in the US and domestically. As such, we see automatic braking systems becoming an essential feature of high-selling vehicles, as well as a sales driver for Toyota’s cars, going forward. What we recommend We have an Outperform (2) on Toyota and 12-month TP of JPY9,000 (FY15E PER of 12x). Yen depreciation and cost-cutting efforts should translate into a visible profit boost near term, with the firm maintaining high plant capacity utilisation, while allowing it to scale back capacity additions. Superior environmental technology (centred on hybrid-electric vehicles) should provide a further source of differentiation over the mid/long
term, as countries adopt stricter environmental regulations. Key risk: a sharp appreciation in the JPY vs. the USD and Euro.
Consumer Discretionary / Japan
26 June 2015
Toyota Motor 7203 | TSE 1
Target price: Y9,000 Up/downside: +7.9% Share price (25 Jun): Y8,338
Starting full-scale development of Toyota Safety Sense
• Equipping some new vehicles with pre-collision safety system, Toyota Safety Sense (including automatic braking), from 2015
• Aims to equip almost all new passenger vehicles in Japan, the US, Europe with the system by end-2017
• Automatic braking systems also gaining increased adoption in mini-vehicles in Japan; we see rise in penetration for such systems
Buy Outperform (not-reviewed) Neutral Underperform Sell
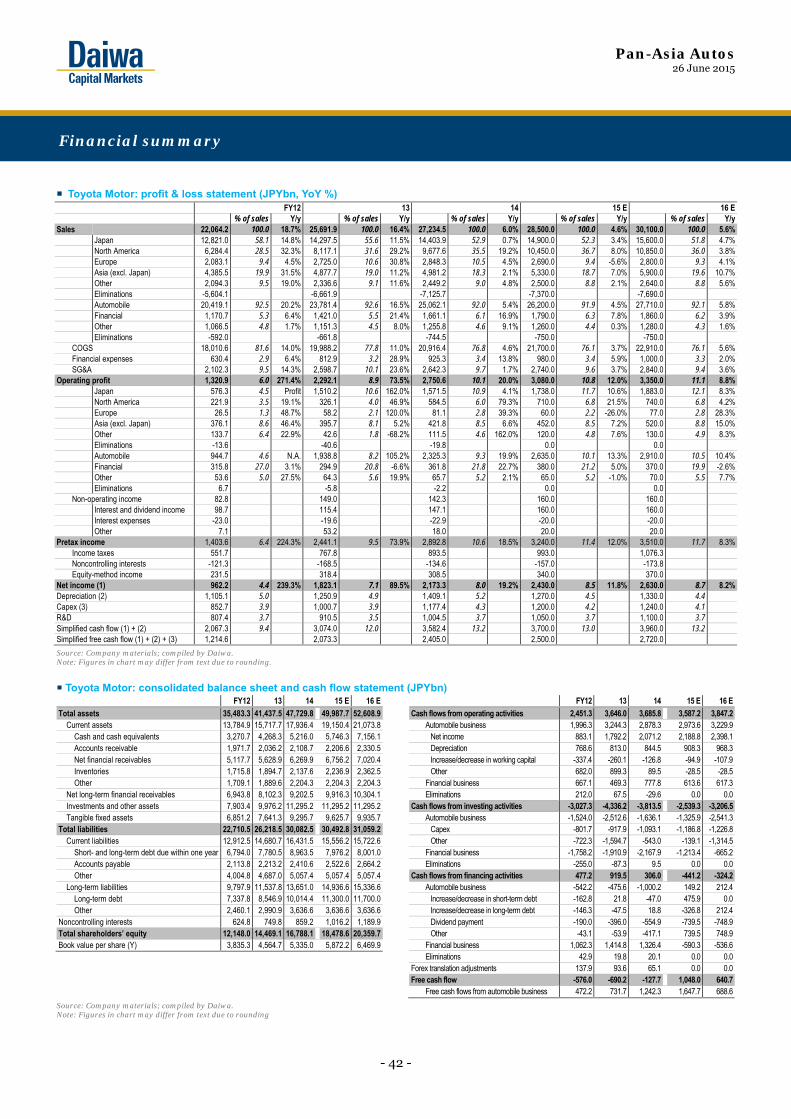
Pan-Asia Autos 26 June 2015
- 42 -
Toyota Motor: profit & loss statement (JPYbn, YoY %) FY12 13 14 15 E 16 E
% of sales Y/y % of sales Y/y % of sales Y/y % of sales Y/y % of sales Y/ySales 22,064.2 100.0 18.7% 25,691.9 100.0 16.4% 27,234.5 100.0 6.0% 28,500.0 100.0 4.6% 30,100.0 100.0 5.6%
Japan 12,821.0 58.1 14.8% 14,297.5 55.6 11.5% 14,403.9 52.9 0.7% 14,900.0 52.3 3.4% 15,600.0 51.8 4.7%North America 6,284.4 28.5 32.3% 8,117.1 31.6 29.2% 9,677.6 35.5 19.2% 10,450.0 36.7 8.0% 10,850.0 36.0 3.8%Europe 2,083.1 9.4 4.5% 2,725.0 10.6 30.8% 2,848.3 10.5 4.5% 2,690.0 9.4 -5.6% 2,800.0 9.3 4.1%Asia (excl. Japan) 4,385.5 19.9 31.5% 4,877.7 19.0 11.2% 4,981.2 18.3 2.1% 5,330.0 18.7 7.0% 5,900.0 19.6 10.7%Other 2,094.3 9.5 19.0% 2,336.6 9.1 11.6% 2,449.2 9.0 4.8% 2,500.0 8.8 2.1% 2,640.0 8.8 5.6%Eliminations -5,604.1 -6,661.9 -7,125.7 -7,370.0 -7,690.0 Automobile 20,419.1 92.5 20.2% 23,781.4 92.6 16.5% 25,062.1 92.0 5.4% 26,200.0 91.9 4.5% 27,710.0 92.1 5.8%Financial 1,170.7 5.3 6.4% 1,421.0 5.5 21.4% 1,661.1 6.1 16.9% 1,790.0 6.3 7.8% 1,860.0 6.2 3.9%Other 1,066.5 4.8 1.7% 1,151.3 4.5 8.0% 1,255.8 4.6 9.1% 1,260.0 4.4 0.3% 1,280.0 4.3 1.6%
Eliminations -592.0 -661.8 -744.5 -750.0 -750.0 COGS 18,010.6 81.6 14.0% 19,988.2 77.8 11.0% 20,916.4 76.8 4.6% 21,700.0 76.1 3.7% 22,910.0 76.1 5.6%Financial expenses 630.4 2.9 6.4% 812.9 3.2 28.9% 925.3 3.4 13.8% 980.0 3.4 5.9% 1,000.0 3.3 2.0%SG&A 2,102.3 9.5 14.3% 2,598.7 10.1 23.6% 2,642.3 9.7 1.7% 2,740.0 9.6 3.7% 2,840.0 9.4 3.6%
Operating profit 1,320.9 6.0 271.4% 2,292.1 8.9 73.5% 2,750.6 10.1 20.0% 3,080.0 10.8 12.0% 3,350.0 11.1 8.8%Japan 576.3 4.5 Profit 1,510.2 10.6 162.0% 1,571.5 10.9 4.1% 1,738.0 11.7 10.6% 1,883.0 12.1 8.3%North America 221.9 3.5 19.1% 326.1 4.0 46.9% 584.5 6.0 79.3% 710.0 6.8 21.5% 740.0 6.8 4.2%Europe 26.5 1.3 48.7% 58.2 2.1 120.0% 81.1 2.8 39.3% 60.0 2.2 -26.0% 77.0 2.8 28.3%Asia (excl. Japan) 376.1 8.6 46.4% 395.7 8.1 5.2% 421.8 8.5 6.6% 452.0 8.5 7.2% 520.0 8.8 15.0%Other 133.7 6.4 22.9% 42.6 1.8 -68.2% 111.5 4.6 162.0% 120.0 4.8 7.6% 130.0 4.9 8.3%Eliminations -13.6 -40.6 -19.8 0.0 0.0 Automobile 944.7 4.6 N.A. 1,938.8 8.2 105.2% 2,325.3 9.3 19.9% 2,635.0 10.1 13.3% 2,910.0 10.5 10.4%Financial 315.8 27.0 3.1% 294.9 20.8 -6.6% 361.8 21.8 22.7% 380.0 21.2 5.0% 370.0 19.9 -2.6%Other 53.6 5.0 27.5% 64.3 5.6 19.9% 65.7 5.2 2.1% 65.0 5.2 -1.0% 70.0 5.5 7.7%
Eliminations 6.7 -5.8 -2.2 0.0 0.0 Non-operating income 82.8 149.0 142.3 160.0 160.0
Interest and dividend income 98.7 115.4 147.1 160.0 160.0 Interest expenses -23.0 -19.6 -22.9 -20.0 -20.0
Other 7.1 53.2 18.0 20.0 20.0 Pretax income 1,403.6 6.4 224.3% 2,441.1 9.5 73.9% 2,892.8 10.6 18.5% 3,240.0 11.4 12.0% 3,510.0 11.7 8.3%
Income taxes 551.7 767.8 893.5 993.0 1,076.3 Noncontrolling interests -121.3 -168.5 -134.6 -157.0 -173.8
Equity-method income 231.5 318.4 308.5 340.0 370.0 Net income (1) 962.2 4.4 239.3% 1,823.1 7.1 89.5% 2,173.3 8.0 19.2% 2,430.0 8.5 11.8% 2,630.0 8.7 8.2%Depreciation (2) 1,105.1 5.0 1,250.9 4.9 1,409.1 5.2 1,270.0 4.5 1,330.0 4.4 Capex (3) 852.7 3.9 1,000.7 3.9 1,177.4 4.3 1,200.0 4.2 1,240.0 4.1 R&D 807.4 3.7 910.5 3.5 1,004.5 3.7 1,050.0 3.7 1,100.0 3.7 Simplified cash flow (1) + (2) 2,067.3 9.4 3,074.0 12.0 3,582.4 13.2 3,700.0 13.0 3,960.0 13.2 Simplified free cash flow (1) + (2) + (3) 1,214.6 2,073.3 2,405.0 2,500.0 2,720.0
Source: Company materials; compiled by Daiwa. Note: Figures in chart may differ from text due to rounding.
Toyota Motor: consolidated balance sheet and cash flow statement (JPYbn) FY12 13 14 15 E 16 E
Total assets 35,483.3 41,437.5 47,729.8 49,987.7 52,608.9Current assets 13,784.9 15,717.7 17,936.4 19,150.4 21,073.8
Cash and cash equivalents 3,270.7 4,268.3 5,216.0 5,746.3 7,156.1Accounts receivable 1,971.7 2,036.2 2,108.7 2,206.6 2,330.5Net financial receivables 5,117.7 5,628.9 6,269.9 6,756.2 7,020.4Inventories 1,715.8 1,894.7 2,137.6 2,236.9 2,362.5
Other 1,709.1 1,889.6 2,204.3 2,204.3 2,204.3Net long-term financial receivables 6,943.8 8,102.3 9,202.5 9,916.3 10,304.1Investments and other assets 7,903.4 9,976.2 11,295.2 11,295.2 11,295.2Tangible fixed assets 6,851.2 7,641.3 9,295.7 9,625.7 9,935.7
Total liabilities 22,710.5 26,218.5 30,082.5 30,492.8 31,059.2Current liabilities 12,912.5 14,680.7 16,431.5 15,556.2 15,722.6
Short- and long-term debt due within one year 6,794.0 7,780.5 8,963.5 7,976.2 8,001.0Accounts payable 2,113.8 2,213.2 2,410.6 2,522.6 2,664.2
Other 4,004.8 4,687.0 5,057.4 5,057.4 5,057.4Long-term liabilities 9,797.9 11,537.8 13,651.0 14,936.6 15,336.6
Long-term debt 7,337.8 8,546.9 10,014.4 11,300.0 11,700.0Other 2,460.1 2,990.9 3,636.6 3,636.6 3,636.6
Noncontrolling interests 624.8 749.8 859.2 1,016.2 1,189.9Total shareholders’ equity 12,148.0 14,469.1 16,788.1 18,478.6 20,359.7Book value per share (Y) 3,835.3 4,564.7 5,335.0 5,872.2 6,469.9
FY12 13 14 15 E 16 E
Cash flows from operating activities 2,451.3 3,646.0 3,685.8 3,587.2 3,847.2Automobile business 1,996.3 3,244.3 2,878.3 2,973.6 3,229.9 Net income 883.1 1,792.2 2,071.2 2,188.8 2,398.1 Depreciation 768.6 813.0 844.5 908.3 968.3 Increase/decrease in working capital -337.4 -260.1 -126.8 -94.9 -107.9 Other 682.0 899.3 89.5 -28.5 -28.5Financial business 667.1 469.3 777.8 613.6 617.3Eliminations 212.0 67.5 -29.6 0.0 0.0
Cash flows from investing activities -3,027.3 -4,336.2 -3,813.5 -2,539.3 -3,206.5Automobile business -1,524.0 -2,512.6 -1,636.1 -1,325.9 -2,541.3 Capex -801.7 -917.9 -1,093.1 -1,186.8 -1,226.8 Other -722.3 -1,594.7 -543.0 -139.1 -1,314.5Financial business -1,758.2 -1,910.9 -2,167.9 -1,213.4 -665.2Eliminations -255.0 -87.3 9.5 0.0 0.0
Cash flows from financing activities 477.2 919.5 306.0 -441.2 -324.2Automobile business -542.2 -475.6 -1,000.2 149.2 212.4 Increase/decrease in short-term debt -162.8 21.8 -47.0 475.9 0.0 Increase/decrease in long-term debt -146.3 -47.5 18.8 -326.8 212.4 Dividend payment -190.0 -396.0 -554.9 -739.5 -748.9 Other -43.1 -53.9 -417.1 739.5 748.9Financial business 1,062.3 1,414.8 1,326.4 -590.3 -536.6
Eliminations 42.9 19.8 20.1 0.0 0.0Forex translation adjustments 137.9 93.6 65.1 0.0 0.0Free cash flow -576.0 -690.2 -127.7 1,048.0 640.7
Free cash flows from automobile business 472.2 731.7 1,242.3 1,647.7 688.6
Source: Company materials; compiled by Daiwa. Note: Figures in chart may differ from text due to rounding
Financial summary
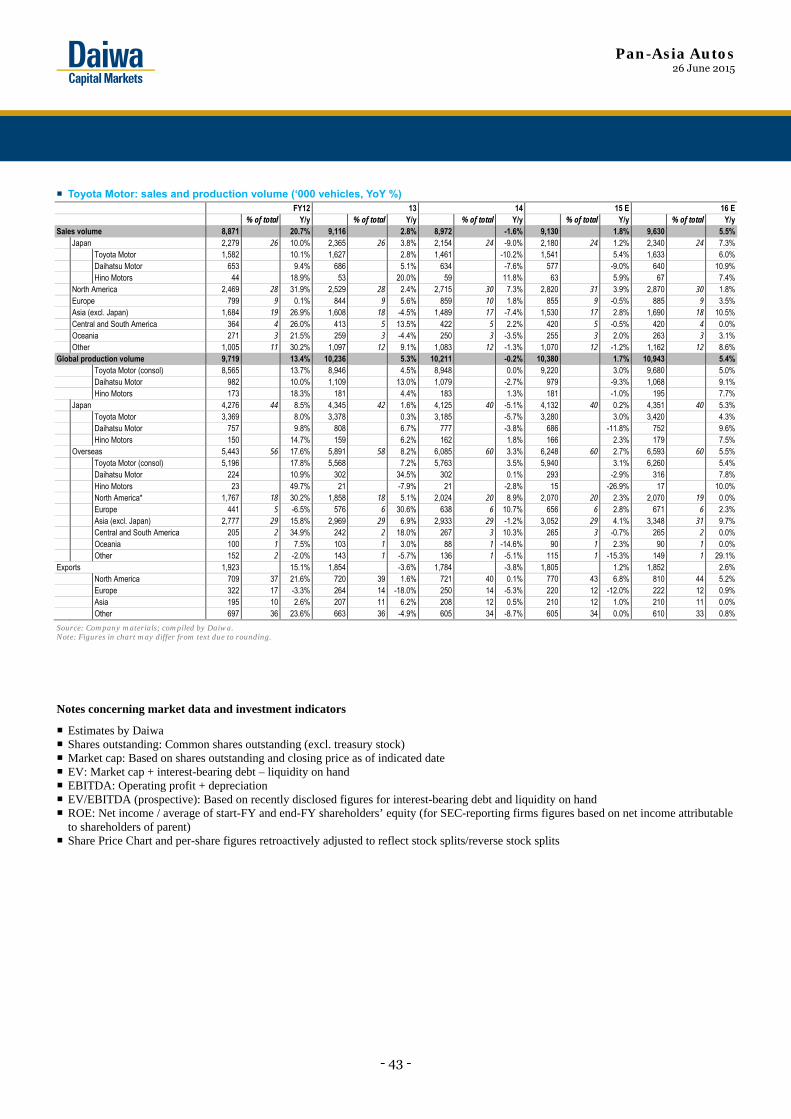
Pan-Asia Autos 26 June 2015
- 43 -
Toyota Motor: sales and production volume (‘000 vehicles, YoY %) FY12 13 14 15 E 16 E % of total Y/y % of total Y/y % of total Y/y % of total Y/y % of total Y/y
Sales volume 8,871 20.7% 9,116 2.8% 8,972 -1.6% 9,130 1.8% 9,630 5.5%Japan 2,279 26 10.0% 2,365 26 3.8% 2,154 24 -9.0% 2,180 24 1.2% 2,340 24 7.3%
Toyota Motor 1,582 10.1% 1,627 2.8% 1,461 -10.2% 1,541 5.4% 1,633 6.0% Daihatsu Motor 653 9.4% 686 5.1% 634 -7.6% 577 -9.0% 640 10.9% Hino Motors 44 18.9% 53 20.0% 59 11.8% 63 5.9% 67 7.4%
North America 2,469 28 31.9% 2,529 28 2.4% 2,715 30 7.3% 2,820 31 3.9% 2,870 30 1.8%Europe 799 9 0.1% 844 9 5.6% 859 10 1.8% 855 9 -0.5% 885 9 3.5%Asia (excl. Japan) 1,684 19 26.9% 1,608 18 -4.5% 1,489 17 -7.4% 1,530 17 2.8% 1,690 18 10.5%Central and South America 364 4 26.0% 413 5 13.5% 422 5 2.2% 420 5 -0.5% 420 4 0.0%Oceania 271 3 21.5% 259 3 -4.4% 250 3 -3.5% 255 3 2.0% 263 3 3.1%
Other 1,005 11 30.2% 1,097 12 9.1% 1,083 12 -1.3% 1,070 12 -1.2% 1,162 12 8.6%Global production volume 9,719 13.4% 10,236 5.3% 10,211 -0.2% 10,380 1.7% 10,943 5.4%
Toyota Motor (consol) 8,565 13.7% 8,946 4.5% 8,948 0.0% 9,220 3.0% 9,680 5.0% Daihatsu Motor 982 10.0% 1,109 13.0% 1,079 -2.7% 979 -9.3% 1,068 9.1% Hino Motors 173 18.3% 181 4.4% 183 1.3% 181 -1.0% 195 7.7%
Japan 4,276 44 8.5% 4,345 42 1.6% 4,125 40 -5.1% 4,132 40 0.2% 4,351 40 5.3% Toyota Motor 3,369 8.0% 3,378 0.3% 3,185 -5.7% 3,280 3.0% 3,420 4.3% Daihatsu Motor 757 9.8% 808 6.7% 777 -3.8% 686 -11.8% 752 9.6% Hino Motors 150 14.7% 159 6.2% 162 1.8% 166 2.3% 179 7.5%
Overseas 5,443 56 17.6% 5,891 58 8.2% 6,085 60 3.3% 6,248 60 2.7% 6,593 60 5.5% Toyota Motor (consol) 5,196 17.8% 5,568 7.2% 5,763 3.5% 5,940 3.1% 6,260 5.4% Daihatsu Motor 224 10.9% 302 34.5% 302 0.1% 293 -2.9% 316 7.8% Hino Motors 23 49.7% 21 -7.9% 21 -2.8% 15 -26.9% 17 10.0% North America* 1,767 18 30.2% 1,858 18 5.1% 2,024 20 8.9% 2,070 20 2.3% 2,070 19 0.0% Europe 441 5 -6.5% 576 6 30.6% 638 6 10.7% 656 6 2.8% 671 6 2.3% Asia (excl. Japan) 2,777 29 15.8% 2,969 29 6.9% 2,933 29 -1.2% 3,052 29 4.1% 3,348 31 9.7% Central and South America 205 2 34.9% 242 2 18.0% 267 3 10.3% 265 3 -0.7% 265 2 0.0% Oceania 100 1 7.5% 103 1 3.0% 88 1 -14.6% 90 1 2.3% 90 1 0.0%
Other 152 2 -2.0% 143 1 -5.7% 136 1 -5.1% 115 1 -15.3% 149 1 29.1%Exports 1,923 15.1% 1,854 -3.6% 1,784 -3.8% 1,805 1.2% 1,852 2.6%
North America 709 37 21.6% 720 39 1.6% 721 40 0.1% 770 43 6.8% 810 44 5.2%Europe 322 17 -3.3% 264 14 -18.0% 250 14 -5.3% 220 12 -12.0% 222 12 0.9%Asia 195 10 2.6% 207 11 6.2% 208 12 0.5% 210 12 1.0% 210 11 0.0%
Other 697 36 23.6% 663 36 -4.9% 605 34 -8.7% 605 34 0.0% 610 33 0.8%
Source: Company materials; compiled by Daiwa. Note: Figures in chart may differ from text due to rounding.
Notes concerning market data and investment indicators
Estimates by Daiwa Shares outstanding: Common shares outstanding (excl. treasury stock) Market cap: Based on shares outstanding and closing price as of indicated date EV: Market cap + interest-bearing debt – liquidity on hand EBITDA: Operating profit + depreciation EV/EBITDA (prospective): Based on recently disclosed figures for interest-bearing debt and liquidity on hand ROE: Net income / average of start-FY and end-FY shareholders’ equity (for SEC-reporting firms figures based on net income attributable
to shareholders of parent) Share Price Chart and per-share figures retroactively adjusted to reflect stock splits/reverse stock splits

Pan-Asia Autos 26 June 2015
- 44 -
See important disclosures, including any required research certifications, beginning on page 70
What’s new Based on our market research on the competitiveness of the Pan-Asia smart-car players, we now see Denso as setting the standard for smart cars until 2020, bolstered by: 1) its strong competitive advantage in sensor technologies, and 2) it having the largest number of smart-car patent applications among the major Pan-Asia auto-parts makers. What’s the impact We expect the auto-parts makers to take the lead in developing smart cars given their strong competitive advantage in making auto electronics, especially the key components (ie, sensors and cameras) that are most important for semi-automated driving (Level 3) and fully-automated driving (Level 4) vehicles. Among the large global auto-parts makers, the German and US companies currently lead the pack in the different sensor products. In the Asia-Pacific region, Denso has
proprietary technology for sensor and other related products, and these have been supplied to Toyota and HMG. We are also positive on Denso as it is going to supply the millimeter-wave radar system for Toyota’s recently launched Safety Sense P system for mid-range to high-end vehicles. Meanwhile, Denso has filed the most patent applications in the autonomous-driving and IVI fields among the global auto-parts makers, which we believe sets a positive tone for its share gains in the smart-car industry until 2020. What we recommend We have an Outperform (2) rating and a 12-month target price of JPY6,000, based on a FY15E PER of 16.7x, which we set in our report from 22 April. Similar to Toyota, we expect Denso to put more emphasis on shareholders, following the larger-than-expected shareholder returns for FY14. Denso raised its FY14 payout ratio to 35%, from 30% in FY13, and announced a JPY30bn share buyback (0.63% of total shares) in April 2015. Furthermore, we forecast Denso’s FY15 operating profit to rise by 14% to JPY405.0bn, due to a
combination of: 1) a further rise in Toyota’s global capacity utilisation rate in 2015, and 2) our forecast of Denso achieving faster sales growth than for FY14, and that it is likely to increase its weighting of sales to automakers other than Toyota from FY15. The main risk to our call: stronger-than-expected pricing pressure from the Japanese OEMs.
Consumer Discretionary / Korea005380 KS
26 June 2015
Hyundai Motor
Denso 6902 JP
Target price: JPY6,000 Up/downside: -4.9% Share price (25 June): JPY6,310
Our preferred smart-car play
• Denso leads its peers in sensor technologies and has successfully gained a foothold in high-value products
• Among the major Pan-Asia auto-parts makers, Denso has the largest number of patent applications for smart cars
• Denso looks set to increase its weighting of sales to automakers other than Toyota from FY15
Share price performance
Source: Compiled by Daiwa, Bloomberg
Market data (consol) 12-month range (Y) 4,466.5-6,548Market cap (Y mn; 25 Jun) 5,033,468Shares outstanding (000; 6/15) 797,697Foreign ownership (%; 3/15) 26.0
Investment indicators 3/15 3/16 E 3/17 E P/E (X) 17.2 16.8 15.5EV/EBITDA (X) 7.7 6.8 6.2P/B (X) 1.57 1.49 1.40Dividend yield (%) 1.74 1.90 2.06ROE (%) 10.0 - 9.3
Income summary (JPYm) 3/15 3/16 E 3/17 E Sales 4,308,754 4,544,000 4,816,000Op profit 355,111 405,000 440,000Pretax income 397,431 433,000 470,000Net income 293,099 299,000 324,000EPS (Y) 367.5 374.8 406.2DPS (Y) 110.00 120.00 130.00
Source: Company, Daiwa forecasts.
Results based on JGAAP. Estimates based on IFRS
Shiro Sakamaki (81) 3 5555-7067 [email protected]
BuyOutperform (unchanged)
HoldUnderperformSell
1
2
3
4
5
2,000
3,200
4,400
5,600
6,800
6/12 2/13 9/13 4/14 11/14 6/15
(Y)
90
100
110
120
130Relative to TOPIX
Consumer Discretionary / Japan
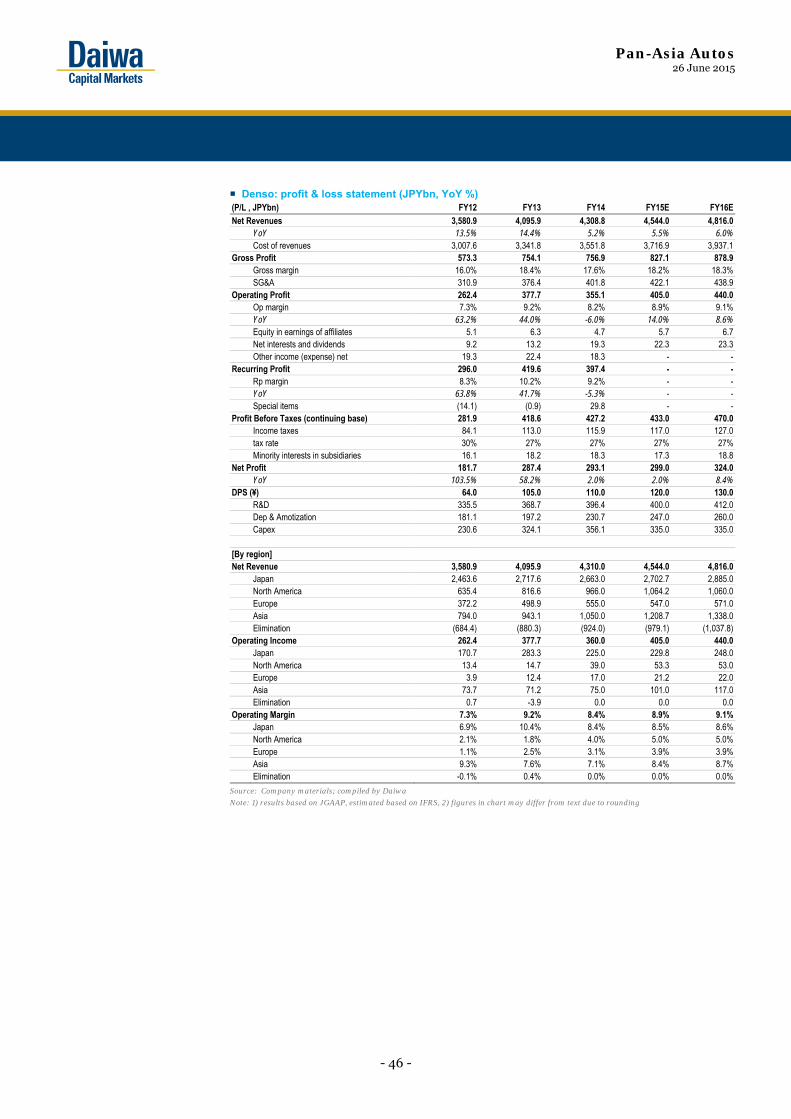
Pan-Asia Autos 26 June 2015
- 46 -
Denso: profit & loss statement (JPYbn, YoY %)(P/L , JPYbn) FY12 FY13 FY14 FY15E FY16ENet Revenues 3,580.9 4,095.9 4,308.8 4,544.0 4,816.0
YoY 13.5% 14.4% 5.2% 5.5% 6.0% Cost of revenues 3,007.6 3,341.8 3,551.8 3,716.9 3,937.1
Gross Profit 573.3 754.1 756.9 827.1 878.9 Gross margin 16.0% 18.4% 17.6% 18.2% 18.3%SG&A 310.9 376.4 401.8 422.1 438.9
Operating Profit 262.4 377.7 355.1 405.0 440.0 Op margin 7.3% 9.2% 8.2% 8.9% 9.1%YoY 63.2% 44.0% -6.0% 14.0% 8.6%Equity in earnings of affiliates 5.1 6.3 4.7 5.7 6.7 Net interests and dividends 9.2 13.2 19.3 22.3 23.3 Other income (expense) net 19.3 22.4 18.3 - -
Recurring Profit 296.0 419.6 397.4 - -Rp margin 8.3% 10.2% 9.2% - -YoY 63.8% 41.7% -5.3% - -Special items (14.1) (0.9) 29.8 - -
Profit Before Taxes (continuing base) 281.9 418.6 427.2 433.0 470.0 Income taxes 84.1 113.0 115.9 117.0 127.0 tax rate 30% 27% 27% 27% 27%Minority interests in subsidiaries 16.1 18.2 18.3 17.3 18.8
Net Profit 181.7 287.4 293.1 299.0 324.0 YoY 103.5% 58.2% 2.0% 2.0% 8.4%
DPS (¥) 64.0 105.0 110.0 120.0 130.0 R&D 335.5 368.7 396.4 400.0 412.0
Dep & Amotization 181.1 197.2 230.7 247.0 260.0 Capex 230.6 324.1 356.1 335.0 335.0
[By region] Net Revenue 3,580.9 4,095.9 4,310.0 4,544.0 4,816.0
Japan 2,463.6 2,717.6 2,663.0 2,702.7 2,885.0 North America 635.4 816.6 966.0 1,064.2 1,060.0 Europe 372.2 498.9 555.0 547.0 571.0 Asia 794.0 943.1 1,050.0 1,208.7 1,338.0
Elimination (684.4) (880.3) (924.0) (979.1) (1,037.8)Operating Income 262.4 377.7 360.0 405.0 440.0
Japan 170.7 283.3 225.0 229.8 248.0 North America 13.4 14.7 39.0 53.3 53.0 Europe 3.9 12.4 17.0 21.2 22.0 Asia 73.7 71.2 75.0 101.0 117.0
Elimination 0.7 -3.9 0.0 0.0 0.0 Operating Margin 7.3% 9.2% 8.4% 8.9% 9.1%
Japan 6.9% 10.4% 8.4% 8.5% 8.6%North America 2.1% 1.8% 4.0% 5.0% 5.0%Europe 1.1% 2.5% 3.1% 3.9% 3.9%Asia 9.3% 7.6% 7.1% 8.4% 8.7%
Elimination -0.1% 0.4% 0.0% 0.0% 0.0%
Source: Company materials; compiled by Daiwa
Note: 1) results based on JGAAP, estimated based on IFRS, 2) figures in chart may differ from text due to rounding

Pan-Asia Autos 26 June 2015
- 47 -
Denso: consolidated balance sheet and cash flow statement (JPYbn) (B/S , JPYbn) FY12 FY13 FY14 FY15E FY16E
Cash&marketable securities 1,095.2 1,034.1 964.4 1,006.9 1,114.3 Receivables, net 640.1 690.2 740.4 780.9 827.6 Inventories 370.7 422.4 486.1 512.6 543.3 Other 176.0 194.9 206.0 206.0 206.0
Current assets 2,281.9 2,341.6 2,396.9 2,506.4 2,691.2 Property, net 886.2 1,043.7 1,200.6 1,288.6 1,363.6 Investments 795.6 1,033.2 1,411.8 1,417.6 1,424.3 Other 15.5 23.9 23.4 23.4 23.4
Fixed assets 1,697.2 2,100.9 2,635.8 2,729.6 2,811.3 Total assets 3,979.1 4,442.5 5,032.7 5,235.9 5,502.6
Payables 456.6 493.9 521.5 545.7 578.1 Debt 507.5 435.7 418.1 418.1 418.1 Other 590.4 690.0 751.9 751.9 751.9
Liabilities 1,554.5 1,619.6 1,691.5 1,715.7 1,748.1 Equity 2,424.6 2,822.9 3,341.3 3,520.2 3,754.5 Working capital 554.1 618.7 705.0 747.8 792.8 Net Debt (587.7) (598.4) (546.3) (588.8) (696.2)
Receivable turnover 2.1 2.0 2.1 2.1 2.1 Inventory turnover 1.2 1.2 1.4 1.4 1.4 Payable turnover 1.8 1.8 1.8 1.8 1.8 Woking capital turnover 1.9 1.8 2.0 2.0 2.0 Total Assets Turnover 0.9 0.9 0.9 0.9 0.9 Net DER (0.3) (0.2) (0.2) (0.2) (0.2)
(C/F , JPYbn) FY12 FY13 FY14 FY15E FY16E
Profit 197.8 305.6 311.4 316.3 342.8 Depreciation 181.1 197.2 230.7 247.0 260.0 Equity in earnings of affiliates (5.1) (6.3) (4.7) (5.7) (6.7)
Cash in flow 373.8 496.5 537.3 557.6 596.1 Capex (230.6) (324.1) (356.1 (335.0) (335.0) Change of working capital (67.2) (64.6) (86.4 (42.7) (45.0)
Cash out flow (297.8) (388.7) (442.5) (377.7) (380.0) FCF 76.0 107.8 94.8 179.9 216.0
Dividends (40.3) (66.9) (83.7) (98.1) (99.7) Buying back shares (27.5) (0.1) (0.0) (30.0) 0.0 Debt change (15.6) (71.8) (17.6) 0.0 0.0 Other 89.1 (21.5) (54.7) 0.0 0.0
Net Liquidity Change 73.1 (61.1) (69.7) 42.5 107.5
Source: Company materials; compiled by Daiwa
Note: 1) results based on JGAAP, estimated based on IFRS, 2) figures in chart may differ from text due to rounding
Company profile
Denso Corp manufactures electronic parts for automobiles. Its products include automobile air conditioners, air bags, ignition systems, generators, power steering systems, and spark plugs with iridium electrode. The company also produces communication equipment for mobile navigation systems.

Pan-Asia Autos 26 June 2015
- 48 -
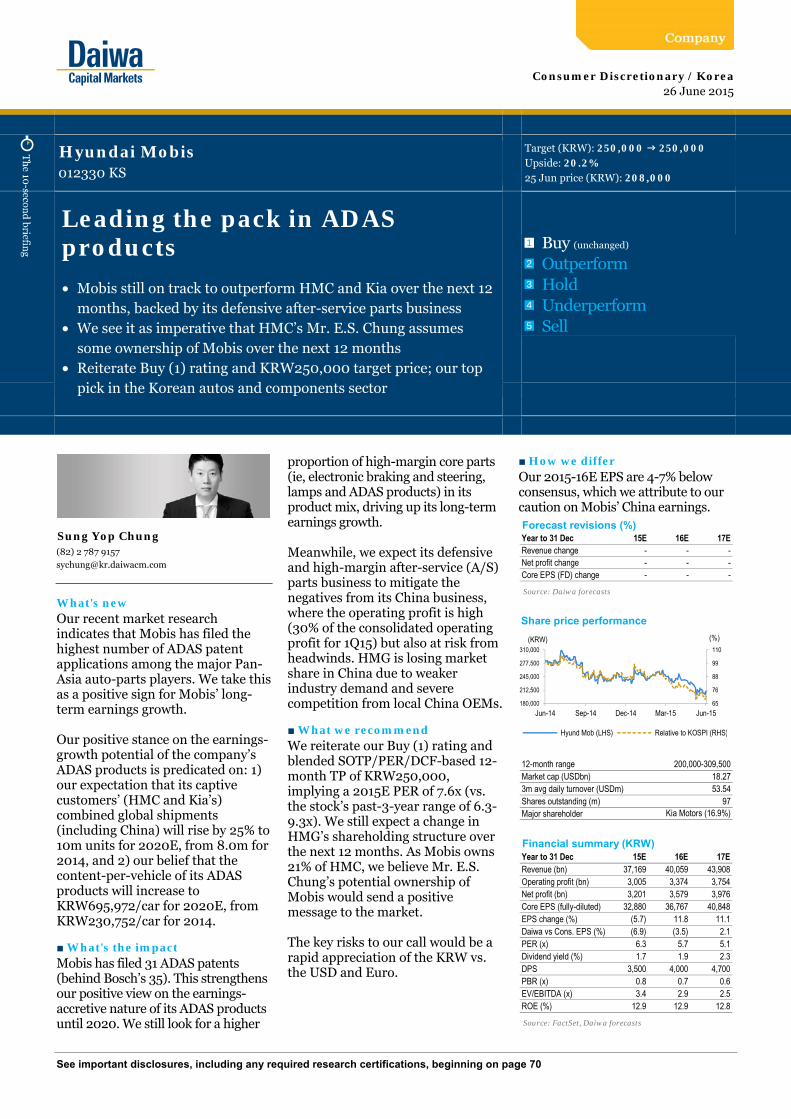
See important disclosures, including any required research certifications, beginning on page 70
What's new Our recent market research indicates that Mobis has filed the highest number of ADAS patent applications among the major Pan-Asia auto-parts players. We take this as a positive sign for Mobis’ long-term earnings growth. Our positive stance on the earnings-growth potential of the company’s ADAS products is predicated on: 1) our expectation that its captive customers’ (HMC and Kia’s) combined global shipments (including China) will rise by 25% to 10m units for 2020E, from 8.0m for 2014, and 2) our belief that the content-per-vehicle of its ADAS products will increase to KRW695,972/car for 2020E, from KRW230,752/car for 2014. ■ What's the impact Mobis has filed 31 ADAS patents (behind Bosch’s 35). This strengthens our positive view on the earnings-accretive nature of its ADAS products until 2020. We still look for a higher
proportion of high-margin core parts (ie, electronic braking and steering, lamps and ADAS products) in its product mix, driving up its long-term earnings growth. Meanwhile, we expect its defensive and high-margin after-service (A/S) parts business to mitigate the negatives from its China business, where the operating profit is high (30% of the consolidated operating profit for 1Q15) but also at risk from headwinds. HMG is losing market share in China due to weaker industry demand and severe competition from local China OEMs. ■ What we recommend We reiterate our Buy (1) rating and blended SOTP/PER/DCF-based 12-month TP of KRW250,000, implying a 2015E PER of 7.6x (vs. the stock’s past-3-year range of 6.3-9.3x). We still expect a change in HMG’s shareholding structure over the next 12 months. As Mobis owns 21% of HMC, we believe Mr. E.S. Chung’s potential ownership of Mobis would send a positive message to the market. The key risks to our call would be a rapid appreciation of the KRW vs. the USD and Euro.
■ How we differ Our 2015-16E EPS are 4-7% below consensus, which we attribute to our caution on Mobis’ China earnings.
Consumer Discretionary / Korea012330 KS
26 June 2015
Hyundai Mobis
Leading the pack in ADAS products
• Mobis still on track to outperform HMC and Kia over the next 12 months, backed by its defensive after-service parts business
• We see it as imperative that HMC’s Mr. E.S. Chung assumes some ownership of Mobis over the next 12 months
• Reiterate Buy (1) rating and KRW250,000 target price; our top pick in the Korean autos and components sector
Source: Daiwa forecasts
Source: FactSet, Daiwa forecasts
Consumer Discretionary / Korea
Hyundai Mobis012330 KS
Target (KRW): 250,000 250,000Upside: 20.2%25 Jun price (KRW): 208,000
Buy (unchanged)
OutperformHoldUnderperformSell
1
2
3
4
5
Forecast revisions (%)Year to 31 Dec 15E 16E 17ERevenue change - - -Net profit change - - -Core EPS (FD) change - - -
65
76
88
99
110
180,000
212,500
245,000
277,500
310,000
Jun-14 Sep-14 Dec-14 Mar-15 Jun-15
Share price performance
Hyund Mob (LHS) Relative to KOSPI (RHS)
(KRW) (%)
12-month range 200,000-309,500Market cap (USDbn) 18.273m avg daily turnover (USDm) 53.54Shares outstanding (m) 97Major shareholder Kia Motors (16.9%)
Financial summary (KRW)Year to 31 Dec 15E 16E 17ERevenue (bn) 37,169 40,059 43,908Operating profit (bn) 3,005 3,374 3,754Net profit (bn) 3,201 3,579 3,976Core EPS (fully-diluted) 32,880 36,767 40,848EPS change (%) (5.7) 11.8 11.1Daiwa vs Cons. EPS (%) (6.9) (3.5) 2.1PER (x) 6.3 5.7 5.1Dividend yield (%) 1.7 1.9 2.3DPS 3,500 4,000 4,700PBR (x) 0.8 0.7 0.6EV/EBITDA (x) 3.4 2.9 2.5ROE (%) 12.9 12.9 12.8
Sung Yop Chung(82) 2 787 [email protected]
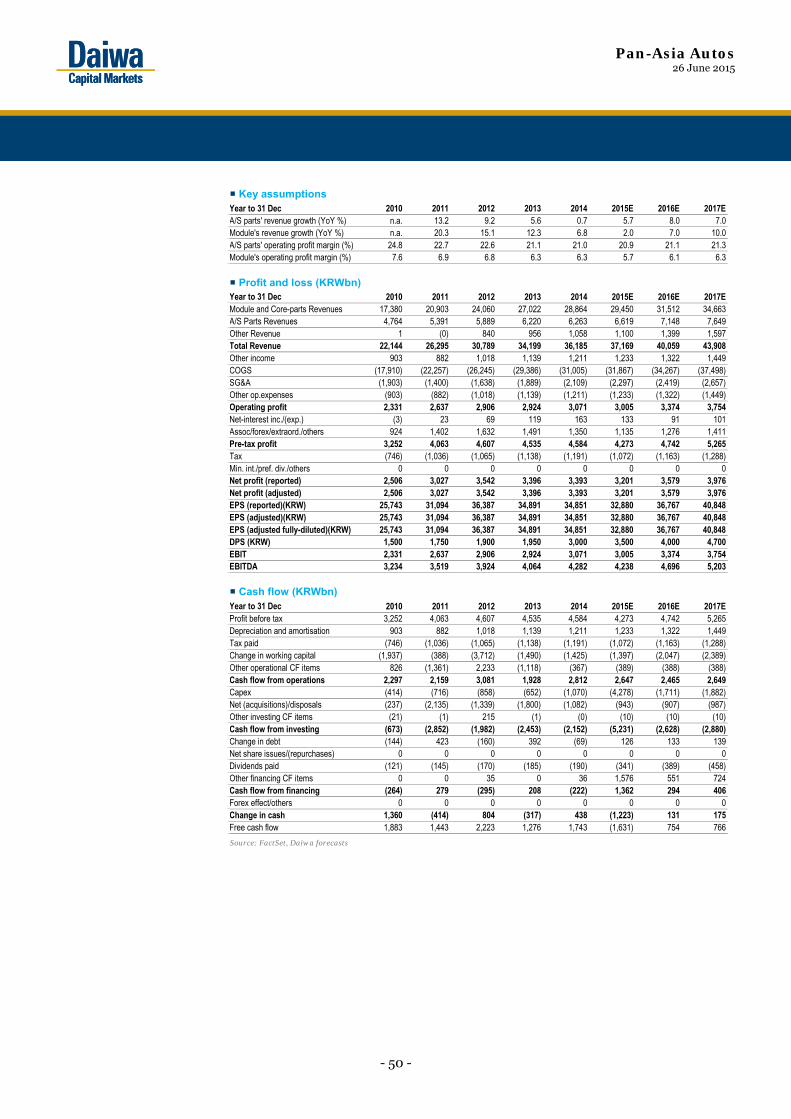
Pan-Asia Autos 26 June 2015
- 50 -
Key assumptions
Profit and loss (KRWbn)
Cash flow (KRWbn)
Source: FactSet, Daiwa forecasts
Year to 31 Dec 2010 2011 2012 2013 2014 2015E 2016E 2017EA/S parts' revenue growth (YoY %) n.a. 13.2 9.2 5.6 0.7 5.7 8.0 7.0Module's revenue growth (YoY %) n.a. 20.3 15.1 12.3 6.8 2.0 7.0 10.0A/S parts' operating profit margin (%) 24.8 22.7 22.6 21.1 21.0 20.9 21.1 21.3Module's operating profit margin (%) 7.6 6.9 6.8 6.3 6.3 5.7 6.1 6.3
Year to 31 Dec 2010 2011 2012 2013 2014 2015E 2016E 2017EModule and Core-parts Revenues 17,380 20,903 24,060 27,022 28,864 29,450 31,512 34,663A/S Parts Revenues 4,764 5,391 5,889 6,220 6,263 6,619 7,148 7,649Other Revenue 1 (0) 840 956 1,058 1,100 1,399 1,597Total Revenue 22,144 26,295 30,789 34,199 36,185 37,169 40,059 43,908Other income 903 882 1,018 1,139 1,211 1,233 1,322 1,449COGS (17,910) (22,257) (26,245) (29,386) (31,005) (31,867) (34,267) (37,498)SG&A (1,903) (1,400) (1,638) (1,889) (2,109) (2,297) (2,419) (2,657)Other op.expenses (903) (882) (1,018) (1,139) (1,211) (1,233) (1,322) (1,449)Operating profit 2,331 2,637 2,906 2,924 3,071 3,005 3,374 3,754Net-interest inc./(exp.) (3) 23 69 119 163 133 91 101Assoc/forex/extraord./others 924 1,402 1,632 1,491 1,350 1,135 1,276 1,411Pre-tax profit 3,252 4,063 4,607 4,535 4,584 4,273 4,742 5,265Tax (746) (1,036) (1,065) (1,138) (1,191) (1,072) (1,163) (1,288)Min. int./pref. div./others 0 0 0 0 0 0 0 0Net profit (reported) 2,506 3,027 3,542 3,396 3,393 3,201 3,579 3,976Net profit (adjusted) 2,506 3,027 3,542 3,396 3,393 3,201 3,579 3,976EPS (reported)(KRW) 25,743 31,094 36,387 34,891 34,851 32,880 36,767 40,848EPS (adjusted)(KRW) 25,743 31,094 36,387 34,891 34,851 32,880 36,767 40,848EPS (adjusted fully-diluted)(KRW) 25,743 31,094 36,387 34,891 34,851 32,880 36,767 40,848DPS (KRW) 1,500 1,750 1,900 1,950 3,000 3,500 4,000 4,700EBIT 2,331 2,637 2,906 2,924 3,071 3,005 3,374 3,754EBITDA 3,234 3,519 3,924 4,064 4,282 4,238 4,696 5,203
Year to 31 Dec 2010 2011 2012 2013 2014 2015E 2016E 2017EProfit before tax 3,252 4,063 4,607 4,535 4,584 4,273 4,742 5,265Depreciation and amortisation 903 882 1,018 1,139 1,211 1,233 1,322 1,449Tax paid (746) (1,036) (1,065) (1,138) (1,191) (1,072) (1,163) (1,288)Change in working capital (1,937) (388) (3,712) (1,490) (1,425) (1,397) (2,047) (2,389)Other operational CF items 826 (1,361) 2,233 (1,118) (367) (389) (388) (388)Cash flow from operations 2,297 2,159 3,081 1,928 2,812 2,647 2,465 2,649Capex (414) (716) (858) (652) (1,070) (4,278) (1,711) (1,882)Net (acquisitions)/disposals (237) (2,135) (1,339) (1,800) (1,082) (943) (907) (987)Other investing CF items (21) (1) 215 (1) (0) (10) (10) (10)Cash flow from investing (673) (2,852) (1,982) (2,453) (2,152) (5,231) (2,628) (2,880)Change in debt (144) 423 (160) 392 (69) 126 133 139Net share issues/(repurchases) 0 0 0 0 0 0 0 0Dividends paid (121) (145) (170) (185) (190) (341) (389) (458)Other financing CF items 0 0 35 0 36 1,576 551 724Cash flow from financing (264) 279 (295) 208 (222) 1,362 294 406Forex effect/others 0 0 0 0 0 0 0 0Change in cash 1,360 (414) 804 (317) 438 (1,223) 131 175Free cash flow 1,883 1,443 2,223 1,276 1,743 (1,631) 754 766
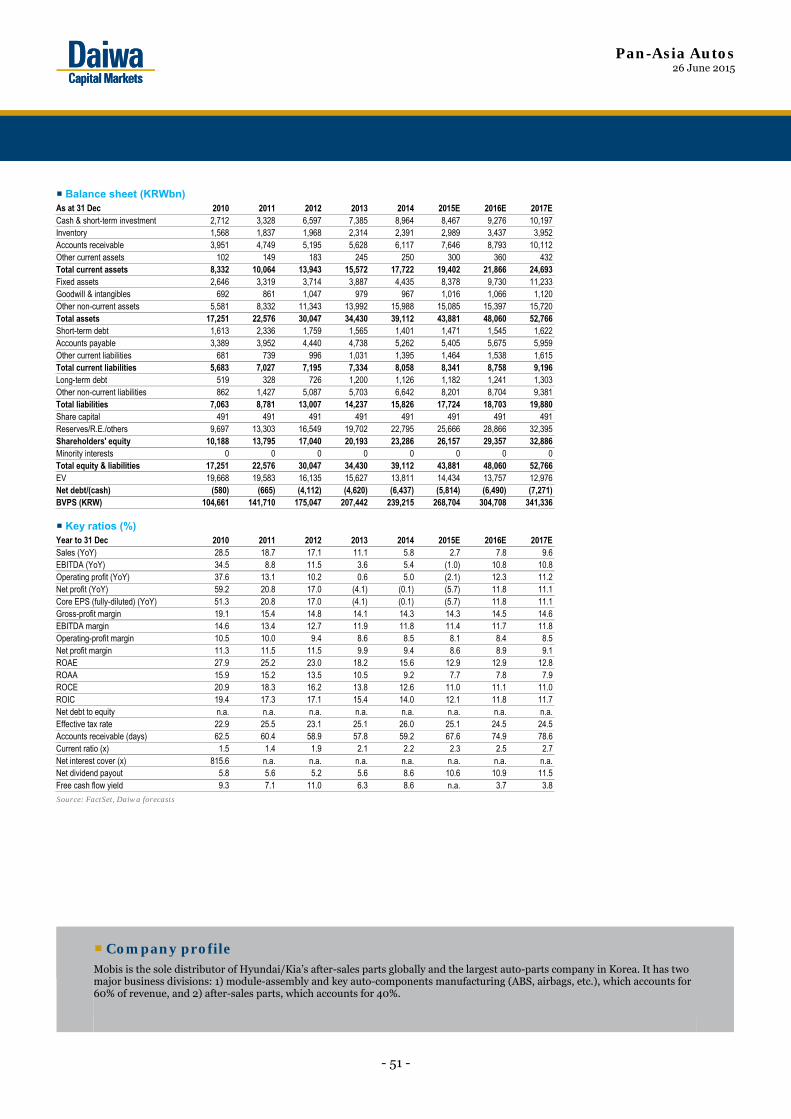
Pan-Asia Autos 26 June 2015
- 51 -
Balance sheet (KRWbn)
Key ratios (%)
Source: FactSet, Daiwa forecasts
Company profile
Mobis is the sole distributor of Hyundai/Kia’s after-sales parts globally and the largest auto-parts company in Korea. It has two major business divisions: 1) module-assembly and key auto-components manufacturing (ABS, airbags, etc.), which accounts for 60% of revenue, and 2) after-sales parts, which accounts for 40%.
As at 31 Dec 2010 2011 2012 2013 2014 2015E 2016E 2017ECash & short-term investment 2,712 3,328 6,597 7,385 8,964 8,467 9,276 10,197Inventory 1,568 1,837 1,968 2,314 2,391 2,989 3,437 3,952Accounts receivable 3,951 4,749 5,195 5,628 6,117 7,646 8,793 10,112Other current assets 102 149 183 245 250 300 360 432Total current assets 8,332 10,064 13,943 15,572 17,722 19,402 21,866 24,693Fixed assets 2,646 3,319 3,714 3,887 4,435 8,378 9,730 11,233Goodwill & intangibles 692 861 1,047 979 967 1,016 1,066 1,120Other non-current assets 5,581 8,332 11,343 13,992 15,988 15,085 15,397 15,720Total assets 17,251 22,576 30,047 34,430 39,112 43,881 48,060 52,766Short-term debt 1,613 2,336 1,759 1,565 1,401 1,471 1,545 1,622Accounts payable 3,389 3,952 4,440 4,738 5,262 5,405 5,675 5,959Other current liabilities 681 739 996 1,031 1,395 1,464 1,538 1,615Total current liabilities 5,683 7,027 7,195 7,334 8,058 8,341 8,758 9,196Long-term debt 519 328 726 1,200 1,126 1,182 1,241 1,303Other non-current liabilities 862 1,427 5,087 5,703 6,642 8,201 8,704 9,381Total liabilities 7,063 8,781 13,007 14,237 15,826 17,724 18,703 19,880Share capital 491 491 491 491 491 491 491 491Reserves/R.E./others 9,697 13,303 16,549 19,702 22,795 25,666 28,866 32,395Shareholders' equity 10,188 13,795 17,040 20,193 23,286 26,157 29,357 32,886Minority interests 0 0 0 0 0 0 0 0Total equity & liabilities 17,251 22,576 30,047 34,430 39,112 43,881 48,060 52,766EV 19,668 19,583 16,135 15,627 13,811 14,434 13,757 12,976Net debt/(cash) (580) (665) (4,112) (4,620) (6,437) (5,814) (6,490) (7,271)BVPS (KRW) 104,661 141,710 175,047 207,442 239,215 268,704 304,708 341,336
Year to 31 Dec 2010 2011 2012 2013 2014 2015E 2016E 2017ESales (YoY) 28.5 18.7 17.1 11.1 5.8 2.7 7.8 9.6EBITDA (YoY) 34.5 8.8 11.5 3.6 5.4 (1.0) 10.8 10.8Operating profit (YoY) 37.6 13.1 10.2 0.6 5.0 (2.1) 12.3 11.2Net profit (YoY) 59.2 20.8 17.0 (4.1) (0.1) (5.7) 11.8 11.1Core EPS (fully-diluted) (YoY) 51.3 20.8 17.0 (4.1) (0.1) (5.7) 11.8 11.1Gross-profit margin 19.1 15.4 14.8 14.1 14.3 14.3 14.5 14.6EBITDA margin 14.6 13.4 12.7 11.9 11.8 11.4 11.7 11.8Operating-profit margin 10.5 10.0 9.4 8.6 8.5 8.1 8.4 8.5Net profit margin 11.3 11.5 11.5 9.9 9.4 8.6 8.9 9.1ROAE 27.9 25.2 23.0 18.2 15.6 12.9 12.9 12.8ROAA 15.9 15.2 13.5 10.5 9.2 7.7 7.8 7.9ROCE 20.9 18.3 16.2 13.8 12.6 11.0 11.1 11.0ROIC 19.4 17.3 17.1 15.4 14.0 12.1 11.8 11.7Net debt to equity n.a. n.a. n.a. n.a. n.a. n.a. n.a. n.a.Effective tax rate 22.9 25.5 23.1 25.1 26.0 25.1 24.5 24.5Accounts receivable (days) 62.5 60.4 58.9 57.8 59.2 67.6 74.9 78.6Current ratio (x) 1.5 1.4 1.9 2.1 2.2 2.3 2.5 2.7Net interest cover (x) 815.6 n.a. n.a. n.a. n.a. n.a. n.a. n.a.Net dividend payout 5.8 5.6 5.2 5.6 8.6 10.6 10.9 11.5Free cash flow yield 9.3 7.1 11.0 6.3 8.6 n.a. 3.7 3.8
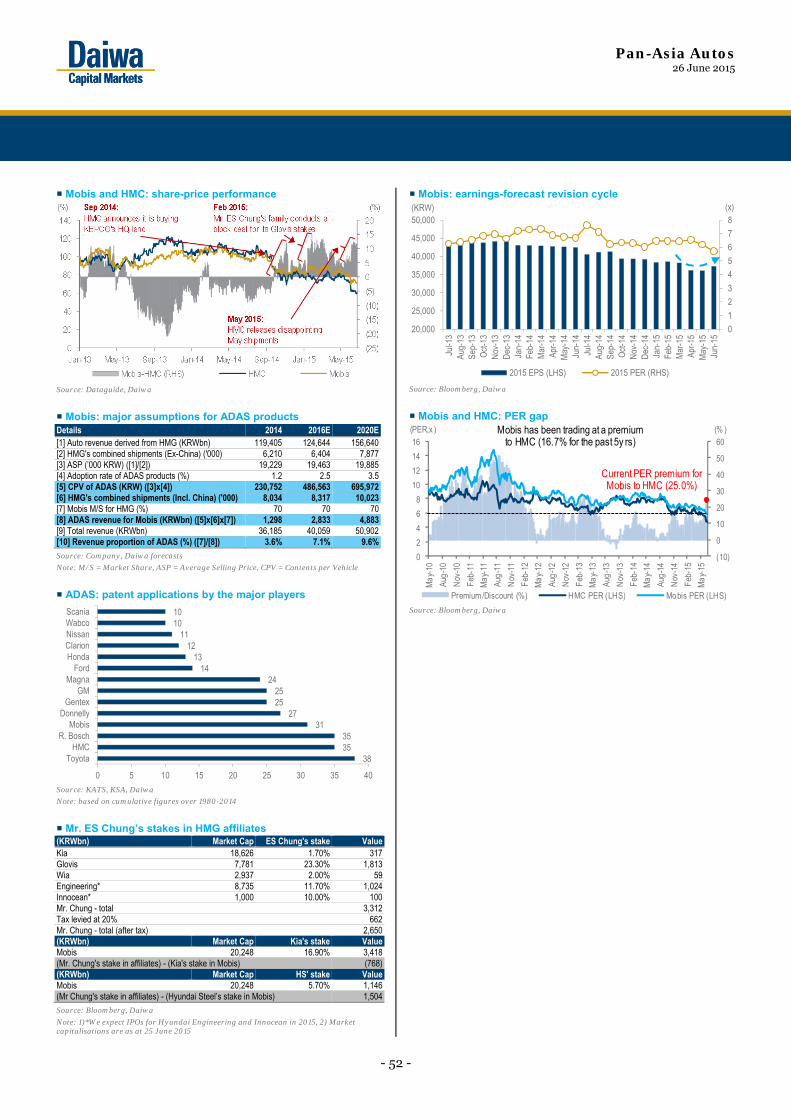
Pan-Asia Autos 26 June 2015
- 52 -
Mobis and HMC: share-price performance
Source: Dataguide, Daiwa
Mobis: major assumptions for ADAS products Details 2014 2016E 2020E[1] Auto revenue derived from HMG (KRWbn) 119,405 124,644 156,640[2] HMG's combined shipments (Ex-China) ('000) 6,210 6,404 7,877[3] ASP (’000 KRW) ([1]/[2]) 19,229 19,463 19,885[4] Adoption rate of ADAS products (%) 1.2 2.5 3.5[5] CPV of ADAS (KRW) ([3]x[4]) 230,752 486,563 695,972[6] HMG's combined shipments (Incl. China) ('000) 8,034 8,317 10,023 [7] Mobis M/S for HMG (%) 70 70 70[8] ADAS revenue for Mobis (KRWbn) ([5]x[6]x[7]) 1,298 2,833 4,883[9] Total revenue (KRWbn) 36,185 40,059 50,902[10] Revenue proportion of ADAS (%) ([7]/[8]) 3.6% 7.1% 9.6%
Source: Company, Daiwa forecasts
Note: M/S = Market Share, ASP = Average Selling Price, CPV = Contents per Vehicle
ADAS: patent applications by the major players
Source: KATS, KSA, Daiwa
Note: based on cumulative figures over 1980-2014
Mr. ES Chung’s stakes in HMG affiliates (KRWbn) Market Cap ES Chung's stake ValueKia 18,626 1.70% 317Glovis 7,781 23.30% 1,813Wia 2,937 2.00% 59Engineering* 8,735 11.70% 1,024Innocean* 1,000 10.00% 100Mr. Chung - total 3,312Tax levied at 20% 662Mr. Chung - total (after tax) 2,650(KRWbn) Market Cap Kia's stake ValueMobis 20,248 16.90% 3,418(Mr. Chung's stake in affiliates) - (Kia's stake in Mobis) (768)(KRWbn) Market Cap HS' stake ValueMobis 20,248 5.70% 1,146(Mr Chung's stake in affiliates) - (Hyundai Steel’s stake in Mobis) 1,504Source: Bloomberg, Daiwa
Note: 1)*We expect IPOs for Hyundai Engineering and Innocean in 2015, 2) Market capitalisations are as at 25 June 2015
Mobis: earnings-forecast revision cycle
Source: Bloomberg, Daiwa
Mobis and HMC: PER gap
Source: Bloomberg, Daiwa
383535
3127
2525
2414
1312
111010
0 5 10 15 20 25 30 35 40
ToyotaHMC
R. BoschMobis
DonnellyGentex
GMMagna
FordHondaClarionNissanWabcoScania
0
1
2
3
4
5
6
7
8
20,000
25,000
30,000
35,000
40,000
45,000
50,000
Jul-1
3Au
g-13
Sep-
13O
ct-1
3N
ov-1
3D
ec-1
3Ja
n-14
Feb-
14M
ar-1
4Ap
r-14
May
-14
Jun-
14Ju
l-14
Aug-
14Se
p-14
Oct
-14
Nov
-14
Dec
-14
Jan-
15Fe
b-15
Mar
-15
Apr-1
5M
ay-1
5Ju
n-15
2015 EPS (LHS) 2015 PER (RHS)
(KRW) (x)
(10)
0
10
20
30
40
50
60
0
2
4
6
8
10
12
14
16
May
-10
Aug-
10
Nov
-10
Feb-
11
May
-11
Aug-
11
Nov
-11
Feb-
12
May
-12
Aug-
12
Nov
-12
Feb-
13
May
-13
Aug-
13
Nov
-13
Feb-
14
May
-14
Aug-
14
Nov
-14
Feb-
15
May
-15
Premium/Discount (%) HMC PER (LHS) Mobis PER (LHS)
(% )(PER,x ) Mobis has been trading at a premium to HMC (16.7% for the past 5y rs)
Current PER premium for Mobis to HMC (25.0%)
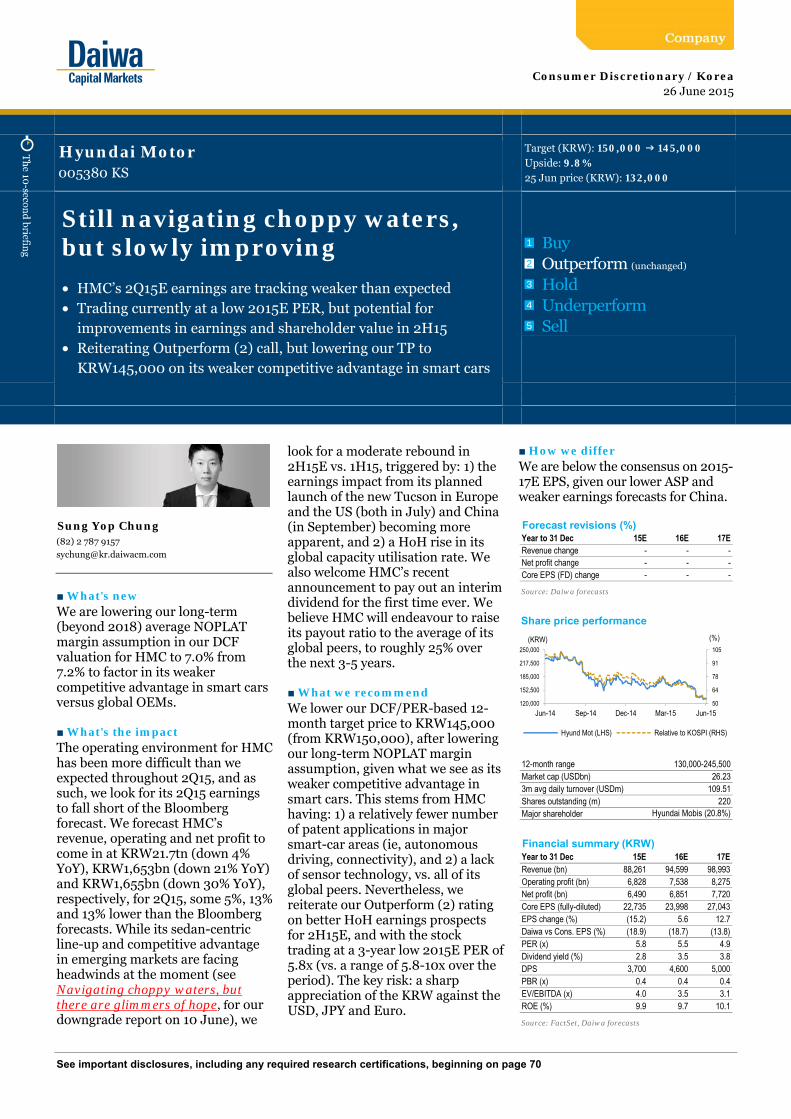
See important disclosures, including any required research certifications, beginning on page 70
■ What's new We are lowering our long-term (beyond 2018) average NOPLAT margin assumption in our DCF valuation for HMC to 7.0% from 7.2% to factor in its weaker competitive advantage in smart cars versus global OEMs. ■ What's the impact The operating environment for HMC has been more difficult than we expected throughout 2Q15, and as such, we look for its 2Q15 earnings to fall short of the Bloomberg forecast. We forecast HMC’s revenue, operating and net profit to come in at KRW21.7tn (down 4% YoY), KRW1,653bn (down 21% YoY) and KRW1,655bn (down 30% YoY), respectively, for 2Q15, some 5%, 13% and 13% lower than the Bloomberg forecasts. While its sedan-centric line-up and competitive advantage in emerging markets are facing headwinds at the moment (see Navigating choppy waters, but there are glimmers of hope, for our downgrade report on 10 June), we
look for a moderate rebound in 2H15E vs. 1H15, triggered by: 1) the earnings impact from its planned launch of the new Tucson in Europe and the US (both in July) and China (in September) becoming more apparent, and 2) a HoH rise in its global capacity utilisation rate. We also welcome HMC’s recent announcement to pay out an interim dividend for the first time ever. We believe HMC will endeavour to raise its payout ratio to the average of its global peers, to roughly 25% over the next 3-5 years. ■ What we recommend We lower our DCF/PER-based 12-month target price to KRW145,000 (from KRW150,000), after lowering our long-term NOPLAT margin assumption, given what we see as its weaker competitive advantage in smart cars. This stems from HMC having: 1) a relatively fewer number of patent applications in major smart-car areas (ie, autonomous driving, connectivity), and 2) a lack of sensor technology, vs. all of its global peers. Nevertheless, we reiterate our Outperform (2) rating on better HoH earnings prospects for 2H15E, and with the stock trading at a 3-year low 2015E PER of 5.8x (vs. a range of 5.8-10x over the period). The key risk: a sharp appreciation of the KRW against the USD, JPY and Euro.
■ How we differ We are below the consensus on 2015-17E EPS, given our lower ASP and weaker earnings forecasts for China.
Consumer Discretionary / Korea005380 KS
26 June 2015
Hyundai Motor
Still navigating choppy waters, but slowly improving
• HMC’s 2Q15E earnings are tracking weaker than expected • Trading currently at a low 2015E PER, but potential for
improvements in earnings and shareholder value in 2H15 • Reiterating Outperform (2) call, but lowering our TP to
KRW145,000 on its weaker competitive advantage in smart cars
Source: Daiwa forecasts
Source: FactSet, Daiwa forecasts
Consumer Discretionary / Korea
Hyundai Motor005380 KS
Target (KRW): 150,000 145,000Upside: 9.8%25 Jun price (KRW): 132,000
BuyOutperform (unchanged)
HoldUnderperformSell
1
2
3
4
5
Forecast revisions (%)Year to 31 Dec 15E 16E 17ERevenue change - - -Net profit change - - -Core EPS (FD) change - - -
50
64
78
91
105
120,000
152,500
185,000
217,500
250,000
Jun-14 Sep-14 Dec-14 Mar-15 Jun-15
Share price performance
Hyund Mot (LHS) Relative to KOSPI (RHS)
(KRW) (%)
12-month range 130,000-245,500Market cap (USDbn) 26.233m avg daily turnover (USDm) 109.51Shares outstanding (m) 220Major shareholder Hyundai Mobis (20.8%)
Financial summary (KRW)Year to 31 Dec 15E 16E 17ERevenue (bn) 88,261 94,599 98,993Operating profit (bn) 6,828 7,538 8,275Net profit (bn) 6,490 6,851 7,720Core EPS (fully-diluted) 22,735 23,998 27,043EPS change (%) (15.2) 5.6 12.7Daiwa vs Cons. EPS (%) (18.9) (18.7) (13.8)PER (x) 5.8 5.5 4.9Dividend yield (%) 2.8 3.5 3.8DPS 3,700 4,600 5,000PBR (x) 0.4 0.4 0.4EV/EBITDA (x) 4.0 3.5 3.1ROE (%) 9.9 9.7 10.1
Sung Yop Chung(82) 2 787 [email protected]
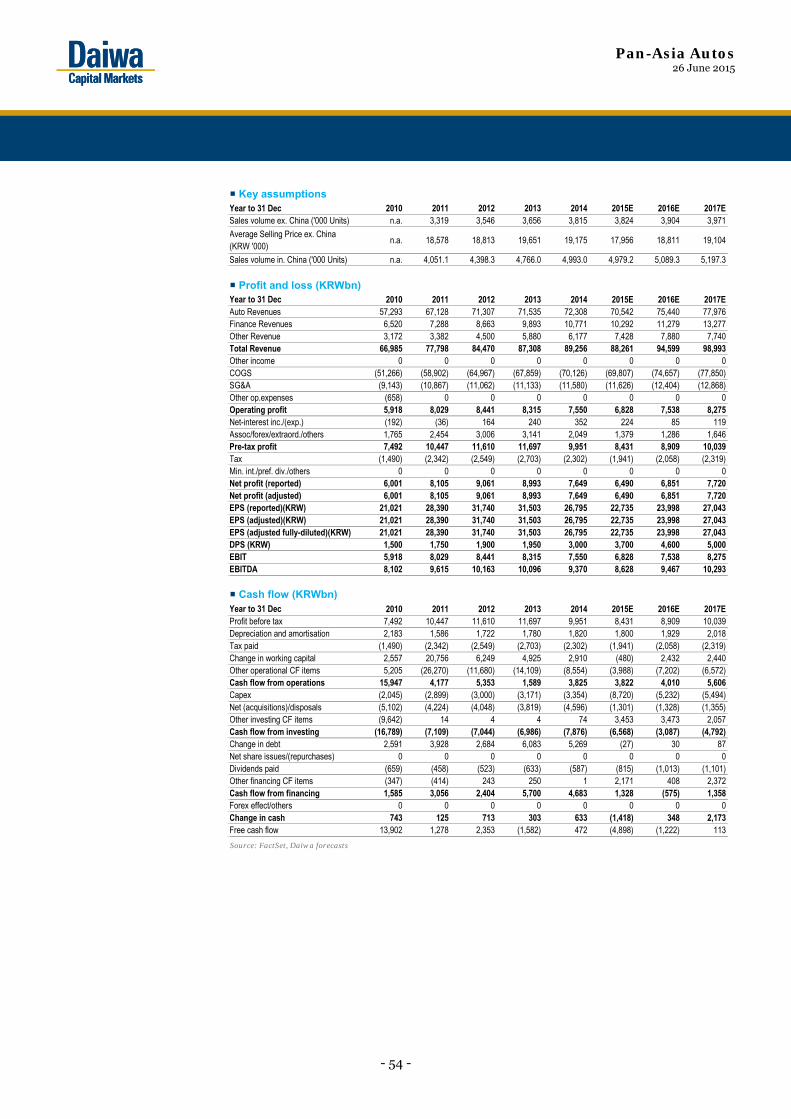
Pan-Asia Autos 26 June 2015
- 54 -
Key assumptions
Profit and loss (KRWbn)
Cash flow (KRWbn)
Source: FactSet, Daiwa forecasts
Year to 31 Dec 2010 2011 2012 2013 2014 2015E 2016E 2017ESales volume ex. China ('000 Units) n.a. 3,319 3,546 3,656 3,815 3,824 3,904 3,971
Average Selling Price ex. China (KRW '000)
n.a. 18,578 18,813 19,651 19,175 17,956 18,811 19,104
Sales volume in. China ('000 Units) n.a. 4,051.1 4,398.3 4,766.0 4,993.0 4,979.2 5,089.3 5,197.3
Year to 31 Dec 2010 2011 2012 2013 2014 2015E 2016E 2017EAuto Revenues 57,293 67,128 71,307 71,535 72,308 70,542 75,440 77,976Finance Revenues 6,520 7,288 8,663 9,893 10,771 10,292 11,279 13,277Other Revenue 3,172 3,382 4,500 5,880 6,177 7,428 7,880 7,740Total Revenue 66,985 77,798 84,470 87,308 89,256 88,261 94,599 98,993Other income 0 0 0 0 0 0 0 0COGS (51,266) (58,902) (64,967) (67,859) (70,126) (69,807) (74,657) (77,850)SG&A (9,143) (10,867) (11,062) (11,133) (11,580) (11,626) (12,404) (12,868)Other op.expenses (658) 0 0 0 0 0 0 0Operating profit 5,918 8,029 8,441 8,315 7,550 6,828 7,538 8,275Net-interest inc./(exp.) (192) (36) 164 240 352 224 85 119Assoc/forex/extraord./others 1,765 2,454 3,006 3,141 2,049 1,379 1,286 1,646Pre-tax profit 7,492 10,447 11,610 11,697 9,951 8,431 8,909 10,039Tax (1,490) (2,342) (2,549) (2,703) (2,302) (1,941) (2,058) (2,319)Min. int./pref. div./others 0 0 0 0 0 0 0 0Net profit (reported) 6,001 8,105 9,061 8,993 7,649 6,490 6,851 7,720Net profit (adjusted) 6,001 8,105 9,061 8,993 7,649 6,490 6,851 7,720EPS (reported)(KRW) 21,021 28,390 31,740 31,503 26,795 22,735 23,998 27,043EPS (adjusted)(KRW) 21,021 28,390 31,740 31,503 26,795 22,735 23,998 27,043EPS (adjusted fully-diluted)(KRW) 21,021 28,390 31,740 31,503 26,795 22,735 23,998 27,043DPS (KRW) 1,500 1,750 1,900 1,950 3,000 3,700 4,600 5,000EBIT 5,918 8,029 8,441 8,315 7,550 6,828 7,538 8,275EBITDA 8,102 9,615 10,163 10,096 9,370 8,628 9,467 10,293
Year to 31 Dec 2010 2011 2012 2013 2014 2015E 2016E 2017EProfit before tax 7,492 10,447 11,610 11,697 9,951 8,431 8,909 10,039Depreciation and amortisation 2,183 1,586 1,722 1,780 1,820 1,800 1,929 2,018Tax paid (1,490) (2,342) (2,549) (2,703) (2,302) (1,941) (2,058) (2,319)Change in working capital 2,557 20,756 6,249 4,925 2,910 (480) 2,432 2,440Other operational CF items 5,205 (26,270) (11,680) (14,109) (8,554) (3,988) (7,202) (6,572)Cash flow from operations 15,947 4,177 5,353 1,589 3,825 3,822 4,010 5,606Capex (2,045) (2,899) (3,000) (3,171) (3,354) (8,720) (5,232) (5,494)Net (acquisitions)/disposals (5,102) (4,224) (4,048) (3,819) (4,596) (1,301) (1,328) (1,355)Other investing CF items (9,642) 14 4 4 74 3,453 3,473 2,057Cash flow from investing (16,789) (7,109) (7,044) (6,986) (7,876) (6,568) (3,087) (4,792)Change in debt 2,591 3,928 2,684 6,083 5,269 (27) 30 87Net share issues/(repurchases) 0 0 0 0 0 0 0 0Dividends paid (659) (458) (523) (633) (587) (815) (1,013) (1,101)Other financing CF items (347) (414) 243 250 1 2,171 408 2,372Cash flow from financing 1,585 3,056 2,404 5,700 4,683 1,328 (575) 1,358Forex effect/others 0 0 0 0 0 0 0 0Change in cash 743 125 713 303 633 (1,418) 348 2,173Free cash flow 13,902 1,278 2,353 (1,582) 472 (4,898) (1,222) 113
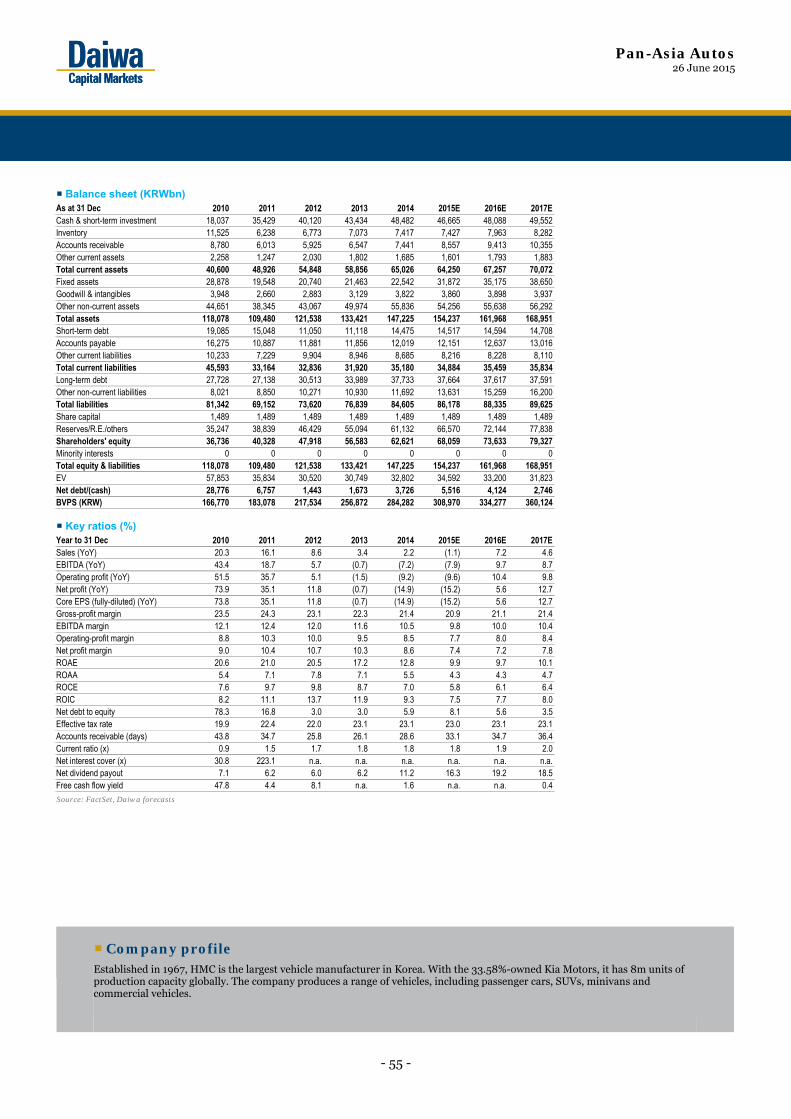
Pan-Asia Autos 26 June 2015
- 55 -
Balance sheet (KRWbn)
Key ratios (%)
Source: FactSet, Daiwa forecasts
Company profile
Established in 1967, HMC is the largest vehicle manufacturer in Korea. With the 33.58%-owned Kia Motors, it has 8m units of production capacity globally. The company produces a range of vehicles, including passenger cars, SUVs, minivans and commercial vehicles.
As at 31 Dec 2010 2011 2012 2013 2014 2015E 2016E 2017ECash & short-term investment 18,037 35,429 40,120 43,434 48,482 46,665 48,088 49,552Inventory 11,525 6,238 6,773 7,073 7,417 7,427 7,963 8,282Accounts receivable 8,780 6,013 5,925 6,547 7,441 8,557 9,413 10,355Other current assets 2,258 1,247 2,030 1,802 1,685 1,601 1,793 1,883Total current assets 40,600 48,926 54,848 58,856 65,026 64,250 67,257 70,072Fixed assets 28,878 19,548 20,740 21,463 22,542 31,872 35,175 38,650Goodwill & intangibles 3,948 2,660 2,883 3,129 3,822 3,860 3,898 3,937Other non-current assets 44,651 38,345 43,067 49,974 55,836 54,256 55,638 56,292Total assets 118,078 109,480 121,538 133,421 147,225 154,237 161,968 168,951Short-term debt 19,085 15,048 11,050 11,118 14,475 14,517 14,594 14,708Accounts payable 16,275 10,887 11,881 11,856 12,019 12,151 12,637 13,016Other current liabilities 10,233 7,229 9,904 8,946 8,685 8,216 8,228 8,110Total current liabilities 45,593 33,164 32,836 31,920 35,180 34,884 35,459 35,834Long-term debt 27,728 27,138 30,513 33,989 37,733 37,664 37,617 37,591Other non-current liabilities 8,021 8,850 10,271 10,930 11,692 13,631 15,259 16,200Total liabilities 81,342 69,152 73,620 76,839 84,605 86,178 88,335 89,625Share capital 1,489 1,489 1,489 1,489 1,489 1,489 1,489 1,489Reserves/R.E./others 35,247 38,839 46,429 55,094 61,132 66,570 72,144 77,838Shareholders' equity 36,736 40,328 47,918 56,583 62,621 68,059 73,633 79,327Minority interests 0 0 0 0 0 0 0 0Total equity & liabilities 118,078 109,480 121,538 133,421 147,225 154,237 161,968 168,951EV 57,853 35,834 30,520 30,749 32,802 34,592 33,200 31,823Net debt/(cash) 28,776 6,757 1,443 1,673 3,726 5,516 4,124 2,746BVPS (KRW) 166,770 183,078 217,534 256,872 284,282 308,970 334,277 360,124
Year to 31 Dec 2010 2011 2012 2013 2014 2015E 2016E 2017ESales (YoY) 20.3 16.1 8.6 3.4 2.2 (1.1) 7.2 4.6EBITDA (YoY) 43.4 18.7 5.7 (0.7) (7.2) (7.9) 9.7 8.7Operating profit (YoY) 51.5 35.7 5.1 (1.5) (9.2) (9.6) 10.4 9.8Net profit (YoY) 73.9 35.1 11.8 (0.7) (14.9) (15.2) 5.6 12.7Core EPS (fully-diluted) (YoY) 73.8 35.1 11.8 (0.7) (14.9) (15.2) 5.6 12.7Gross-profit margin 23.5 24.3 23.1 22.3 21.4 20.9 21.1 21.4EBITDA margin 12.1 12.4 12.0 11.6 10.5 9.8 10.0 10.4Operating-profit margin 8.8 10.3 10.0 9.5 8.5 7.7 8.0 8.4Net profit margin 9.0 10.4 10.7 10.3 8.6 7.4 7.2 7.8ROAE 20.6 21.0 20.5 17.2 12.8 9.9 9.7 10.1ROAA 5.4 7.1 7.8 7.1 5.5 4.3 4.3 4.7ROCE 7.6 9.7 9.8 8.7 7.0 5.8 6.1 6.4ROIC 8.2 11.1 13.7 11.9 9.3 7.5 7.7 8.0Net debt to equity 78.3 16.8 3.0 3.0 5.9 8.1 5.6 3.5Effective tax rate 19.9 22.4 22.0 23.1 23.1 23.0 23.1 23.1Accounts receivable (days) 43.8 34.7 25.8 26.1 28.6 33.1 34.7 36.4Current ratio (x) 0.9 1.5 1.7 1.8 1.8 1.8 1.9 2.0Net interest cover (x) 30.8 223.1 n.a. n.a. n.a. n.a. n.a. n.a.Net dividend payout 7.1 6.2 6.0 6.2 11.2 16.3 19.2 18.5Free cash flow yield 47.8 4.4 8.1 n.a. 1.6 n.a. n.a. 0.4
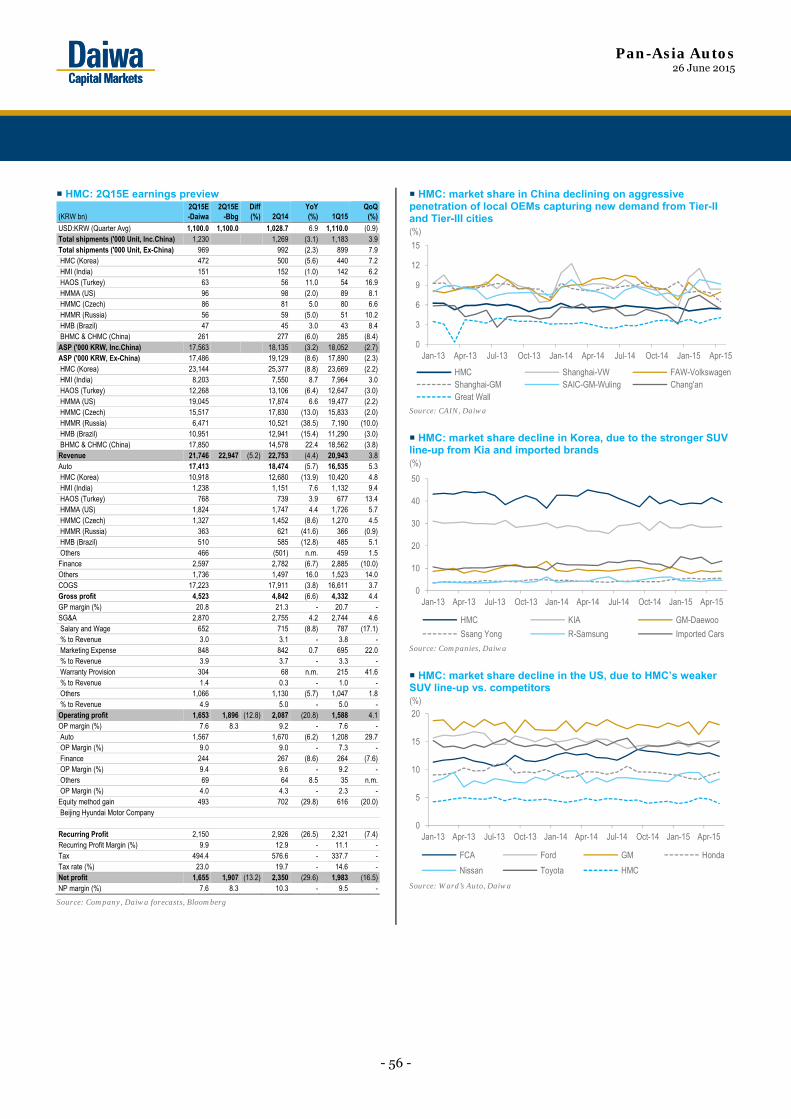
Pan-Asia Autos 26 June 2015
- 56 -
HMC: 2Q15E earnings preview
(KRW bn) 2Q15E -Daiwa
2Q15E-Bbg
Diff (%) 2Q14
YoY (%) 1Q15
QoQ(%)
USD:KRW (Quarter Avg) 1,100.0 1,100.0 1,028.7 6.9 1,110.0 (0.9)Total shipments ('000 Unit, Inc.China) 1,230 1,269 (3.1) 1,183 3.9 Total shipments ('000 Unit, Ex-China) 969 992 (2.3) 899 7.9 HMC (Korea) 472 500 (5.6) 440 7.2 HMI (India) 151 152 (1.0) 142 6.2 HAOS (Turkey) 63 56 11.0 54 16.9 HMMA (US) 96 98 (2.0) 89 8.1 HMMC (Czech) 86 81 5.0 80 6.6 HMMR (Russia) 56 59 (5.0) 51 10.2 HMB (Brazil) 47 45 3.0 43 8.4 BHMC & CHMC (China) 261 277 (6.0) 285 (8.4)ASP ('000 KRW, Inc.China) 17,563 18,135 (3.2) 18,052 (2.7)ASP ('000 KRW, Ex-China) 17,486 19,129 (8.6) 17,890 (2.3) HMC (Korea) 23,144 25,377 (8.8) 23,669 (2.2) HMI (India) 8,203 7,550 8.7 7,964 3.0 HAOS (Turkey) 12,268 13,106 (6.4) 12,647 (3.0) HMMA (US) 19,045 17,874 6.6 19,477 (2.2) HMMC (Czech) 15,517 17,830 (13.0) 15,833 (2.0) HMMR (Russia) 6,471 10,521 (38.5) 7,190 (10.0) HMB (Brazil) 10,951 12,941 (15.4) 11,290 (3.0) BHMC & CHMC (China) 17,850 14,578 22.4 18,562 (3.8)Revenue 21,746 22,947 (5.2) 22,753 (4.4) 20,943 3.8 Auto 17,413 18,474 (5.7) 16,535 5.3 HMC (Korea) 10,918 12,680 (13.9) 10,420 4.8 HMI (India) 1,238 1,151 7.6 1,132 9.4 HAOS (Turkey) 768 739 3.9 677 13.4 HMMA (US) 1,824 1,747 4.4 1,726 5.7 HMMC (Czech) 1,327 1,452 (8.6) 1,270 4.5 HMMR (Russia) 363 621 (41.6) 366 (0.9) HMB (Brazil) 510 585 (12.8) 485 5.1 Others 466 (501) n.m. 459 1.5 Finance 2,597 2,782 (6.7) 2,885 (10.0)Others 1,736 1,497 16.0 1,523 14.0 COGS 17,223 17,911 (3.8) 16,611 3.7 Gross profit 4,523 4,842 (6.6) 4,332 4.4 GP margin (%) 20.8 21.3 - 20.7 -SG&A 2,870 2,755 4.2 2,744 4.6 Salary and Wage 652 715 (8.8) 787 (17.1) % to Revenue 3.0 3.1 - 3.8 - Marketing Expense 848 842 0.7 695 22.0 % to Revenue 3.9 3.7 - 3.3 - Warranty Provision 304 68 n.m. 215 41.6 % to Revenue 1.4 0.3 - 1.0 - Others 1,066 1,130 (5.7) 1,047 1.8 % to Revenue 4.9 5.0 - 5.0 -Operating profit 1,653 1,896 (12.8) 2,087 (20.8) 1,588 4.1 OP margin (%) 7.6 8.3 9.2 - 7.6 - Auto 1,567 1,670 (6.2) 1,208 29.7 OP Margin (%) 9.0 9.0 - 7.3 - Finance 244 267 (8.6) 264 (7.6) OP Margin (%) 9.4 9.6 - 9.2 - Others 69 64 8.5 35 n.m. OP Margin (%) 4.0 4.3 - 2.3 -Equity method gain 493 702 (29.8) 616 (20.0) Beijing Hyundai Motor Company
Recurring Profit 2,150 2,926 (26.5) 2,321 (7.4)Recurring Profit Margin (%) 9.9 12.9 - 11.1 -Tax 494.4 576.6 - 337.7 -Tax rate (%) 23.0 19.7 - 14.6 -Net profit 1,655 1,907 (13.2) 2,350 (29.6) 1,983 (16.5)NP margin (%) 7.6 8.3 10.3 - 9.5 -
Source: Company, Daiwa forecasts, Bloomberg
HMC: market share in China declining on aggressive penetration of local OEMs capturing new demand from Tier-II and Tier-III cities
Source: CAIN, Daiwa
HMC: market share decline in Korea, due to the stronger SUV line-up from Kia and imported brands
Source: Companies, Daiwa
HMC: market share decline in the US, due to HMC’s weaker SUV line-up vs. competitors
Source: Ward’s Auto, Daiwa
0
3
6
9
12
15
Jan-13 Apr-13 Jul-13 Oct-13 Jan-14 Apr-14 Jul-14 Oct-14 Jan-15 Apr-15
HMC Shanghai-VW FAW-VolkswagenShanghai-GM SAIC-GM-Wuling Chang'anGreat Wall
(%)
0
10
20
30
40
50
Jan-13 Apr-13 Jul-13 Oct-13 Jan-14 Apr-14 Jul-14 Oct-14 Jan-15 Apr-15
HMC KIA GM-Daewoo
Ssang Yong R-Samsung Imported Cars
(%)
0
5
10
15
20
Jan-13 Apr-13 Jul-13 Oct-13 Jan-14 Apr-14 Jul-14 Oct-14 Jan-15 Apr-15
FCA Ford GM Honda
Nissan Toyota HMC
(%)
Pan-Asia Autos 26 June 2015
- 57 -
HMC: earnings impact of new Tucson 2014 2015E 2016E[1] Global shipments ('000 units) 3,815 3,824 3,904[2] ASP ('000 KRW) 19,175 17,956 18,811HMC’s revenue: auto division ([1] x [2]) 72,308 70,542 75,440HMC's total revenue 89,256 88,261 94,599HMC's operating-profit (KRWbn) 7,550 6,828 7,538HMC's net profit (KRWbn) 7,649 6,490 6,851[3] Tucson shipments (incl. new Tucson) ('000 units) 520 536 630[4] Tucson ASP (incl. new Tucson) ('000 KRW) 18,428 18,608 19,467Revenue: Tucson (KRWbn) ([3] x [4]) 9,583 9,974 12,264Revenue impact from Tucson 10.74% 11.30% 12.96%[5] Operating profit margin from Tucson sales 9.00% 10.00% 11.00%Operating profit: Tucson (KRWbn) 862 997 1,349 Operating profit impact from Tucson 11.42% 14.61% 17.90%Net profit: Tucson (KRWbn) 853 1,097 1,349Net profit impact from Tucson (incl. New Tucson) 11.15% 16.90% 19.69%
Source: Company, Daiwa estimates
HMC: quarterly revenue, operating profit and operating-profit margin (1Q14-4Q15E)
Source: Company, Daiwa forecasts
HMC: key assumption changes to Daiwa’s target price Unit Previous NewDCF Discounted NPV value (KRWbn) 22,413 21,504PV terminal value (KRWbn) 28,723 26,777Net cash/(debt)* (KRWbn) (5,516) (5,516)Value of equity (KRWbn) 45,620 42,765No. of shares** (m shares) 285 285
Fair value (KRW) 159,802 149,802PER Target PER (x) 6.0 6.0Average of 2015-16E EPS forecasts (KRW) 23,366 23,366Fair value (KRW) 140,198 140,198
Target price (KRW) 150,000 145,000
Source: Daiwa estimates and forecasts
Note:*at end 2015E; ** fully diluted including preferred shares;
Our 12-month TP is based on the average of our DCF and PER-based methodologies
HMC: 12-month forward PER band
Source: Dataguide, Daiwa
HMC: 12-month forward PBR band
Source: Dataguide, Daiwa
Global OEMs: patent applications by smart-car feature
Source: KATS, KSA, Daiwa
Note: based on cumulative figures during 1980-2014
21,6
49
22,7
53
21,2
80
23,5
74
20,9
43
21,7
46
20,7
32
24,8
41
1,93
8
2,08
7
1,64
9
1,87
6
1,58
8
1,65
3
1,61
7
1,97
0
9.0 9.2
7.7 8.0 7.6 7.6 7.8 7.9
0
2
4
6
8
10
0
5,000
10,000
15,000
20,000
25,000
30,000
1Q14 2Q14 3Q14 4Q14 1Q15 2Q15E 3Q15E 4Q15E
Revenue Operating profit OPM (%) (RHS)
(KRWbn) (%)
5.6
4.5
5.5
6.5
7.5
8.5
9.5
10.5
Jan-
12
Mar
-12
May
-12
Jul-1
2
Sep-
12
Nov
-12
Jan-
13
Mar
-13
May
-13
Jul-1
3
Sep-
13
Nov
-13
Jan-
14
Mar
-14
May
-14
Jul-1
4
Sep-
14
Nov
-14
Jan-
15
Mar
-15
May
-15
12m fwd PER +1 STD +2 STD
-1 STD -2 STD Average
(x)
0.4 0.2
0.4
0.6
0.8
1.0
1.2
1.4Ja
n-12
Mar
-12
May
-12
Jul-1
2
Sep-
12
Nov
-12
Jan-
13
Mar
-13
May
-13
Jul-1
3
Sep-
13
Nov
-13
Jan-
14
Mar
-14
May
-14
Jul-1
4
Sep-
14
Nov
-14
Jan-
15
Mar
-15
May
-15
12m fwd PBR +1 STD +2 STD
-1 STD -2 STD Average
(x)
46
0
11
49 47
42
10
2425
14
0
38
11 13
0
35
27
0 0
12
0 0 0 0
52
1417
30
0 0 0
12
0
10
20
30
40
50
60
GM Ford Daimler Toyota Nissan Honda Mazda HMC
Autonomous driving ADAS Connectivity Infotainment
HMC filed a relatively fewer number of patent applications in major smart-car related areas (autonomous driving, connecitivity), vs. its global peers

Pan-Asia Autos 26 June 2015
- 58 -
See important disclosures, including any required research certifications, beginning on page 70
■ What's new Kia’s shares have outperformed HMC’s YTD, due we believe to its SUV-centric line-up (34% of 1Q15 shipments), which has triggered stronger global factory shipments vs. HMC. However, we now see more downside risks for Kia’s share price vs. HMC in 2H15. ■ What's the impact We are concerned about Kia’s possible downward revisions to its China factory shipment guidance of 745,000 units for 2015 (+15.3% YoY). Despite a more SUV-centric line-up than HMC, demand in China for Kia’s SUVs was only up 3% YoY to 59,600 units for the first 5 months of 2015, vs. the industry’s 2.24m units (+50% YoY). Considering the China OEMs’ wider range of product offerings and stronger value proposition (20-25% cheaper than Kia’s SUVs), we do not expect Kia’s shipments in China to rise over the rest of 2015. Additionally, we think Kia’s labour union stands a fair chance of
winning the first court case, scheduled for 4Q15, over the “reclassification of ordinary wages”, as, unlike HMC, there is no clause in Kia’s staff manual that indicates the need for staff to work 15 days a month in order to be eligible for a regular bonus. Furthermore, we expect Kia’s US (47% of 1Q15 revenue) incentives to start rising from 3Q15 before the launch of the new K5, offsetting the positives from the product-mix improvement. ■ What we recommend Factoring in: 1) the abovementioned factors, 2) lower shipments and ASPs vs. our previous forecasts, and 3) higher marketing and labour costs, we lower our 2015-17E EPS by 9.1%, 10.8% and 11.3%, respectively. Considering Kia’s weaker competitive advantage in smart cars, we lower our DCF/PER-based 12-month target price to KRW43,000 (from KRW47,000). We maintain our Hold (3) rating, as we expect the company to enter a cyclical upturn in 2016 with the resumption of its new product cycle from 3Q15, fuelled by the launch of volume sellers such as the K5 (10.6% of 2014 shipments) in July and the Sportage (16.0% of 2014 shipments) in October. Key upside/downside risks to our call: a sharp depreciation/ appreciation in the KRW vs. the USD, JPY and Euro.
■ How we differ We are below consensus on 2015-17E EPS, given our lower shipments, ASP and earnings forecasts in China.
Consumer Discretionary / Korea000270 KS
26 June 2015
Kia Motors
Too early to shift up a gear
• Kia has outperformed HMC YTD with its SUV-centric line-up • However, we foresee downside risks becoming more apparent
from 2H15 given its more stretched valuation vs. HMC • Maintain Hold (3); lower TP to KRW43,000 on downward
earnings revisions and on weak market share in smart cars
Source: Daiwa forecasts
Source: FactSet, Daiwa forecasts
Consumer Discretionary / Korea
Kia Motors000270 KS
Target (KRW): 47,000 43,000Downside: 6.4%25 Jun price (KRW): 45,950
BuyOutperformHold (unchanged)
UnderperformSell
1
2
3
4
5
Forecast revisions (%)Year to 31 Dec 15E 16E 17ERevenue change (1.2) (3.4) (3.1)Net profit change (9.1) (10.8) (11.3)Core EPS (FD) change (9.1) (10.8) (11.3)
75
84
93
101
110
40,000
46,250
52,500
58,750
65,000
Jun-14 Sep-14 Dec-14 Mar-15 Jun-15
Share price performance
Kia Motor (LHS) Relative to KOSPI (RHS)
(KRW) (%)
12-month range 43,050-62,300Market cap (USDbn) 16.783m avg daily turnover (USDm) 54.61Shares outstanding (m) 405Major shareholder Hyundai Motor (33.9%)
Financial summary (KRW)Year to 31 Dec 15E 16E 17ERevenue (bn) 46,883 49,204 51,323Operating profit (bn) 2,191 2,456 2,613Net profit (bn) 2,689 2,854 2,985Core EPS (fully-diluted) 6,633 7,040 7,363EPS change (%) (10.2) 6.1 4.6Daiwa vs Cons. EPS (%) (13.7) (15.4) (18.1)PER (x) 6.9 6.5 6.2Dividend yield (%) 2.4 2.6 2.8DPS 1,100 1,200 1,300PBR (x) 0.7 0.7 0.6EV/EBITDA (x) 4.2 3.7 3.3ROE (%) 11.3 10.9 10.4
Sung Yop Chung(82) 2 787 [email protected]
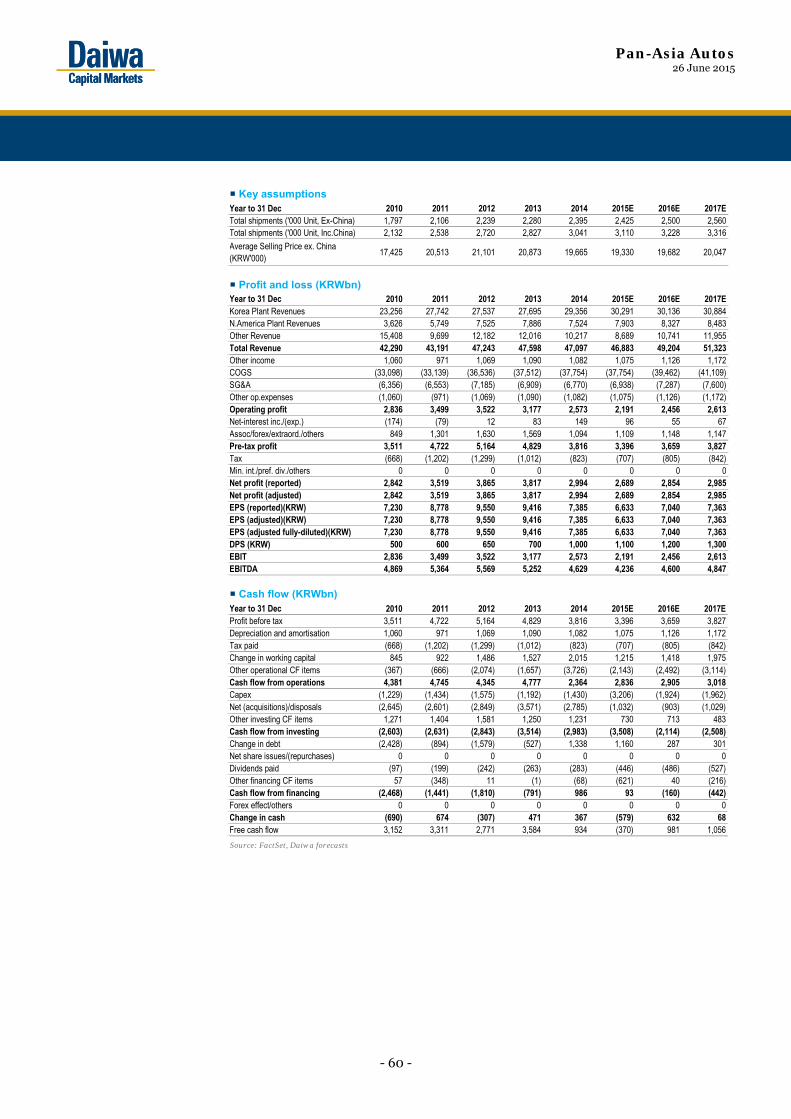
Pan-Asia Autos 26 June 2015
- 60 -
Key assumptions
Profit and loss (KRWbn)
Cash flow (KRWbn)
Source: FactSet, Daiwa forecasts
Year to 31 Dec 2010 2011 2012 2013 2014 2015E 2016E 2017ETotal shipments ('000 Unit, Ex-China) 1,797 2,106 2,239 2,280 2,395 2,425 2,500 2,560Total shipments ('000 Unit, Inc.China) 2,132 2,538 2,720 2,827 3,041 3,110 3,228 3,316
Average Selling Price ex. China (KRW'000)
17,425 20,513 21,101 20,873 19,665 19,330 19,682 20,047
Year to 31 Dec 2010 2011 2012 2013 2014 2015E 2016E 2017EKorea Plant Revenues 23,256 27,742 27,537 27,695 29,356 30,291 30,136 30,884N.America Plant Revenues 3,626 5,749 7,525 7,886 7,524 7,903 8,327 8,483Other Revenue 15,408 9,699 12,182 12,016 10,217 8,689 10,741 11,955Total Revenue 42,290 43,191 47,243 47,598 47,097 46,883 49,204 51,323Other income 1,060 971 1,069 1,090 1,082 1,075 1,126 1,172COGS (33,098) (33,139) (36,536) (37,512) (37,754) (37,754) (39,462) (41,109)SG&A (6,356) (6,553) (7,185) (6,909) (6,770) (6,938) (7,287) (7,600)Other op.expenses (1,060) (971) (1,069) (1,090) (1,082) (1,075) (1,126) (1,172)Operating profit 2,836 3,499 3,522 3,177 2,573 2,191 2,456 2,613Net-interest inc./(exp.) (174) (79) 12 83 149 96 55 67Assoc/forex/extraord./others 849 1,301 1,630 1,569 1,094 1,109 1,148 1,147Pre-tax profit 3,511 4,722 5,164 4,829 3,816 3,396 3,659 3,827Tax (668) (1,202) (1,299) (1,012) (823) (707) (805) (842)Min. int./pref. div./others 0 0 0 0 0 0 0 0Net profit (reported) 2,842 3,519 3,865 3,817 2,994 2,689 2,854 2,985Net profit (adjusted) 2,842 3,519 3,865 3,817 2,994 2,689 2,854 2,985EPS (reported)(KRW) 7,230 8,778 9,550 9,416 7,385 6,633 7,040 7,363EPS (adjusted)(KRW) 7,230 8,778 9,550 9,416 7,385 6,633 7,040 7,363EPS (adjusted fully-diluted)(KRW) 7,230 8,778 9,550 9,416 7,385 6,633 7,040 7,363DPS (KRW) 500 600 650 700 1,000 1,100 1,200 1,300EBIT 2,836 3,499 3,522 3,177 2,573 2,191 2,456 2,613EBITDA 4,869 5,364 5,569 5,252 4,629 4,236 4,600 4,847
Year to 31 Dec 2010 2011 2012 2013 2014 2015E 2016E 2017EProfit before tax 3,511 4,722 5,164 4,829 3,816 3,396 3,659 3,827Depreciation and amortisation 1,060 971 1,069 1,090 1,082 1,075 1,126 1,172Tax paid (668) (1,202) (1,299) (1,012) (823) (707) (805) (842)Change in working capital 845 922 1,486 1,527 2,015 1,215 1,418 1,975Other operational CF items (367) (666) (2,074) (1,657) (3,726) (2,143) (2,492) (3,114)Cash flow from operations 4,381 4,745 4,345 4,777 2,364 2,836 2,905 3,018Capex (1,229) (1,434) (1,575) (1,192) (1,430) (3,206) (1,924) (1,962)Net (acquisitions)/disposals (2,645) (2,601) (2,849) (3,571) (2,785) (1,032) (903) (1,029)Other investing CF items 1,271 1,404 1,581 1,250 1,231 730 713 483Cash flow from investing (2,603) (2,631) (2,843) (3,514) (2,983) (3,508) (2,114) (2,508)Change in debt (2,428) (894) (1,579) (527) 1,338 1,160 287 301Net share issues/(repurchases) 0 0 0 0 0 0 0 0Dividends paid (97) (199) (242) (263) (283) (446) (486) (527)Other financing CF items 57 (348) 11 (1) (68) (621) 40 (216)Cash flow from financing (2,468) (1,441) (1,810) (791) 986 93 (160) (442)Forex effect/others 0 0 0 0 0 0 0 0Change in cash (690) 674 (307) 471 367 (579) 632 68Free cash flow 3,152 3,311 2,771 3,584 934 (370) 981 1,056
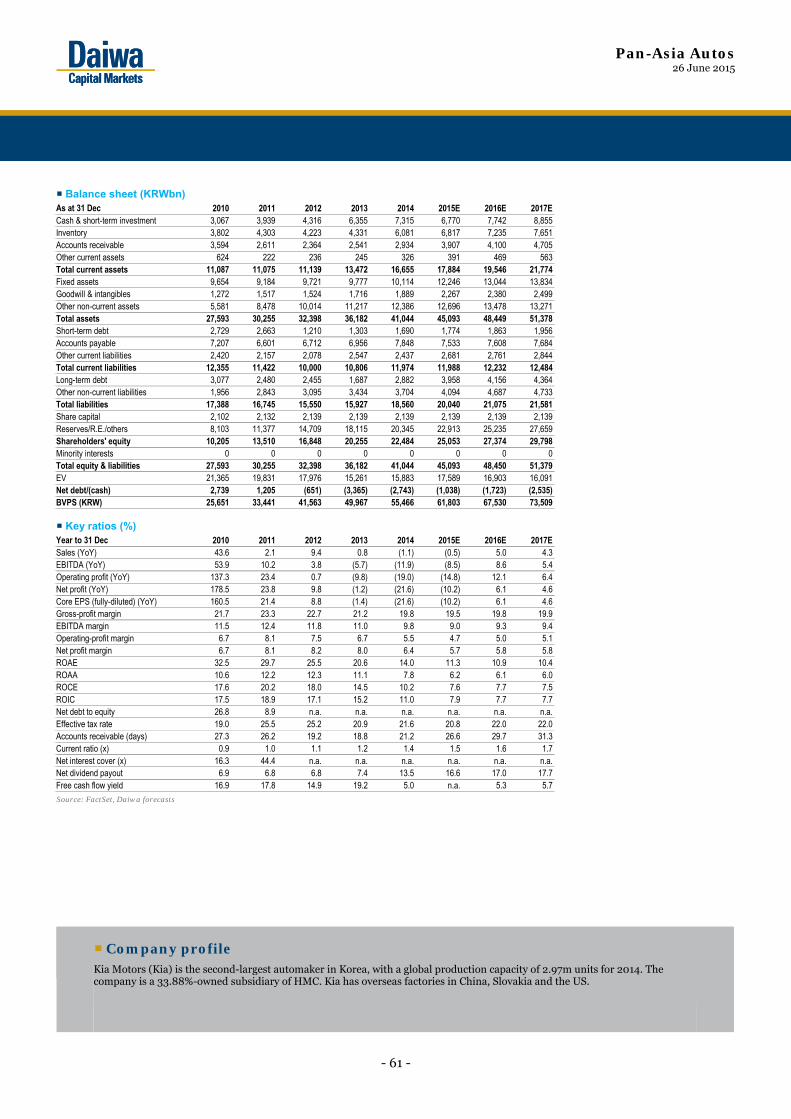
Pan-Asia Autos 26 June 2015
- 61 -
Balance sheet (KRWbn)
Key ratios (%)
Source: FactSet, Daiwa forecasts
Company profile
Kia Motors (Kia) is the second-largest automaker in Korea, with a global production capacity of 2.97m units for 2014. The company is a 33.88%-owned subsidiary of HMC. Kia has overseas factories in China, Slovakia and the US.
As at 31 Dec 2010 2011 2012 2013 2014 2015E 2016E 2017ECash & short-term investment 3,067 3,939 4,316 6,355 7,315 6,770 7,742 8,855Inventory 3,802 4,303 4,223 4,331 6,081 6,817 7,235 7,651Accounts receivable 3,594 2,611 2,364 2,541 2,934 3,907 4,100 4,705Other current assets 624 222 236 245 326 391 469 563Total current assets 11,087 11,075 11,139 13,472 16,655 17,884 19,546 21,774Fixed assets 9,654 9,184 9,721 9,777 10,114 12,246 13,044 13,834Goodwill & intangibles 1,272 1,517 1,524 1,716 1,889 2,267 2,380 2,499Other non-current assets 5,581 8,478 10,014 11,217 12,386 12,696 13,478 13,271Total assets 27,593 30,255 32,398 36,182 41,044 45,093 48,449 51,378Short-term debt 2,729 2,663 1,210 1,303 1,690 1,774 1,863 1,956Accounts payable 7,207 6,601 6,712 6,956 7,848 7,533 7,608 7,684Other current liabilities 2,420 2,157 2,078 2,547 2,437 2,681 2,761 2,844Total current liabilities 12,355 11,422 10,000 10,806 11,974 11,988 12,232 12,484Long-term debt 3,077 2,480 2,455 1,687 2,882 3,958 4,156 4,364Other non-current liabilities 1,956 2,843 3,095 3,434 3,704 4,094 4,687 4,733Total liabilities 17,388 16,745 15,550 15,927 18,560 20,040 21,075 21,581Share capital 2,102 2,132 2,139 2,139 2,139 2,139 2,139 2,139Reserves/R.E./others 8,103 11,377 14,709 18,115 20,345 22,913 25,235 27,659Shareholders' equity 10,205 13,510 16,848 20,255 22,484 25,053 27,374 29,798Minority interests 0 0 0 0 0 0 0 0Total equity & liabilities 27,593 30,255 32,398 36,182 41,044 45,093 48,450 51,379EV 21,365 19,831 17,976 15,261 15,883 17,589 16,903 16,091Net debt/(cash) 2,739 1,205 (651) (3,365) (2,743) (1,038) (1,723) (2,535)BVPS (KRW) 25,651 33,441 41,563 49,967 55,466 61,803 67,530 73,509
Year to 31 Dec 2010 2011 2012 2013 2014 2015E 2016E 2017ESales (YoY) 43.6 2.1 9.4 0.8 (1.1) (0.5) 5.0 4.3EBITDA (YoY) 53.9 10.2 3.8 (5.7) (11.9) (8.5) 8.6 5.4Operating profit (YoY) 137.3 23.4 0.7 (9.8) (19.0) (14.8) 12.1 6.4Net profit (YoY) 178.5 23.8 9.8 (1.2) (21.6) (10.2) 6.1 4.6Core EPS (fully-diluted) (YoY) 160.5 21.4 8.8 (1.4) (21.6) (10.2) 6.1 4.6Gross-profit margin 21.7 23.3 22.7 21.2 19.8 19.5 19.8 19.9EBITDA margin 11.5 12.4 11.8 11.0 9.8 9.0 9.3 9.4Operating-profit margin 6.7 8.1 7.5 6.7 5.5 4.7 5.0 5.1Net profit margin 6.7 8.1 8.2 8.0 6.4 5.7 5.8 5.8ROAE 32.5 29.7 25.5 20.6 14.0 11.3 10.9 10.4ROAA 10.6 12.2 12.3 11.1 7.8 6.2 6.1 6.0ROCE 17.6 20.2 18.0 14.5 10.2 7.6 7.7 7.5ROIC 17.5 18.9 17.1 15.2 11.0 7.9 7.7 7.7Net debt to equity 26.8 8.9 n.a. n.a. n.a. n.a. n.a. n.a.Effective tax rate 19.0 25.5 25.2 20.9 21.6 20.8 22.0 22.0Accounts receivable (days) 27.3 26.2 19.2 18.8 21.2 26.6 29.7 31.3Current ratio (x) 0.9 1.0 1.1 1.2 1.4 1.5 1.6 1.7Net interest cover (x) 16.3 44.4 n.a. n.a. n.a. n.a. n.a. n.a.Net dividend payout 6.9 6.8 6.8 7.4 13.5 16.6 17.0 17.7Free cash flow yield 16.9 17.8 14.9 19.2 5.0 n.a. 5.3 5.7
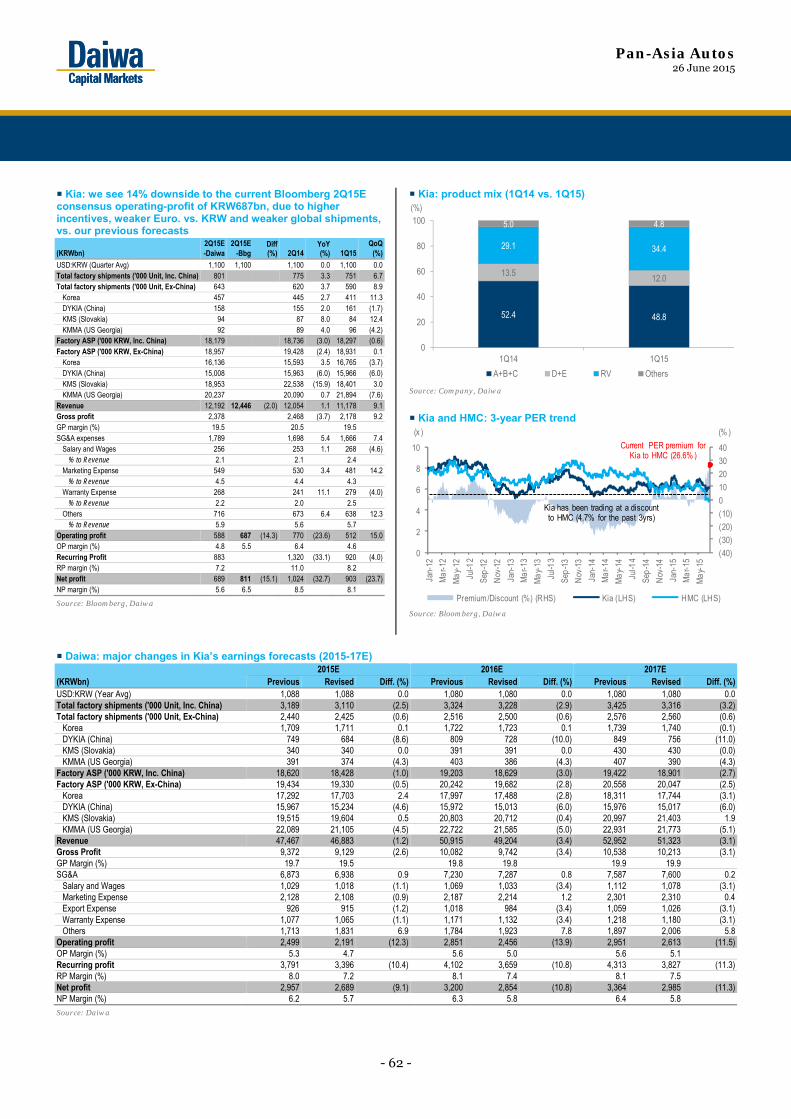
Pan-Asia Autos 26 June 2015
- 62 -
Kia: we see 14% downside to the current Bloomberg 2Q15E consensus operating-profit of KRW687bn, due to higher incentives, weaker Euro. vs. KRW and weaker global shipments, vs. our previous forecasts
(KRWbn) 2Q15E -Daiwa
2Q15E -Bbg
Diff (%) 2Q14
YoY (%) 1Q15
QoQ(%)
USD:KRW (Quarter Avg) 1,100 1,100 1,100 0.0 1,100 0.0 Total factory shipments ('000 Unit, Inc. China) 801 775 3.3 751 6.7 Total factory shipments ('000 Unit, Ex-China) 643 620 3.7 590 8.9
Korea 457 445 2.7 411 11.3 DYKIA (China) 158 155 2.0 161 (1.7)KMS (Slovakia) 94 87 8.0 84 12.4 KMMA (US Georgia) 92 89 4.0 96 (4.2)
Factory ASP ('000 KRW, Inc. China) 18,179 18,736 (3.0) 18,297 (0.6)Factory ASP ('000 KRW, Ex-China) 18,957 19,428 (2.4) 18,931 0.1
Korea 16,136 15,593 3.5 16,765 (3.7)DYKIA (China) 15,008 15,963 (6.0) 15,966 (6.0)KMS (Slovakia) 18,953 22,538 (15.9) 18,401 3.0 KMMA (US Georgia) 20,237 20,090 0.7 21,894 (7.6)
Revenue 12,192 12,446 (2.0) 12,054 1.1 11,178 9.1 Gross profit 2,378 2,468 (3.7) 2,178 9.2 GP margin (%) 19.5 20.5 19.5 SG&A expenses 1,789 1,698 5.4 1,666 7.4
Salary and Wages 256 253 1.1 268 (4.6)% to Revenue 2.1 2.1 2.4
Marketing Expense 549 530 3.4 481 14.2 % to Revenue 4.5 4.4 4.3
Warranty Expense 268 241 11.1 279 (4.0)% to Revenue 2.2 2.0 2.5
Others 716 673 6.4 638 12.3 % to Revenue 5.9 5.6 5.7
Operating profit 588 687 (14.3) 770 (23.6) 512 15.0 OP margin (%) 4.8 5.5 6.4 4.6Recurring Profit 883 1,320 (33.1) 920 (4.0)RP margin (%) 7.2 11.0 8.2Net profit 689 811 (15.1) 1,024 (32.7) 903 (23.7)NP margin (%) 5.6 6.5 8.5 8.1
Source: Bloomberg, Daiwa
Kia: product mix (1Q14 vs. 1Q15)
Source: Company, Daiwa
Kia and HMC: 3-year PER trend
Source: Bloomberg, Daiwa
Daiwa: major changes in Kia’s earnings forecasts (2015-17E)
2015E 2016E 2017E (KRWbn) Previous Revised Diff. (%) Previous Revised Diff. (%) Previous Revised Diff. (%)USD:KRW (Year Avg) 1,088 1,088 0.0 1,080 1,080 0.0 1,080 1,080 0.0Total factory shipments ('000 Unit, Inc. China) 3,189 3,110 (2.5) 3,324 3,228 (2.9) 3,425 3,316 (3.2)Total factory shipments ('000 Unit, Ex-China) 2,440 2,425 (0.6) 2,516 2,500 (0.6) 2,576 2,560 (0.6)
Korea 1,709 1,711 0.1 1,722 1,723 0.1 1,739 1,740 (0.1)DYKIA (China) 749 684 (8.6) 809 728 (10.0) 849 756 (11.0)KMS (Slovakia) 340 340 0.0 391 391 0.0 430 430 (0.0)KMMA (US Georgia) 391 374 (4.3) 403 386 (4.3) 407 390 (4.3)
Factory ASP ('000 KRW, Inc. China) 18,620 18,428 (1.0) 19,203 18,629 (3.0) 19,422 18,901 (2.7)Factory ASP ('000 KRW, Ex-China) 19,434 19,330 (0.5) 20,242 19,682 (2.8) 20,558 20,047 (2.5)
Korea 17,292 17,703 2.4 17,997 17,488 (2.8) 18,311 17,744 (3.1)DYKIA (China) 15,967 15,234 (4.6) 15,972 15,013 (6.0) 15,976 15,017 (6.0)KMS (Slovakia) 19,515 19,604 0.5 20,803 20,712 (0.4) 20,997 21,403 1.9KMMA (US Georgia) 22,089 21,105 (4.5) 22,722 21,585 (5.0) 22,931 21,773 (5.1)
Revenue 47,467 46,883 (1.2) 50,915 49,204 (3.4) 52,952 51,323 (3.1)Gross Profit 9,372 9,129 (2.6) 10,082 9,742 (3.4) 10,538 10,213 (3.1)GP Margin (%) 19.7 19.5 19.8 19.8 19.9 19.9SG&A 6,873 6,938 0.9 7,230 7,287 0.8 7,587 7,600 0.2
Salary and Wages 1,029 1,018 (1.1) 1,069 1,033 (3.4) 1,112 1,078 (3.1)Marketing Expense 2,128 2,108 (0.9) 2,187 2,214 1.2 2,301 2,310 0.4Export Expense 926 915 (1.2) 1,018 984 (3.4) 1,059 1,026 (3.1)Warranty Expense 1,077 1,065 (1.1) 1,171 1,132 (3.4) 1,218 1,180 (3.1)Others 1,713 1,831 6.9 1,784 1,923 7.8 1,897 2,006 5.8
Operating profit 2,499 2,191 (12.3) 2,851 2,456 (13.9) 2,951 2,613 (11.5)OP Margin (%) 5.3 4.7 5.6 5.0 5.6 5.1Recurring profit 3,791 3,396 (10.4) 4,102 3,659 (10.8) 4,313 3,827 (11.3)RP Margin (%) 8.0 7.2 8.1 7.4 8.1 7.5Net profit 2,957 2,689 (9.1) 3,200 2,854 (10.8) 3,364 2,985 (11.3)NP Margin (%) 6.2 5.7 6.3 5.8 6.4 5.8
Source: Daiwa
52.4 48.8
13.5 12.0
29.1 34.4
5.0 4.8
0
20
40
60
80
100
1Q14 1Q15
A+B+C D+E RV Others
(%)
(40)
(30)
(20)
(10)
0
10
20
30
40
0
2
4
6
8
10
Jan-
12
Mar
-12
May
-12
Jul-1
2
Sep-
12
Nov
-12
Jan-
13
Mar
-13
May
-13
Jul-1
3
Sep-
13
Nov
-13
Jan-
14
Mar
-14
May
-14
Jul-1
4
Sep-
14
Nov
-14
Jan-
15
Mar
-15
May
-15
Premium/Discount (%) (RHS) Kia (LHS) HMC (LHS)
(x ) (% )
Kia has been trading at a discount to HMC (4.7% for the past 3yrs)
Current PER premium for Kia to HMC (26.6% )
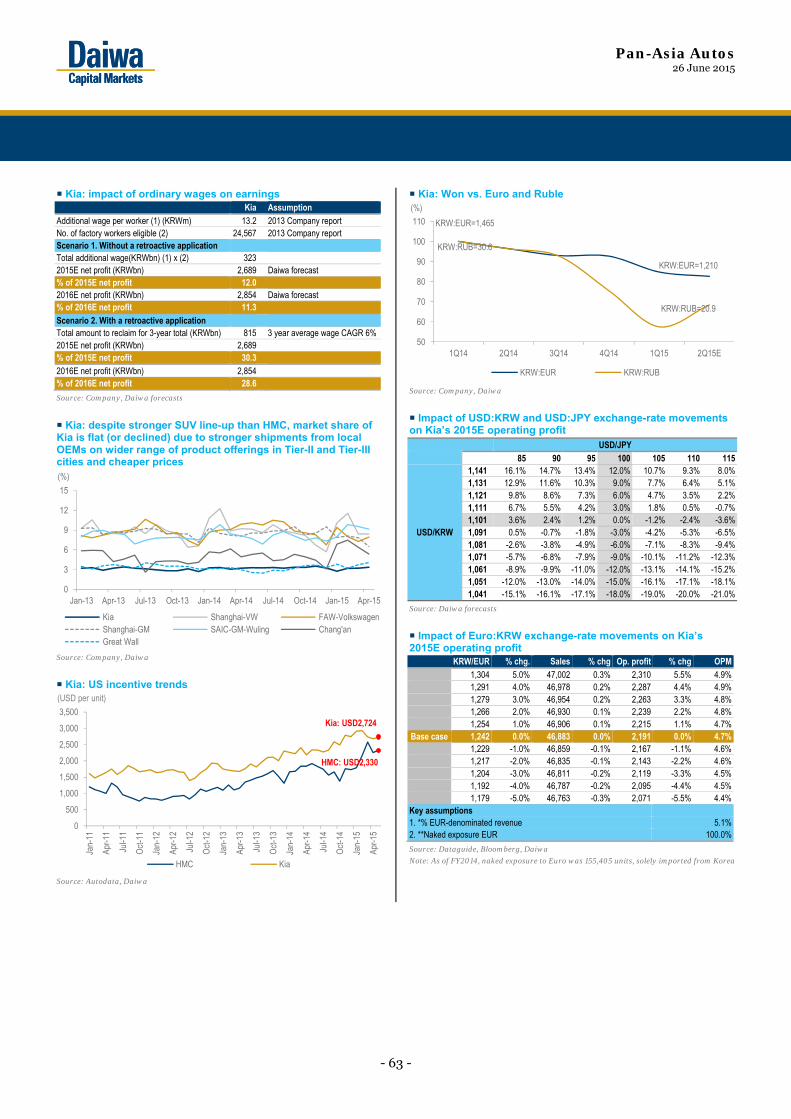
Pan-Asia Autos 26 June 2015
- 63 -
Kia: impact of ordinary wages on earnings Kia Assumption
Additional wage per worker (1) (KRWm) 13.2 2013 Company report No. of factory workers eligible (2) 24,567 2013 Company report Scenario 1. Without a retroactive application Total additional wage(KRWbn) (1) x (2) 323 2015E net profit (KRWbn) 2,689 Daiwa forecast % of 2015E net profit 12.0 2016E net profit (KRWbn) 2,854 Daiwa forecast % of 2016E net profit 11.3 Scenario 2. With a retroactive application Total amount to reclaim for 3-year total (KRWbn) 815 3 year average wage CAGR 6% 2015E net profit (KRWbn) 2,689 % of 2015E net profit 30.3 2016E net profit (KRWbn) 2,854 % of 2016E net profit 28.6
Source: Company, Daiwa forecasts
Kia: despite stronger SUV line-up than HMC, market share of Kia is flat (or declined) due to stronger shipments from local OEMs on wider range of product offerings in Tier-II and Tier-III cities and cheaper prices
Source: Company, Daiwa
Kia: US incentive trends
Source: Autodata, Daiwa
Kia: Won vs. Euro and Ruble
Source: Company, Daiwa
Impact of USD:KRW and USD:JPY exchange-rate movements on Kia’s 2015E operating profit USD/JPY 85 90 95 100 105 110 115
USD/KRW
1,141 16.1% 14.7% 13.4% 12.0% 10.7% 9.3% 8.0%1,131 12.9% 11.6% 10.3% 9.0% 7.7% 6.4% 5.1%1,121 9.8% 8.6% 7.3% 6.0% 4.7% 3.5% 2.2%1,111 6.7% 5.5% 4.2% 3.0% 1.8% 0.5% -0.7%1,101 3.6% 2.4% 1.2% 0.0% -1.2% -2.4% -3.6%1,091 0.5% -0.7% -1.8% -3.0% -4.2% -5.3% -6.5%1,081 -2.6% -3.8% -4.9% -6.0% -7.1% -8.3% -9.4%1,071 -5.7% -6.8% -7.9% -9.0% -10.1% -11.2% -12.3%1,061 -8.9% -9.9% -11.0% -12.0% -13.1% -14.1% -15.2%1,051 -12.0% -13.0% -14.0% -15.0% -16.1% -17.1% -18.1%1,041 -15.1% -16.1% -17.1% -18.0% -19.0% -20.0% -21.0%
Source: Daiwa forecasts
Impact of Euro:KRW exchange-rate movements on Kia’s 2015E operating profit
KRW/EUR % chg. Sales % chg Op. profit % chg OPM1,304 5.0% 47,002 0.3% 2,310 5.5% 4.9%1,291 4.0% 46,978 0.2% 2,287 4.4% 4.9%1,279 3.0% 46,954 0.2% 2,263 3.3% 4.8%1,266 2.0% 46,930 0.1% 2,239 2.2% 4.8%1,254 1.0% 46,906 0.1% 2,215 1.1% 4.7%
Base case 1,242 0.0% 46,883 0.0% 2,191 0.0% 4.7%1,229 -1.0% 46,859 -0.1% 2,167 -1.1% 4.6%1,217 -2.0% 46,835 -0.1% 2,143 -2.2% 4.6%1,204 -3.0% 46,811 -0.2% 2,119 -3.3% 4.5%1,192 -4.0% 46,787 -0.2% 2,095 -4.4% 4.5%1,179 -5.0% 46,763 -0.3% 2,071 -5.5% 4.4%
Key assumptions 1. *% EUR-denominated revenue 5.1%2. **Naked exposure EUR 100.0%
Source: Dataguide, Bloomberg, Daiwa
Note: As of FY2014, naked exposure to Euro was 155,405 units, solely imported from Korea
0
3
6
9
12
15
Jan-13 Apr-13 Jul-13 Oct-13 Jan-14 Apr-14 Jul-14 Oct-14 Jan-15 Apr-15
Kia Shanghai-VW FAW-VolkswagenShanghai-GM SAIC-GM-Wuling Chang'anGreat Wall
(%)
0
500
1,000
1,500
2,000
2,500
3,000
3,500
Jan-
11
Apr-1
1
Jul-1
1
Oct
-11
Jan-
12
Apr-1
2
Jul-1
2
Oct
-12
Jan-
13
Apr-1
3
Jul-1
3
Oct
-13
Jan-
14
Apr-1
4
Jul-1
4
Oct
-14
Jan-
15
Apr-1
5
HMC Kia
(USD per unit)
Kia: USD2,724
HMC: USD2,330
50
60
70
80
90
100
110
1Q14 2Q14 3Q14 4Q14 1Q15 2Q15E
KRW:EUR KRW:RUB
(%)
KRW:EUR=1,210
KRW:RUB=20.9
KRW:EUR=1,465
KRW:RUB=30.6
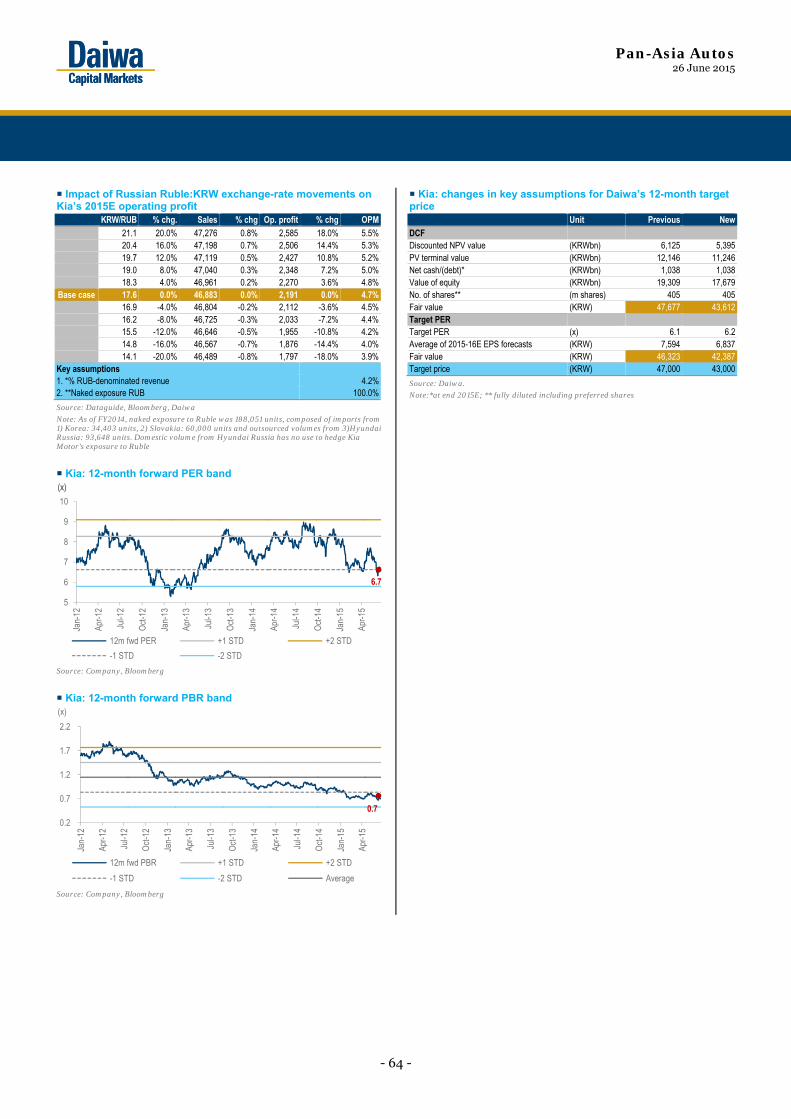
Pan-Asia Autos 26 June 2015
- 64 -
Impact of Russian Ruble:KRW exchange-rate movements on Kia’s 2015E operating profit
KRW/RUB % chg. Sales % chg Op. profit % chg OPM
21.1 20.0% 47,276 0.8% 2,585 18.0% 5.5%20.4 16.0% 47,198 0.7% 2,506 14.4% 5.3%19.7 12.0% 47,119 0.5% 2,427 10.8% 5.2%19.0 8.0% 47,040 0.3% 2,348 7.2% 5.0%18.3 4.0% 46,961 0.2% 2,270 3.6% 4.8%
Base case 17.6 0.0% 46,883 0.0% 2,191 0.0% 4.7%16.9 -4.0% 46,804 -0.2% 2,112 -3.6% 4.5%16.2 -8.0% 46,725 -0.3% 2,033 -7.2% 4.4%15.5 -12.0% 46,646 -0.5% 1,955 -10.8% 4.2%14.8 -16.0% 46,567 -0.7% 1,876 -14.4% 4.0%14.1 -20.0% 46,489 -0.8% 1,797 -18.0% 3.9%
Key assumptions 1. *% RUB-denominated revenue 4.2%2. **Naked exposure RUB 100.0%
Source: Dataguide, Bloomberg, Daiwa
Note: As of FY2014, naked exposure to Ruble was 188,051 units, composed of imports from 1) Korea: 34,403 units, 2) Slovakia: 60,000 units and outsourced volumes from 3)Hyundai Russia: 93,648 units. Domestic volume from Hyundai Russia has no use to hedge Kia Motor's exposure to Ruble
Kia: 12-month forward PER band
Source: Company, Bloomberg
Kia: 12-month forward PBR band
Source: Company, Bloomberg
Kia: changes in key assumptions for Daiwa’s 12-month target price Unit Previous New
DCF Discounted NPV value (KRWbn) 6,125 5,395PV terminal value (KRWbn) 12,146 11,246Net cash/(debt)* (KRWbn) 1,038 1,038Value of equity (KRWbn) 19,309 17,679No. of shares** (m shares) 405 405Fair value (KRW) 47,677 43,612Target PER Target PER (x) 6.1 6.2Average of 2015-16E EPS forecasts (KRW) 7,594 6,837Fair value (KRW) 46,323 42,387Target price (KRW) 47,000 43,000
Source: Daiwa.
Note:*at end 2015E; ** fully diluted including preferred shares
5
6
7
8
9
10
Jan-
12
Apr-1
2
Jul-1
2
Oct
-12
Jan-
13
Apr-1
3
Jul-1
3
Oct
-13
Jan-
14
Apr-1
4
Jul-1
4
Oct
-14
Jan-
15
Apr-1
5
12m fwd PER +1 STD +2 STD
-1 STD -2 STD
(x)(x)
6.7
0.7
0.2
0.7
1.2
1.7
2.2
Jan-
12
Apr-1
2
Jul-1
2
Oct
-12
Jan-
13
Apr-1
3
Jul-1
3
Oct
-13
Jan-
14
Apr-1
4
Jul-1
4
Oct
-14
Jan-
15
Apr-1
5
12m fwd PBR +1 STD +2 STD
-1 STD -2 STD Average
(x)

Pan-Asia Autos 26 June 2015
- 65 -
Pan-Asia Autos 26 June 2015
- 66 -
Daiwa’s Asia Pacific Research Directory
HONG KONG
Takashi FUJIKURA (852) 2848 4051 [email protected] Regional Research Head
Kosuke MIZUNO (852) 2848 4949 / (852) 2773 8273
Regional Research Co-head
John HETHERINGTON (852) 2773 8787 [email protected] Regional Deputy Head of Asia Pacific Research
Rohan DALZIELL (852) 2848 4938 [email protected] Regional Head of Product Management
Kevin LAI (852) 2848 4926 [email protected] Chief Economist for Asia ex-Japan; Macro Economics (Regional)
Christie CHIEN (852) 2848 4482 [email protected] Macro Economics (Regional); Banking; Insurance (Taiwan)
Junjie TANG (852) 2773 8736 [email protected] Macro Economics (China)
Jonas KAN (852) 2848 4439 [email protected] Head of Hong Kong and China Property
Cynthia CHAN (852) 2773 8243 [email protected] Property (China)
Leon QI (852) 2532 4381 [email protected] Banking (Hong Kong/China); Broker (China); Insurance (China)
Anson CHAN (852) 2532 4350 [email protected] Consumer (Hong Kong/China) Jamie SOO (852) 2773 8529 [email protected] Gaming and Leisure (Hong Kong/China) Dennis IP (852) 2848 4068 [email protected] Power; Utilities; Renewables and Environment (Hong Kong/China) John CHOI (852) 2773 8730 [email protected] Head of Hong Kong and China Internet; Regional Head of Small/Mid Cap
Becky HAN (852) 2848 4464 [email protected] Small/Mid Cap (Regional)
Kelvin LAU (852) 2848 4467 [email protected] Head of Transportation (Hong Kong/China); Transportation (Regional)
Brian LAM (852) 2532 4341 [email protected] Transportation – Aviation (Hong Kong/China); Railway; Construction and Engineering (China)
Jibo MA (852) 2848 4489 [email protected] Head of Custom Products Group
Thomas HO (852) 2773 8716 [email protected] Custom Products Group
PHILIPPINES
Bianca SOLEMA (63) 2 737 3023 [email protected] Utilities and Energy
SOUTH KOREA
Sung Yop CHUNG (82) 2 787 9157 [email protected] Pan-Asia Co-head/Regional Head of Automobiles and Components; Automobiles; Shipbuilding; Steel
Mike OH (82) 2 787 9179 [email protected] Banking; Capital Goods (Construction and Machinery)
Iris PARK (82) 2 787 9165 [email protected] Consumer/Retail
Jun Yong BANG (82) 2 787 9168 [email protected] Oil; Chemicals; Tyres
Thomas Y KWON (82) 2 787 9181 [email protected] Pan-Asia Head of Internet & Telecommunications; Software – Internet/On-line Game
TAIWAN
Rick HSU (886) 2 8758 6261 [email protected] Head of Regional Technology; Head of Taiwan Research; Semiconductor/IC Design (Regional)
Steven TSENG (886) 2 8758 6252 [email protected] IT/Technology Hardware (PC Hardware)
Christine WANG (886) 2 8758 6249 [email protected] IT/Technology Hardware (Automation); Pharmaceuticals and Healthcare; Consumer
Kylie HUANG (886) 2 8758 6248 [email protected] IT/Technology Hardware (Handsets and Components)
Helen CHIEN (886) 2 8758 6254 [email protected] Small/Mid Cap
INDIA
Punit SRIVASTAVA (91) 22 6622 1013 [email protected] Head of India Research; Strategy; Banking/Finance Saurabh MEHTA (91) 22 6622 1009 [email protected] Capital Goods; Utilities
SINGAPORE
Ramakrishna MARUVADA (65) 6499 6543 [email protected] Head of Singapore Research; Telecommunications (China/ASEAN/India)
Royston TAN (65) 6321 3086 [email protected] Oil and Gas; Capital Goods
David LUM (65) 6329 2102 [email protected] Property and REITs
Jame OSMAN (65) 6321 3092 [email protected] Telecommunications (ASEAN/India); Pharmaceuticals and Healthcare; Consumer (Singapore)
Pan-Asia Autos 26 June 2015
- 67 -
Daiwa’s Offices
Office / Branch / Affiliate Address Tel Fax
DAIWA SECURITIES GROUP INC
HEAD OFFICE Gran Tokyo North Tower, 1-9-1, Marunouchi, Chiyoda-ku, Tokyo, 100-6753 (81) 3 5555 3111 (81) 3 5555 0661
Daiwa Securities Trust Company One Evertrust Plaza, Jersey City, NJ 07302, U.S.A. (1) 201 333 7300 (1) 201 333 7726
Daiwa Securities Trust and Banking (Europe) PLC (Head Office) 5 King William Street, London EC4N 7JB, United Kingdom (44) 207 320 8000 (44) 207 410 0129
Daiwa Europe Trustees (Ireland) Ltd Level 3, Block 5, Harcourt Centre, Harcourt Road, Dublin 2, Ireland (353) 1 603 9900 (353) 1 478 3469
Daiwa Capital Markets America Inc. New York Head Office Financial Square, 32 Old Slip, New York, NY10005, U.S.A. (1) 212 612 7000 (1) 212 612 7100
Daiwa Capital Markets America Inc. San Francisco Branch 555 California Street, Suite 3360, San Francisco, CA 94104, U.S.A. (1) 415 955 8100 (1) 415 956 1935
Daiwa Capital Markets Europe Limited, London Head Office 5 King William Street, London EC4N 7AX, United Kingdom (44) 20 7597 8000 (44) 20 7597 8600
Daiwa Capital Markets Europe Limited, Frankfurt Branch Neue Mainzer Str. 1, 60311 Frankfurt/Main, Germany (49) 69 717 080 (49) 69 723 340
Daiwa Capital Markets Europe Limited, Paris Representative Office 17, rue de Surène 75008 Paris, France (33) 1 56 262 200 (33) 1 47 550 808
Daiwa Capital Markets Europe Limited, Geneva Branch 50 rue du Rhône, P.O.Box 3198, 1211 Geneva 3, Switzerland (41) 22 818 7400 (41) 22 818 7441
Daiwa Capital Markets Europe Limited, Moscow Representative Office
Midland Plaza 7th Floor, 10 Arbat Street, Moscow 119002, Russian Federation
(7) 495 641 3416 (7) 495 775 6238
Daiwa Capital Markets Europe Limited, Bahrain Branch 7th Floor, The Tower, Bahrain Commercial Complex, P.O. Box 30069, Manama, Bahrain
(973) 17 534 452 (973) 17 535 113
Daiwa Capital Markets Hong Kong Limited Level 28, One Pacific Place, 88 Queensway, Hong Kong (852) 2525 0121 (852) 2845 1621
Daiwa Capital Markets Singapore Limited 6 Shenton Way #26-08, OUE Downtown 2, Singapore 068809, Republic of Singapore
(65) 6220 3666 (65) 6223 6198
Daiwa Capital Markets Australia Limited Level 34, Rialto North Tower, 525 Collins Street, Melbourne, Victoria 3000, Australia
(61) 3 9916 1300 (61) 3 9916 1330
DBP-Daiwa Capital Markets Philippines, Inc 18th Floor, Citibank Tower, 8741 Paseo de Roxas, Salcedo Village, Makati City, Republic of the Philippines
(632) 813 7344 (632) 848 0105
Daiwa-Cathay Capital Markets Co Ltd 14/F, 200, Keelung Road, Sec 1, Taipei, Taiwan, R.O.C. (886) 2 2723 9698 (886) 2 2345 3638
Daiwa Securities Capital Markets Korea Co., Ltd. 20 Fl.& 21Fl. One IFC, 10 Gukjegeumyung-Ro, Yeongdeungpo-gu, Seoul, Korea
(82) 2 787 9100 (82) 2 787 9191
Daiwa Securities Co. Ltd., Beijing Representative Office Room 301/302,Kerry Center,1 Guanghua Road,Chaoyang District, Beijing 100020, People’s Republic of China
(86) 10 6500 6688 (86) 10 6500 3594
Daiwa (Shanghai) Corporate Strategic Advisory Co. Ltd. 44/F, Hang Seng Bank Tower, 1000 Lujiazui Ring Road, Pudong, Shanghai China 200120 , People’s Republic of China
(86) 21 3858 2000 (86) 21 3858 2111
Daiwa Securities Co. Ltd., Bangkok Representative Office 18th Floor, M Thai Tower, All Seasons Place, 87 Wireless Road, Lumpini, Pathumwan, Bangkok 10330, Thailand
(66) 2 252 5650 (66) 2 252 5665
Daiwa Capital Markets India Private Ltd 10th Floor, 3 North Avenue, Maker Maxity, Bandra Kurla Complex, Bandra East, Mumbai – 400051, India
(91) 22 6622 1000 (91) 22 6622 1019
Daiwa Securities Co. Ltd., Hanoi Representative Office Suite 405, Pacific Palace Building, 83B, Ly Thuong Kiet Street, Hoan Kiem Dist. Hanoi, Vietnam
(84) 4 3946 0460 (84) 4 3946 0461
DAIWA INSTITUTE OF RESEARCH LTD
HEAD OFFICE 15-6, Fuyuki, Koto-ku, Tokyo, 135-8460, Japan (81) 3 5620 5100 (81) 3 5620 5603
MARUNOUCHI OFFICE Gran Tokyo North Tower, 1-9-1, Marunouchi, Chiyoda-ku, Tokyo, 100-6756 (81) 3 5555 7011 (81) 3 5202 2021
New York Research Center 11th Floor, Financial Square, 32 Old Slip, NY, NY 10005-3504, U.S.A. (1) 212 612 6100 (1) 212 612 8417
London Research Centre 3/F, 5 King William Street, London, EC4N 7AX, United Kingdom (44) 207 597 8000 (44) 207 597 8550
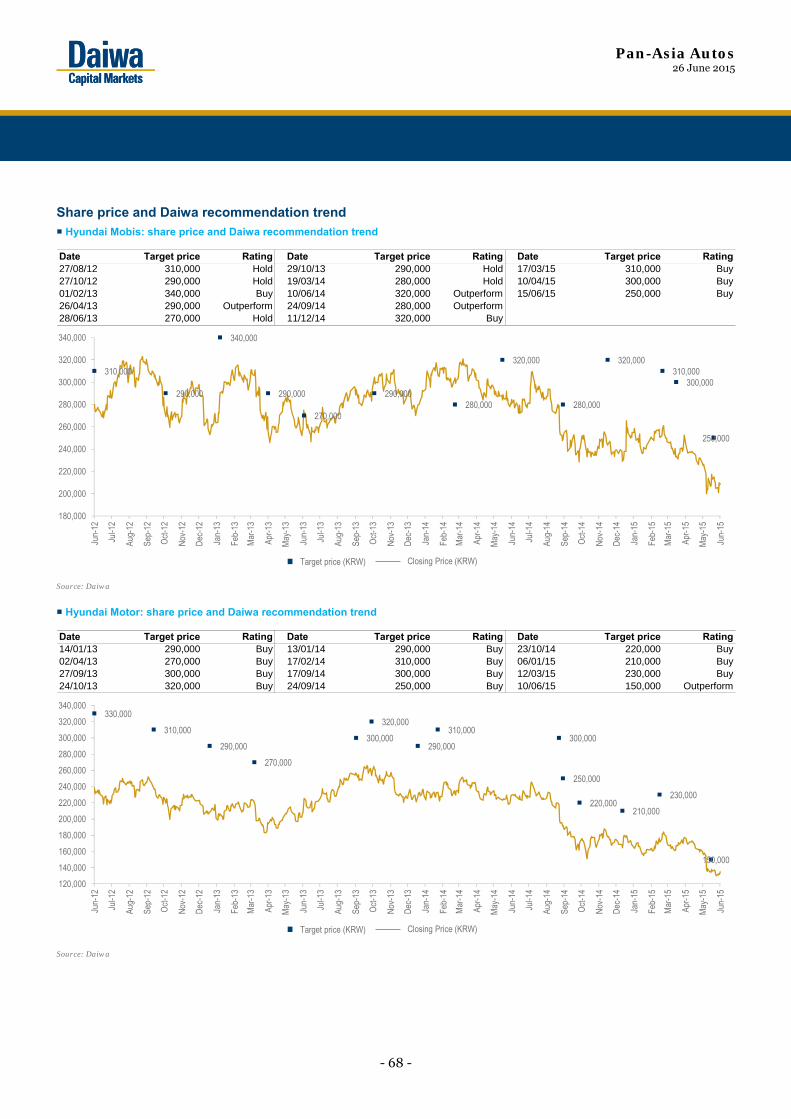
Pan-Asia Autos 26 June 2015
- 68 -
Hyundai Mobis: share price and Daiwa recommendation trend
Date Target price Rating Date Target price Rating Date Target price Rating27/08/12 310,000 Hold 29/10/13 290,000 Hold 17/03/15 310,000 Buy27/10/12 290,000 Hold 19/03/14 280,000 Hold 10/04/15 300,000 Buy01/02/13 340,000 Buy 10/06/14 320,000 Outperform 15/06/15 250,000 Buy26/04/13 290,000 Outperform 24/09/14 280,000 Outperform28/06/13 270,000 Hold 11/12/14 320,000 Buy
310,000
290,000
340,000
290,000
270,000
290,000280,000
320,000
280,000
320,000310,000
300,000
250,000
180,000
200,000
220,000
240,000
260,000
280,000
300,000
320,000
340,000
Jun-
12
Jul-1
2
Aug-
12
Sep-
12
Oct
-12
Nov
-12
Dec
-12
Jan-
13
Feb-
13
Mar
-13
Apr-1
3
May
-13
Jun-
13
Jul-1
3
Aug-
13
Sep-
13
Oct
-13
Nov
-13
Dec
-13
Jan-
14
Feb-
14
Mar
-14
Apr-1
4
May
-14
Jun-
14
Jul-1
4
Aug-
14
Sep-
14
Oct
-14
Nov
-14
Dec
-14
Jan-
15
Feb-
15
Mar
-15
Apr-1
5
May
-15
Jun-
15
Target price (KRW) Closing Price (KRW)
Source: Daiwa
Hyundai Motor: share price and Daiwa recommendation trend
Date Target price Rating Date Target price Rating Date Target price Rating14/01/13 290,000 Buy 13/01/14 290,000 Buy 23/10/14 220,000 Buy02/04/13 270,000 Buy 17/02/14 310,000 Buy 06/01/15 210,000 Buy27/09/13 300,000 Buy 17/09/14 300,000 Buy 12/03/15 230,000 Buy24/10/13 320,000 Buy 24/09/14 250,000 Buy 10/06/15 150,000 Outperform
330,000
310,000
290,000
270,000
300,000
320,000
290,000
310,000300,000
250,000
220,000210,000
230,000
150,000
120,000
140,000
160,000
180,000
200,000
220,000
240,000
260,000
280,000
300,000
320,000
340,000
Jun-
12
Jul-1
2
Aug-
12
Sep-
12
Oct
-12
Nov
-12
Dec
-12
Jan-
13
Feb-
13
Mar
-13
Apr-1
3
May
-13
Jun-
13
Jul-1
3
Aug-
13
Sep-
13
Oct
-13
Nov
-13
Dec
-13
Jan-
14
Feb-
14
Mar
-14
Apr-1
4
May
-14
Jun-
14
Jul-1
4
Aug-
14
Sep-
14
Oct
-14
Nov
-14
Dec
-14
Jan-
15
Feb-
15
Mar
-15
Apr-1
5
May
-15
Jun-
15
Target price (KRW) Closing Price (KRW)
Source: Daiwa
Share price and Daiwa recommendation trend
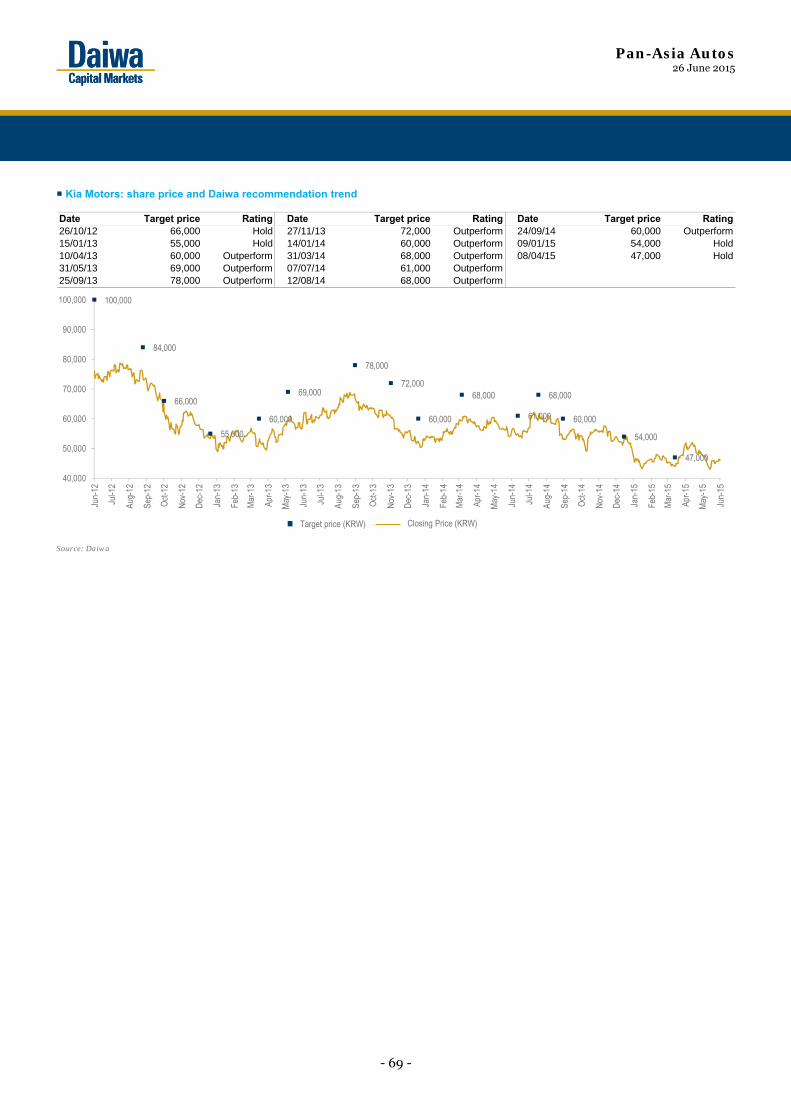
Pan-Asia Autos 26 June 2015
- 69 -
Kia Motors: share price and Daiwa recommendation trend
Date Target price Rating Date Target price Rating Date Target price Rating26/10/12 66,000 Hold 27/11/13 72,000 Outperform 24/09/14 60,000 Outperform15/01/13 55,000 Hold 14/01/14 60,000 Outperform 09/01/15 54,000 Hold10/04/13 60,000 Outperform 31/03/14 68,000 Outperform 08/04/15 47,000 Hold31/05/13 69,000 Outperform 07/07/14 61,000 Outperform25/09/13 78,000 Outperform 12/08/14 68,000 Outperform
100,000
84,000
66,000
55,000
60,000
69,000
78,000
72,000
60,000
68,000
61,000
68,000
60,000
54,000
47,000
40,000
50,000
60,000
70,000
80,000
90,000
100,000
Jun-
12
Jul-1
2
Aug-
12
Sep-
12
Oct
-12
Nov
-12
Dec
-12
Jan-
13
Feb-
13
Mar
-13
Apr-1
3
May
-13
Jun-
13
Jul-1
3
Aug-
13
Sep-
13
Oct
-13
Nov
-13
Dec
-13
Jan-
14
Feb-
14
Mar
-14
Apr-1
4
May
-14
Jun-
14
Jul-1
4
Aug-
14
Sep-
14
Oct
-14
Nov
-14
Dec
-14
Jan-
15
Feb-
15
Mar
-15
Apr-1
5
May
-15
Jun-
15
Target price (KRW) Closing Price (KRW)
Source: Daiwa
Pan-Asia Autos 26 June 2015
- 70 -
Disclaimer
This publication is produced by Daiwa Securities Group Inc. and/or its non-U.S. affiliates, and distributed by Daiwa Securities Group Inc. and/or its non-U.S. affiliates, except to the extent expressly provided herein. This publication and the contents hereof are intended for information purposes only, and may be subject to change without further notice. Any use, disclosure, distribution, dissemination, copying, printing or reliance on this publication for any other purpose without our prior consent or approval is strictly prohibited. Neither Daiwa Securities Group Inc. nor any of its respective parent, holding, subsidiaries or affiliates, nor any of its respective directors, officers, servants and employees, represent nor warrant the accuracy or completeness of the information contained herein or as to the existence of other facts which might be significant, and will not accept any responsibility or liability whatsoever for any use of or reliance upon this publication or any of the contents hereof. Neither this publication, nor any content hereof, constitute, or are to be construed as, an offer or solicitation of an offer to buy or sell any of the securities or investments mentioned herein in any country or jurisdiction nor, unless expressly provided, any recommendation or investment opinion or advice. Any view, recommendation, opinion or advice expressed in this publication may not necessarily reflect those of Daiwa Securities Group Inc., and/or its affiliates nor any of its respective directors, officers, servants and employees except where the publication states otherwise. This research report is not to be relied upon by any person in making any investment decision or otherwise advising with respect to, or dealing in, the securities mentioned, as it does not take into account the specific investment objectives, financial situation and particular needs of any person. Daiwa Securities Group Inc., its subsidiaries or affiliates, or its or their respective directors, officers and employees from time to time have trades as principals, or have positions in, or have other interests in the securities of the company under research including derivatives in respect of such securities or may have also performed investment banking and other services for the issuer of such securities. The following are additional disclosures. Japan Daiwa Securities Co. Ltd. and Daiwa Securities Group Inc. Daiwa Securities Co. Ltd. is a subsidiary of Daiwa Securities Group Inc. Investment Banking Relationship Within the preceding 12 months, The subsidiaries and/or affiliates of Daiwa Securities Group Inc. * has lead-managed public offerings and/or secondary offerings (excluding straight bonds) of the securities of the following companies: Modern Land (China) Co. Ltd (1107 HK); econtext Asia Ltd (1390 HK); Neo Solar Power Corp (3576 TT); Accordia Golf Trust (AGT SP); Hua Hong Semiconductor Ltd (1347 HK); GF Securities Co Ltd (1776 HK). *Subsidiaries of Daiwa Securities Group Inc. for the purposes of this section shall mean any one or more of: Daiwa Capital Markets Hong Kong Limited (大和資本市場香港有限公司), Daiwa Capital Markets Singapore Limited, Daiwa Capital Markets Australia Limited, Daiwa Capital Markets India Private Limited, Daiwa-Cathay Capital Markets Co., Ltd., Daiwa Securities Capital Markets Korea Co., Ltd. Hong Kong This research is distributed in Hong Kong by Daiwa Capital Markets Hong Kong Limited (大和資本市場香港有限公司) (“DHK”) which is regulated by the Hong Kong Securities and Futures Commission. Recipients of this research in Hong Kong may contact DHK in respect of any matter arising from or in connection with this research. Ownership of Securities For “Ownership of Securities” information, please visit BlueMatrix disclosure Link at https://daiwa3.bluematrix.com/sellside/Disclosures.action. Investment Banking Relationship For “Investment Banking Relationship”, please visit BlueMatrix disclosure Link at https://daiwa3.bluematrix.com/sellside/Disclosures.action. Relevant Relationship (DHK) DHK may from time to time have an individual employed by or associated with it serves as an officer of any of the companies under its research coverage. DHK market making DHK may from time to time make a market in securities covered by this research. Korea The developing analyst of this research and analysis material hereby states and confirms that the contents of this material correctly reflect the analyst’s views and opinions and that the analyst has not been placed under inappropriate pressure or interruption by an external party.
Name of Analyst : Sung Yop Chung
Disclosure of Analysts’ Interests If an analyst engaging in or a person who exercises influences on the preparation or publication of a Research Report containing recommendations for general investors to trade financial investment instruments with regard to which the analyst or the influential person has personal interests and if the recommendations contained in the Report may have impacts on the personal interests, Daiwa Securities Capital Markets Korea Co., Ltd.(“Daiwa Securities Korea”)shall ensure that the Analyst or the influential person notifies that he/she has personal interests with regard to: 1. The equity, the equity-linked bonds and the instruments with the subscription right to the equity issued by the legal entity covered in the Research Report (or the legal entity subject to the investment recommendations); 2. The stock option granted by the legal entity covered in the Research Report (or the legal entity subject to the investment recommendations); or 3. The equity futures, the equity options and the equity-linked warrants backed by the equity prescribed in the preceding Paragraph 1 as the underlying assets. Legal Entities subject to Research Report Coverage Restrictions Daiwa Securities Korea hereby states and confirms that Daiwa Securities Korea has no conflicts of interests with the legal entity covered in this Research Report: 1. In that Daiwa Securities Korea does NOT offer direct or indirect payment guarantee for the legal entity by means of, for instance, guarantee, endorsement, provision of collaterals or the acquisition of debts; 2. In that Daiwa Securities Korea does NOT own one-hundredth (or 1/100) or more of the total number of outstanding equities issued by the legal entity; 3. In that The legal entity is NOT an affiliated company of Daiwa Securities Korea pursuant to Sub-paragraph 3, Article 2 of the Monopoly Regulation and Fair Trade Act of Korea; 4. In that, although Daiwa Securities Korea offers advisory services for the legal entity with regard to an M&A deal, the size of the M&A deal does NOT exceed five-hundredths (or 5/100) of the total asset size or the total number of equities issued and outstanding of the legal entity; 5. In that, although Daiwa Securities Korea acted in the capacity of a Lead Underwriter for the initial public offering of the legal entity, more than one-year has passed since the IPO date; 6. In that Daiwa Securities Korea is NOT designated by the legal entity as the ‘tender offer agent’ pursuant to the Paragraph 2, Article 133 of the Financial Services and Capital Market Act or the legal entity is NOT the issuer of the equity subject to the proposed tender offer; this requirement, however applies until the maturity of the tender offer period; or 7. In that Daiwa Securities Korea does NOT have significant or material interests with regard to the legal entity. Disclosure of Prior Distribution to Third Party This report has not been distributed to the third party in advance prior to public release. The following explains the rating system in the report as compared to KOSPI, based on the beliefs of the author(s) of this report. "1": the security could outperform the KOSPI by more than 15% over the next 12 months, unless otherwise stated. "2": the security is expected to outperform the KOSPI by 5-15% over the next 12 months, unless otherwise stated. "3": the security is expected to perform within 5% of the KOSPI (better or worse) over the next 12 months, unless otherwise stated. "4": the security is expected to underperform the KOSPI by 5-15% over the next 12 months, unless otherwise stated. "5": the security could underperform the KOSPI by more than 15% over the next 12 months, unless otherwise stated. “Positive” means that the analyst expects the sector to outperform the KOSPI over the next 12 months, unless otherwise stated. “Neutral” means that the analyst expects the sector to be in-line with the KOSPI over the next 12 months, unless otherwise stated. “Negative” means that the analyst expects the sector to underperform the KOSPI over the next 12 months, unless otherwise stated. Additional information may be available upon request.
Pan-Asia Autos 26 June 2015
- 71 -
Singapore This research is distributed in Singapore by Daiwa Capital Markets Singapore Limited and it may only be distributed in Singapore to accredited investors, expert investors and institutional investors as defined in the Financial Advisers Regulations and the Securities and Futures Act (Chapter 289), as amended from time to time. By virtue of distribution to these category of investors, Daiwa Capital Markets Singapore Limited and its representatives are not required to comply with Section 36 of the Financial Advisers Act (Chapter 110) (Section 36 relates to disclosure of Daiwa Capital Markets Singapore Limited’s interest and/or its representative’s interest in securities). Recipients of this research in Singapore may contact Daiwa Capital Markets Singapore Limited in respect of any matter arising from or in connection with the research. Australia This research is distributed in Australia by Daiwa Capital Markets Stockbroking Limited and it may only be distributed in Australia to wholesale investors within the meaning of the Corporations Act. Recipients of this research in Australia may contact Daiwa Capital Markets Stockbroking Limited in respect of any matter arising from or in connection with the research. Ownership of Securities For “Ownership of Securities” information, please visit BlueMatrix disclosure Link at https://daiwa3.bluematrix.com/sellside/Disclosures.action. India This research is distributed by Daiwa Capital Markets India Private Limited (DAIWA) which is an intermediary registered with Securities & Exchange Board of India. This report is not to be considered as an offer or solicitation for any dealings in securities. While the information in this report has been compiled by DAIWA in good faith from sources believed to be reliable, no representation or warranty, express of implied, is made or given as to its accuracy, completeness or correctness. DAIWA its officers, employees, representatives and agents accept no liability whatsoever for any loss or damage whether direct, indirect, consequential or otherwise howsoever arising (whether in negligence or otherwise) out of or in connection with or from any use of or reliance on the contents of and/or omissions from this document. Consequently DAIWA expressly disclaims any and all liability for, or based on or relating to any such information contained in or errors in or omissions in this report. Accordingly, you are recommended to seek your own legal, tax or other advice and should rely solely on your own judgment, review and analysis, in evaluating the information in this document. The data contained in this document is subject to change without any prior notice DAIWA reserves its right to modify this report as maybe required from time to time. DAIWA is committed to providing independent recommendations to its Clients and would be happy to provide any information in response to any query from its Clients. This report is strictly confidential and is being furnished to you solely for your information. The information contained in this document should not be reproduced (in whole or in part) or redistributed in any form to any other person. We and our group companies, affiliates, officers, directors and employees may from time to time, have long or short positions, in and buy sell the securities thereof, of company(ies) mentioned herein or be engaged in any other transactions involving such securities and earn brokerage or other compensation or act as advisor or have the potential conflict of interest with respect to any recommendation and related information or opinion. DAIWA prohibits its analyst and their family members from maintaining a financial interest in the securities or derivatives of any companies that the analyst cover. This report is not intended or directed for distribution to, or use by any person, citizen or entity which is resident or located in any state or country or jurisdiction where such publication, distribution or use would be contrary to any statutory legislation, or regulation which would require DAIWA and its affiliates/ group companies to any registration or licensing requirements. The views expressed in the report accurately reflect the analyst’s personal views about the securities and issuers that are subject of the Report, and that no part of the analyst’s compensation was, is or will be directly or indirectly, related to the recommendations or views expressed in the Report. This report does not recommend to US recipients the use of Daiwa Capital Markets India Private Limited or any of its non – US affiliates to effect trades in any securities and is not supplied with any understanding that US recipients will direct commission business to Daiwa Capital Markets India Private Limited. Taiwan This research is distributed in Taiwan by Daiwa-Cathay Capital Markets Co., Ltd and it may only be distributed in Taiwan to institutional investors or specific investors who have signed recommendation contracts with Daiwa-Cathay Capital Markets Co., Ltd in accordance with the Operational Regulations Governing Securities Firms Recommending Trades in Securities to Customers. Recipients of this research in Taiwan may contact Daiwa-Cathay Capital Markets Co., Ltd in respect of any matter arising from or in connection with the research. Philippines This research is distributed in the Philippines by DBP-Daiwa Capital Markets Philippines, Inc. which is regulated by the Philippines Securities and Exchange Commission and the Philippines Stock Exchange, Inc. Recipients of this research in the Philippines may contact DBP-Daiwa Capital Markets Philippines, Inc. in respect of any matter arising from or in connection with the research. DBP-Daiwa Capital Markets Philippines, Inc. recommends that investors independently assess, with a professional advisor, the specific financial risks as well as the legal, regulatory, tax, accounting, and other consequences of a proposed transaction. DBP-Daiwa Capital Markets Philippines, Inc. may have positions or may be materially interested in the securities in any of the markets mentioned in the publication or may have performed other services for the issuers of such securities. For relevant securities and trading rules please visit SEC and PSE Link at http://www.sec.gov.ph/irr/AmendedIRRfinalversion.pdf and http://www.pse.com.ph/ respectively. Thailand
This research is distributed to only institutional investors in Thailand primarily by Thanachart Securities Public Company Limited (“TNS”). This report is prepared by analysts who are employed by Daiwa Securities Group Inc. and/or its non-U.S. affiliates. While the information is from sources believed to be reliable, neither the information nor the forecasts shall be taken as a representation or warranty for which Thanachart Securities Public Company Limited, Daiwa Securities Group Inc. nor any of their respective parent, holding, subsidiaries or affiliates, nor any of their respective directors, officers, servants and employees incur any responsibility. This report is provided to you for informational purposes only and it is not, and is not to be construed as, an offer or an invitation to make an offer to sell or buy any securities. Neither Thanachart Securities Public Company Limited, Daiwa Securities Group Inc. nor any of their respective parent, holding, subsidiaries or affiliates, nor any of their respective directors, officers, servants and employees accept any liability whatsoever for any direct or consequential loss arising from any use of this research or its contents. The information and opinions contained herein have been compiled or arrived at from sources believed reliable. However, Thanachart Securities Public Company Limited, Daiwa Securities Group Inc. nor any of their respective parent, holding, subsidiaries or affiliates, nor any of their respective directors, officers, servants and employees make no representation or warranty, express or implied, as to their accuracy or completeness. Expressions of opinion herein are subject to change without notice. The use of any information, forecasts and opinions contained in this report shall be at the sole discretion and risk of the user. Daiwa Securities Group Inc. and/or its non-U.S. affiliates perform and seek to perform business with companies covered in this research. Thanachart Securities Public Company Limited, Daiwa Securities Group Inc., their respective parent, holding, subsidiaries or affiliates, their respective directors, officers, servants and employees may have positions and financial interest in securities mentioned in this research. Thanachart Securities Public Company Limited, Daiwa Securities Group Inc., their respective parent, holding, subsidiaries or affiliates may from time to time perform investment banking or other services for, or solicit investment banking or other business from, any entity mentioned in this research. Therefore, investors should be aware of conflict of interest that may affect the objectivity of this research. United Kingdom This research report is produced by Daiwa Capital Markets Europe Limited and/or its affiliates and is distributed in the European Union, Iceland, Liechtenstein, Norway and Switzerland. Daiwa Capital Markets Europe Limited is authorised and regulated by The Financial Conduct Authority (“FCA”) and is a member of the London Stock Exchange, Eurex and NYSE Liffe. Daiwa Capital Markets Europe Limited and/or its affiliates may, from time to time, to the extent permitted by law, participate or invest in other financing transactions with the issuers of the securities referred to herein (the “Securities”), perform services for or solicit business from such issuers, and/or have a position or effect transactions in the Securities or options thereof and/or may have acted as an underwriter during the past twelve months for the issuer of such securities. In addition, employees of Daiwa Capital Markets Europe Limited and/or its affiliates may have positions and effect transactions in such securities or options and may serve as Directors of such issuers. Daiwa Capital Markets Europe Limited may, to the extent permitted by applicable UK law and other applicable law or regulation, effect transactions in the Securities before this material is published to recipients. This publication is intended for investors who are not Retail Clients in the United Kingdom within the meaning of the Rules of the FCA and should not therefore be distributed to such Retail Clients in the United Kingdom. Should you enter into investment business with Daiwa Capital Markets Europe’s affiliates outside the United Kingdom, we are obliged to advise that the protection afforded by the United Kingdom regulatory system may not apply; in particular, the benefits of the Financial Services Compensation Scheme may not be available. Daiwa Capital Markets Europe Limited has in place organisational arrangements for the prevention and avoidance of conflicts of interest. Our conflict management policy is available at http://www.uk.daiwacm.com/about-us/corporate-governance-regulatory . Regulatory disclosures of investment banking relationships are available at https://daiwa3.bluematrix.com/sellside/Disclosures.action. Germany This document is distributed in Germany by Daiwa Capital Markets Europe Limited, Niederlassung Frankfurt which is regulated by BaFin (Bundesanstalt fuer Finanzdienstleistungsaufsicht) for the conduct of business in Germany. Bahrain
This research material is distributed by Daiwa Capital Markets Europe Limited, Bahrain Branch, regulated by The Central Bank of Bahrain and holds Investment Business Firm – Category 2 license and having its official place of business at the Bahrain World Trade Centre, South Tower, 7th floor, P.O. Box 30069, Manama, Kingdom of Bahrain. Tel No. +973 17534452 Fax No. +973 535113
This material is provided as a reference for making investment decisions and is not intended to be a solicitation for investment. Investment decisions should be made at your own discretion and risk. Accordingly, no representation or warranty, express or implied, is made as to and no reliance should be placed on the fairness, accuracy, completeness or correctness of the information and opinions contained in this document, Content herein is based on information available at the time the research material was prepared and may be amended or otherwise changed in the future without notice. All information is intended for the private use of the person to whom it is provided without any liability whatsoever on the part of Daiwa Capital Markets
Pan-Asia Autos 26 June 2015
- 72 -
Europe Limited, Bahrain Branch, any associated company or the employees thereof. If you are in doubt about the suitability of the product or the research material itself, please consult your own financial adviser. Daiwa Capital Markets Europe Limited, Bahrain Branch retains all rights related to the content of this material, which may not be redistributed or otherwise transmitted without prior consent. United States This report is distributed in the U.S. by Daiwa Capital Markets America Inc. (DCMA). It may not be accurate or complete and should not be relied upon as such. It reflects the preparer’s views at the time of its preparation, but may not reflect events occurring after its preparation; nor does it reflect DCMA’s views at any time. Neither DCMA nor the preparer has any obligation to update this report or to continue to prepare research on this subject. This report is not an offer to sell or the solicitation of any offer to buy securities. Unless this report says otherwise, any recommendation it makes is risky and appropriate only for sophisticated speculative investors able to incur significant losses. Readers should consult their financial advisors to determine whether any such recommendation is consistent with their own investment objectives, financial situation and needs. This report does not recommend to U.S. recipients the use of any of DCMA’s non-U.S. affiliates to effect trades in any security and is not supplied with any understanding that U.S. recipients of this report will direct commission business to such non-U.S. entities. Unless applicable law permits otherwise, non-U.S. customers wishing to effect a transaction in any securities referenced in this material should contact a Daiwa entity in their local jurisdiction. Most countries throughout the world have their own laws regulating the types of securities and other investment products which may be offered to their residents, as well as a process for doing so. As a result, the securities discussed in this report may not be eligible for sales in some jurisdictions. Customers wishing to obtain further information about this report should contact DCMA: Daiwa Capital Markets America Inc., Financial Square, 32 Old Slip, New York, New York 10005 (telephone 212-612-7000). Ownership of Securities For “Ownership of Securities” information please visit BlueMatrix disclosure Link at https://daiwa3.bluematrix.com/sellside/Disclosures.action. Investment Banking Relationships For “Investment Banking Relationships” please visit BlueMatrix disclosure link at https://daiwa3.bluematrix.com/sellside/Disclosures.action. DCMA Market Making For “DCMA Market Making” please visit BlueMatrix disclosure link at https://daiwa3.bluematrix.com/sellside/Disclosures.action. Research Analyst Conflicts For updates on “Research Analyst Conflicts” please visit BlueMatrix disclosure link at https://daiwa3.bluematrix.com/sellside/Disclosures.action. The principal research analysts who prepared this report have no financial interest in securities of the issuers covered in the report, are not (nor are any members of their household) an officer, director or advisory board member of the issuer(s) covered in the report, and are not aware of any material relevant conflict of interest involving the analyst or DCMA, and did not receive any compensation from the issuer during the past 12 months except as noted: no exceptions. Research Analyst Certification For updates on “Research Analyst Certification” and “Rating System” please visit BlueMatrix disclosure link at https://daiwa3.bluematrix.com/sellside/Disclosures.action. The views about any and all of the subject securities and issuers expressed in this Research Report accurately reflect the personal views of the research analyst(s) primarily responsible for this report (or the views of the firm producing the report if no individual analysts[s] is named on the report); and no part of the compensation of such analyst(s) (or no part of the compensation of the firm if no individual analyst[s)] is named on the report) was, is, or will be directly or indirectly related to the specific recommendations or views contained in this Research Report.
The following explains the rating system in the report as compared to relevant local indices, unless otherwise stated, based on the beliefs of the author of the report. "1": the security could outperform the local index by more than 15% over the next 12 months. "2": the security is expected to outperform the local index by 5-15% over the next 12 months. "3": the security is expected to perform within 5% of the local index (better or worse) over the next 12 months. "4": the security is expected to underperform the local index by 5-15% over the next 12 months. "5": the security could underperform the local index by more than 15% over the next 12 months. Disclosure of investment ratings
Rating Percentage of total
Buy* 61.0% Hold** 26.1% Sell*** 12.9%
Source: Daiwa
Notes: data is for single-branded Daiwa research in Asia (ex Japan) and correct as of 31 March 2015. * comprised of Daiwa’s Buy and Outperform ratings. ** comprised of Daiwa’s Hold ratings. *** comprised of Daiwa’s Underperform and Sell ratings. Additional information may be available upon request. Japan - additional notification items pursuant to Article 37 of the Financial Instruments and Exchange Law (This Notification is only applicable where report is distributed by Daiwa Securities Co. Ltd.) If you decide to enter into a business arrangement with us based on the information described in materials presented along with this document, we ask you to pay close attention to the following items. • In addition to the purchase price of a financial instrument, we will collect a trading commission* for each transaction as agreed beforehand with you. Since commissions may be included in
the purchase price or may not be charged for certain transactions, we recommend that you confirm the commission for each transaction. • In some cases, we may also charge a maximum of ¥ 2 million (including tax) per year as a standing proxy fee for our deposit of your securities, if you are a non-resident of Japan. • For derivative and margin transactions etc., we may require collateral or margin requirements in accordance with an agreement made beforehand with you. Ordinarily in such cases, the
amount of the transaction will be in excess of the required collateral or margin requirements. • There is a risk that you will incur losses on your transactions due to changes in the market price of financial instruments based on fluctuations in interest rates, exchange rates, stock prices,
real estate prices, commodity prices, and others. In addition, depending on the content of the transaction, the loss could exceed the amount of the collateral or margin requirements. • There may be a difference between bid price etc. and ask price etc. of OTC derivatives handled by us. • Before engaging in any trading, please thoroughly confirm accounting and tax treatments regarding your trading in financial instruments with such experts as certified public accountants.
*The amount of the trading commission cannot be stated here in advance because it will be determined between our company and you based on current market conditions and the content of each transaction etc.
When making an actual transaction, please be sure to carefully read the materials presented to you prior to the execution of agreement, and to take responsibility for your own decisions regarding the signing of the agreement with us. Corporate Name: Daiwa Securities Co. Ltd. Financial instruments firm: chief of Kanto Local Finance Bureau (Kin-sho) No.108 Memberships: Japan Securities Dealers Association, The Financial Futures Association of Japan Japan Securities Investment Advisers Association Type II Financial Instruments Firms Association