smart beta investing in corporate bonds: conceptual … · white paper | february 2014 smart beta...
TRANSCRIPT

SHANE SHEPHERD, PH.D.
WHITE PAPER | February 2014
Smart Beta Investing in Corporate Bonds: Conceptual and Empirical Grounds

WHITE PAPER | February 2014 1
About the Author
SHANE SHEPHERD, PH.D.Senior Vice President, Head of Fixed-Income Research
Dr. Shane Shepherd focuses on research into the company’s alternative bond approach. In addition, he conducts quantitative research used to strengthen and expand the RAFI Fundamental Index concept, and to support the global tactical asset allocation model.
Prior to joining Research Affiliates, Shane served as a research assistant at the University of California, Davis Graduate School of Management, where he investigated issues in behavioral finance, and as a legal assistant at Morrison & Foerster, LLP.
Shane earned his Ph.D. in finance from the University of California, Los Angeles. He holds a BA in political science and philosophy from Duke University.
WHITE PAPER | February 20142
OVERVIEW
Traditional passive corporate bond indices provide market beta—that is, exposure to systematic risk—by investing in bonds as they are issued by corporations. This requires accepting more exposure to companies as they issue more debt in the marketplace. All else equal, as a company’s debt level rises, its leverage rises, its cash flow coverage drops, and its credit quality generally falls. This means that market value-weighted indices tend to progressively increase their exposure to companies as they become riskier credit bets. Historically this increased risk has not delivered a satisfactory return premium.
In a perfectly efficient market, a corporate credit spread would provide an exactly sufficient premium to offset the increased risk over treasuries or better quality corporate credits. We believe that the financial markets fall short of this ideal, and therefore credit spreads serve as noisy estimates of the true underlying default risk. As shown in Arnott, Hsu, Li, and Shepherd (2010), a market value-weighted index will overweight corporate bonds with spreads that understate default risk (and are consequently expensive relative to their risk profile) and underweight bonds that overstate default risk (and so trade at a cheap price relative to their risk profile). Additionally, it appears that credit exposure, particularly viewed through factors such as leverage and cash flow coverage, has not historically provided a return premium to riskier bonds. This anomaly may be explained by a propensity for many investors to reach for yield, bidding up the prices of these riskier bonds.2 And Shepherd (2011) shows that a fundamentally weighted rebalancing strategy in corporate bonds delivers outperformance due to positive price appreciation from a rebalancing premium, not from exposure to risk factors.
Nonetheless, passive index tracking offers investors many benefits as an investment strategy:
• A high degree of transparency allows investors to keep their due diligence costs lowwithout diminishing their confidence that the index manager will take on risk as represented.
• Arules-basedprocesssustainsgreaterfaithinthetrackrecordbygivingassurancethatthe investment management process will be consistently followed in the future.
• Lowmanagementfeesallowagreaterportionofthereturntoflowthroughtotheinvestor.
• Relativelyhighliquidityandlowturnoverrestrainimplementationcosts.
• Highcapacityreducesthelikelihoodofsignificantlynegativemarketpriceimpactsasnewassets flow into the strategy.
Smart Beta investing is well known in the equity space. Our research shows that it works for corporate bonds as well. This paper describes a Smart Beta strategy that efficiently provides exposure to investment grade corporate bonds denominated in major developed market currencies. The strategy crucially employs a portfolio construction methodology under which holdings are weighted without reference to the market value of constituent companies’ outstanding debt. Moreover, the strategy is designed to reduce volatility and improve credit quality by emphasizing companies with lower leverage, higher cash flow coverage of their debt, and lower downgrade risk. This paper also explains the reasoning behind key elements of the methodology and describes the simulated risk and return characteristics that emerge from back-testing the corporate bond strategy over a measurement period of 16 years.1
3
Smart Beta Investing in Corporate Bonds: Conceptual and Empirical Grounds
WHITE PAPER | February 2014
A fundamentals-weighted corporate bond index that is simple, efficient, and cost-effective implements a transparent, rules-based investment process that delivers many of the benefits of conventional passive investing but offers potentially improved returns with lower volatility. The strategy index also has the potential for long-term outperformance over the market value-weighted benchmark (historically estimated at about 40 bps annualized).
DETERMINING COMPANY WEIGHTS: PROCESS AND RATIONALEThe company weights in the corporate bond index described here are determined according to fundamental measures of a firm’s debt service capacity, and not by the amount of debt outstanding. Specifically, we weight companies in the index by cash flow and long-term assets. Additionally the index uses a financial ratio-based screen to remove exposure to companies with the most troubled financial statements, because they are more likely to experience downgrades and show sensitivity to the credit risk cycle. Prior to calculating constituent weights, we gather the available company financial data for all corporate bonds in the research universe that are denominated in U.S. dollars, euros, pounds sterling, yen, and Australian dollars.
We measure cash flow as the five-year average cash flow calculated from the company’s income statements. Averaging the cash flow over time creates more stable target weights that are less prone to fluctuations with the business cycle, and therefore leads to more robust measures of business size. This procedure also tends to keep turnover lower, as the target weights shift more gradually through time.
For the second factor, we derive a measure of long-term assets from the balance sheet as an estimate of the collateral available to long-term bondholders. The holders of short-term debt generally have a senior claim on the assets of a company in default. Accordingly, we measure the assets that reflect the potential claims of long-term bondholders. We consider the holders of long-term bonds and equity holders to have claims on the total assets less the amount of shorter-term claims. As a practical matter, to calculate long-term assets, we use the most recently available data and add the market value of equity (where applicable) to the long-term bonds. This bottom-up process gives a cleaner result than starting at the top of the balance sheet and removing the short-term claims one by one, and it provides a measure of the available assets in accordance with the balance sheet accounting identity whereby assets equal liabilities plus equity. We use the market value of equity rather than the book value of shareholder’s equity. This replacement results in reduced exposure to companies with falling stock prices, a signal of higher likelihood of downgrade and bankruptcy. Positive cross-over momentum exists between the stock and bond markets, so falling stock prices often lead to falling prices for that company’s bonds.3 Thus, using the market value of equity in estimating the value of long-term assets both reduces downside risk and provides a modest positive impact upon expected returns.
Once the accounting variables have been derived from the financial data, we calculate cash flow weights based on each company’s cash flow as a percentage of the total cash flow from all companies in the index. Similarly, a long-term asset weight is calculated as each company’s long-term assets as a percentage of the total long-term assets in the index. The composite weight is the simple average of these two factors. In the rare case that a company has a score on only one factor, that factor determines the entire company weight; and if neither score is available for a company, its bonds will not be included in the index.
WHITE PAPER | February 20144
LEVERAGE AND CASH FLOW COVERAGEThe use of cash flow and long-term assets as weighting factors provides important beneficial features both in absolute terms and relative to the market value-weighted benchmark.
In absolute terms, the factors measure debt service capacity. As cash flow rises, a corporation can afford larger interest payments. As assets rise, a corporation has larger collateral available to pledge against its debt. Moreover, both accounting measures rise with the scale of the corporation and therefore give higher exposures to larger participants in the economy. Additionally, these factors tend to be co-integrated with liquidity in the debt markets; larger corporations are disposed to issue bonds in larger size, and they trade more frequently with tighter spreads. Thus, in absolute terms the factors accomplish three purposes: they provide higher weights to companies with higher debt service capacity; broad diversified economic exposure to the world credit market; and a generally higher exposure to more liquid bonds.
The company weights that result from using these factors differ meaningfully from the corresponding market value weights. First, the assets factor favors companies with high assets, whereas the market portfolio favors companies with high debt issuance. The relative weight for the strategy index, there-fore, is the ratio of long-term assets to debt issuance—a measure of the company’s leverage. Conse-quently, the strategy index overweights companies with below average leverage and underweights companies with above average leverage. Similarly, the strategy index favors companies with high cash flow, rather than high debt issuance. On this factor a company’s weight in the index, relative to its weight in the market portfolio, is the ratio of cash flow to debt issuance, a measure of cash flow coverage. The index as a whole therefore shows lower average leverage and higher average cash flow coverage compared to the benchmark. These tilts are embedded in the index construction process; they are a natural result of weighting by factors other than debt issuance.
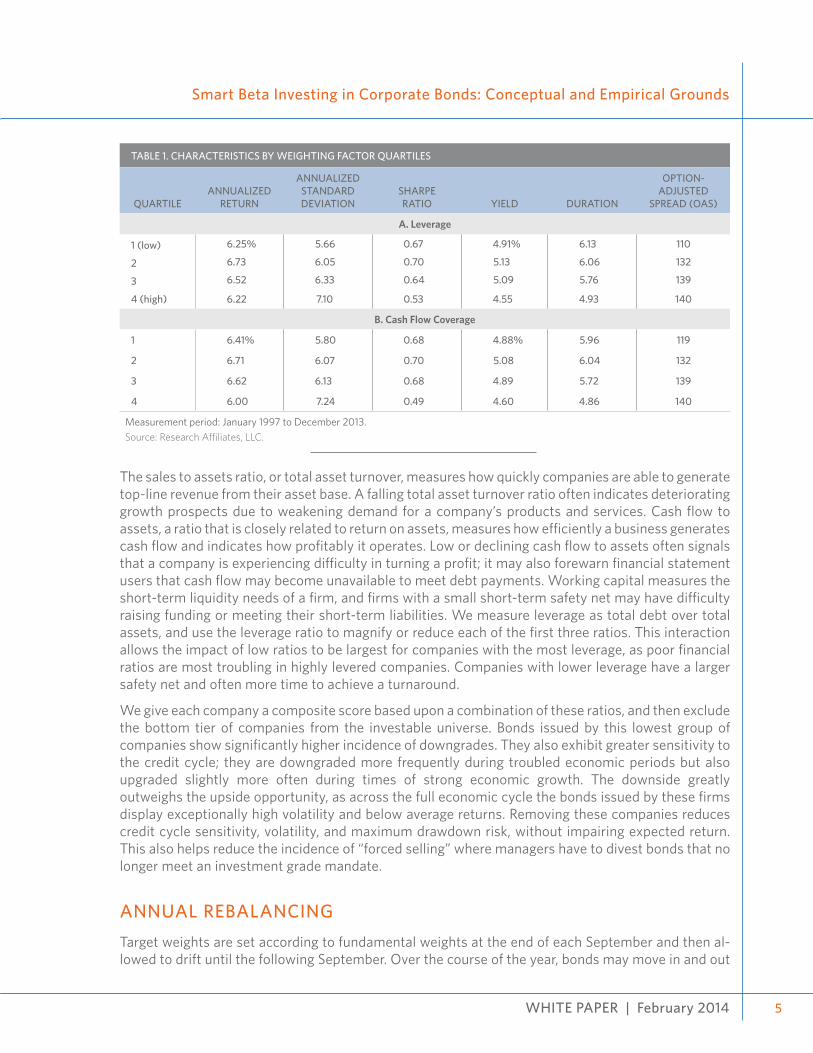
Companies with higher leverage and lower cash flow coverage are indeed riskier. Yet they do not provide a higher return as compensation for that risk. Panel A in Table 1 demonstrates that risk increases as leverage rises: the volatility of bond returns increases and credit spreads widen. But expected returns do not monotonically increase with leverage. Similarly, Panel B shows that risk increases as a company’s cash flow coverage declines; again, however, that increased risk does not unequivocally generate a return premium. In fact, the highest leverage and lowest cash flow coverage quartile of firms show the lowest average returns with the highest volatility. Taking on additional risk without higher return has led to a much lower Sharpe ratio. Allocating away from high leverage, low cash flow coverage bonds and towards companies with healthier debt levels is likely to improve the risk-return profile of an index or a portfolio.
FINANCIAL RATIO SCREENING The fundamentals-weighted corporate bond index uses a financial ratio screen to identify companies at higher risk of downgrade, and removes them from the index universe. Deteriorating financial health rightly concerns bondholders, as it lessens the probability of their capital being returned in full and on time. Declining health is reflected on the company’s balance sheet and income statements, in adverse credit rating changes, and by widening credit spreads that lead to negative bond returns.
The academic finance literature has singled out certain financial ratios that are significant predictors of default risk.4 We utilize four ratios: sales to assets, cash flow to assets, working capital to assets, and leverage.
WHITE PAPER | February 2014
Smart Beta Investing in Corporate Bonds: Conceptual and Empirical Grounds
5
The sales to assets ratio, or total asset turnover, measures how quickly companies are able to generate top-line revenue from their asset base. A falling total asset turnover ratio often indicates deteriorating growth prospects due to weakening demand for a company’s products and services. Cash flow to assets, a ratio that is closely related to return on assets, measures how efficiently a business generates cash flow and indicates how profitably it operates. Low or declining cash flow to assets often signals that a company is experiencing difficulty in turning a profit; it may also forewarn financial statement users that cash flow may become unavailable to meet debt payments. Working capital measures the short-term liquidity needs of a firm, and firms with a small short-term safety net may have difficulty raising funding or meeting their short-term liabilities. We measure leverage as total debt over total assets, and use the leverage ratio to magnify or reduce each of the first three ratios. This interaction allows the impact of low ratios to be largest for companies with the most leverage, as poor financial ratios are most troubling in highly levered companies. Companies with lower leverage have a larger safety net and often more time to achieve a turnaround.
We give each company a composite score based upon a combination of these ratios, and then exclude the bottom tier of companies from the investable universe. Bonds issued by this lowest group of companies show significantly higher incidence of downgrades. They also exhibit greater sensitivity to the credit cycle; they are downgraded more frequently during troubled economic periods but also upgraded slightly more often during times of strong economic growth. The downside greatly outweighs the upside opportunity, as across the full economic cycle the bonds issued by these firms display exceptionally high volatility and below average returns. Removing these companies reduces credit cycle sensitivity, volatility, and maximum drawdown risk, without impairing expected return. This also helps reduce the incidence of “forced selling” where managers have to divest bonds that no longer meet an investment grade mandate.
ANNUAL REBALANCING Target weights are set according to fundamental weights at the end of each September and then al-lowed to drift until the following September. Over the course of the year, bonds may move in and out
TABLE 1. CHARACTERISTICS BY WEIGHTING FACTOR QUARTILES
QUARTILEANNUALIZED
RETURN
ANNUALIZED STANDARD DEVIATION
SHARPERATIO YIELD DURATION
OPTION-ADJUSTED
SPREAD (OAS)
A. Leverage
1 (low) 6.25% 5.66 0.67 4.91% 6.13 110
2 6.73 6.05 0.70 5.13 6.06 132
3 6.52 6.33 0.64 5.09 5.76 139
4 (high) 6.22 7.10 0.53 4.55 4.93 140
B. Cash Flow Coverage
1 6.41% 5.80 0.68 4.88% 5.96 119
2 6.71 6.07 0.70 5.08 6.04 132
3 6.62 6.13 0.68 4.89 5.72 139
4 6.00 7.24 0.49 4.60 4.86 140
Measurement period: January 1997 to December 2013.Source: Research Affiliates, LLC.
WHITE PAPER | February 20146
of the portfolio with issuance, redemption, or breach of the index rules. At the end of the 12-month period, new fundamental values are calculated based upon the most recently available financial statements, and the index is rebalanced to the new fundamentals-based target weights.
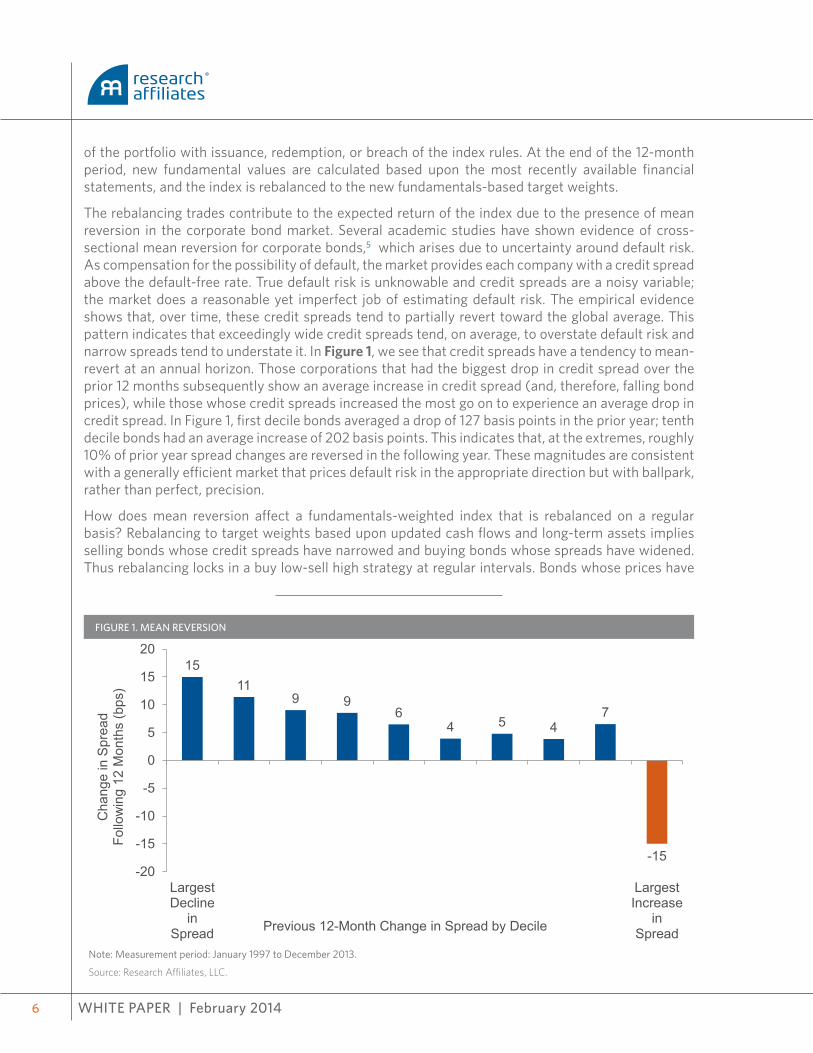
The rebalancing trades contribute to the expected return of the index due to the presence of mean reversion in the corporate bond market. Several academic studies have shown evidence of cross-sectional mean reversion for corporate bonds,5 which arises due to uncertainty around default risk. As compensation for the possibility of default, the market provides each company with a credit spread above the default-free rate. True default risk is unknowable and credit spreads are a noisy variable; the market does a reasonable yet imperfect job of estimating default risk. The empirical evidence shows that, over time, these credit spreads tend to partially revert toward the global average. This pattern indicates that exceedingly wide credit spreads tend, on average, to overstate default risk and narrow spreads tend to understate it. In Figure 1, we see that credit spreads have a tendency to mean-revert at an annual horizon. Those corporations that had the biggest drop in credit spread over the prior 12 months subsequently show an average increase in credit spread (and, therefore, falling bond prices), while those whose credit spreads increased the most go on to experience an average drop in credit spread. In Figure 1, first decile bonds averaged a drop of 127 basis points in the prior year; tenth decile bonds had an average increase of 202 basis points. This indicates that, at the extremes, roughly 10% of prior year spread changes are reversed in the following year. These magnitudes are consistent with a generally efficient market that prices default risk in the appropriate direction but with ballpark, rather than perfect, precision.
How does mean reversion affect a fundamentals-weighted index that is rebalanced on a regular basis? Rebalancing to target weights based upon updated cash flows and long-term assets implies selling bonds whose credit spreads have narrowed and buying bonds whose spreads have widened. Thus rebalancing locks in a buy low-sell high strategy at regular intervals. Bonds whose prices have
FIGURE 1. MEAN REVERSION
1511
9 96
4 5 47
-15-20
-15
-10
-5
0
5
10
15
20
LargestDecline
inSpread
LargestIncrease
inSpread
Cha
nge
in S
prea
dFo
llow
ing
12 M
onth
s (b
ps)
Previous 12-Month Change in Spread by Decile
Note: Measurement period: January 1997 to December 2013.
Source: Research Affiliates, LLC.
WHITE PAPER | February 2014
Smart Beta Investing in Corporate Bonds: Conceptual and Empirical Grounds
7
declined the most due to changes in perceived credit quality over the prior year have a propensity to show higher future returns than those whose prices have, contrariwise, increased the most thanks to credit spread movements. Rebalancing shifts weight into bonds that have declined in price (higher future expected returns) and away from bonds that have risen in price (lower future expected returns), positioning the index to take advantage of mean reversion over the upcoming 12 month period.
PERFORMANCE AND CHARACTERISTICSBelow we discuss a simulated portfolio that follows the corporate bond index strategy described above. We gather monthly constituent level data on all holdings in the Bank of America Merrill Lynch Global Corporate Investment Grade Bond Index. We filter the universe using the financial ratio screen and weight the remaining companies according to the composite strategy index weight based upon long-term assets and cash flow. Our data sample begins in January 1997 and we follow the portfolio to the end of December 2013. All returns are expressed in unhedged U.S. dollars.
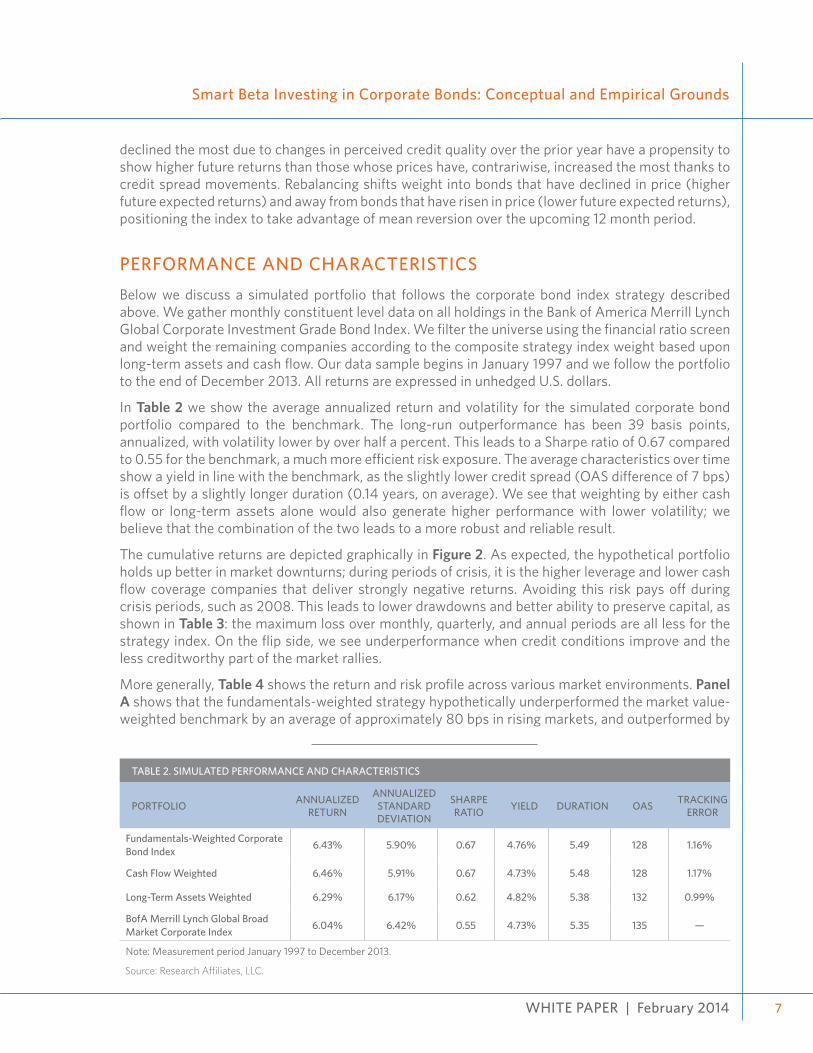
In Table 2 we show the average annualized return and volatility for the simulated corporate bond portfolio compared to the benchmark. The long-run outperformance has been 39 basis points, annualized, with volatility lower by over half a percent. This leads to a Sharpe ratio of 0.67 compared to 0.55 for the benchmark, a much more efficient risk exposure. The average characteristics over time show a yield in line with the benchmark, as the slightly lower credit spread (OAS difference of 7 bps) is offset by a slightly longer duration (0.14 years, on average). We see that weighting by either cash flow or long-term assets alone would also generate higher performance with lower volatility; we believe that the combination of the two leads to a more robust and reliable result.
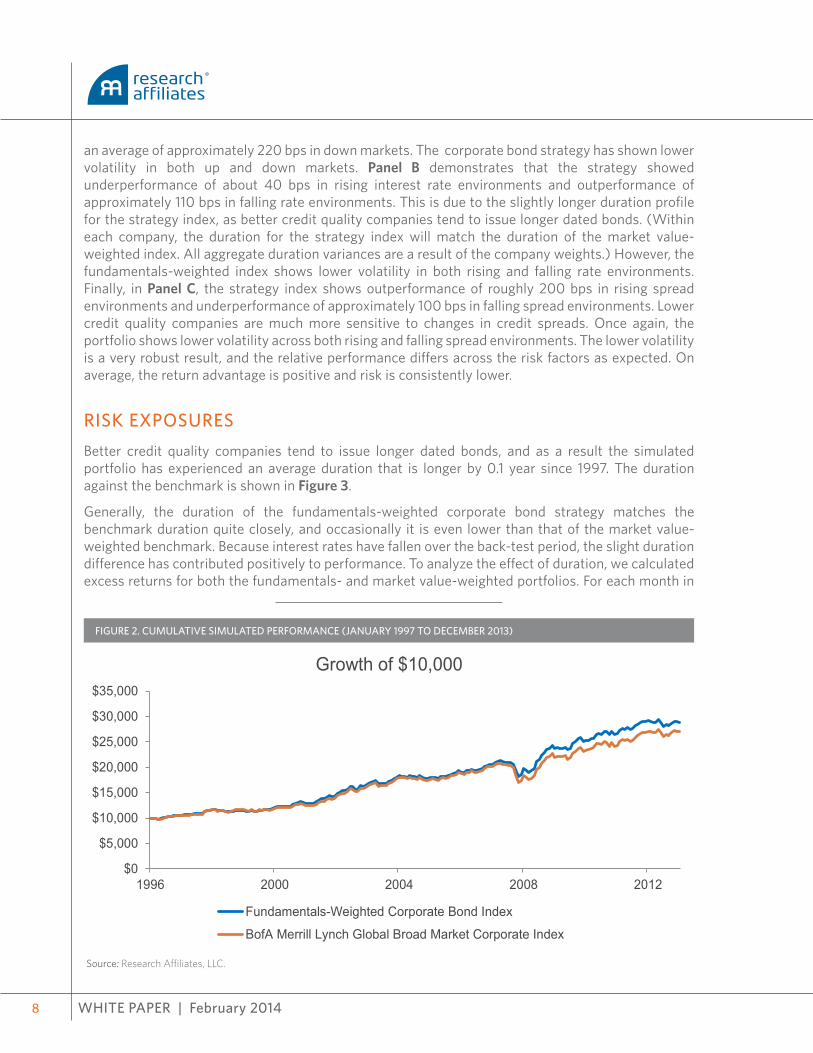
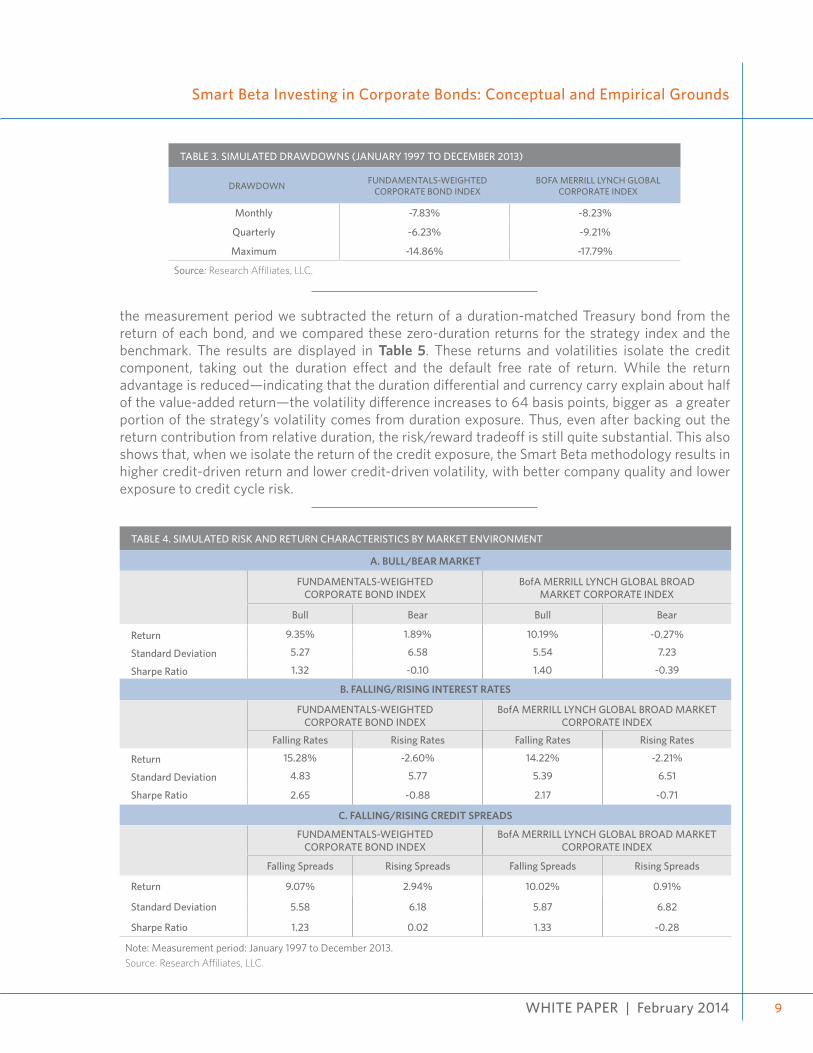
The cumulative returns are depicted graphically in Figure 2. As expected, the hypothetical portfolio holds up better in market downturns; during periods of crisis, it is the higher leverage and lower cash flow coverage companies that deliver strongly negative returns. Avoiding this risk pays off during crisis periods, such as 2008. This leads to lower drawdowns and better ability to preserve capital, as shown in Table 3: the maximum loss over monthly, quarterly, and annual periods are all less for the strategy index. On the flip side, we see underperformance when credit conditions improve and the less creditworthy part of the market rallies.
More generally, Table 4 shows the return and risk profile across various market environments. Panel A shows that the fundamentals-weighted strategy hypothetically underperformed the market value-weighted benchmark by an average of approximately 80 bps in rising markets, and outperformed by
TABLE 2. SIMULATED PERFORMANCE AND CHARACTERISTICS
PORTFOLIO ANNUALIZED RETURN
ANNUALIZED STANDARD DEVIATION
SHARPE RATIO YIELD DURATION OAS TRACKING
ERROR
Fundamentals-Weighted Corporate Bond Index 6.43% 5.90% 0.67 4.76% 5.49 128 1.16%
Cash Flow Weighted 6.46% 5.91% 0.67 4.73% 5.48 128 1.17%
Long-Term Assets Weighted 6.29% 6.17% 0.62 4.82% 5.38 132 0.99%
BofA Merrill Lynch Global Broad Market Corporate Index 6.04% 6.42% 0.55 4.73% 5.35 135 —
Note: Measurement period January 1997 to December 2013.
Source: Research Affiliates, LLC.
WHITE PAPER | February 20148
an average of approximately 220 bps in down markets. The corporate bond strategy has shown lower volatility in both up and down markets. Panel B demonstrates that the strategy showed underperformance of about 40 bps in rising interest rate environments and outperformance of approximately 110 bps in falling rate environments. This is due to the slightly longer duration profile for the strategy index, as better credit quality companies tend to issue longer dated bonds. (Within each company, the duration for the strategy index will match the duration of the market value-weighted index. All aggregate duration variances are a result of the company weights.) However, the fundamentals-weighted index shows lower volatility in both rising and falling rate environments. Finally, in Panel C, the strategy index shows outperformance of roughly 200 bps in rising spread environments and underperformance of approximately 100 bps in falling spread environments. Lower credit quality companies are much more sensitive to changes in credit spreads. Once again, the portfolio shows lower volatility across both rising and falling spread environments. The lower volatility is a very robust result, and the relative performance differs across the risk factors as expected. On average, the return advantage is positive and risk is consistently lower.
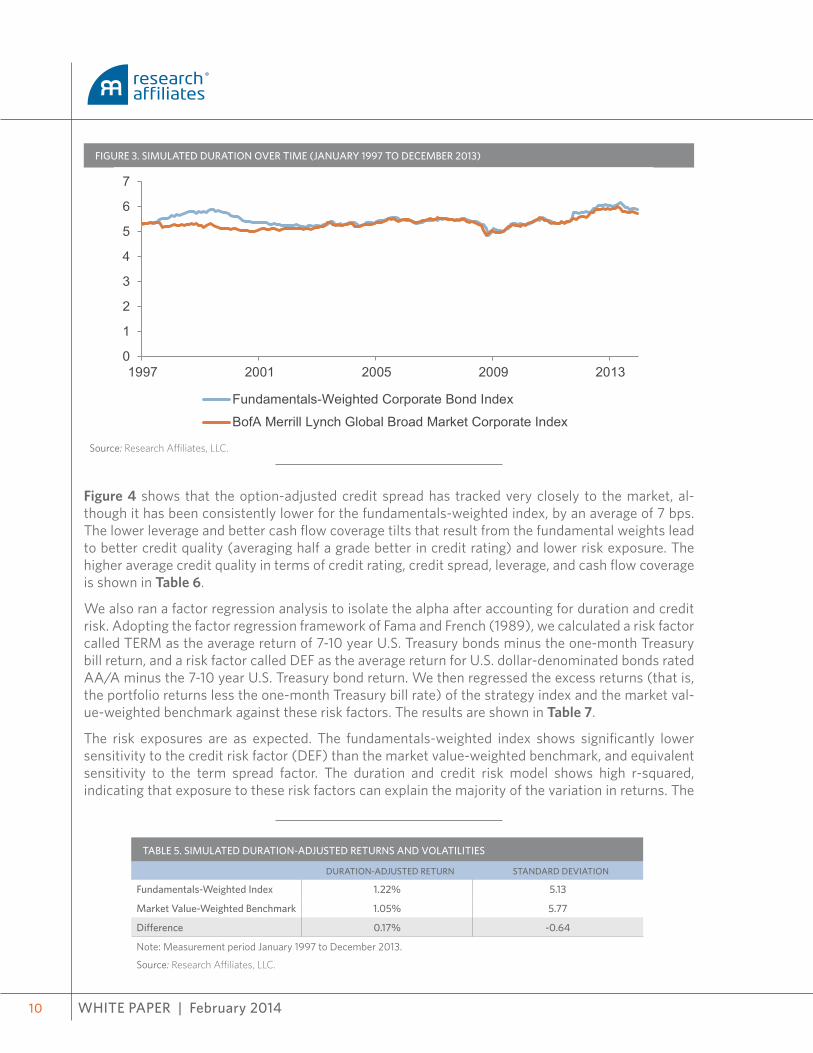
RISK EXPOSURESBetter credit quality companies tend to issue longer dated bonds, and as a result the simulated portfolio has experienced an average duration that is longer by 0.1 year since 1997. The duration against the benchmark is shown in Figure 3.
Generally, the duration of the fundamentals-weighted corporate bond strategy matches the benchmark duration quite closely, and occasionally it is even lower than that of the market value-weighted benchmark. Because interest rates have fallen over the back-test period, the slight duration difference has contributed positively to performance. To analyze the effect of duration, we calculated excess returns for both the fundamentals- and market value-weighted portfolios. For each month in
FIGURE 2. CUMULATIVE SIMULATED PERFORMANCE (JANUARY 1997 TO DECEMBER 2013)
Source: Research Affiliates, LLC.
$0
$5,000
$10,000
$15,000
$20,000
$25,000
$30,000
$35,000
1996 2000 2004 2008 2012
Growth of $10,000
Fundamentals-Weighted Corporate Bond Index
BofA Merrill Lynch Global Broad Market Corporate Index
WHITE PAPER | February 2014
Smart Beta Investing in Corporate Bonds: Conceptual and Empirical Grounds
9
TABLE 3. SIMULATED DRAWDOWNS (JANUARY 1997 TO DECEMBER 2013)
DRAWDOWN FUNDAMENTALS-WEIGHTEDCORPORATE BOND INDEX
BOFA MERRILL LYNCH GLOBALCORPORATE INDEX
Monthly -7.83% -8.23%
Quarterly -6.23% -9.21%
Maximum -14.86% -17.79%
Source: Research Affiliates, LLC.
the measurement period we subtracted the return of a duration-matched Treasury bond from the return of each bond, and we compared these zero-duration returns for the strategy index and the benchmark. The results are displayed in Table 5. These returns and volatilities isolate the credit component, taking out the duration effect and the default free rate of return. While the return advantage is reduced—indicating that the duration differential and currency carry explain about half of the value-added return—the volatility difference increases to 64 basis points, bigger as a greater portion of the strategy’s volatility comes from duration exposure. Thus, even after backing out the return contribution from relative duration, the risk/reward tradeoff is still quite substantial. This also shows that, when we isolate the return of the credit exposure, the Smart Beta methodology results in higher credit-driven return and lower credit-driven volatility, with better company quality and lower exposure to credit cycle risk.
TABLE 4. SIMULATED RISK AND RETURN CHARACTERISTICS BY MARKET ENVIRONMENT
A. BULL/BEAR MARKET
FUNDAMENTALS-WEIGHTEDCORPORATE BOND INDEX
BofA MERRILL LYNCH GLOBAL BROADMARKET CORPORATE INDEX
Bull Bear Bull Bear
Return 9.35% 1.89% 10.19% -0.27%
Standard Deviation 5.27 6.58 5.54 7.23
Sharpe Ratio 1.32 -0.10 1.40 -0.39
B. FALLING/RISING INTEREST RATES
FUNDAMENTALS-WEIGHTEDCORPORATE BOND INDEX
BofA MERRILL LYNCH GLOBAL BROAD MARKET CORPORATE INDEX
Falling Rates Rising Rates Falling Rates Rising Rates
Return 15.28% -2.60% 14.22% -2.21%
Standard Deviation 4.83 5.77 5.39 6.51
Sharpe Ratio 2.65 -0.88 2.17 -0.71
C. FALLING/RISING CREDIT SPREADS
FUNDAMENTALS-WEIGHTEDCORPORATE BOND INDEX
BofA MERRILL LYNCH GLOBAL BROAD MARKET CORPORATE INDEX
Falling Spreads Rising Spreads Falling Spreads Rising Spreads
Return 9.07% 2.94% 10.02% 0.91%
Standard Deviation 5.58 6.18 5.87 6.82
Sharpe Ratio 1.23 0.02 1.33 -0.28
Note: Measurement period: January 1997 to December 2013.Source: Research Affiliates, LLC.
WHITE PAPER | February 201410
FIGURE 3. SIMULATED DURATION OVER TIME (JANUARY 1997 TO DECEMBER 2013)
Source: Research Affiliates, LLC.
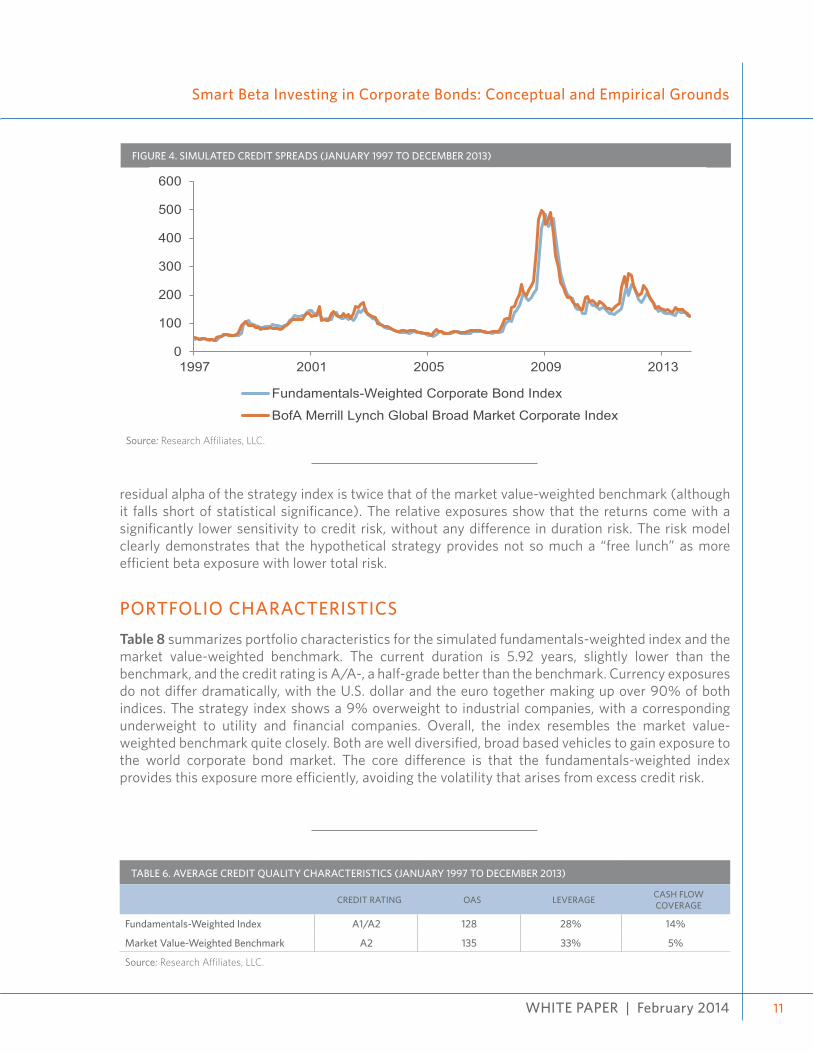
Figure 4 shows that the option-adjusted credit spread has tracked very closely to the market, al-though it has been consistently lower for the fundamentals-weighted index, by an average of 7 bps. The lower leverage and better cash flow coverage tilts that result from the fundamental weights lead to better credit quality (averaging half a grade better in credit rating) and lower risk exposure. The higher average credit quality in terms of credit rating, credit spread, leverage, and cash flow coverage is shown in Table 6.
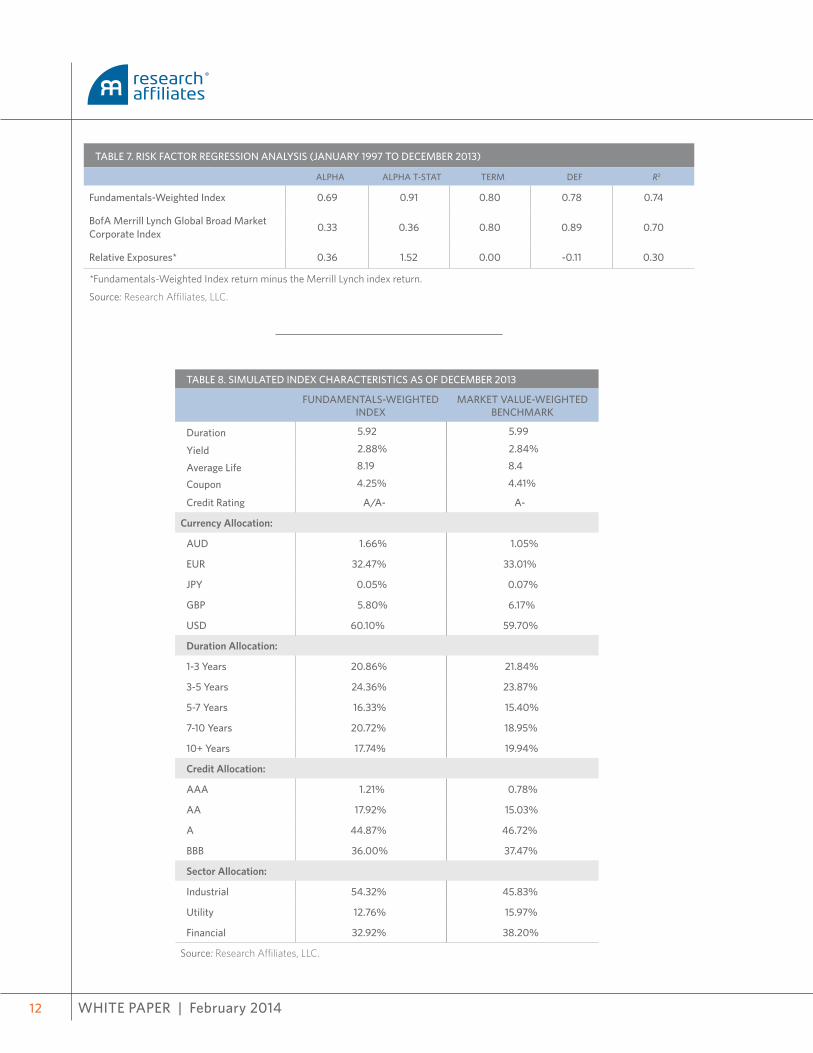
We also ran a factor regression analysis to isolate the alpha after accounting for duration and credit risk. Adopting the factor regression framework of Fama and French (1989), we calculated a risk factor called TERM as the average return of 7-10 year U.S. Treasury bonds minus the one-month Treasury bill return, and a risk factor called DEF as the average return for U.S. dollar-denominated bonds rated AA/A minus the 7-10 year U.S. Treasury bond return. We then regressed the excess returns (that is, the portfolio returns less the one-month Treasury bill rate) of the strategy index and the market val-ue-weighted benchmark against these risk factors. The results are shown in Table 7.
The risk exposures are as expected. The fundamentals-weighted index shows significantly lower sensitivity to the credit risk factor (DEF) than the market value-weighted benchmark, and equivalent sensitivity to the term spread factor. The duration and credit risk model shows high r-squared, indicating that exposure to these risk factors can explain the majority of the variation in returns. The
TABLE 5. SIMULATED DURATION-ADJUSTED RETURNS AND VOLATILITIES
DURATION-ADJUSTED RETURN STANDARD DEVIATION
Fundamentals-Weighted Index 1.22% 5.13
Market Value-Weighted Benchmark 1.05% 5.77
Difference 0.17% -0.64
Note: Measurement period January 1997 to December 2013.
Source: Research Affiliates, LLC.
0
1
2
3
4
5
6
7
1997 2001 2005 2009 2013
Fundamentals-Weighted Corporate Bond Index
BofA Merrill Lynch Global Broad Market Corporate Index
WHITE PAPER | February 2014
Smart Beta Investing in Corporate Bonds: Conceptual and Empirical Grounds
11
residual alpha of the strategy index is twice that of the market value-weighted benchmark (although it falls short of statistical significance). The relative exposures show that the returns come with a significantly lower sensitivity to credit risk, without any difference in duration risk. The risk model clearly demonstrates that the hypothetical strategy provides not so much a “free lunch” as more efficient beta exposure with lower total risk.
PORTFOLIO CHARACTERISTICSTable 8 summarizes portfolio characteristics for the simulated fundamentals-weighted index and the market value-weighted benchmark. The current duration is 5.92 years, slightly lower than the benchmark, and the credit rating is A/A-, a half-grade better than the benchmark. Currency exposures do not differ dramatically, with the U.S. dollar and the euro together making up over 90% of both indices. The strategy index shows a 9% overweight to industrial companies, with a corresponding underweight to utility and financial companies. Overall, the index resembles the market value-weighted benchmark quite closely. Both are well diversified, broad based vehicles to gain exposure to the world corporate bond market. The core difference is that the fundamentals-weighted index provides this exposure more efficiently, avoiding the volatility that arises from excess credit risk.
FIGURE 4. SIMULATED CREDIT SPREADS (JANUARY 1997 TO DECEMBER 2013)
Source: Research Affiliates, LLC.
TABLE 6. AVERAGE CREDIT QUALITY CHARACTERISTICS (JANUARY 1997 TO DECEMBER 2013)
CREDIT RATING OAS LEVERAGE CASH FLOWCOVERAGE
Fundamentals-Weighted Index A1/A2 128 28% 14%
Market Value-Weighted Benchmark A2 135 33% 5%
Source: Research Affiliates, LLC.
0
100
200
300
400
500
600
1997 2001 2005 2009 2013
Fundamentals-Weighted Corporate Bond Index
BofA Merrill Lynch Global Broad Market Corporate Index
WHITE PAPER | February 201412
TABLE 7. RISK FACTOR REGRESSION ANALYSIS (JANUARY 1997 TO DECEMBER 2013)
ALPHA ALPHA T-STAT TERM DEF R2
Fundamentals-Weighted Index 0.69 0.91 0.80 0.78 0.74
BofA Merrill Lynch Global Broad Market Corporate Index 0.33 0.36 0.80 0.89 0.70
Relative Exposures* 0.36 1.52 0.00 -0.11 0.30
*Fundamentals-Weighted Index return minus the Merrill Lynch index return.
Source: Research Affiliates, LLC.
TABLE 8. SIMULATED INDEX CHARACTERISTICS AS OF DECEMBER 2013
FUNDAMENTALS-WEIGHTED INDEX
MARKET VALUE-WEIGHTED BENCHMARK
Duration 5.92 5.99
Yield 2.88% 2.84%
Average Life 8.19 8.4
Coupon 4.25% 4.41%
Credit Rating A/A- A-
Currency Allocation:
AUD 1.66% 1.05%
EUR 32.47% 33.01%
JPY 0.05% 0.07%
GBP 5.80% 6.17%
USD 60.10% 59.70%
Duration Allocation:
1-3 Years 20.86% 21.84%
3-5 Years 24.36% 23.87%
5-7 Years 16.33% 15.40%
7-10 Years 20.72% 18.95%
10+ Years 17.74% 19.94%
Credit Allocation:
AAA 1.21% 0.78%
AA 17.92% 15.03%
A 44.87% 46.72%
BBB 36.00% 37.47%
Sector Allocation:
Industrial 54.32% 45.83%
Utility 12.76% 15.97%
Financial 32.92% 38.20%
Source: Research Affiliates, LLC.
WHITE PAPER | February 2014
Smart Beta Investing in Corporate Bonds: Conceptual and Empirical Grounds
13
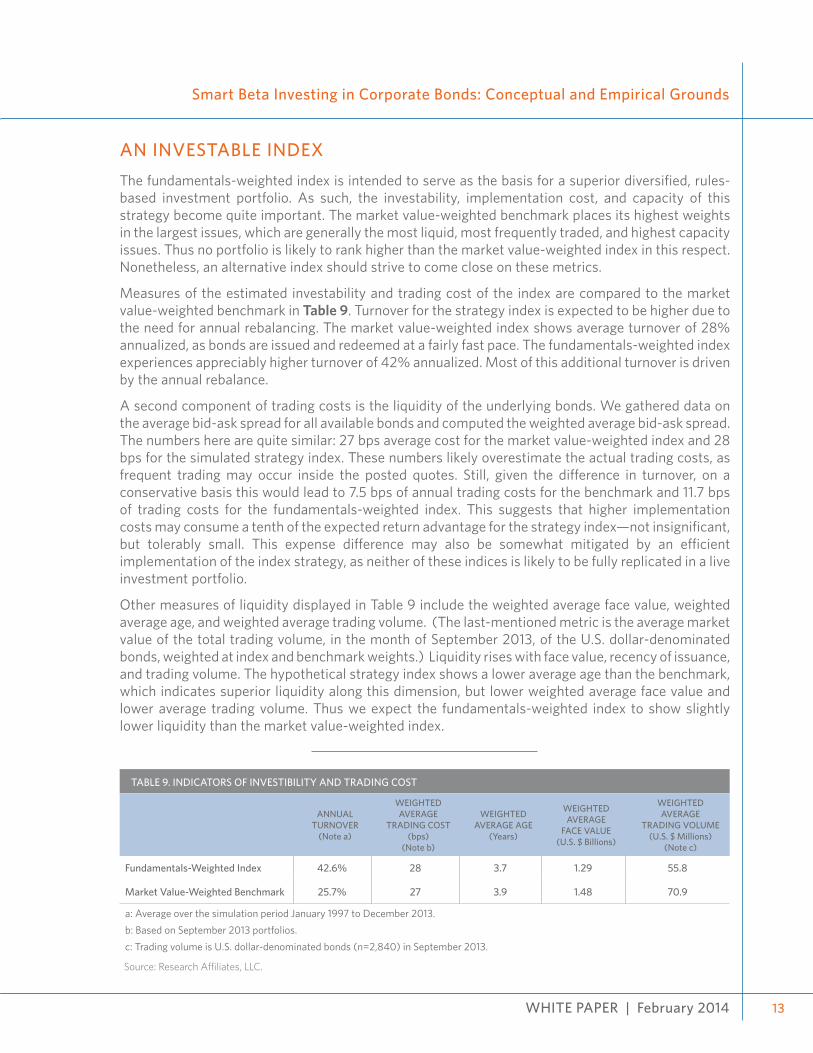
TABLE 9. INDICATORS OF INVESTIBILITY AND TRADING COST
ANNUAL TURNOVER
(Note a)
WEIGHTED AVERAGE
TRADING COST(bps)
(Note b)
WEIGHTED AVERAGE AGE
(Years)
WEIGHTED AVERAGE
FACE VALUE(U.S. $ Billions)
WEIGHTED AVERAGE
TRADING VOLUME(U.S. $ Millions)
(Note c)
Fundamentals-Weighted Index 42.6% 28 3.7 1.29 55.8
Market Value-Weighted Benchmark 25.7% 27 3.9 1.48 70.9
a: Average over the simulation period January 1997 to December 2013.b: Based on September 2013 portfolios.c: Trading volume is U.S. dollar-denominated bonds (n=2,840) in September 2013.
Source: Research Affiliates, LLC.
AN INVESTABLE INDEXThe fundamentals-weighted index is intended to serve as the basis for a superior diversified, rules-based investment portfolio. As such, the investability, implementation cost, and capacity of this strategy become quite important. The market value-weighted benchmark places its highest weights in the largest issues, which are generally the most liquid, most frequently traded, and highest capacity issues. Thus no portfolio is likely to rank higher than the market value-weighted index in this respect. Nonetheless, an alternative index should strive to come close on these metrics.
Measures of the estimated investability and trading cost of the index are compared to the market value-weighted benchmark in Table 9. Turnover for the strategy index is expected to be higher due to the need for annual rebalancing. The market value-weighted index shows average turnover of 28% annualized, as bonds are issued and redeemed at a fairly fast pace. The fundamentals-weighted index experiences appreciably higher turnover of 42% annualized. Most of this additional turnover is driven by the annual rebalance.
A second component of trading costs is the liquidity of the underlying bonds. We gathered data on the average bid-ask spread for all available bonds and computed the weighted average bid-ask spread. The numbers here are quite similar: 27 bps average cost for the market value-weighted index and 28 bps for the simulated strategy index. These numbers likely overestimate the actual trading costs, as frequent trading may occur inside the posted quotes. Still, given the difference in turnover, on a conservative basis this would lead to 7.5 bps of annual trading costs for the benchmark and 11.7 bps of trading costs for the fundamentals-weighted index. This suggests that higher implementation costs may consume a tenth of the expected return advantage for the strategy index—not insignificant, but tolerably small. This expense difference may also be somewhat mitigated by an efficient implementation of the index strategy, as neither of these indices is likely to be fully replicated in a live investment portfolio.
Other measures of liquidity displayed in Table 9 include the weighted average face value, weighted average age, and weighted average trading volume. (The last-mentioned metric is the average market value of the total trading volume, in the month of September 2013, of the U.S. dollar-denominated bonds, weighted at index and benchmark weights.) Liquidity rises with face value, recency of issuance, and trading volume. The hypothetical strategy index shows a lower average age than the benchmark, which indicates superior liquidity along this dimension, but lower weighted average face value and lower average trading volume. Thus we expect the fundamentals-weighted index to show slightly lower liquidity than the market value-weighted index.
WHITE PAPER | February 201414
Finally, we considered capacity. Any strategy requires adequate capacity, lest fund flows swamp the manager’s ability to invest in accordance with that strategy. Small-capacity strategies will see their return advantage quickly erode as investment dollars push prices. Because the strategy index weights are based upon measures of fundamental size, the weights tend to rise with issuance and, in aggregate, therefore, they provide relatively high capacity. We consider the capacity of each individual company to be filled when the assets under management require owning more than a certain percentage of a company’s outstanding bonds. The portfolio reaches capacity when additional flows cannot be invested without exceeding a specified percentage of capacity, summed across all companies. Depending upon reasonably small values for these two parameters, investment capacity for the simulated corporate bond strategy is estimated in the range of tens of billions of U.S. dollars.
CONCLUSIONTraditional corporate bond benchmark indices are weighted according to market value, a methodol-ogy which gives the largest weights to the companies that have issued the most debt. This results in a bias towards riskier companies with higher leverage and weaker cash flow coverage. Unfortunately these companies have not delivered a return premium as compensation for their elevated risk, lead-ing to a poor risk/return tradeoff. The strategy index described in this paper weights companies ac-cording to fundamental measures, resulting in a tilt towards lower leverage and higher cash flow coverage companies. An additional financial ratio screen reduces exposure to financially troubled companies at higher risk of downgrades. The result is an index that potentially serves as the basis for a superior investible portfolio, with lower credit risk exposure yet higher expected return—a more efficient exposure to the beta available in the credit markets.
WHITE PAPER | February 2014
Smart Beta Investing in Corporate Bonds: Conceptual and Empirical Grounds
15
REFERENCES
Ak, B. Korcan, Patricia M. Dechow, Yuan Sun, and Annika Yu Wang. 2013. “The Use of Financial Ratio Models to Help Investors Predict and Interpret Significant Corporate Events.” Working Paper, University of California Berkeley and Boston University.
Altman, Edward I. 1968. “Financial Ratios, Discriminant Analysis and the Prediction of Corporate Bankruptcy.” Journal of Fi-nance, vol. 23, no. 4 (September):589-609.
Arnott, Robert D., Jason C. Hsu, Feifei Li, and Shane D. Shepherd. 2010. “Valuation-Indifferent Weighting for Bonds.” Journal of Portfolio Management, vol. 36 no. 3 (Spring):117-130.
Becker, Bo, and Victoria Ivashina. 2013. “Reaching for Yield in the Bond Market.” Harvard Business School Finance Working Paper No. 12-103.
Campbell, John Y., Jens Hilscher, and Jan Szilagyi. 2008. “In Search of Distress Risk.” Journal of Finance, vol. 63, no. 6 (Decem-ber):2899-2939.
Fama, Eugene F., and Kenneth R. French. 1989. “Business Conditions and Expected Returns on Stocks and Bonds.” Journal of Financial Economics, vol. 25 no. 1 (November):23-49.
Gebhardt, William R., Soeren Hvidkjaer, and Bhaskaran Swaminathan. 2005. “Stock and Bond Market Interaction: Does Mo-mentum Spill Over?” Journal of Financial Economics, vol. 75, no. 3 (March):651-690.
Jostova, Gergana, Stanislava Nikolova, Alexander Philipov, and Christof W. Stahel. 2013. “Momentum in Corporate Bond Re-turns.” Review of Financial Studies, vol. 26 no. 7 (July):1649-1693.
Kalesnik, Vitali. 2013. “A Note on Simulated Returns.” Research Affiliates White Paper (August).
Lin, Hai, Junbo Wang, and Chunchi Wu. 2013. “Liquidity Risk and Momentum Spillover from Stocks to Bonds.” Journal of Fixed Income, vol. 23, no. 1 (Summer):5-42.
Shepherd, Shane D. 2011. “Fundamental Index® Fixed-Income Performance: It’s All in the Price.” Journal of Index Investing, vol. 1 no. 4 (Spring):75-80.
Shumway, Tyler. 2001. “Forecasting Bankruptcy More Accurately: A Simple Hazard Model.” Journal of Business, vol. 74 no. 1 (January):101-124.
ENDNOTES
1. Kalesnik (2013) describes Research Affiliates’ approach to back-testing equity strategies. The fixed income research group uses a similarly disciplined approach.
2. See, for example, Becker and Ivashina (2013).
3. See Gebhardt, Hvidkjaer, and Swaminathan (2005) and Lin, Wang, and Wu (2013).
4. Ak, Dechow, Sun, and Wang (2013) review the academic literature. Other prominent papers include Altman (1968); Shumway (2001); Campbell, Hilscher, and Sziagyi (20v08).
5. See, for example, Jostova, Nikolova, Philipov, and Stahel (2013).
By accepting this document you agree to keep its contents confidential and not to use the information contained in this document, and in the other materials you will be provided with, for any purpose other than for considering a participation in the proposed transactions. You also agree not to disclose information regarding the transactions to anyone within your organization other than those required to know such in-formation for the purpose of analyzing or approving such participation. No disclosure may be made to third parties (including potential co-investors) regarding any information disclosed in this presentation without the prior permission of Research Affiliates, LLC. The material contained in this document is for information purposes only. This material is not intended as an offer or solicitation for the purchase or sale of any security or financial instrument, nor is it advice or a recommendation to enter into any transaction. Research Affiliates and its related entities do not warrant the accuracy of the information provided herein, either expressed or implied, for any particular purpose. THE INDEX DATA PUBLISHED HEREIN IS SIMULATED, UNMANAGED AND CANNOT BE INVESTED IN DIRECTLY. PAST SIMULATED PERFORMANCE IS NO GUARANTEE OF FUTURE PERFORMANCE AND IS NOT INDICATIVE OF ANY SPECIFIC INVESTMENT. ACTUAL INVESTMENT RESULTS MAY DIFFER. The simulated data contained herein is based on the patented non-capitalization weighted indexing system, method and computer program product (see Robert D. Arnott, Jason Hsu and Philip Moore. 2005. “Fundamental Indexation.” Finan-cial Analysts Journal [March/April]:83-99).Any information and data pertaining to indexes contained in this document relates only to the index itself and not to any asset management product based on the index. No allowance has been made for trading costs, management fees, or other costs associated with asset management as the information provided relates only to the index itself. With the exception of the data on Research Affiliates Fundamental Index, all other information and data are based on information and data available from public sources.Investors should be aware of the risks associated with data sources and quantitative processes used in our investment management process. Errors may exist in data acquired from third party vendors, the construction of model portfolios, and in coding related to the index and portfolio construction process. While Research Affiliates takes steps to identify data and process errors so as to minimize the potential impact of such errors on index and portfolio performance, we cannot guarantee that such errors will not occur.The trade names Fundamental Index®, RAFI®, the RAFI logo, and the Research Affiliates® corporate name and logo are registered trademarks and are the exclusive intellectual property of Research Affiliates, LLC. Any use of these trade names and logos without the prior written permission of Research Affiliates, LLC is expressly prohibited. Research Affiliates, LLC reserves the right to take any and all necessary action to preserve all of its rights, title and interest in and to these marks. Fundamental Index® concept, the non-capitalization method for creating and weighting of an index of securities which is patented and pat-ent-pending proprietary intellectual property of Research Affiliates, LLC. (See all applicable US patent and pending patent disclosures lo-cated at http://www.researchaffiliates.com/Pages/legal.aspx#d, which are fully incorporated herein as if set out herein at length).©Research Affiliates, LLC.


620 Newport Center Drive, Suite 900 Newport Beach, CA 92660 Main: +1 949.325.8700 www.researchaffiliates.com