small business retirement plan availability and worker ... business... · small business retirement...
TRANSCRIPT
Small Business Retirement Plan Availability and Worker Participation
by
Kathryn Kobe
Economic Consulting Services, LLC Washington, DC 20036
for
under contract number SBA-HQ-06M0477
Release Date: March 2010
This contract was developed under a contract with the Small Business Administration, Office of Advocacy, and contains information and analysis that was reviewed by officials of the Office of Advocacy. However, the final conclusions of the report do not necessarily reflect the views of the Office of Advocacy.

Table of Contents
Executive Summary ......................................................................................................... v Introduction ...................................................................................................................... 1
Background ................................................................................................................. 1 Savings Behavior and Confidence Levels .................................................................. 1 Basic Types of Retirement Plans Available ................................................................ 4
Section 1: Retirement Plan Coverage in the Private Sector ............................................ 5 Information from SIPP ................................................................................................ 6 Coverage and Participation of Private Sector Workers .............................................. 6 Private Sector Workers by Firm Size and Other Characteristics ................................ 7
Section 2: Participation in Retirement Plans ................................................................ 11 Distribution of Respondents by Plan Type and Firm Size ........................................ 14 Change in Plan Types 1998-2006 ............................................................................. 17
Section 3: Why Are Workers Not in Plans? ................................................................. 21 Businesses that Do Not Offer Plans .......................................................................... 21 Why Workers Do Not Participate ............................................................................. 22
Section 4: Contributions ............................................................................................... 27 Section 5: Policy Implications ...................................................................................... 29
Small Business Specific Plans .................................................................................. 29 Balancing Policy Goals ............................................................................................. 32 Possible Alternatives for Retirement Savings ........................................................... 35
Section 6: Conclusions .................................................................................................. 36 Appendix A: Data .......................................................................................................... 39 Appendix B: Additional Tables ..................................................................................... 41 Appendix C: Demographics and Characteristics of Government Workers and
Their Access to Retirement Plans ............................................................................ 53 Bibliography .................................................................................................................. 55
iii

Executive Summary
Americans will typically live almost 20 years past what has traditionally been
considered retirement age. Yet, a variety of circumstances have made income security in those
post-retirement years less certain. The number of companies offering the traditional defined
benefit pension (DB) plan has been steadily declining and close to half of the workforce, about
58 million workers, do not have access to any type of retirement plan through their place of
work.1 In addition, almost 20 million workers do not participate in the retirement plans that
their employers sponsor. Nor are people saving for retirement outside of these workplace
offerings, each year only about 5 million people make contributions to Individual Retirement
Accounts (IRAs) and 1 million to Keogh self-employment retirement plans. This lack of
consistent savings for use during retirement years may leave workers increasingly dependent
on payments from the Social Security system for their post-retirement income.
This study looks at the access and participation of workers in retirement plans offered
by their employers. It examines those issues by firm size and finds that workers in large and
small firms participate at very similar rates if a retirement plan is made available to them. 2 It
also analyzes the reasons workers do not participate even when the employer sponsors a
retirement plan. It then discusses several of the issues that face policymakers and how those
must be balanced to result in the best outcome.
There are significant benefits to workers from employer-sponsored retirement plans
when compared to individual opportunities to save for retirement. Having a system whereby
payroll deductions can be made on a regular and automatic basis is one proposal to encourage
people to save for retirement rather than depending solely on an individual’s savings decision
alone. In addition, the fiduciary responsibilities of the plan sponsor mean that at least some
minimal amount of information is provided to workers about the retirement plan and the
savings options are not overly risky. However, sponsoring a retirement plan is voluntary for
private businesses and many businesses, especially small businesses, do not take on the
1 These numbers are based on the findings of the 2004 SIPP survey wave conducted in 2006 and do not include the workers who have been separated from their business-sponsored retirement plans during the 2007/2008 recession. 2 Small firms in this instance are defined to be those with less than 100 employees.
v

vi
responsibilities of sponsoring a plan. That means that the largest group of workers not
participating in retirement plans (over 40 million workers) are those that work for the majority
of small firms who do not sponsor a retirement plan.
To increase retirement plan participation among small businesses requires an increase
in the participation rate of small firms as partners in the overall retirement funding process.
While government has made an effort to simplify retirement plans in order to encourage more
small businesses to sponsor them, those efforts have been met with limited success and they
come with a cost. To reduce the burden of the system on the sponsor also means that there may
also be a reduction in some of the beneficial aspects of the system. Some of the most
burdensome nondiscrimination rules are designed to encourage a more equal distribution of
retirement benefits within firms. These rules help balance the ability of highly compensated
workers who want to save the maximum allowable amount in the system with incentives to
provide information, education and possibly incentives to encourage other non-highly
compensated workers to participate in the plan. That helps to increase all participants’ savings.
Another relatively large group of non-participants are the 20 million workers who do
not participate in a retirement plan even though their employer sponsors a plan. The reasons
that these workers give for not participating vary little between small and large firms. Many
think they are not eligible to participate in the plans because of too few hours of work a year or
too few years of service. Another group thinks they cannot afford to participate or do not want
to tie the money up. Still others are simply too confused about the retirement plan options.
Studies show that automatic enrollment in a retirement plan will increase the
percentage of people that participate. However, this also presents a balancing of policy goals.
Automatic enrollment for all participants is likely to increase the number of participants but
could well decrease the amount saved by what would otherwise be the most active participants.
Good financial education could reduce that outcome but, in turn, would put more burdens on
the sponsors of the plans.
Encouraging more savings for retirement by American workers is a worthwhile policy
goal in order to increase income security among the elderly. However, the current system of
voluntary private industry retirement plans is complex and leaves a large percentage of workers
without access to a work-based system for retirement saving. There is no single policy action
that will resolve these issues.

Introduction
Background The three-legged stool has been used as a metaphor for describing the methods of
achieving financial security in retirement since the 1940s.3 It is meant to convey the concept that Social Security provides one basic foundation of income security for retirement, and pensions and individual savings/investments provide the other two “legs” of the stool to support individuals during their retirement years. The legally-mandated Social Security system is financed by employers and employees paying taxes through the payroll system. However, the pension system in the United States is a voluntary one. That gives employers a choice about whether or not to provide a retirement plan. If a retirement plan is provided, the employer has a fair amount of discretion over its structure provided the plan meets the rules of the Employment Retirement Income Security Act (ERISA) of 1974 or one of the special small-business- oriented retirement plans.
There have been many discussions about the relative strengths of the “legs” of the stool given an aging population, a weak U.S. savings rate and businesses that have increasingly stopped offering the traditional, defined benefit (DB) pension plan. Yet, at age 65, traditionally considered retirement age, men on average can expect to live an additional 17 years and women can expect to live an additional 19.7 years.4 Roughly half of this age group will live longer. Thus, it becomes an important policy question whether retirees will have enough income available to them to live comfortably and to stay out of poverty during the remainder of their lives.
Savings Behavior and Confidence Levels More than half of the U.S. workforce does not participate in a retirement plan at
their place of work. Almost half, 47 percent, of workers in 2006 (over 50 million) worked for a company that did not sponsor a retirement plan. Most of these workers are not
3 The Social Security Administration identifies the first user of the phrase as Reinhard Hohaus of the Metropolitan Life Insurance Company in 1949. Social Security Administration Research Note #1 of the Historian’s Office, Origins of the Three-Legged Stool Metaphor for Social Security. 4 Deaths: Final Data for 2006, Table 7. National Vital Statistics Report, Volume 57, No. 14, Centers for Disease Control, April 2009. In reality, for workers born after 1937, the age at which a worker may claim full Social Security benefits is older than 65. For workers born after 1960 that age is 67. For workers born between 1938 and 1959, the age varies from 65 years and 2 months to 66 years and 10 months. See www.socialsecurity.gov.
1

making any contributions to a dedicated retirement account. 5 ,6 The Federal Reserve Board’s most recent Survey of Consumer Finances (SCF) showed that almost 53 percent of households had a retirement account as one of their assets in 2007, a small improvement from slightly less than 50 percent that reported having one in 2004.7 About 61 percent of the households whose head of household was age 55-64 held such an account compared to only 30 percent of those 75 and older and 42 percent of those younger than 35.8 In a more detailed analysis of these 2007 SCF data for the age group closest to retirement, Watson Wyatt found that a third of them had no money in a retirement account at all.9 Another 28 percent had a year’s worth of earnings or less saved and another quarter reported having 3 years or less of average earnings saved. Only 11 percent reported having 4 years of earnings saved.10 Thus, it is likely that a number of retirees will be increasingly dependent on the Social Security system for their well-being with many probably supplementing their income by working at least part time.11
In its 2009 Retirement Confidence Survey, the Employee Benefit Research Institute (EBRI) reported a record low 13 percent of workers as being very confident that they will have accumulated enough money to live comfortably throughout their retirement years, down from 27 percent of workers who felt very confident about such an
5 Individuals may make tax deferred contributions to accounts specifically set up for the purpose of accumulating retirement savings. These contributions can be made to an employer-sponsored plan and/or an individual plan although there are limits on the total amount of money that can be tax deferred. In addition, individuals may make contributions that are not tax deferred to certain types of retirement plans. 6 The IRS reported that in 2006 3.2 million tax returns (2.3 percent of the 138.4 million filed) reported a payment to an Individual Retirement Account (IRA) and 1.2 million tax returns (0.9 percent of the total filed) reported payments to a self-employed retirement (Keogh) plan. Statistics of Income Bulletin, Figure D, page 8. 7 Bucks, B., A. Kennickell, T. Mach and K. Moore. “Changes in U.S. Family Finances from 2004 to 2007: Evidence from the Survey of Consumer Finances,” Federal Reserve Bulletin, February 2009, pp. A2-A56. Table 6. 8 The relatively low rate for the oldest households may reflect the fact that it is the age group that had less opportunity to build retirement account assets during their working years since many of these options did not become widespread until the last 20-30 years. It may also reflect the legal requirement that individuals must begin taking money out of some of these accounts at age 70½. Consequently, some older households may have already exhausted their accounts or moved that money to other types of assets. 9 This study focused on households with a head or spouse age 55-64 and defined a retirement account as an IRA or any 401(k) from a current or former job. 10 “Retirement Prospects Dim for Many Near-Retirees,” Watson and Wyatt Worldwide, 2009. 11 Some analysts refer to work as the “fourth leg” of the stool for income security.
2
outcome in 2007.12 While the latter result was undoubtedly influenced by the recession and sharp downturn in the financial markets during 2008, it seems likely that some workers will need to work longer to prop up their financial security as they age. A sign of people working longer is already evident. One in four people between the ages of 65 and 74 were in the labor force in 2006, up almost 4 percentage points since 2000.13 While this result may be related to better health in older years, this likely is also a signal of some unease about retirement savings as well.
Those concerns have been exacerbated by the rapid decline in the value of stocks and other financial assets during late 2008 and the sharp decline in the value of many workers’ largest asset, their home. The Federal Reserve’s latest data on the value of the assets of private pension funds showed a 33 percent decline between their peak at the end of 2007 and March 2009. 14 While the value of some of those assets has begun to rise since the economy has stabilized, a further problem, brought on by the recession, is the freezing of pension plans by their sponsors.15 Freezing of pension plans generally means that all or some of the employees covered by the plan stop earning benefits from the time the freeze takes effect and going forward.16 Many employers who make voluntary contributions to their employee’s defined contribution (DC) retirement plans have also chosen not to do so this year. It is unclear how soon these restrictions on the plans will be lifted and there will be some employers who make permanent changes in the plans. Furthermore, since the start of the recession in December 2007 through August 2009, over 7 million private sector workers have lost their jobs. That too reduces the number of individuals with access to a retirement plan and the ability to contribute to an Individual Retirement Account (IRA).17
12 Helman, R., J. Van Derhei, C. Copeland. The 2009 Retirement Confidence Survey: Economy Drives Confidence to Record Lows: Many Looking to Work Longer, EBRI, Issue Brief no. 338, April 2009. 13 New Census Bureau Data Reveal More Older Workers, Homeowners, Non-English Speakers, U.S. Census Bureau, U.S. Department of Commerce, September 12, 2007. 14 Flow of Funds, Federal Reserve Board, Z.1, September 17, 2009, Table L.118. 15 Only 607 of the Fortune 1000 offer a DB plan and of those over 30 percent have frozen their plan in 2009. Furthermore numerous companies have stopped making employer matches to their defined contribution (DC) plans. See Powell, R. “Don’t freeze pension plan,” MarketWatch, July 28, 2009. 16 Pension Rights Center. Pension Freezes, fact sheet. A DB plan’s accrued benefits cannot be reduced unless the Pension Benefit Guarantee Board requires it. A hard pension freeze will stop the accrual of future benefits for current workers, while a soft freeze prevents new participants in the plan. 17 Individuals who are vested in a retirement plan will still have a claim on their accrued retirement assets even if they lose their jobs and individuals will always have a claim to the money they have contributed to
3
With a relatively small proportion of workers actively saving for retirement and the American workforce getting older on average, retirement income security will continue to be a major policy issue for years to come. Many studies have shown that small businesses tend to offer fewer benefits to their employees than do large businesses.18 One of the benefits that small businesses are less likely to offer is a retirement plan. Based on the findings from Census data analyzed in this study, about 72 percent of employees working for small firms (those with fewer than 100 employees) in 2006, or almost 41 million workers, reported that there was no retirement plan offered where they work. In contrast, about 78 percent of the employees working for large firms (those with over 100 employees), or about 50 million workers, indicated that a retirement plan was available at the place where they work. This dichotomy means that resolving issues about retirement savings requires both a good understanding of the role businesses play and a better understanding of what determines workers choices about saving for retirement.
Basic Types of Retirement Plans Available The traditional pension plan, where a worker receives a payment at regular
intervals throughout retirement, generally based on years of service and earnings, is called a defined benefit (DB) plan. Funding for these plans is the responsibility of the employer (although sometimes the worker makes contributions) and the employer bears the investment risks of the pension plan over time. However, that type of plan has only been available to a limited number of workers and, over time, fewer and fewer companies have been offering DB plans.
The other main type of pension or retirement plan that employers offer is a defined contribution (DC) plan. This is a plan with individual accounts for each employee who participates in the plan and account balances include contributions made by the worker, the employer, or both as well as investment returns on these contributions. However, the ultimate payment to the retiree depends on the account balance at retirement which is determined by the amount of money that is contributed to the plan and the investment returns those contributions generate. There is no predetermined payout amount at retirement and there is no guarantee of lifetime payments from the
and the investment returns in their retirement plans. However, a separation from a job cuts off further access for making new contributions to that retirement plan and accruing investment returns. 18 GAO(2002), Popkin (2005)
4

plan.19 Furthermore, the responsibility for choosing investments for the money falls on the individual in a DC plan. Although employers sponsoring either a DC or a DB plan do have certain fiduciary responsibilities related to the investments.20
There is a type of DB plan called a cash balance plan that is something of a hybrid between the DB and DC plans. However, a relatively small percentage of workers participate in such plans. There are several types of DC plans, including some types that are specifically designed for small businesses. A more detailed discussion of the types of plans available to small businesses can be found in Section 5.
The purpose of this study is to look at the differences in pension availability and coverage for workers in small and large firms. It examines which employees have retirement plans available to them based on the employment size of the firm in which they work, which of those employees participate in a retirement plan as well as why employees do not participate in plans that are sponsored by their employers. The study analyzes data collected by the Survey of Income and Program Participation (SIPP) conducted by the U.S. Census Bureau and examines SIPP surveys fielded during 1998, 2003 and 2006.
Section 1: Retirement Plan Coverage in the Private Sector
The introduction presented the basic types of retirement plans available in the U.S. This section will examine what is known about the private sector workers that are in three general categories of retirement plan coverage. The first category consists of workers who have access to a retirement plan and participate in it. The second category is the workers whose employers sponsor a retirement plan but the workers do not participate in it. Finally, there is a category of workers whose employers do not sponsor a
19 Workers do sometimes annuitize all or a portion of their account balance at retirement in order to provide a steady income stream but that is an investment decision made by the participant. 20 The two types of plan do have somewhat different risks associated with the likelihood that the plan assets will be available to the worker at retirement. The Pension Benefit Guaranty Corporation (PBGC) was created by the ERISA of 1974 to pay benefits (up to a limit) to participants in private DB plans in the event that an employer could not. It essentially provides insurance protection that retirees will have access to the DB benefits even if the employer is in financial distress or out of business by the time the participant retires. The PBGC is financed by insurance premiums set by Congress and paid by DB plan sponsors. That does not necessarily mean that the PBGC can pay the full benefits promised under the plan to the retiree if the plan sponsor is unable to do so but it generally does so up to a guaranteed amount ($4,500 per month for age-65 retirees of plans terminating in 2009). Workers in DC plans are less at risk because they have individual accounts and a legal right to vested assets in those accounts. If they leave the employer prior to retirement, they usually take their accumulated, vested assets with them.
5
retirement plan. This section will compare the demographics of these three groups and the number of people in each group. Section 2 will more closely examine the first two groups, those workers whose employers sponsor a plan. Section 3 will analyze the second and third groups more closely when discussing why workers are not participating in retirement plans.
Information from SIPP Data on retirement plan participation is collected through various surveys. One of
those surveys is the Census Bureau’s Survey of Income and Program Participation (SIPP). The SIPP surveys ask a group of households several rounds of questions over a multi-year period about the household members’ job status, finances, and participation in various government and other types of programs. One set of questions that is asked in Topical Module wave 7 is about retirement income and pensions plans. These data are being collected from individuals, rather than the companies that they work for, and rely on what individuals know about their retirement plan coverage. Because the data are being collected from individuals, it does not always match the information collected from companies.
This study will primarily focus on private industry workers 16 years and over including owners of businesses.21 From the SIPP survey, it is possible to identify the type of retirement plan or plans respondents participate in and the type of retirement plans that respondents’ firms sponsor but in which respondents do not participate. The SIPP survey asks respondents both about the size of the establishment in which they work and the total size of the firm for whom they work. This study has separated the information on workers according to the total size of the firm. The SIPP survey separates pension types into three kinds: 1) plans based on earnings and years on the job (DB plans), 2) individual account plans (DC plans) and 3) cash balance plans, legally a DB plan with certain attributes that are similar to both a DB plan and a DC plan.
Coverage and Participation of Private Sector Workers The SIPP survey provides estimates of retirement plan coverage and participation
for about 125 million private sector workers in 2006.22 This includes business owners who consider their businesses to be their primary job. Table 1 provides a general
21 The demographics of government workers will also be presented in the appendix since a significant proportion of government workers also do not participate in the plans that the governments make available. 22 See Appendix A for a further discussion of how this number compares to other counts of workers.
6

overview of the number and percent of workers divided into categories of retirement plan participation by the size of the firm for which they work. Workers who have a retirement plan available to them at their place of work are considered covered while those that have joined a retirement plan are considered to be participants. Overall, almost 47 million private sector workers participated in a retirement plan in 2006, over 35 million of those workers worked for firms with 100 or more employees. Almost 20 million workers had employers that sponsored a retirement plan the worker did not participate in. Finally, 58.4 million workers did not have access to a retirement plan through their workplace because the firm did not sponsor a plan.
Table 1: Number and Percent of Private Sector Workers Participating in Retirement Plans
by Firm Size, 2006 Small Firms (<100 workers) Large Firms (100+ workers) All firms
Includes detailed
categories
Worker participates if plan sponsored
Plan not sponsored
Worker participates if plan sponsored
Plan not sponsored
Yes No Yes No Number (millions)
11.1 4.9 40.8 35.5 14.8 17.6 124.7
Percent of workers
8.9 3.9 32.7 28.5 11.9 14.1 100
Source: SIPP, Census Bureau
Overall, about 53 percent of private sector workers had a plan available to them
with 37 percent of the workers participating in a plan, 16 percent not participating in a plan sponsored by their firm and 47 percent not having a plan in which to participate.23 If the subset of workers is restricted to private industry workers who are not business owners, the availability of pension plans is a bit better with 60 percent of employees working for an employer who sponsors a plan and 40 percent not having a plan available.
Private Sector Workers by Firm Size and Other Characteristics Table 2 shows sub-groups of the private industry workers in Table 1. Each row of
the table shows the percent of that group of workers that fits into each of the categories of retirement plan participation. For example line 4 separates men working in private industry into the three groups, 38.7 percent participated in a retirement plan in 2006, 13.7 percent of men reported that their company sponsored a plan but they did not participate, and 47.6 percent reported that the firm they worked for did not sponsor a plan. 23 SIPP asks employees about the size of the firm they work for and in addition asks business owners about the size of the business they own. The author used this information to assign both groups to the appropriate size of company.
7

As was already clear from Table 1, workers in firms with fewer than 100 employees are much less likely to have a retirement plan available to them than workers in firms with 100 or more employees. Almost 72 percent of workers working for small companies report having no plan available in the company while an additional 9 percent do not participate in a plan even though the company sponsors one. Only 19.5 percent of workers in small private sector companies report participating in a retirement plan. In contrast, over half of workers in companies with over 100 employees are participating in a retirement plan and only 26 percent of workers in the largest companies do not report having a plan available to them.24 An additional 22 percent do not participate in a plan even though the company sponsors one.
Table 2: Distribution of Demographic Sub-Groups of Private Industry Workers by
Status of Participation in Company Retirement Plan (Percent)—2006 Worker Participates
If Plan Available No Plan
Available Yes No
All Workers Including Owners 37.4 15.8 46.8 Owners of a Business 7.6 1.1 91.3 Workers Excluding Business Owners 41.7 18.0 40.3 Males 38.7 13.7 47.6 Females 35.7 18.4 45.8 Married 42.7 12.2 45.1 Single 30.7 20.4 49.0 Less than High School Diploma 16.1 17.4 66.5 High School Diploma 31.1 15.9 53.0 College and/or College Diploma 41.6 16.3 42.2 Graduate or Professional Degree 55.6 10.7 33.8 White 37.8 15.3 46.8 Black 34.2 19.7 46.2 Asian 40.3 14.8 44.9 Works 35 Hours or More 45.1 14.7 40.1 Works for Company with Fewer than 100 Employees 19.5 8.7 71.8 Works for Company with 100 or More Employees 52.3 21.8 25.9 Note: Rows sum to 100 percent of each demographic group. Source: SIPP, Census Bureau
24 The data used to develop these numbers does not provide detail on firm sizes that are larger than 100 workers. However, earlier work using a different data set for 2002 found that for firms with multiple establishments there were relatively consistent rates of employees with access to retirement plans ranging from 69 percent in the 250-500 and 500-1000 groups to 78 percent for the 1001 to 5000 group. Large single establishment firms showed slightly lower rates ranging from 54 percent in the 251-500 group to 63 percent in the 101-250 group. See Popkin 2005.
8

Married workers are more likely to participate than are non-married workers but even among married workers, a little less than half are participating in a plan. Men participate at a somewhat higher rate than women and a higher percentage of women do not participate when there is a plan available at their job. Younger workers, single workers, women, and workers with less than a high school diploma are less likely to participate in a plan than do workers who are older, married or male. Unsurprisingly, educated, full-time workers are the most likely to participate in a pension plan. About 56 percent of the most educated workers participate in a plan and only about a third of those workers work for companies that do not offer any plan at all. Forty-five percent of full-time workers participate in a plan. At the other end of the spectrum, over 66 percent of workers with less than a high school education work for firms that do not provide a retirement plan and about 17 percent of those least educated workers do not participate in a plan even if his or her company offers one. However, this relationship between education and retirement plan participation may be as closely related to income as education. Earlier studies have indicated that age, income and tenure are positively correlated with the probability of participating in a 401(k) plan but those studies have not always found education to be a significant variable, other things being equal.25
Table 3: Characteristics of Private Industry Workers in Retirement Plans and Not in
Retirement Plans in 2006 Worker Participates If Plan
Available No Plan Available
Yes No Average Age 42.6 years 35.9 years 40.1 years Percent Male 57.1 47.7 56.0 Percent Married 63.9 43.4 54.0 Percent w Less than High School Diploma
3.8 9.8 12.7
Percent with Advanced College or Professional Degree
15.0 6.7 6.3
Percent White 82.9 79.4 82.6 Percent Black 10.6 13.9 10.5 Percent Work > 34 Hrs. per Week 86.7 64.4 61.2 Average Hours for Full-time workers 43.3 hours 42.3 hours 43.5 hours Average No. of Years at Job 9.9 years 5.3 years 7.0 years Percent Working for a company with < 100 employees
23.8 25.0 69.9
Source: SIPP, Census Bureau 25 Munnell, A., Sunden, A. and Taylor, C. What Determines 401(k) Participation and Contributions? Center for Retirement Research at Boston College, December 2000.
9
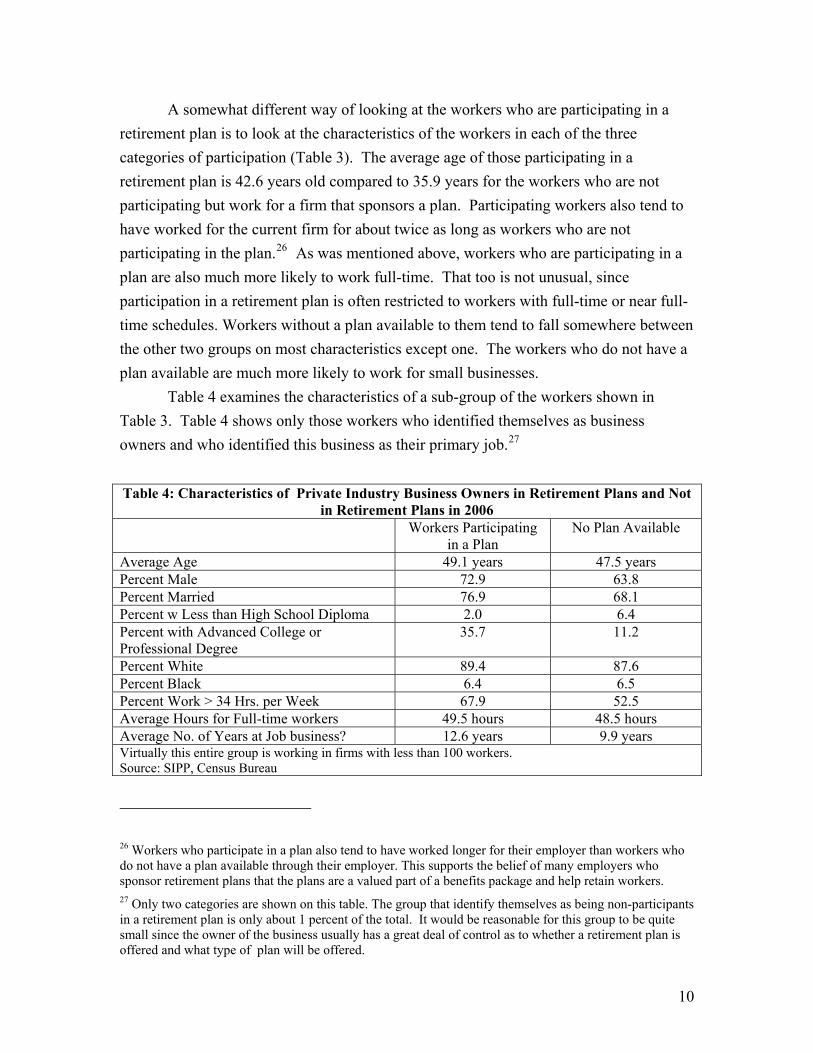
A somewhat different way of looking at the workers who are participating in a retirement plan is to look at the characteristics of the workers in each of the three categories of participation (Table 3). The average age of those participating in a retirement plan is 42.6 years old compared to 35.9 years for the workers who are not participating but work for a firm that sponsors a plan. Participating workers also tend to have worked for the current firm for about twice as long as workers who are not participating in the plan.26 As was mentioned above, workers who are participating in a plan are also much more likely to work full-time. That too is not unusual, since participation in a retirement plan is often restricted to workers with full-time or near full-time schedules. Workers without a plan available to them tend to fall somewhere between the other two groups on most characteristics except one. The workers who do not have a plan available are much more likely to work for small businesses.
Table 4 examines the characteristics of a sub-group of the workers shown in Table 3. Table 4 shows only those workers who identified themselves as business owners and who identified this business as their primary job.27
Table 4: Characteristics of Private Industry Business Owners in Retirement Plans and Not
in Retirement Plans in 2006 Workers Participating
in a Plan No Plan Available
Average Age 49.1 years 47.5 years Percent Male 72.9 63.8 Percent Married 76.9 68.1 Percent w Less than High School Diploma 2.0 6.4 Percent with Advanced College or Professional Degree
35.7 11.2
Percent White 89.4 87.6 Percent Black 6.4 6.5 Percent Work > 34 Hrs. per Week 67.9 52.5 Average Hours for Full-time workers 49.5 hours 48.5 hours Average No. of Years at Job business? 12.6 years 9.9 years Virtually this entire group is working in firms with less than 100 workers. Source: SIPP, Census Bureau
26 Workers who participate in a plan also tend to have worked longer for their employer than workers who do not have a plan available through their employer. This supports the belief of many employers who sponsor retirement plans that the plans are a valued part of a benefits package and help retain workers. 27 Only two categories are shown on this table. The group that identify themselves as being non-participants in a retirement plan is only about 1 percent of the total. It would be reasonable for this group to be quite small since the owner of the business usually has a great deal of control as to whether a retirement plan is offered and what type of plan will be offered.
10
Compared to the overall group of private industry workers who do not have pension plans available to them, business owners tend to be somewhat older, better educated and have been at their jobs for a longer period of time. However, overall the same differences in characteristics show up in the business owners as show up in workers overall. The ones participating in a retirement plan tend to be older, more likely to be male, have worked a longer number of years at this job and are better educated.
Section 2: Participation in Retirement Plans
The most complete information on the number and types of pension/retirement plans in the U.S. comes from the Department of Labor and the Internal Revenue Service. The Department of Labor’s Employee Benefits Security Administration (EBSA) tracks pension/retirement plans sponsored under the ERISA regulations through the plan sponsor’s required filing of a Form 5500. As can be seen from Table 5, this includes the DB plans (including the cash balance plans) and DC plans discussed above. There are also two basic types of simplified pension plans that do not have to meet all of the ERISA requirements and for that reason do not have to file a Form 5500. Those are the Savings Incentive Match Plan for Employees (SIMPLE) IRAs and Simplified Employee Pension (SEP) plans that are specifically designed for small businesses.28 These latter plans are tracked through IRS statistics rather than through EBSA’s statistics. Table 5 shows the number of plans and the total number of participants reported to the Department of Labor in the 2006 Form 5500 filings. The last column of the table also shows the most recent information the IRS has published showing counts of 2004 taxpayers reporting the existence of SIMPLE IRA and SEP plans as well as traditional and Roth IRAs.
28 There is also a SIMPLE 401(k) plan that is restricted to small businesses, has fewer regulatory requirements than a standard 401(k) plan but does require a Form 5500 filing. The small business plans will be discussed in more detail in Section 6.
11
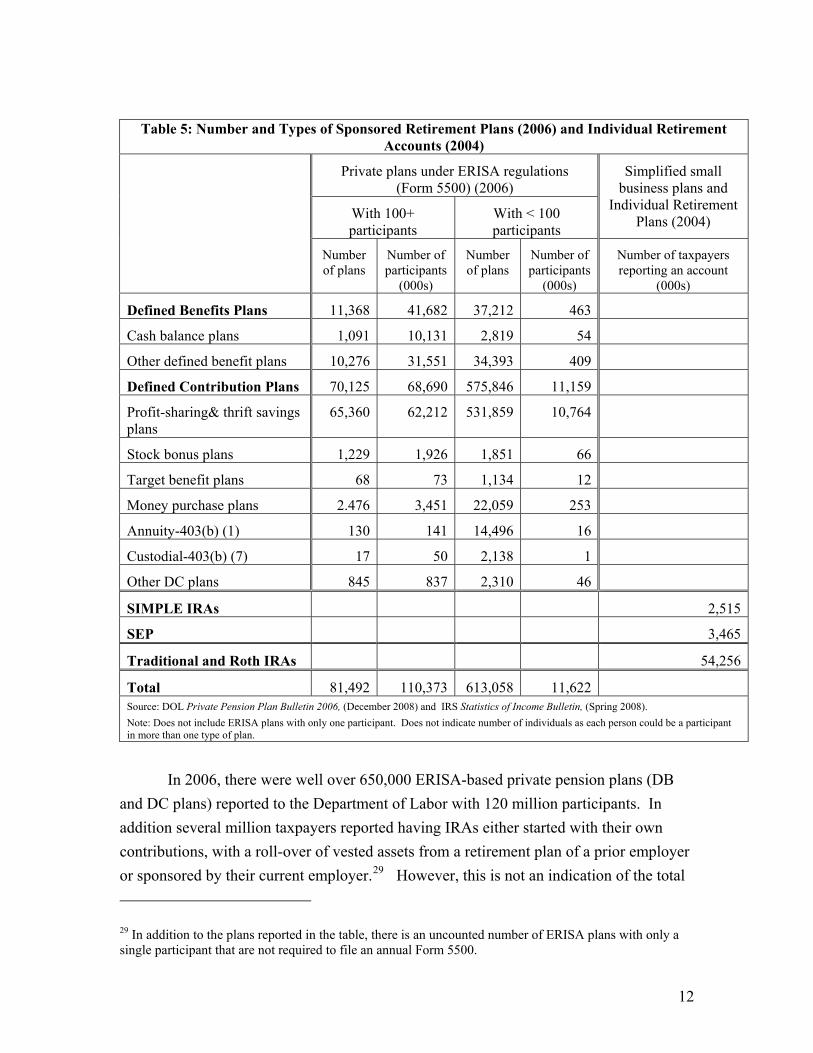
Table 5: Number and Types of Sponsored Retirement Plans (2006) and Individual Retirement
Accounts (2004)
Private plans under ERISA regulations (Form 5500) (2006)
Simplified small business plans and
Individual Retirement Plans (2004) With 100+
participants With < 100 participants
Number of plans
Number of participants
(000s)
Number of plans
Number of participants
(000s)
Number of taxpayers reporting an account
(000s)
Defined Benefits Plans 11,368 41,682 37,212 463
Cash balance plans 1,091 10,131 2,819 54
Other defined benefit plans 10,276 31,551 34,393 409
Defined Contribution Plans 70,125 68,690 575,846 11,159
Profit-sharing& thrift savings plans
65,360 62,212 531,859 10,764
Stock bonus plans 1,229 1,926 1,851 66
Target benefit plans 68 73 1,134 12
Money purchase plans 2.476 3,451 22,059 253
Annuity-403(b) (1) 130 141 14,496 16
Custodial-403(b) (7) 17 50 2,138 1
Other DC plans 845 837 2,310 46
SIMPLE IRAs 2,515
SEP 3,465
Traditional and Roth IRAs 54,256
Total 81,492 110,373 613,058 11,622 Source: DOL Private Pension Plan Bulletin 2006, (December 2008) and IRS Statistics of Income Bulletin, (Spring 2008). Note: Does not include ERISA plans with only one participant. Does not indicate number of individuals as each person could be a participant in more than one type of plan.
In 2006, there were well over 650,000 ERISA-based private pension plans (DB
and DC plans) reported to the Department of Labor with 120 million participants. In addition several million taxpayers reported having IRAs either started with their own contributions, with a roll-over of vested assets from a retirement plan of a prior employer or sponsored by their current employer.29 However, this is not an indication of the total 29 In addition to the plans reported in the table, there is an uncounted number of ERISA plans with only a single participant that are not required to file an annual Form 5500.
12
number of people with retirement plan coverage, some people have multiple accounts and some have none.30 Second, this is not a count of the number of people making contributions to retirement accounts. The number of active participants (those that might be making contributions although do not necessarily do so) in the ERISA plans is about 70 percent of the total number of participants shown on this table.31 In addition, the count includes persons with multiple IRA accounts who may not be contributing to any of them.
Nor does any of this information provide us with definitive counts of retirement plans by the size of the employer. If a retirement plan has more than 100 participants, it is likely that it is sponsored by a business with more than 100 employees. SEP and SIMPLE plans can only be sponsored by employers with 100 or fewer employees and therefore tend to be associated with small businesses. For the rest of the plans it is difficult to determine the size of the businesses from the number of participants. It might be a small business or it might be a large business with a retirement plan that covers a sub-group of employees. The ERISA plans with fewer than 100 participants have, on average, 19 participants per plan. The ERISA plans with 100 or more participants have, on average, over 1300 employees per plan. A large number of the small DB and DC plans (63 percent of the DB group with less than 100 participants and 39 percent of the similar DC group) report 2-9 participants, with an average of 4 participants.
The DOL numbers provide some industry information for the ERISA-based plans. Almost 28 percent of the participants worked in services, 27 percent in manufacturing, 11 percent in each the FIRE and retail trade sectors, 6 percent in construction, 5 percent each in transportation and communications and about 3 percent in wholesale trade. The remainder worked in agriculture, mining and other industries.
The tables in the next section provide information about plan availability and participation of workers by firm size. Those are based on data from the SIPP survey
30 For example, as people leave jobs with a DC retirement plan, it is not unusual for that plan to be rolled over into an IRA account. The Federal Reserve reported that at the end of 2008 IRA plans held assets equal to $3.6 trillion compared to $1.9 trillion in private DB plans and $2.7 trillion in private DC plans. But most of that money comes from conversion of DC plans to IRAs. Sometimes a single person will have more than one converted account if he or she has left more than one job with retirement assets. 31 DOL describes an active participant as workers currently in employment covered by a plan and who are earning or retaining credited service under a plan. This includes workers who are eligible to elect to have the employer make payments to a Code section 401(k) plan. Total participants (as shown on Table 5) include active participants plus retired participants and participants that are separated from the company but have a vested amount in the plan.
13
discussed earlier. The SIPP surveys ask respondents about the size of the firm they work for as well as the type of retirement plan the employer sponsors.
However, not all respondents have a clear understanding of the type of retirement plan their company is sponsoring nor do they necessarily understand the type of plan in which they participate.32 Some workers may not understand that the offered plan is for the purpose of retirement savings. This confirms prior research that workers are often confused about the specifics of their retirement plans. This study will count as a plan participant anyone participating who responds that they are in a retirement-type plan sponsored by their employer.
Distribution of Respondents by Plan Type and Firm Size Despite detailed information, it is difficult to determine the precise percentage of workers that have access to each type of plan. That is because some workers are confused about their plans and also because some workers have access to and participate in more than one type of plan.33 However Table 6 provides a simplified analysis of the types of plans that are available to workers in firms of different sizes in 2006.34 Table 6 distributes all the private industry workers whose employers sponsor a plan (about 50 million workers in large businesses and about 16 million in small businesses) by the type of plan the employer sponsors and whether or not the respondent participates in the plan. This table covers only the two categories of workers discussed in Section 1 whose employers sponsored a retirement plan.35 Consequently, a very larger percentage of workers are excluded from the calculations for this table, those whose
32 A recent survey found that nearly three-quarters of workers say they have “less than a complete understanding of their employer’s DC plans. “Survey Finds Very Few Workers Understand Their Retirement Plan,” Workforce Management, September 11, 2009. 33 About 10 percent of the workers whose firms sponsor a retirement plan report having more than one plan available. Large businesses are somewhat more likely than small businesses to offer more than one plan; about 12 percent of respondents who worked for a large employer who sponsored a plan in 2006 indicated they were participating in more than one plan. That compared with less than 5 percent of respondents in very small pension-sponsoring businesses (less than 10 employees) who participated in more than one plan. 34 The SIPP survey allocates firms (companies) into several size groups (less than 10 employees, 10-24 employees, 25-49 employees, 50-99 employees and 100 or more employees) but the 100 or more employee companies are all aggregated together. For the purposes of this study, that group will be considered large business and the group below 100 will be considered to be small business. 35 The employer sponsors a plan if it is open to some of its employees. That does necessarily mean that the respondent is eligible to participate in the plan. Eligibility rules vary but are often tied to length of service or number of hours worked in a year. Employees that are eligible, in that they meet the requirements of the plan, then have a choice about whether or not to participate in the plan. For DB plans, the enrollment is usually automatic, once eligible. For DC plans, the employee most often must explicitly sign up to participate in the plan.
14

employers do not sponsor a plan (about 17 million workers in large firms and almost 41 million workers in small firms).
Table 6: Distribution of Workers in Private Industry Whose Employers Sponsor a Retirement Plan by Firm Size, 2006 (Percent)
Firm employment size < 100 100+
All firms
Defined Benefit (DB) Plans Respondent’s only or most important plan is a DB plan 19.2 27.4 25.4
Respondent does not participate in the employer’s DB plan.* 5.8 4.2 4.6 Defined Contribution (DC) Plans Respondent’s only or most important plan is a DC plan 50.2 44.9 46.5
Respondent does not participate in the employer’s DC plan 25.0 25.3 25.2 Cash Balance Plans Respondent’s only or most important plan is a cash balance plan 4.8 5.4 5.3 *The respondents indicate they do not participate in a plan and the plan available is not a 401(k)-type; it is assumed that it is a DB plan. Note: The total adds to more than 100 because some respondents indicate participation in multiple plans. Source: SIPP, Census Bureau
For example, from the last column on Table 6 one can see that of those workers
whose employers sponsor retirement plans, 30 percent work for an employer than sponsors a DB plan. (This includes the 25.4 percent of the workers participating in a DB plan plus the 4.6 percent of workers who are not participating in a DB plan their employer sponsors.) Over 71 percent of workers whose employers sponsor a plan work for employers who sponsor a DC plan (the 46.5 percent who are participating in a DC plan plus the 25.2 percent whose employers sponsor a DC plan but the respondents do not participate in it). About 5 percent of workers participate in the cash balance plans. These percentages total to more than 100 percent because some workers are participating in more than one plan and therefore are in more than one of these categories.
The first column of Table 6 shows the similar distributions for all the small business workers whose employers sponsor plans and the second column shows the distributions for all the large business workers whose employers sponsor plans. Defined benefit plans are sponsored by large businesses more often than small businesses with almost 32 percent of workers in large businesses reporting the availability of a DB plan compared to 25 percent of the workers in small businesses. About 27 percent of the workers in firms with 100 or more employees are participating in a DB plan compared to about 19 percent of workers in the small companies. Four to six percent of workers in
15

both firm size groups report they do not participate in a DB plan even though one is offered by their employer.36 Defined contribution (DC) plans are the type of plan most often reported by both groups. About 75 percent of small business workers and 70 percent of large business workers report their firms sponsor such a plan. The percentage of workers not participating in a DC plan is very consistent across firm size groups, about a quarter of each group. Half of the small business workers with a plan available report participating in a DC plan compared to about 45 percent of similarly situated large business workers. Looking at the more detailed breakdown of information for firm sizes within the “<100 employee” group (see Table B.1 in Appendix B), one finds somewhat less consistency than in the aggregated group. A much higher percentage of workers in the smallest firm size groups (less than 10 employees and 10-24 employees) are participating in the DC plans sponsored by their employer, 57 and 51 percent, than is true for the 50-99 employee group at 47 percent. This may reflect the employer’s ability to keep a relatively small group of employees better informed about the retirement plan or it may reflect more effort on the part of the employer to keep employees participating in order to meet the regulatory requirements of the plans such as meeting the anti-discrimination requirements.
Table 7 provides the same information as in Table 6 but provides it in much more detail. This table provides a better understanding of how employees perceive the retirement (or savings) plans sponsored by their employers. It also shows in more detail how complicated retirement systems may be. A small percentage of workers have more than one plan available to them and participate in more than one plan. Clearly there is some level of confusion about the DC plans. About 12 percent of each firm-size group does not recognize the employer sponsored 401(k)-type plan as a pension or retirement plan despite the fact that most of those employees participate in that plan. This points to the importance of providing better information about all retirement plans to potential plan participants. (More detailed tables for other firm size groups are shown in Appendix B.)
Table 7: Distribution of Private Industry Workers Whose Employers Sponsor a Retirement
Plan by Firm Size, 2006 (Percent) Firm employment size
36 While we do not know for certain why workers would not participate in a DB plan, the most likely explanation is that they are not eligible yet.
16
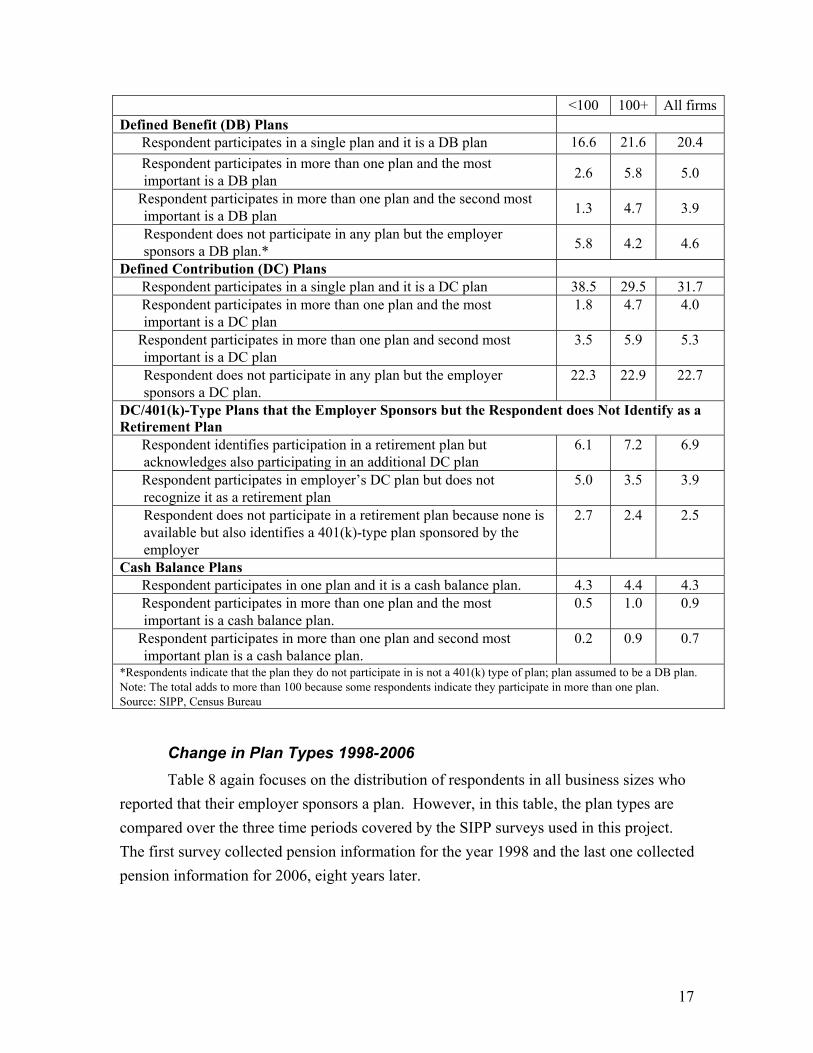
<100 100+ All firmsDefined Benefit (DB) Plans Respondent participates in a single plan and it is a DB plan 16.6 21.6 20.4 Respondent participates in more than one plan and the most
important is a DB plan 2.6 5.8 5.0
Respondent participates in more than one plan and the second most important is a DB plan 1.3 4.7 3.9
Respondent does not participate in any plan but the employer sponsors a DB plan.* 5.8 4.2 4.6
Defined Contribution (DC) Plans Respondent participates in a single plan and it is a DC plan 38.5 29.5 31.7 Respondent participates in more than one plan and the most
important is a DC plan 1.8 4.7 4.0
Respondent participates in more than one plan and second most important is a DC plan
3.5 5.9 5.3
Respondent does not participate in any plan but the employer sponsors a DC plan.
22.3 22.9 22.7
DC/401(k)-Type Plans that the Employer Sponsors but the Respondent does Not Identify as a Retirement Plan Respondent identifies participation in a retirement plan but
acknowledges also participating in an additional DC plan 6.1 7.2 6.9
Respondent participates in employer’s DC plan but does not recognize it as a retirement plan
5.0 3.5 3.9
Respondent does not participate in a retirement plan because none is available but also identifies a 401(k)-type plan sponsored by the employer
2.7 2.4 2.5
Cash Balance Plans Respondent participates in one plan and it is a cash balance plan. 4.3 4.4 4.3 Respondent participates in more than one plan and the most
important is a cash balance plan. 0.5 1.0 0.9
Respondent participates in more than one plan and second most important plan is a cash balance plan.
0.2 0.9 0.7
*Respondents indicate that the plan they do not participate in is not a 401(k) type of plan; plan assumed to be a DB plan. Note: The total adds to more than 100 because some respondents indicate they participate in more than one plan. Source: SIPP, Census Bureau
Change in Plan Types 1998-2006 Table 8 again focuses on the distribution of respondents in all business sizes who
reported that their employer sponsors a plan. However, in this table, the plan types are compared over the three time periods covered by the SIPP surveys used in this project. The first survey collected pension information for the year 1998 and the last one collected pension information for 2006, eight years later.
17
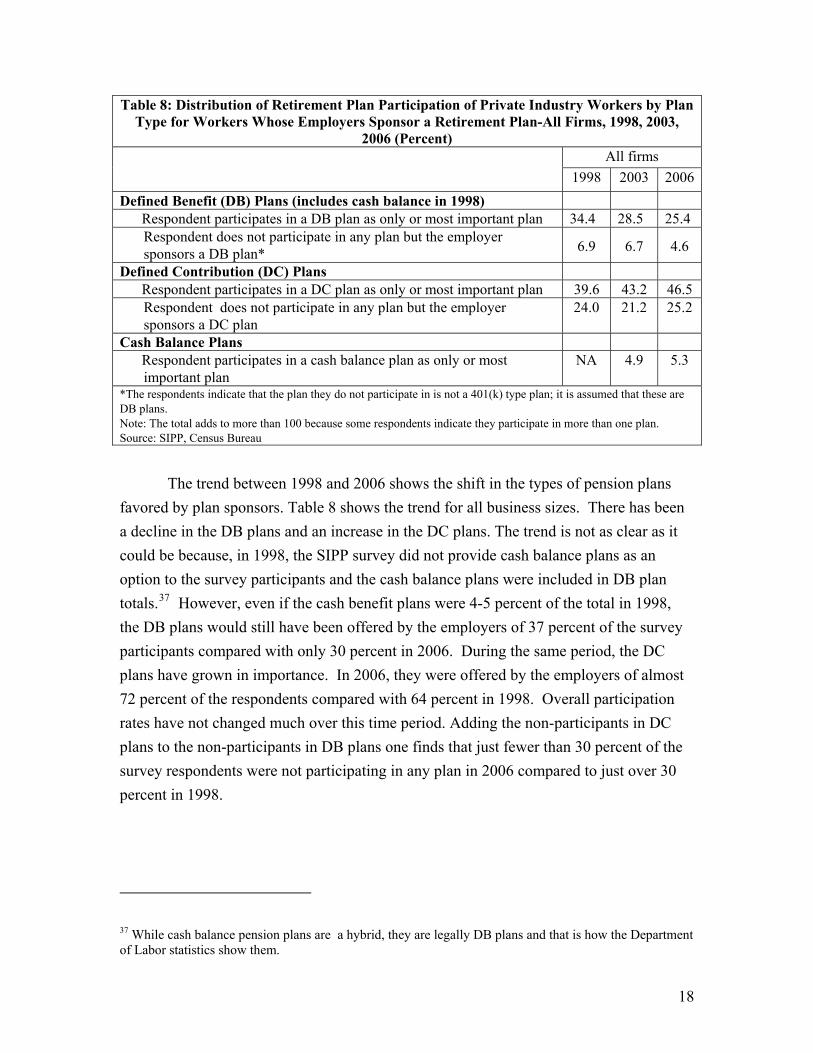
Table 8: Distribution of Retirement Plan Participation of Private Industry Workers by Plan Type for Workers Whose Employers Sponsor a Retirement Plan-All Firms, 1998, 2003,
2006 (Percent)
All firms 1998 2003 2006
Defined Benefit (DB) Plans (includes cash balance in 1998) Respondent participates in a DB plan as only or most important plan 34.4 28.5 25.4
Respondent does not participate in any plan but the employer sponsors a DB plan* 6.9 6.7 4.6
Defined Contribution (DC) Plans Respondent participates in a DC plan as only or most important plan 39.6 43.2 46.5
Respondent does not participate in any plan but the employer sponsors a DC plan
24.0 21.2 25.2
Cash Balance Plans Respondent participates in a cash balance plan as only or most
important plan NA 4.9 5.3
*The respondents indicate that the plan they do not participate in is not a 401(k) type plan; it is assumed that these are DB plans. Note: The total adds to more than 100 because some respondents indicate they participate in more than one plan. Source: SIPP, Census Bureau
The trend between 1998 and 2006 shows the shift in the types of pension plans
favored by plan sponsors. Table 8 shows the trend for all business sizes. There has been a decline in the DB plans and an increase in the DC plans. The trend is not as clear as it could be because, in 1998, the SIPP survey did not provide cash balance plans as an option to the survey participants and the cash balance plans were included in DB plan totals.37 However, even if the cash benefit plans were 4-5 percent of the total in 1998, the DB plans would still have been offered by the employers of 37 percent of the survparticipants compared with only 30 percent in 2006. During the same period, the DC plans have grown in importance. In 2006, they were offered by the employers of almost 72 percent of the respondents compared with 64 percent in 1998. Overall participation rates have not changed much over this time period. Adding the non-participants in DC plans to the non-participants in DB plans one finds that just fewer than 30 percent of the survey respondents were not participating in any plan in 2006 compared to just over 30 percent in 1998.
ey
37 While cash balance pension plans are a hybrid, they are legally DB plans and that is how the Department of Labor statistics show them.
18

Table 9: Distribution of Retirement Plan Participation of Private Industry Workers by Plan Type for Workers Whose Employers Sponsor a Retirement Plan, Large Firms, 1998, 2003,
2006 (Percent)
Firms with 100+
employees 1998 2003 2006
Defined Benefit (DB) Plans (includes cash balance in 1998) Respondent participates in a DB plan as only or most important
plan 35.9 30.1 27.4
Respondent does not participate in any plan but the employer sponsors a DB plan*
6.7 6.5 4.2
Defined Contribution (DC) Plans Respondent participates in a DC plan as only or most important
plan 38.9 42.0 44.9
Respondent does not participate in any plan but employer sponsors a DC plan
24.1 21.5 25.3
Cash Balance Plans Respondent participates in a cash balance plan as only or most
important plan NA 4.6 5.4
*The respondents indicate that the plan they do not participate in is not a 401(k) type of plan; it is assumed that these are DB plans. Note: The total adds to more than 100 because some respondents indicate they participate in more than one plan. Source: SIPP, Census Bureau
Table 9 looks at the trend for large firms. It looks similar to the overall trend,
with DB plans shrinking as a share of the total and DC plans growing as a share of the total. Overall, a somewhat higher percentage of workers in large firms have a DB plan as compared to the group overall but that share has also been declining over time. Table 10 shows the distribution of respondents working for small firms (less than 100 employees) who reported that their employer sponsored a retirement plan. Here the pattern is quite clear. In 1998, almost 37 percent of respondents who reported that their employer was sponsoring a retirement plan identified it as a DB plan. By 2006, that number had declined to 25 percent. Also, the percent of respondents who reported participating in a small business DB plan declined by 10 percentage points, down from 29 percent to 19 percent. Even if 5 percent of the plans in 1998 were cash balance plans, the decline would still have been 5 percentage points. Comparing the 1998 results in Tables 9 and 10 one sees that even in 1998 large firms were more likely to offer DB plans than were small firms and the share of firms offering DB plans seems to have fallen faster in small firms than in large firms, even after correcting for cash balance plans.
19

Table 10: Distribution of Retirement Plan Participation of Private Industry Workers by Plan Type for Workers Whose Employers Sponsor a Retirement Plan-Small Firms, 1998,
2003, 2006 (Percent)
Firms with <100 employees
1998 2003 2006 Defined Benefit (DB) Plans (includes cash balance in 1998) Respondent participates in a DB plan as only or most important
plan 29.1 23.4 19.1
Respondent does not participate in any plan but the employer sponsors a DB plan.* 7.5 7.1 5.8
Defined Contribution (DC) Plans Respondent participates in a DC plan as only or most important
plan 41.0 46.6 50.2
Respondent does not participate in the plan but it is a defined contribution plan
23.8 20.1 25.0
Cash Balance Plans Respondent participates in a cash balance plan as only or most
important plan NA 5.9 4.8
*The respondents indicate that the plan they do not participate in is not a 401(k) type of plan; it is assumed that most of those are defined benefit types of plans but some percentage of them could also be cash balance plans. The data do not allow those to be identified. Note: The total adds to more than 100 because some respondents indicate they participate in more than one plan. Source: SIPP, Census Bureau
The share of respondents reporting their employer sponsors a DC plan was about
65 percent in 1998, a little higher than the 63 percent of the large business workers that reported such a plan (roughly the same percentage of both firm-size groups showed about 24 percent of workers not participating in the DC plans.) By 2006, 75 percent of the small business respondents whose employers sponsored a plan indicated that it was a DC plan. That compares with 70 percent of the large business workers. In summary, if an employer is going to sponsor a retirement plan, it is increasingly likely that the plan will be a DC plan regardless of firm size. About a quarter of the respondents whose employers offer DC plans do not participate in them, that too varies little by firm size. Large firms are still more likely to offer a DB plan than is a small firm but the share of large firms offering such a plan is declining over time. These tables have looked at the different kinds of retirement plans available and the type of plan a worker is most likely to be participating in if his or her employer offers such a plan. However, the next section will focus on the workers who are not participants in a retirement plan.
20
Section 3: Why Are Workers Not in Plans?
Businesses that Do Not Offer Plans In considering policy changes that might increase the number of people who participate in pension plans, it is important to know why workers do not participate. Table 1 shows that the majority of workers do not participate in a plan because they do not have a choice about it; there is no plan available through their jobs.38 To increase the number of workers that are offered plans through their businesses, policy measures need to consider how to make pension plans more attractive to businesses and less burdensome. There are few studies on why companies do not offer pension plans.39 However, from the information available the major reasons are: the cost of the plans, the regulatory burdens of the plans, the fiduciary responsibilities required of the plan sponsors and a general lack of employer education about the requirements and processes of setting up and sponsoring a plan.40 These types of hurdles are more difficult for small employers to overcome than they are for large employers. Small employers are less likely and lesable to assign a staff person to “handle” retirement-plan related issues than are large businesses. However, a recent survey by Charles Schwab and CFO Research of senior finance executives in large companies show that companies do see positive aspects to having a retirement plan. In large firms at least, the availability of a retirement plan is an important recruiting tool. Eighty-four percent of the surveys respondents saw it as “necessary for attracting and recruiting a high quality workforce.”
s
41 New plan sponsors in a 2003 EBRI survey of small firms also cited that as the main reason that they began sponsoring a retirement plan.
38 There is something of a discrepancy between this statistic and the Bureau of Labor Statistics’ latest benefits analysis which shows that 67 percent of private sector employees have a pension plan available to them. This may be a difference in the time period, these data were collected in 2006 and the BLS numbers in 2009 but it may also reflect that some workers remain unaware of retirement plans available to them through their jobs. These data are asked of workers, the BLS statistics were collected from businesses and ask about their employees. Employee Benefits in the United States, March 2009, July 28, 2009. 39 For several years, EBRI collected survey information on the reasons that small businesses did not have retirement plans but those were discontinued after 2003. 40 The most often cited reason in the EBRI survey was business concerns such as uncertainty of revenues and newness of the business. See Munnell and Perun (2006) [not in Bibliograhy] Figure 6. A Lewin/ICF study had similar findings see GAO (July 1992) Table III.1. 41 Owens, D. “A Shared Benefit: Employer Views on the Value of 401(k) Plans,” Defined Contributions Insight, January-February 2009.
21
The cost of setting up and running a retirement plan is not only related to the number of active participants (for whom a business would make contributions depending on the formula of the plan) but also the costs associated with the administration of the plan. The Department of Labor reported that DB plans with 100 or more participants spent $9.2 billion on administrative expenses in 2006 (or about $220 per participant) and DC plans with 100 or more participants spent $2.2 billion (or about $33 per participant). These administrative expenses included professional fees, contract administration fees, investment advisory and management fees and other administrative expenses. While the DOL does not provide similar statistics for plans with fewer than 100 employees, earlier analysis of the 5500 forms (Popkin, 2005) showed that there tended to be a floor on administrative expenses for such plans below which a reduction in the size of the plan did not reduce the expenses. Consequently, firms with few participants were often paying several times more per employee than were the large retirement plan sponsors, for the smallest firms it could be several hundred dollars per employee even for a DC plan.
Why Workers Do Not Participate However, even among workers whose employers do sponsor a retirement plan,
there is a significant percentage of workers who do not participate. While it is necessary to apply educated guesses about some of the reasons that employers do not sponsor retirement plans, it is easier to determine why workers do not participate in them. The SIPP survey asks them to provide their reasons. The SIPP survey from which these statistics are drawn asks if a person’s employer offers a pension or retirement plan and if that person responds “yes” then it asks if the respondent participates in such a plan. If the answer to that question is “no” then the person is provided with a list of reasons and asked to select the ones that best describe his or her reasons for not participating.
The questioning process is a bit more complicated than this suggests. As was discussed earlier, there are a number of respondents who are confused about their plans, especially DC plans. Consequently, if a respondent indicates that the employer does not sponsor a plan then he or she is asked again if the employer offers a 401(k)-type plan. As can be seen on Table 7, several respondents will answer “no” to the first question and “yes” to the second. This means that there may be two different sets of responses to the “why do you not participate” question. The first expresses the reasons of the larger but less well defined set of retirement plans (that respondents clearly understand are retirement plans) and the second set applies to a much smaller group whose available plan is clearly defined as a DC plan (but the respondent does not recognize it as a
22

retirement plan.) The two sets of responses are quite different. Since it is difficult to add these two sets of answers together, they are shown separately on the following tables.
Table 11 present the reasons for not participating in the company’s retirement plan for workers in large and small firms separately. (Appendix Tables B-9 and B-10 provide combined statistics for all firms.) The reasons are relatively consistent across firm size classes. Table 11: Reasons for Not Participating in a Company’s Retirement Plan Small and Large
Firms - 2006 (Percent) Reason for not participating in the retirement plan Employment Size
<100 100+ No one in my type of job is allowed in the plan 7.7 10.5 Don’t work enough hours, weeks, months per year 23.0 24.7 Haven’t worked long enough for this employer 27.8 25.4 Started job too close to retirement date 0.7 0.5 Too young to participate 1.9 2.1 Can’t afford to contribute 17.1 17.3 Don’t want to tie up money 6.9 9.4 Employer doesn’t contribute or does not contribute enough 2.5 2.0 Don’t plan to be on the job long enough 1.7 2.0 Don’t need it 2.2 1.1 Have an IRA or other pension plan coverage 1.8 1.8 Spouse has a pension plan 1.5 1.0 Haven’t thought about it 4.2 6.0 Other reason 15.3 10.8 Total may exceed 100 as more than one response is allowed Source: SIPP, Census Bureau
The two most cited reasons are “not having worked long enough for the employer,” cited by over a quarter of both groups, and “not having enough hours or weeks of work per year,” also cited by about a quarter of the respondents. Retirement plans often do restrict access to the plan to participants who have worked for the company for a specific period of time; this is somewhat more common among DB plans than it is among DC plans but it is often true for both types.42 Since the BLS data (2009) indicate a larger percentage of
42 Using a different data set (and a definition of small business that was based on having fewer than 500 employees), it was found that only 9 percent of workers in small businesses and 43 percent of workers in large businesses reported participating in a pension plan if they had worked for 9 months or less with their current employer. Whereas for employees that had worked longer than 9 months, the percent participating in pension plans rose to 36 percent and 78 percent, respectively. (See Popkin 2005, Table 8B).
23
workers qualify for a retirement plan than do these data, this may indicate confusion about whether eligibility criteria have been met. Since respondents can cite more than one reason there may be some overlap between the people who responded affirmatively to each question.
The third most common reason, cited by 17 percent of each group, is that the respondent cannot afford to contribute to the plan. About 8-10 percent of the workers in each firm-size grouping indicate that they belong to a group of employees that is excluded from the plan, perhaps in a certain job type. Seven to 9 percent of workers do not want to tie their money up in a retirement plan and a relatively large 11-15 percent indicates having some other reason for not participating. Table 11 asks the question, “why do you not participate in the retirement plan,” to all those respondents who indicate that there is a retirement plan sponsored by their employer but who are not participating in it. Consequently, it reflects a mixture of responses from people whose employers may provide a DB or a DC plan. Table 12 asks the same set of questions to the respondents who are asked specifically about the availability of a 401(k)-type plan after they have indicated that no retirement plan is offered. The distribution of responses are quite different than the ones shown in Table 11 and show more differences between the workers in the small and large firms than did the first set.43 The most commonly cited reason, by both firm size groups is that the person “can’t afford to contribute.” The next two most commonly cited reasons for small businesses are the tenure and work hour restrictions that were frequently cited in Table 11. However, for the large business group, “don’t want to tie the money up” is the third most important reason with 13 percent of the respondents, and 9 percent of workers in large firms indicating they “haven’t thought about it.” There continues to be a relatively large group with some other reason for not participating.
In comparing the responses of workers in small firms for the period from 1998 through 2006 in Table 13, there is quite a bit of consistency in the responses. (Similar tables for other firm sizes are shown in Appendix B.) But, the share of respondents citing the first three reasons: their group of employees is not eligible, they do not have enough tenure or enough hours to participate, has fallen somewhat since 1998. This may reflect a combination of a change in the mix of plans toward less restrictive ones (such as from a DB to a DC plan) or a better understanding of the plan rules by the workers. Some
43 This may partly reflect the smaller sample sizes in this group since fewer people are asked this question.
24
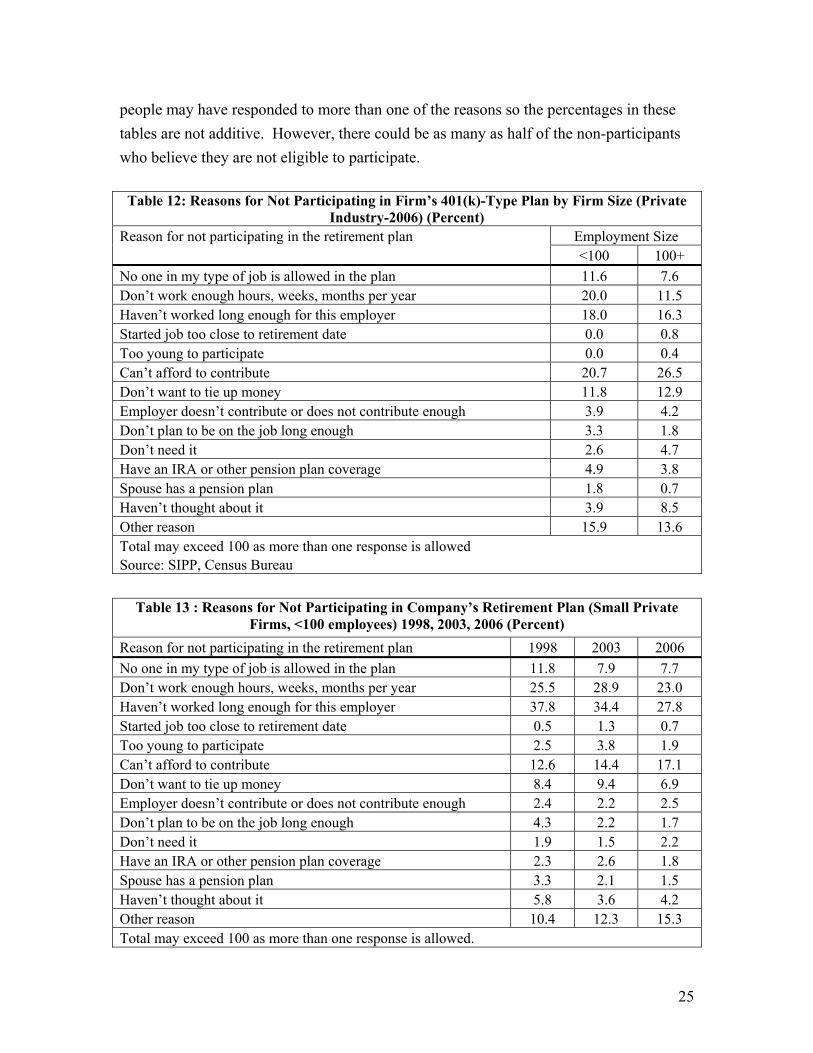
people may have responded to more than one of the reasons so the percentages in these tables are not additive. However, there could be as many as half of the non-participants who believe they are not eligible to participate.
Table 12: Reasons for Not Participating in Firm’s 401(k)-Type Plan by Firm Size (Private Industry-2006) (Percent)
Reason for not participating in the retirement plan Employment Size <100 100+
No one in my type of job is allowed in the plan 11.6 7.6 Don’t work enough hours, weeks, months per year 20.0 11.5 Haven’t worked long enough for this employer 18.0 16.3 Started job too close to retirement date 0.0 0.8 Too young to participate 0.0 0.4 Can’t afford to contribute 20.7 26.5 Don’t want to tie up money 11.8 12.9 Employer doesn’t contribute or does not contribute enough 3.9 4.2 Don’t plan to be on the job long enough 3.3 1.8 Don’t need it 2.6 4.7 Have an IRA or other pension plan coverage 4.9 3.8 Spouse has a pension plan 1.8 0.7 Haven’t thought about it 3.9 8.5 Other reason 15.9 13.6 Total may exceed 100 as more than one response is allowed Source: SIPP, Census Bureau
Table 13 : Reasons for Not Participating in Company’s Retirement Plan (Small Private
Firms, <100 employees) 1998, 2003, 2006 (Percent) Reason for not participating in the retirement plan 1998 2003 2006 No one in my type of job is allowed in the plan 11.8 7.9 7.7 Don’t work enough hours, weeks, months per year 25.5 28.9 23.0 Haven’t worked long enough for this employer 37.8 34.4 27.8 Started job too close to retirement date 0.5 1.3 0.7 Too young to participate 2.5 3.8 1.9 Can’t afford to contribute 12.6 14.4 17.1 Don’t want to tie up money 8.4 9.4 6.9 Employer doesn’t contribute or does not contribute enough 2.4 2.2 2.5 Don’t plan to be on the job long enough 4.3 2.2 1.7 Don’t need it 1.9 1.5 2.2 Have an IRA or other pension plan coverage 2.3 2.6 1.8 Spouse has a pension plan 3.3 2.1 1.5 Haven’t thought about it 5.8 3.6 4.2 Other reason 10.4 12.3 15.3 Total may exceed 100 as more than one response is allowed.
25
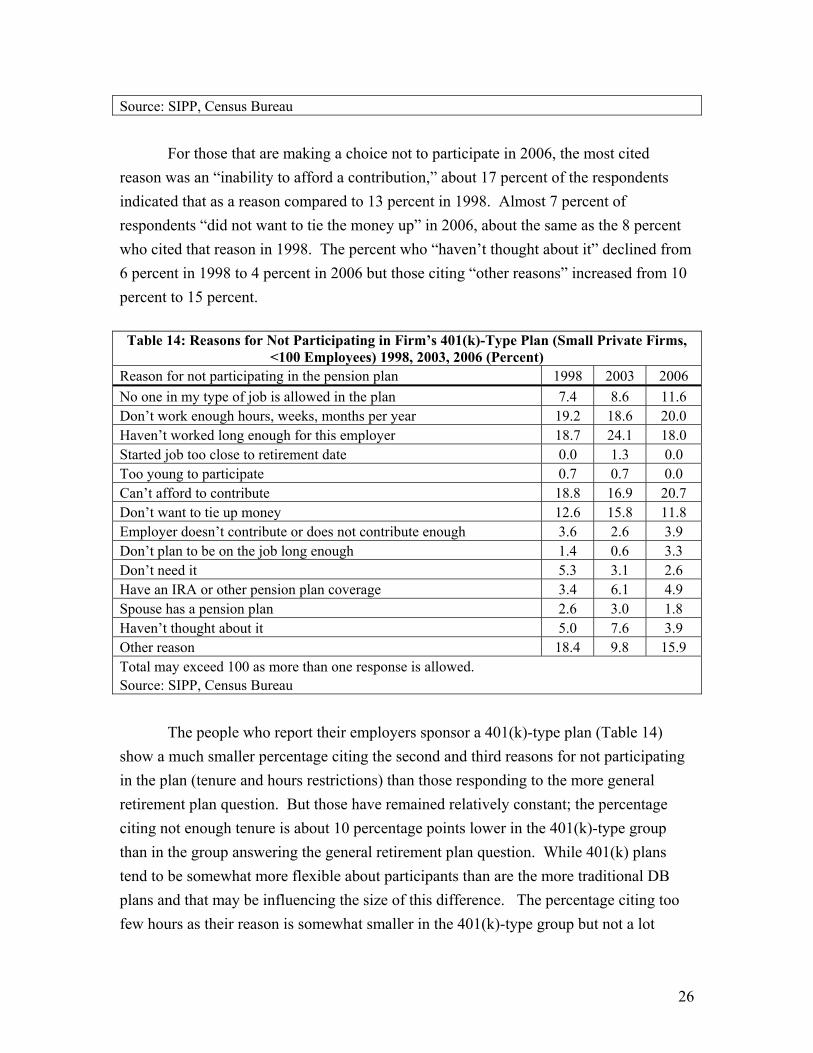
Source: SIPP, Census Bureau For those that are making a choice not to participate in 2006, the most cited
reason was an “inability to afford a contribution,” about 17 percent of the respondents indicated that as a reason compared to 13 percent in 1998. Almost 7 percent of respondents “did not want to tie the money up” in 2006, about the same as the 8 percent who cited that reason in 1998. The percent who “haven’t thought about it” declined from 6 percent in 1998 to 4 percent in 2006 but those citing “other reasons” increased from 10 percent to 15 percent. Table 14: Reasons for Not Participating in Firm’s 401(k)-Type Plan (Small Private Firms,
<100 Employees) 1998, 2003, 2006 (Percent) Reason for not participating in the pension plan 1998 2003 2006 No one in my type of job is allowed in the plan 7.4 8.6 11.6 Don’t work enough hours, weeks, months per year 19.2 18.6 20.0 Haven’t worked long enough for this employer 18.7 24.1 18.0 Started job too close to retirement date 0.0 1.3 0.0 Too young to participate 0.7 0.7 0.0 Can’t afford to contribute 18.8 16.9 20.7 Don’t want to tie up money 12.6 15.8 11.8 Employer doesn’t contribute or does not contribute enough 3.6 2.6 3.9 Don’t plan to be on the job long enough 1.4 0.6 3.3 Don’t need it 5.3 3.1 2.6 Have an IRA or other pension plan coverage 3.4 6.1 4.9 Spouse has a pension plan 2.6 3.0 1.8 Haven’t thought about it 5.0 7.6 3.9 Other reason 18.4 9.8 15.9 Total may exceed 100 as more than one response is allowed. Source: SIPP, Census Bureau The people who report their employers sponsor a 401(k)-type plan (Table 14) show a much smaller percentage citing the second and third reasons for not participating in the plan (tenure and hours restrictions) than those responding to the more general retirement plan question. But those have remained relatively constant; the percentage citing not enough tenure is about 10 percentage points lower in the 401(k)-type group than in the group answering the general retirement plan question. While 401(k) plans tend to be somewhat more flexible about participants than are the more traditional DB plans and that may be influencing the size of this difference. The percentage citing too few hours as their reason is somewhat smaller in the 401(k)-type group but not a lot
26

smaller indicating that part-time workers may still be restricted from the plans. However, the percentage of people who cite “can’t afford to contribute” and the percentage that “don’t want to tie the money up” are both several percentage points higher among the 401(k)-type group than among the more general retirement plan group reported in Table 13. Again, since the DB plans do not require an employee to make a contribution, the inclusion of DB plans in Table 13 is likely to reduce the percentage of people responding with that answer. Between 2 and 4 percent of the respondents in Tables 13 and 14 cited “employer does not contribute enough” as the reason for not participating in the sponsored retirement plan. This relatively small number indicates that is not a major deciding factor for most of the people who choose not to participate. This is in line with the Engelhardt and Kumar study which found a relatively low elasticity of participation with respect to employer matching.44 Given that the recent downturn in the economy has caused a large number of both large and small firms to either freeze their retirement plans or suspend or reduce matching contributions to their 401(k) plans, this helps assess how likely it is that people will use that as a reason to not participate in the plan in the future.45 Interestingly, 95 percent of the executives responding to the Schwab/CFO Research survey indicated that the company’s matching contributions were an important feature of the retirement plan. While a company’ contributions are an important method of sharing the success of the company with its workers, building retirement assets and possibly increasing the amount of money that participants choose to contribute it may not be the most important factor in determining whether or not a worker chooses to participate in the plan .
Section 4: Contributions
The Federal Reserve Board’s 2007 Survey of Consumer Finances found that the median value of assets in retirement accounts was $45,000 for the 52 percent of the household that had assets in retirement accounts.46 That was up from the median value in 2004 of $38,700 (both values measured in 2007 dollars). The distribution of these assets varied widely by income levels with those in the lowest 20th percentile of income having
44 Englelhardt, G. and Kumar, A. Employer Matching and 401(k) Participation: Evidence from Health and
Retirement Study, Research Department Working Paper 0601, Federal Reserve Bank of Dallas, 2006. 45 “Some Firms Suspend Their 401(k) Match,” Wall Street Journal, November 12, 2008. 46 Retirement accounts in this instance cover defined contribution plans that are from a current or former job and IRA holdings.
27

a median value of $6,500 in 2007 and those in the top 90th percentile and above having over $200,000. Households nearest retirement had a median amount of $98,000 while those age 75 or older had about $35,000. The median amount for the age group less than 35 years old was about $10,000. However, that was one of only two age groups that showed a decline in the median between 2004 and 2007 with the median amount dropping by over $2,000 (measured in 2007 dollars).47 This might indicate that the youngest group is finding retirement savings less of a priority but that is somewhat contradicted by the slight growth in the percentage of this group that has a retirement account. It may indicate that this age group is also be investing in other things, e.g., house, education. Another possible explanation is that people with smaller incomes are starting accounts but have less money to contribute to them. Based on the SIPP data, less than half of the private sector workers participating in a single pension plan through their employer in 2006 were making personal contributions to that plan. That is not too surprising for a DB plan since only a small percentage of private sector DB plans require an employee contribution although many allow contributions. For participants in DC plans about 47 percent reported making contributions in 2006. The share of workers that were making contributions was remarkably consistent across firm sizes. About 48 percent of workers in large businesses and 46 percent of workers in small businesses reported making contributions to the DC plan in which they were participating. For those workers that reported making contributions, the size of the contribution is not much different between the workers in large firms and the workers in small firms. In 2006, about 49 percent of large firm contributors and 57 percent of small business contributors to DC plans reported their contributions in dollar terms. Workers in large firms put an average of $4,331 per year into their DC plans and workers in small firms put an average of $4,474 in their DC plans, virtually identical amounts. For the workers who reported their contributions in terms of a percent of their wages, the results were also very similar with large firm workers reporting an average contribution of 5.97 percent in 2006 and small firm workers reporting an average contribution of 5.63 percent in 2006. Virtually all the respondents indicated they would receive some benefits from the fund indicating that respondents either know or think they will be vested in the plan.48
47 The other decline was in the group aged 65 to 74 where the median amount in the retirement accounts declined by over $10,000. However, there is some indication that this reflects a redistribution of the assets out of retirement accounts rather than a loss of that level of assets. 48 Plan participants are always entitled to the money they personally have contributed to the plan.
28

About 81 percent of small business respondents with DC plans and 79 percent of large business respondents with DC plans indicated they would get a lump sum payment if they left their jobs. The percent was smaller for DB plans, 57 percent among large business respondents and 59 percent among small business respondent. But DB plans often have longer vesting schedules than do DC plans. For the workers who reported an estimated balance in their DC retirement account, the amount reported was quite similar between the two firm size groups as well. Workers in large businesses reported an average balance of $36,662 in their accounts in 2006 and workers in small businesses reported an average balance of $32,058.
Section 5: Policy Implications
Based on the findings of this study if workers are offered access to a retirement plan by their employer, their behavior is very similar regardless of whether they work for a large firm or a small one. Both sets of workers participate at about the same rate (70-75 percent), and both sets of workers make similar size contributions to DC plans if they choose to contribute. This indicates that if all employers offered plans to their employees the participation rate in retirement plans would increase markedly. These findings raise three issues for policy makers to consider. First, what are the best ways of getting small businesses to sponsor a retirement plan? Second, how can the minority of workers that do not participate in plans sponsored by their employers be included? Third, how can workers enrolled in a plan be encouraged to make contributions toward their retirement savings?
Small Business Specific Plans Policy makers have put in place some methods to help small businesses to
overcome some of the obstacles to sponsoring retirement plans. H.R. 10 plans, often referred to as Keogh plans for self-employed workers, have been available to sole proprietorships and partnerships since 1962. There are both DC and DB versions of these plans. However, newer types of retirement plans, all DC plans, have been developed especially for small businesses. Those are simpler to set up than the traditional Keogh plan, have fewer reporting requirements than the standard retirement plans, and are handled like IRAs. The first is the employer-sponsored Simplified Employee Pension IRAs (SEP-IRAs), introduced in the Revenue Act of 1978. These accounts allow employers to make contributions for their employees’ retirements. In 2009 an employer could contribute up to 25 percent of an employee’s compensation, up to a maximum of
29

$49,000. While employers do not have to contribute every year, if they do contribute they must do so according to a written formula and contributions must be made for every participant who worked during the year.49 The SEP plans do not allow employees to make contributions to the plans. 50 However, the second type of plan developed for small businesses is the Savings Incentive Match Plans for Employees (SIMPLE IRAs), introduced in the Small Business Job Protection Act of 1996 and it does allow employee contributions. These plans can be set up by firms with 100 or fewer employees who receive $5,000 or more in compensation from the employer in the preceding year; all employees working during any part of the year must be considered when doing this count. In order to maintain the plan the firm must meet this 100-employee limit during each succeeding year. Under the SIMPLE IRA plan, there is an employee-determined “salary reduction contribution” and employers must make either matching contributions or non-elective contributions.
Unfortunately, despite the fact these plans have now been available for many years, they seem to have produced only a modest up-tick in the number of plans sponsored.51 In 2004, the most recent year for which the data are available, there were 1.57 million taxpayers reporting $13.8 billion to SEP-IRAs (a contribution amount second only to Roth IRA contributions in that year). Contributions to SIMPLE IRA plans were reported by 1.94 million taxpayers reporting a total of $7.6 billion to the plans. However, the number of taxpayers reporting contributions to SEP-IRAs has declined. In 2000, 1.74 million taxpayers reported contributions of $10.1 billion, in 2001 that number had increased to 1.79 million but by 2004 the number was down to 1.57 million. At the end of 2002, 3.46 million taxpayers reported having a SEP-IRA account only a modest increase from the 3.31 million accounts in 2000. This may reflect a change in the tax laws in 2002. The SIMPLE IRA accounts have grown more (and may reflect a change of plan from SEP to SIMPLE IRA after the tax laws changed in 2002.) In 2000 49 Eligible employees are those that are 21 or older, have worked for the company for 3 of the last 5 years and have received at least $550 (in 2009) in compensation from the employer. 50 A Salary Reduction Simplified Employee Pension (SARSEP) was a SEP set up before 1997 that includes a salary reduction arrangement, similar to that of the SIMPLE plan. New SARSEP plans were not allowed after 1996 although existing plans could continue and any new employees of an employer sponsoring such a plan could join providing the other rules were met. SARSEP accounts are counted as SEPs in the IRS statistics. 51 It is difficult to determine exactly how many plans of these types are sponsored. Since the payments are made to an individual’s IRAs, the IRS counts the number of taxpayers that are reporting contributions or who have such an account rather than the number of businesses that sponsor them. The business sponsoring the plan is not required to fill out a Department of Labor Form 5500, as are retirement plans formed under the ERISA regulations.
30

1.49 million taxpayers reported contributions to a SIMPLE IRA account and that has grown by 30 percent to 1.94 million in 2004. However, the total number of SIMPLE IRA accounts is still below the level of the SEP accounts, increasing from 1.57 million in 2000 to 2.5 billion in 2004.
While that reflects an increase of less than half a million participants this format does have merit for helping smaller businesses provide a retirement plan for its employees and information on these plans should be more widely disseminated to small businesses. The 2003 EBRI Small Employer Retirement Survey indicated that less that 27 percent of non-plan-sponsoring small businesses were either “somewhat” or “very” familiar with SEPs and only 47 percent were “somewhat” or “very” familiar with SIMPLEs whereas 85 percent of non-sponsoring businesses in the group were “somewhat” or “very” familiar with 401(k) plans. 52 This certainly implies that the DOL brochures on these types of plans could be more widely distributed by groups that are coming into contact with small business owners.
Congress has also taken a step toward making ERISA plans somewhat less burdensome for small businesses to use. One of the issues related to ERISA plans is that the nondiscrimination testing that insures that plans receiving tax breaks are not providing substantially more generous benefits to “highly compensated employees” than they do to other participants in the plan can be more burdensome for small businesses than for large businesses. With a very small pool of employees participating, it may lead to sharp readjustments in contributions for all plan participants if a few either leave the company or leave the plan. To help resolve this, there is a “safe harbor” provision in 401(k) law that provides employers with the option of not having to do nondiscrimination testing every year in return for some guarantees of pension contributions to all their plan members. One type of these safe harbor 401(k) plans is the SIMPLE 401(k). Like the SIMPLE IRA, the SIMPLE 401(k) plan is restricted to business with 100 or fewer employees. Because these are a type of 401(k) plan they are not as easy to set up as a SIMPLE IRA plan and they do have DOL reporting requirements.
However, these efforts to provide a more simplified retirement program may not overcome the major concerns of small business owners about starting plans. Given the uncertainty around the revenue stream and sometimes the business’ potential for success employers will be reluctant to commit to certain levels of contributions. Furthermore, the
52 Furthermore 47 percent of the businesses had never heard of SEPs and 32 percent had never heard of SIMPLE plans.
31

complicated process for shutting down an ERISA-type plan can also be an impediment for any business owner that is uncertain of his or her business’ likelihood of success.53
Balancing Policy Goals Policymakers recognize that there is a balancing of goals with respect to making
retirement plans less burdensome. Using private businesses as conduits for retirement savings has a great many potential benefits but with workers making their own contributions and mixing them in with company contributions there is an absolute necessity for protecting workers against potential malfeasance. Also, the tax deferrals available through these plans make them attractive for people to save for their retirement but also open the system up for misuse by those who wish to shelter income that would otherwise be saved in a way that made it taxable. But the laws guarding against these possible abuses of the system also mean the potential small business sponsor is faced with a daunting set of rules and regulations to understand and follow.
The other two policy issues are somewhat less complex but may be no easier to solve. Better education about financial literacy would help improve participation rates among workers who have access to a plan and contribution rates among workers are already participating in the plan. Part of this is to help enlighten people about the real challenges of funding retirement at a relatively young age. The number of people listing “can’t afford to contribute” and “don’t want to tie the money up” as the reason for not participating in a retirement plan may indicate a lack of understanding about these long-term choices by some of these workers. The Social Security Administration already takes one important step in this direction by sending statements each year that provide estimates of a person’s potential Social Security payments at retirement.
However, even to put those numbers in a financial planning perspective, people must be able to understand the underlying assumptions about wages and continued contributions to the system. Furthermore, people have to understand how to evaluate what it is going to cost to live during their retirement years and how many years they will be expected to supplement the Social Security income with savings. Studies on financial literacy indicate that many households lack even the most basic understanding of 53 The Department of Labor had a working group prepare a report on “Financial Literacy of Plan Participants and the Role of the Employer.” One of that report’s findings was to update Interpretive Bulletin 96-1 on a regular basis to help plan sponsors understand their fiduciary responsibilities. However, that bulletin is somewhat intimidating to readers who are seeking information about setting up plans and who do not already have a good understanding of what is involved. DOL does have a brochure that provides more general information but the EBRI survey indicates a large percentage of small businesses have not seen it.
32

economic concepts needed to judge debt obligations, savings and investment options.54 The length of time and potential risks to one’s investments between the time money is saved and retirement makes it difficult to choose the most appropriate retirement options and saving vehicles. If a person does not understand interest rates, compounding of money or other basic financial computations, these decisions become overwhelmingly difficult.
Remedying this lack of financial education would also help reduce the relatively large percentage of people who cited “other” reasons for not participating in a plan. Retirement plans are confusing to understand and making decisions about them is overwhelming for some people. While “I don’t understand it” is not one of the specific choices in the SIPP survey’s options it is one reason that people do not participate in retirement plans or if they do participate do not make more effective choices for investing their money. Educational materials on the basics of retirement planning need to be made available in a wide array of financial and educational settings from the time people are quite young in order to build-up a level of financial literacy over time.
One method that has helped to increase employers’ education of their employees about the benefits of participating in and contributing to the employer sponsored retirement plan has been the nondiscrimination provisions of the these plans. Since the ability of the “highly-compensated” group to invest in the plans was closely tied to the actions of the rest of the participants, there was an incentive for the former to help educate the latter in the virtues of saving for retirement and perhaps encourage them to do so by making matching contributions when participants make contributions. The safe harbor provisions that have been put in law to help make the plans easier to administer for small businesses also reduce the discrimination testing that made it beneficial for employers to invest in the financial literacy of their employees.55 This is another example of the balancing of priorities that policymakers face.
Often sheer inertia keeps people from participating. This is where automatic enrollment in a DC plan can be helpful.56 For plans with this attribute, a new employee is automatically enrolled in a plan unless the person specifically decides not to participate. That is in contrast to the more standard situation for DC plans where workers 54 Lusardi, A. and O. Mitchell. Financial Literacy and Retirement Preparedness: Evidence and Implications for Financial Education Programs. Michigan Retirement Research Center, December 2006. 55 Munnell, A., A. Sunden and C. Taylor. What Determine 401(k) Participation and Contributions? Center for Retirement Research at Boston College. December 2000. 56 DB plans usually have automatic enrollment.
33

must make an effort to sign up for the plan and make decisions about how much to contribute, what to invest in, and the other decisions associated with the plan. Several studies have shown that automatic enrollment increases participation rates especially among the youngest employees, those that are least likely to participate in a retirement plan. One study found that 86 percent of new workers participated in a plan when the choice was to opt-out of the plan compared to 45 percent when the choice was to opt-in to a plan. The results for lower salaried individuals was even more striking, 77 percent participating under an opt-out plan and only 25 percent participating under an opt-inplan.
r
to
ing are
e a
retirem
nless in
retirement accounts until the time of retirement. This is an especially important
57 This very simple change to how the plan is set up could both increase the numbeof people participating and increase the number of participants that are making contributions since the automatic participation usually sets up an automatic deductionthe plan as well.58 However, there have also been studies that point to the downside of this process. Once people are automatically enrolled, there is often inertia in makchanges to the automatic contribution levels. Consequently, those participants whonow making active decisions about how much to save and what to invest in would belikely to save less under automatic enrollment rules. That has caused some retirement experts to argue in favor of active enrollment, giving employees a cut-off date to makdecision about enrolling in the plan.59 While these options may increase participation inthe plan they also provide another level of decision making for potential sponsors of
ent plans. A related issue is how to keep retirement funds in retirement accounts when
workers leave jobs that have retirement plans. DC plans generally have the option of taking your vested accumulated assets with you when you leave a job. Those can be deposited or “rolled over” into an individual IRA account or a new 401(k) without a taxpenalty but there is also some leakage from the system as workers cash their plans out and pay the tax penalties for removing money early from a retirement plan. A system whereby the automatic option would be for the plan assets to be directed to an IRA uthe participant specifies otherwise might help to reduce leakage and keep money
57 Nesmith, W., S. Utkus and J. Young. “Measuring the Effectiveness of Automatic Enrollment,” Vanguard Center for Retirement Research, vol. 31 (2007) 58 This would also help reduce the number of people who are unaware that they are eligible for a plan since the business would automatically enroll those who are eligible. 59 Choi, J., D. Laibson and B. Madrian. “Plan Design and 401(k) Savings Outcomes,” National Tax Journal 52(2), June 2004, pp. 275-298.
34
consideration when workers are likely to have numerous jobs during their working lives. But once again this increases the plans sponsors’ responsibilities.60
There is one other automatic process that is being increasingly considered to help people with retirement savings not to use up their savings too early in their retirement. That is automatic annuitization of retirement benefits at the time of retirement. This would automatically use part of the retirement funds in the account to buy an annuity when the employee retires unless the employee makes the decision to opt-out and take a lump-sum distribution.61
One other balancing of policy goals may involve the choices that are made about health insurance coverage. The current policy debates about health insurance coverage include some proposals that would mandate health insurance for workers. That may cause some workers to make the choice of funding their health insurance premiums with money they might otherwise have saved for retirement. The tables in Section 3 indicate that 20 to 25 percent of workers who do not participate in retirement plans do not think they can afford to do so. A policy choice that mandates some of their income be used to cover health insurance premiums may also increase the number of people who do not participate in retirement savings. Health insurance coverage and retirement savings for every worker are both worthy goals but may not be immediately achievable at one time.
Possible Alternatives for Retirement Savings The complexities of retirement plans and the uncertainties about relying on
businesses to sponsor plans in order to help workers to save for retirement has prompted several scholars to propose other alternatives. One is the Super Simple Savings Plan proposed by Perun and Steuerle.62 This would be a major overhaul to the system because it would require employers to sponsor a plan and would be based on four concepts: universality for all workers regardless of where they work, better incentives for low- and middle-income workers, tax law that focuses primarily on increasing retirement assets of the low- and middle-income worker rather than policing the behavior of the high-paid
60 Under current rules, an employer will automatically roll-over a DC account balance of between $1,000 and $5,000 into an IRA and will cash out any plan with less than $1,000 if the departing employee does not provide any instructions. 61 Gale, W. et al. Increasing Annuitization in 401(k) Plans with Automatic Trial Income, Retirement Security Project, 2008. 62 Perun, P. and C.E. Steuerle. Why Not a “Super Simple” Savings Plan for the United States? Urban Institute, 2008.
35

workers, and a simpler design that eliminates many of the administrative costs of the current system.
A somewhat less radical approach is the automatic IRA. As described by The Retirement Security Project, businesses that are more than 2 years old, with 10 or more employees and not already sponsoring a pension plan can use their payroll system to allow workers to save money in an individual IRA account. 63 David John and Mark Iwry, describe the benefits of such as system as allowing workers “not covered by an employer-sponsored retirement plan the opportunity to save through the powerful mechanism of regular payroll deposits that continue automatically. The employer’s administrative functions are minimal and should involve no out-of-pocket cost. In addition, the arrangement is market-oriented and realistic: it uses a well established and familiar vehicle, IRAs, provided by the same banks, mutual funds, insurance carriers, brokerage firms, credit unions and other private financial institutions that currently provide them.”64 However, the authors are careful to state that these are not meant to be a replacement for employer-sponsored plans. One protection against that is that the maximum annual savings amount allowed through an IRA is much lower than the amount that is allowed to be saved through a retirement plan.
There is no one simple policy change that will increase the participation of workers in their retirement savings. However, several of the above proposals used together would broaden the number of workers making regular contributions into such plans. One of the most important aspects for the long run must be better education of workers as to the importance and necessity of saving for retirement and helping them have enough financial background and education to feel confident in making investment choices for those assets.
Section 6: Conclusions
There are benefits to an employer-sponsored retirement plans when compared to individual opportunities to save for retirement. Having a system where people already have a plan available to them whereby payroll deductions can be made on a regular and
63 Automatic IRAs: Extending Retirement Saving Opportunities to 75 Million More American Workers, The Retirement Security Project fact sheet, February 2007. 64 John, D. and J.M. Iwry. Pursuing Universal Retirement Security Through Automatic IRAs, Congressional Testimony before the Subcommittee on Select Revenue Measures, Committee on Ways and Means, U.S. House of Representatives, June 26, 2008.
36

automatic basis is more likely to encourage people to save for retirement than depending on individual savings alone. The fiduciary responsibilities of the retirement plan sponsor also mean that at least a minimum of information about the retirement plan is provided. Even so, a significant percentage of workers whose employers sponsor a retirement plan, do not participate in it. Among the workers that are participating in plans, half do not make a contribution to the plan themselves.
These data confirm previously reported general information about retirement plans by firm size. Employees working for small firms with less than 100 workers are much less likely to have a retirement plan (DB or DC) available to them than do employees of firms with 100 or more employees. Large firms are also somewhat more likely to provide multiple pension plans to participants (Table 7). Small firms are somewhat more likely than large firms to offer DC plans, although all size firms are more often offering that type of plan than they did a decade ago.
However, for those who have a plan offered by their employer, there are not wide differences by firm size. Workers participate at about the same rate. Workers make contributions at about the same rate and by roughly the same amount. This implies that providing a plan would be the biggest step forward in helping to raise the amount of money saved by workers in small businesses. These data provide somewhat more information about why people do not participate in retirement plans that are available to them and therefore provide some guidance for policy makers about how to increase the participation in pension plans. Interestingly, the reasons given by employees of small firms are not very different from the reasons given by employees of large firms. Obviously, the biggest step that can be taken is to make it easier for small firms to provide some sort of retirement plan to their employees. The Labor Department does provide employers with some information about SIMPLE IRA, SEP IRA and SIMPLE 401(k) plans that are designed to be easier for small businesses to sponsor. The Department of Labor along with the IRS has also put together a document on automatic enrollment 401(k) plans for small businesses, these are the opt-out plans where people are automatically enrolled unless they decide not to participate. These brochures describe the basic requirements of providing such plans. However, the fiduciary responsibilities, record keeping requirements and plan documents that any employer-sponsored plan must comply with will tend to discourage a certain percentage of small businesses from participating in these options. Consequently, individual retirement account options will need to be maintained even if the share of employer plans is increased.
37

While traditionally, the DB plan has been considered a “better” and less risky method of accumulating retirement savings for workers, both large and small firms have moved away from these plans toward DC plans. On the other hand, DB plans often have long vesting periods where employees who worked less than five years did not earn any claim on pension accumulations and workers frequently cannot receive benefits until they retire. Most DC plans have relatively short vesting periods and employees have a claim on some or all of their assets in a year of employment or less. Consequently, the shift toward DC plans overall and the much higher use of DC plans by small businesses may be beneficial to a population that has several jobs during a lifetime of working.
A relatively large percent of employees perceive that they are not eligible for a retirement plan. There certainly are restrictions on retirement plans that do not allow part-time workers to join and there are usually delays, even for 401(k) plans, before new employees can join a plan. In a workforce that is becoming more transient, that may reduce the number of people that participate in savings opportunities for their futures. However, the differences between eligibility reports from businesses compared with individual reporting may also indicate that people are not well educated about the workings of retirement plans and their eligibility for them. Small businesses, in particular, are unlikely to have the human resources departments that are often tasked with these educational responsibilities in larger companies. Consequently, employees may be left with incomplete information about their options.
38

Appendix A: Data
The SIPP survey assigns a weight to each observation; that allows the data to approximate the entire population it is covering. The data used for this study produced an estimate for 124.7 million private sector workers and business owners. This was checked against other information available on the number of workers in the economy in 2006 (the time period for the survey). The Bureau of Labor Statistics’ household survey indicates that there were 121.8 million nonagricultural private industry workers including the self-employed in 2006. The Census Bureau’s Statistics of U.S. Businesses (SUSB) shows there were 119.9 million private sector workers in 2006 but that data set does not include the self-employed workers that do not have employees. The Census reports there were an additional 20.8 million businesses with no paid employees in 2006. If the SUSB data are added to the estimate of non-employer businesses, the total is 140.7 million. However, the 20.8 million businesses with no paid employees include many businesses that are a second job for the owner. The SIPP data used for this study only includes owners of businesses who considered that to be their primary job.65 The SIPP data seem to approximate the population totals from other sources although it may slightly overestimate the numbers. Table A.1: Comparison of the Distribution of Workers in the SIPP Data to the Distribution
of Workers from other Census Data Sources by Firm Size (Percent) 100+ <100 20-99 10-19 <10 2006 SUSB 64.4 35.6 17.6 7.2 10.8 2006 SUSB plus nonemployer businesses (Census)
54.9 45.2 15.0 6.2 24.0
100+ <100 25-99 10-24 <10 2006 SIPP 54.4 45.6 12.3 9.5 23.8 Source: Census Bureau, SIPP and Statistics of U.S. Businesses
The other cross check was to examine the distribution of the worker counts by firm size against other sources. There is only one source of information with which to make this comparison. That is the Census Bureau’s SUSB data. Only two categories of the SUSB data match the categories of the SIPP data, the 100+ category and the <10 category (although the latter is not strictly comparable using the SUSB data alone since the nonemployer businesses are missing from the SUSB data.) The following table 65 In addition, the owners in the SIPP survey may have employees although not all of them do.
39

40
compares the distribution across business sizes of the workers in the SIPP survey and those in the SUSB data alone and the SUSB data added to the nonemployer business data (assuming one person, the owner, per business). The distribution of the SIPP data is very close to the distribution of the SUSB data plus the nonemployer business data. Since the SIPP data probably covers a universe somewhere between the two SUSB-based calculations, it may mean that the SIPP data is showing a somewhat higher percentage of small business workers than the SUSB data set would estimate.

Appendix B: Additional Tables
The tables in the Appendix are generally more disaggregated than those in the text and are based on fewer observations. The data are provided to complete the picture of pension plan coverage by firm size but because of the smaller number of observations for the more disaggregated small business size groups, the estimates will not have the same level of precision as those percentages that are based on all small businesses combined.
Table B.1: Distribution of Private Industry Workers in Small Businesses Whose Employers Sponsor a
Retirement Plan by Plan Type and Firm Size Category, 2006 (Percent)
Firm employment size <10 10-24 25-49 50-99 <100
Defined Benefit (DB) Plans
Respondent participates in a DB plan as the only or the most important plan
17.8 17.8 21.3 19.6 19.2
Respondent does not participate in the employer’s plan but it is a DB plan.*
7.5 6.0 5.6 3.9 5.8
Defined Contribution (DC) Plans Respondent participates in a DC plan as only or most
important plan 57.5 51.2 49.8 47.1 50.2
Respondent does not participate in employer’s plan but it is a DC plan
17.9 26.4 25.7 29.8 25.0
Cash Balance Plans Respondent participates in a cash balance plan as only
or most important plan 7.6 3.0 3.7 5.1 4.8
*The respondents indicate that the plan they do not participate in is not a 401(k) type of plan; it is assumed that those are DB plans. Note: The total adds to more than 100 because some respondents indicate they participate in more than one plan. Source: SIPP, Census Bureau
41

Table B.2: Detailed Distribution of Private Industry Workers in Small Businesses Whose Employers
Sponsor a Retirement Plan—by Plan Type and Firm Size Category, 2006 (Percent) Firm size employment
< 10 10-24 25-49 50-99 <100Defined Benefit (DB) Plans Respondent participates in one plan and it is
a DB plan 16.0 14.9 18.4 17.0 16.6
Respondent participates in more than one plan and the most important is a DB plan.
2.9 2.9 2.9 2.7 2.6
Respondent participates in more than one plan and the second most important plan is a DB plan.
1.0 0.7 1.2 2.2 1.3
Respondent does not participate any plan but the employer sponsors a DB plan.*
7.5 6.0 5.6 3.9 5.8
Defined Contribution (DC) Plans Respondent participates in one plan and it is
a DC plan. 42.9 39.1 37.1 35.1 38.5
Respondent participates in more than one plan and the most important is a DC plan.
1.6 1.6 1.7 2.3 1.8
Respondent participates in more than one plan and second most important plan is a DC plan.
3.3 3.8 3.6 3.2 3.5
Respondent does not participate in any plan but employer sponsors a DC plan.
15.6 23.7 22.7 27.3 22.3
Respondent identifies participation in one DC plan but also participates in an employer’s 401(k)-type plan
8.3 4.5 6.1 5.7 6.1
Respondent reports there is no retirement plan sponsored by the employer but indicates participation in an employer’s 401(k)-type plan.
7.1 6.1 4.7 4.1 5.0
Respondent reports the employer does not sponsor any retirement plan but also indicates the employer does sponsor a 401(k)-type plan in which respondent does not participate
2.3 2.7 3.0 2.6 2.7
Cash Balance Plans Respondent participates in one plan and it is
a cash balance plan. 6.5 2.6 3.4 4.7 4.3
Respondent participates in more than one plan and the most important is a cash balance plan.
1.0 0.4 0.3 0.5 0.5
Respondent participates in more than one plan and second most important plan is a cash balance plan.
0.0 0.3 0.1 0.1 0.2
*The respondents indicate that the plan they do not participate in is not a 401(k) type of plan; it is assumed that those are DB plans. Note: The total adds to more than 100 because some respondents participate in more than one plan. Source: SIPP, Census Bureau
42

Table B.3: Detailed Distribution of Private Industry Workers Whose Employers Sponsor a Retirement
Plan by Plan Type —All Firms 1998, 2003, 2006 (Percent) 1998 2003 2006Defined Benefit (DB) Plans (includes cash balance in 1998) Respondent participates in one pension plan and it is a defined
benefit plan 26.8 21.5 20.4
Respondent participates in more than one pension plan and the most important is a defined benefit plan.
7.6 7.0 5.0
Respondent participates in more than one pension plan and the second most important plan is a defined benefit plan.
5.9 3.9 3.9
Respondent does not participate in the employer’s pension plan.* 6.9 6.7 4.6Defined Contribution (DC) Plans Respondent participates in one plan and it is a DC plan. 26.0 31.4 31.7 Respondent participates in more than one plan and the most
important is a DC plan. 6.1 4.7 4.0
Respondent participates in more than one plan and second most important is a DC plan.
7.8 7.3 5.3
Respondent does not participate in any plan but employer sponsors a DC plan
21.9 18.8 22.7
DC/401(k)-Type Plans that the Employer Sponsors but the Respondent does Not Identify as a Retirement Plan Respondent identifies participation in one DC plan but also
participates in an employer’s 401(k)-type plan 4.9 4.5 6.9
Respondent reports there is no retirement plan sponsored by the employer but indicates participation in an employer’s 401(k)-type plan.
2.6 2.7 3.9
Respondent reports the employer does not sponsor any retirement plan but also indicates the employer does sponsor a 401(k)-type plan in which respondent does not participate
2.1 2.4 2.5
Cash Balance Plans Respondent participates in one pension and it is a cash balance plan. NA 4.1 4.3 Respondent participates in more than one plan and most important is
a cash balance plan. NA 0.8 0.9
Respondent participates in more than one plan and second most important is a cash balance plan.
NA 1.3 0.7
*The respondents indicate that the plan they do not participate in is not a 401(k)-type of plan; it is assumed that most of those are DB plans. Note: Cash balance plans were not a survey option in 1998, those were probably allocated the DB plans. Note: The total adds to more than 100 because some respondents indicate they participate in more than one plan. Source: SIPP, Census Bureau
43
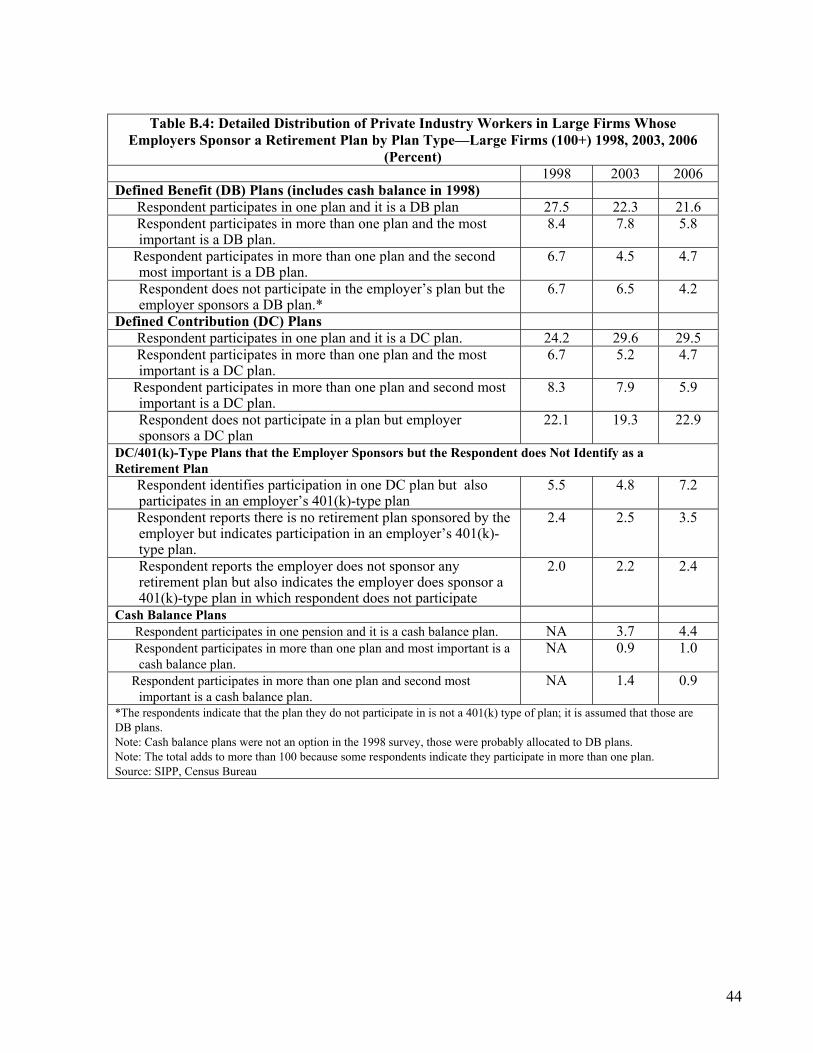
Table B.4: Detailed Distribution of Private Industry Workers in Large Firms Whose
Employers Sponsor a Retirement Plan by Plan Type—Large Firms (100+) 1998, 2003, 2006 (Percent)
1998 2003 2006Defined Benefit (DB) Plans (includes cash balance in 1998) Respondent participates in one plan and it is a DB plan 27.5 22.3 21.6 Respondent participates in more than one plan and the most
important is a DB plan. 8.4 7.8 5.8
Respondent participates in more than one plan and the second most important is a DB plan.
6.7 4.5 4.7
Respondent does not participate in the employer’s plan but the employer sponsors a DB plan.*
6.7 6.5 4.2
Defined Contribution (DC) Plans Respondent participates in one plan and it is a DC plan. 24.2 29.6 29.5 Respondent participates in more than one plan and the most
important is a DC plan. 6.7 5.2 4.7
Respondent participates in more than one plan and second most important is a DC plan.
8.3 7.9 5.9
Respondent does not participate in a plan but employer sponsors a DC plan
22.1 19.3 22.9
DC/401(k)-Type Plans that the Employer Sponsors but the Respondent does Not Identify as a Retirement Plan Respondent identifies participation in one DC plan but also
participates in an employer’s 401(k)-type plan 5.5 4.8 7.2
Respondent reports there is no retirement plan sponsored by the employer but indicates participation in an employer’s 401(k)-type plan.
2.4 2.5 3.5
Respondent reports the employer does not sponsor any retirement plan but also indicates the employer does sponsor a 401(k)-type plan in which respondent does not participate
2.0 2.2 2.4
Cash Balance Plans Respondent participates in one pension and it is a cash balance plan. NA 3.7 4.4 Respondent participates in more than one plan and most important is a
cash balance plan. NA 0.9 1.0
Respondent participates in more than one plan and second most important is a cash balance plan.
NA 1.4 0.9
*The respondents indicate that the plan they do not participate in is not a 401(k) type of plan; it is assumed that those are DB plans. Note: Cash balance plans were not an option in the 1998 survey, those were probably allocated to DB plans. Note: The total adds to more than 100 because some respondents indicate they participate in more than one plan. Source: SIPP, Census Bureau
44
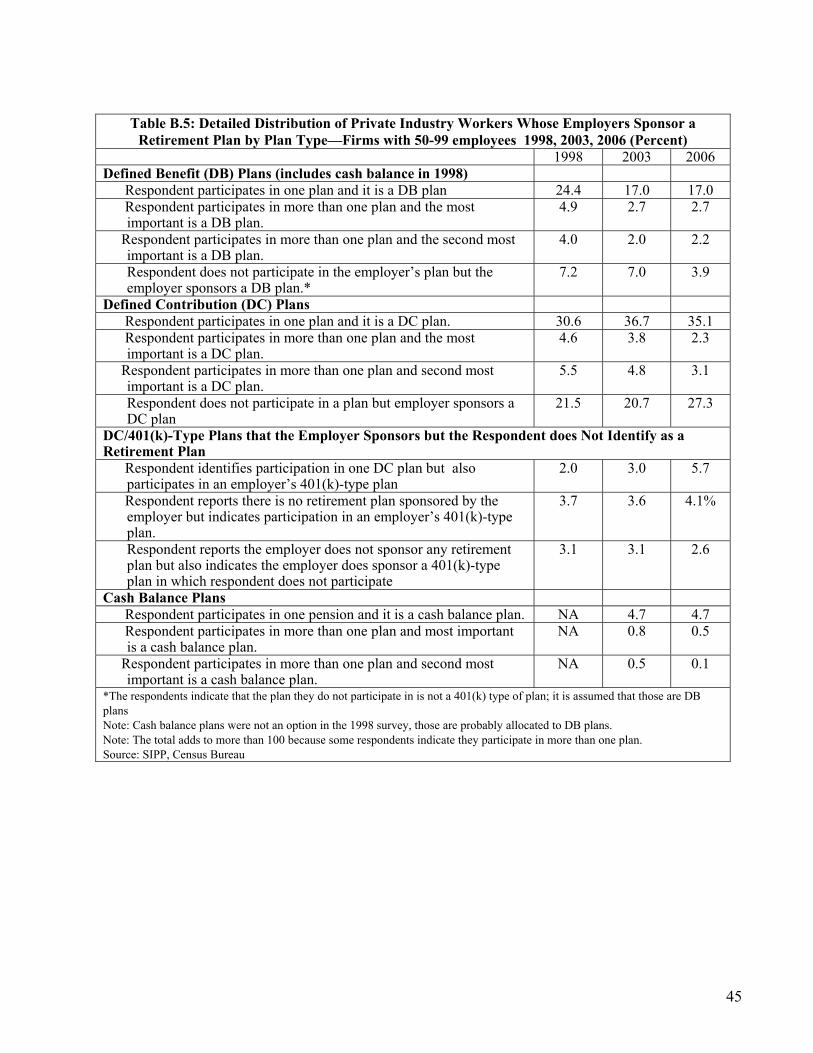
Table B.5: Detailed Distribution of Private Industry Workers Whose Employers Sponsor a
Retirement Plan by Plan Type—Firms with 50-99 employees 1998, 2003, 2006 (Percent) 1998 2003 2006Defined Benefit (DB) Plans (includes cash balance in 1998) Respondent participates in one plan and it is a DB plan 24.4 17.0 17.0 Respondent participates in more than one plan and the most
important is a DB plan. 4.9 2.7 2.7
Respondent participates in more than one plan and the second most important is a DB plan.
4.0 2.0 2.2
Respondent does not participate in the employer’s plan but the employer sponsors a DB plan.*
7.2 7.0 3.9
Defined Contribution (DC) Plans Respondent participates in one plan and it is a DC plan. 30.6 36.7 35.1 Respondent participates in more than one plan and the most
important is a DC plan. 4.6 3.8 2.3
Respondent participates in more than one plan and second most important is a DC plan.
5.5 4.8 3.1
Respondent does not participate in a plan but employer sponsors a DC plan
21.5 20.7 27.3
DC/401(k)-Type Plans that the Employer Sponsors but the Respondent does Not Identify as a Retirement Plan Respondent identifies participation in one DC plan but also
participates in an employer’s 401(k)-type plan 2.0 3.0 5.7
Respondent reports there is no retirement plan sponsored by the employer but indicates participation in an employer’s 401(k)-type plan.
3.7 3.6 4.1%
Respondent reports the employer does not sponsor any retirement plan but also indicates the employer does sponsor a 401(k)-type plan in which respondent does not participate
3.1 3.1 2.6
Cash Balance Plans Respondent participates in one pension and it is a cash balance plan. NA 4.7 4.7 Respondent participates in more than one plan and most important
is a cash balance plan. NA 0.8 0.5
Respondent participates in more than one plan and second most important is a cash balance plan.
NA 0.5 0.1
*The respondents indicate that the plan they do not participate in is not a 401(k) type of plan; it is assumed that those are DB plans Note: Cash balance plans were not an option in the 1998 survey, those are probably allocated to DB plans. Note: The total adds to more than 100 because some respondents indicate they participate in more than one plan. Source: SIPP, Census Bureau
45

Table B.6: Detailed Distribution of Private Industry Workers Whose Employers Sponsor a
Retirement Plan by Plan Type —Firms with 25-49 employees 1998, 2003, 2006 (Percent) 1998 2003 2006Defined Benefit (DB) Plans (includes cash balance in 1998) Respondent participates in one plan and it is a DB plan 22.2 17.5 18.4 Respondent participates in more than one plan and the most
important is a DB plan. 6.0 4.7 2.95
Respondent participates in more than one plan and the second most important is a DB plan.
3.6 2.3 1.2
Respondent does not participate in the employer’s plan but the employer sponsors a DB plan.*
6.2 6.4 5.6
Defined Contribution (DC) Plans Respondent participates in one plan and it is a DC plan. 35.0 38.0 37.1 Respondent participates in more than one plan and the most
important is a DC plan. 3.8 3.6 1.7
Respondent participates in more than one plan and second most important is a DC plan.
6.2 5.9 3.6
Respondent does not participate in a plan but employer sponsors a DC plan
22.1 18.2 22.7
DC/401(k)-Type Plans that the Employer Sponsors but the Respondent does Not Identify as a Retirement Plan Respondent identifies participation in one DC plan but also
participates in an employer’s 401(k)-type plan 3.0 3.3 6.2
Respondent reports there is no retirement plan sponsored by the employer but indicates participation in an employer’s 401(k)-type plan.
3.1 3.8 4.8
Respondent reports the employer does not sponsor any retirement plan but also indicates the employer does sponsor a 401(k)-type plan in which respondent does not participate
1.6 2.9 3.0
Cash Balance Plans Respondent participates in one pension and it is a cash balance
plan. NA 4.1% 3.4
Respondent participates in more than one plan and most important is a cash balance plan.
NA 0.7% 0.3
Respondent participates in more than one plan and second most important is a cash balance plan.
NA 0.8% 0.1
*The respondents indicate that the plan they do not participate in is not a 401(k) type of plan; it is assumed that those are DB plans. Note: Cash balance plans were not an option in the 1998 survey, those are probably allocated to DB plans. Note: The total adds to more than 100 because some respondents indicate they participate in more than one plan. Source: SIPP, Census Bureau
46

Table B.7: Detailed Distribution of Private Industry Workers Whose Employers Sponsor a
Retirement Plan by Plan Type—Firms with 10-24 employees 1998, 2003, 2006 (Percent) 1998 2003 2006Defined Benefit (DB) Plans (includes cash balance in 1998) Respondent participates in one plan and it is a DB plan 24.2 18.7 14.9 Respondent participates in more than one plan and the most
important is a DB plan. 4.6 4.7 2.9
Respondent participates in more than one plan and the second most important is a DB plan.
2.1 1.6 0.7
Respondent does not participate in the employer’s plan but the employer sponsors a DB plan.*
8.1 6.1 6.0
Defined Contribution (DC) Plans Respondent participates in one plan and it is a DC plan. 30.8 38.1 39.1 Respondent participates in more than one plan and the most
important is a DC plan. 2.7 1.4 1.6
Respondent participates in more than one plan and second most important is a DC plan.
5.2 4.7 3.8
Respondent does not participate in a plan but employer sponsors a DC plan
24.2 17.9 23.7
DC/401(k)-Type Plans that the Employer Sponsors but the Respondent does Not Identify as aRetirement Plan Respondent identifies participation in one DC plan but also
participates in an employer’s 401(k)-type plan 2.8 3.3 4.5
Respondent reports there is no retirement plan sponsored by the employer but indicates participation in an employer’s 401(k)-type plan.
2.7 3.2 6.1
Respondent reports the employer does not sponsor any retirement plan but also indicates the employer does sponsor a 401(k)-type plan in which respondent does not participate
2.6 3.5 2.7
Cash Balance Plans Respondent participates in one pension and it is a cash balance
plan. NA 5.6 2.6
Respondent participates in more than one plan and most important is a cash balance plan.
NA 0.4 0.4
Respondent participates in more than one plan and second most important is a cash balance plan.
NA 0.4 0.3
*The respondents indicate that the plan they do not participate in is not a 401(k) type of plan; it is assumed that most of those are defined benefit types of plans but some percentage of them could also be cash balance plans. The data do not allow those to be identified. Note: Cash balance plans were not an option in the 1998 survey, those are probably allocated to DB plans Note: The total adds to more than 100 because some respondents indicate they participate in more than one plan. Source: SIPP, Census Bureau
47
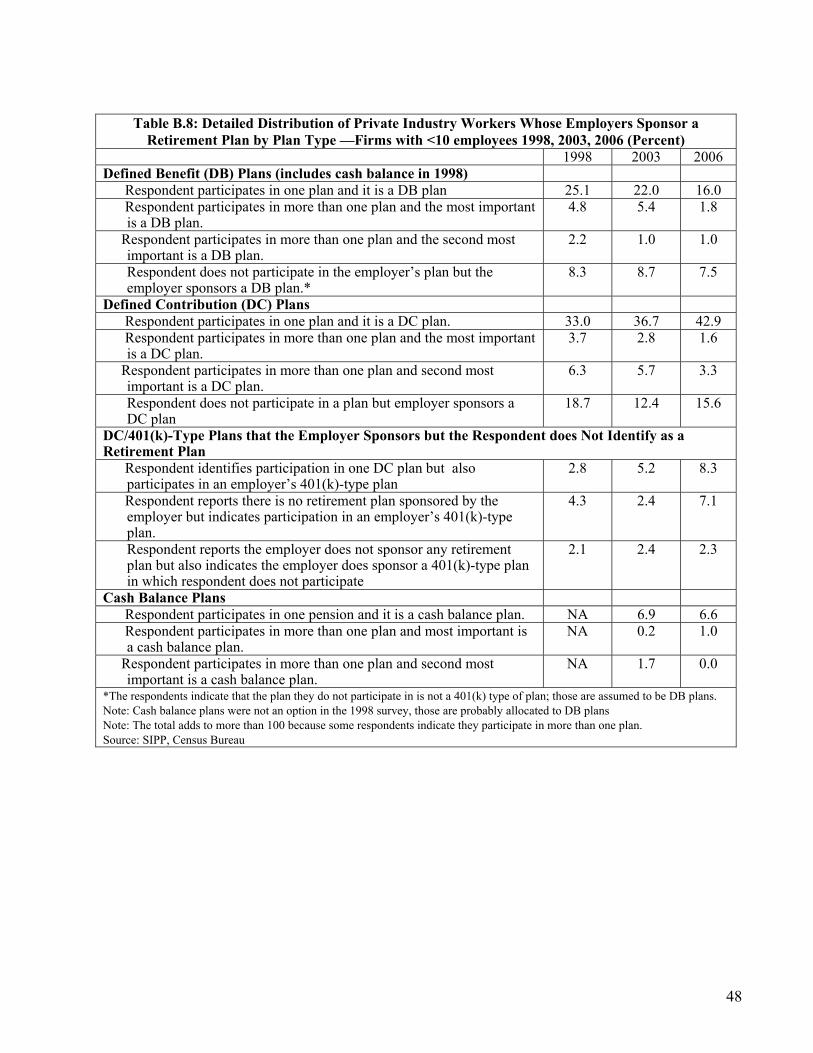
48
Table B.8: Detailed Distribution of Private Industry Workers Whose Employers Sponsor a
Retirement Plan by Plan Type —Firms with <10 employees 1998, 2003, 2006 (Percent) 1998 2003 2006Defined Benefit (DB) Plans (includes cash balance in 1998) Respondent participates in one plan and it is a DB plan 25.1 22.0 16.0 Respondent participates in more than one plan and the most important
is a DB plan. 4.8 5.4 1.8
Respondent participates in more than one plan and the second most important is a DB plan.
2.2 1.0 1.0
Respondent does not participate in the employer’s plan but the employer sponsors a DB plan.*
8.3 8.7 7.5
Defined Contribution (DC) Plans Respondent participates in one plan and it is a DC plan. 33.0 36.7 42.9 Respondent participates in more than one plan and the most important
is a DC plan. 3.7 2.8 1.6
Respondent participates in more than one plan and second most important is a DC plan.
6.3 5.7 3.3
Respondent does not participate in a plan but employer sponsors a DC plan
18.7 12.4 15.6
DC/401(k)-Type Plans that the Employer Sponsors but the Respondent does Not Identify as a Retirement Plan Respondent identifies participation in one DC plan but also
participates in an employer’s 401(k)-type plan 2.8 5.2 8.3
Respondent reports there is no retirement plan sponsored by the employer but indicates participation in an employer’s 401(k)-type plan.
4.3 2.4 7.1
Respondent reports the employer does not sponsor any retirement plan but also indicates the employer does sponsor a 401(k)-type plan in which respondent does not participate
2.1 2.4 2.3
Cash Balance Plans Respondent participates in one pension and it is a cash balance plan. NA 6.9 6.6 Respondent participates in more than one plan and most important is
a cash balance plan.NA 0.2 1.0
Respondent participates in more than one plan and second most important is a cash balance plan.
NA 1.7 0.0
*The respondents indicate that the plan they do not participate in is not a 401(k) type of plan; those are assumed to be DB plans. Note: Cash balance plans were not an option in the 1998 survey, those are probably allocated to DB plans Note: The total adds to more than 100 because some respondents indicate they participate in more than one plan. Source: SIPP, Census Bureau
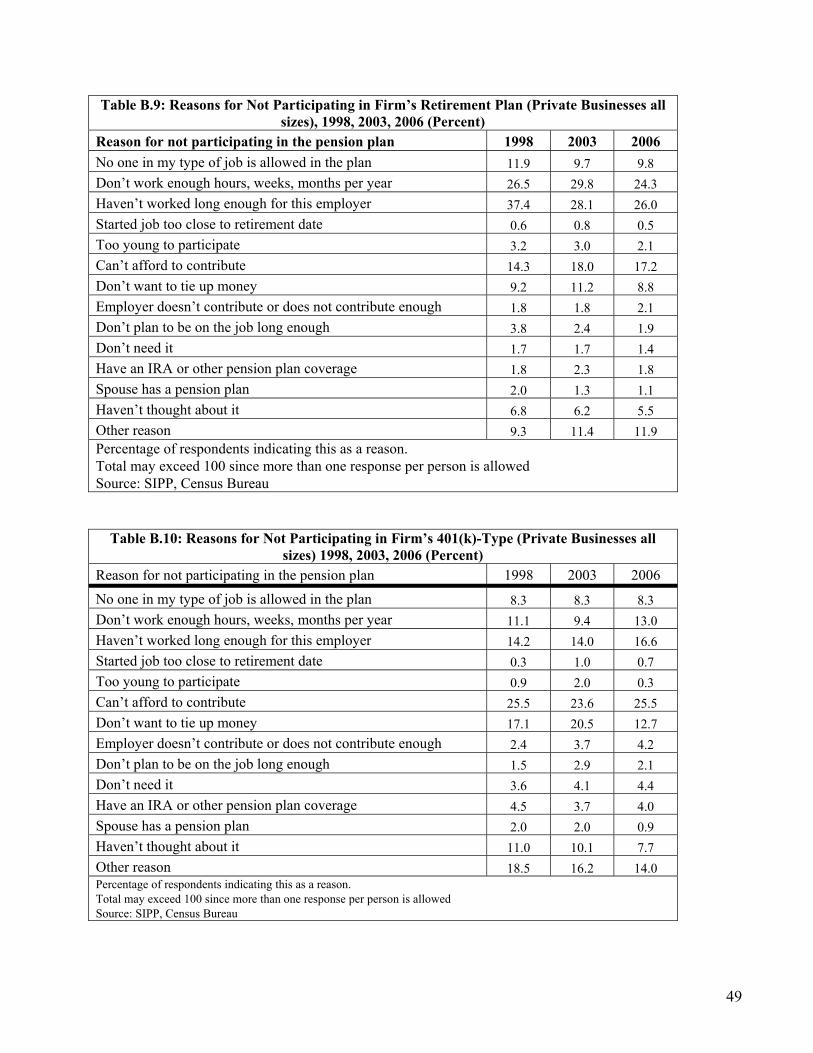
Table B.9: Reasons for Not Participating in Firm’s Retirement Plan (Private Businesses all sizes), 1998, 2003, 2006 (Percent)
Reason for not participating in the pension plan 1998 2003 2006 No one in my type of job is allowed in the plan 11.9 9.7 9.8 Don’t work enough hours, weeks, months per year 26.5 29.8 24.3 Haven’t worked long enough for this employer 37.4 28.1 26.0 Started job too close to retirement date 0.6 0.8 0.5 Too young to participate 3.2 3.0 2.1 Can’t afford to contribute 14.3 18.0 17.2 Don’t want to tie up money 9.2 11.2 8.8 Employer doesn’t contribute or does not contribute enough 1.8 1.8 2.1 Don’t plan to be on the job long enough 3.8 2.4 1.9 Don’t need it 1.7 1.7 1.4 Have an IRA or other pension plan coverage 1.8 2.3 1.8 Spouse has a pension plan 2.0 1.3 1.1 Haven’t thought about it 6.8 6.2 5.5 Other reason 9.3 11.4 11.9 Percentage of respondents indicating this as a reason. Total may exceed 100 since more than one response per person is allowed Source: SIPP, Census Bureau
Table B.10: Reasons for Not Participating in Firm’s 401(k)-Type (Private Businesses all sizes) 1998, 2003, 2006 (Percent)
Reason for not participating in the pension plan 1998 2003 2006 No one in my type of job is allowed in the plan 8.3 8.3 8.3 Don’t work enough hours, weeks, months per year 11.1 9.4 13.0 Haven’t worked long enough for this employer 14.2 14.0 16.6 Started job too close to retirement date 0.3 1.0 0.7 Too young to participate 0.9 2.0 0.3 Can’t afford to contribute 25.5 23.6 25.5 Don’t want to tie up money 17.1 20.5 12.7 Employer doesn’t contribute or does not contribute enough 2.4 3.7 4.2 Don’t plan to be on the job long enough 1.5 2.9 2.1 Don’t need it 3.6 4.1 4.4 Have an IRA or other pension plan coverage 4.5 3.7 4.0 Spouse has a pension plan 2.0 2.0 0.9 Haven’t thought about it 11.0 10.1 7.7 Other reason 18.5 16.2 14.0 Percentage of respondents indicating this as a reason. Total may exceed 100 since more than one response per person is allowed Source: SIPP, Census Bureau
49

Table B.11: Reasons for Not Participating in Firm’s Retirement Plan Large Private Industry Firms (100+ Employees) 1998, 2003, 2006 (Percent)
Reason for not participating in the pension plan 1998 2003 2006 No one in my type of job is allowed in the plan 12.0 10.2 10.5 Don’t work enough hours, weeks, months per year 26.7 30.0 24.7 Haven’t worked long enough for this employer 37.3 26.4 25.4 Started job too close to retirement date 0.6 0.6 0.5 Too young to participate 3.4 2.8 2.1 Can’t afford to contribute 14.7 19.1 17.3 Don’t want to tie up money 9.4 11.7 9.4 Employer doesn’t contribute or does not contribute enough 1.7 1.7 2.0 Don’t plan to be on the job long enough 3.6 2.4 2.0 Don’t need it 1.6 1.8 1.1 Have an IRA or other pension plan coverage 1.7 2.2 1.8 Spouse has a pension plan 1.7 1.1 1.0 Haven’t thought about it 7.1 7.0 6.0 Other reason 9.1 11.2 10.8 Total may exceed 100 since more than one response per person is allowed Source: SIPP, Census Bureau Table B.12: Reason for Not Participating in Firm’s 401(k)-Type Plan Large Private Industry
Firms (100+ Employees) 1998, 2003, 2006 (Percent) Reason for not participating in the pension plan 1998 2003 2006 No one in my type of job is allowed in the plan 8.5 8.3 7.6 Don’t work enough hours, weeks, months per year 9.7 7.5 11.5 Haven’t worked long enough for this employer 13.4 11.9 16.3 Started job too close to retirement date 0.4 1.0 0.8 Too young to participate 0.9 2.3 0.4 Can’t afford to contribute 26.7 25.0 26.5 Don’t want to tie up money 17.9 21.5 12.9 Employer doesn’t contribute or does not contribute enough 2.2 4.0 4.2 Don’t plan to be on the job long enough 1.6 3.3 1.8 Don’t need it 3.3 4.3 4.7 Have an IRA or other pension plan coverage 4.6 3.2 3.8 Spouse has a pension plan 1.9 1.9 0.7 Haven’t thought about it 12.1 10.6 8.5 Other reason 18.2 17.5 13.6 Total may exceed 100 since more than one response per person is allowed Source: SIPP, Census Bureau
50

Table B.13: Reason for Not Participating in Firm’s Retirement Plan Small Private Industry
Firms (50-99 Employees) 1998, 2003, 2006 (Percent) Reason for not participating in the pension plan 1998 2003 2006 No one in my type of job is allowed in the plan 10.0 6.2 9.3 Don’t work enough hours, weeks, months per year 16.9 30.7 16.5 Haven’t worked long enough for this employer 37.2 35.8 26.8 Started job too close to retirement date 0.4 1.0 0.7 Too young to participate 1.9 3.8 4.4 Can’t afford to contribute 16.1 16.6 14.9 Don’t want to tie up money 13.4 10.3 8.7 Employer doesn’t contribute or does not contribute enough 3.9 2.6 3.1 Don’t plan to be on the job long enough 6.1 1.9 3.4 Don’t need it 0.9 0.8 3.8 Have an IRA or other pension plan coverage 1.1 2.8 2.0 Spouse has a pension plan 1.9 1.0 2.1 Haven’t thought about it 6.0 2.7 3.5 Other reason 12.0 8.3 14.2 Total may exceed 100 since more than one response per person is allowed Source: SIPP, Census Bureau Table B.14: Reason for Not Participating in Firm’s Retirement Plan Small Private Industry
Firms (25-49 Employees) 1998, 2003, 2006 (Percent) Reason for not participating in the pension plan 1998 2003 2006 No one in my type of job is allowed in the plan 8.0 7.5 4.2 Don’t work enough hours, weeks, months per year 21.9 26.4 22.5 Haven’t worked long enough for this employer 41.1 33.5 23.2 Started job too close to retirement date 0.7 0.6 0.5 Too young to participate 3.9 3.0 1.7 Can’t afford to contribute 16.6 14.7 23.0 Don’t want to tie up money 10.2 12.0 6.0 Employer doesn’t contribute or does not contribute enough 1.6 2.3 2.2 Don’t plan to be on the job long enough 4.6 2.6 1.5 Don’t need it 2.6 2.3 1.1 Have an IRA or other pension plan coverage 2.4 3.7 1.1 Spouse has a pension plan 1.7 2.6 1.6 Haven’t thought about it 6.8 4.5 3.1 Other reason 7.6 12.9 20.1 Total may exceed 100 since more than one response per person is allowed Source: SIPP, Census Bureau
51
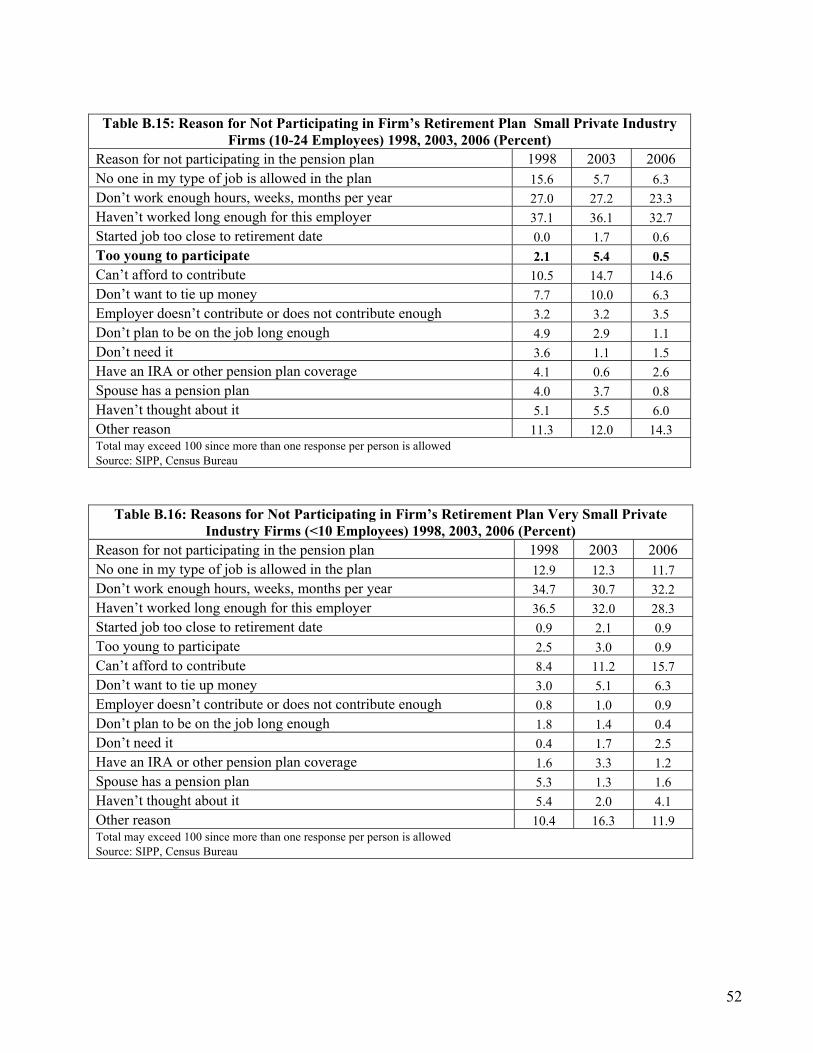
52
Table B.15: Reason for Not Participating in Firm’s Retirement Plan Small Private Industry
Firms (10-24 Employees) 1998, 2003, 2006 (Percent) Reason for not participating in the pension plan 1998 2003 2006 No one in my type of job is allowed in the plan 15.6 5.7 6.3 Don’t work enough hours, weeks, months per year 27.0 27.2 23.3 Haven’t worked long enough for this employer 37.1 36.1 32.7 Started job too close to retirement date 0.0 1.7 0.6 Too young to participate 2.1 5.4 0.5 Can’t afford to contribute 10.5 14.7 14.6 Don’t want to tie up money 7.7 10.0 6.3 Employer doesn’t contribute or does not contribute enough 3.2 3.2 3.5 Don’t plan to be on the job long enough 4.9 2.9 1.1 Don’t need it 3.6 1.1 1.5 Have an IRA or other pension plan coverage 4.1 0.6 2.6 Spouse has a pension plan 4.0 3.7 0.8 Haven’t thought about it 5.1 5.5 6.0 Other reason 11.3 12.0 14.3 Total may exceed 100 since more than one response per person is allowed Source: SIPP, Census Bureau
Table B.16: Reasons for Not Participating in Firm’s Retirement Plan Very Small Private Industry Firms (<10 Employees) 1998, 2003, 2006 (Percent)
Reason for not participating in the pension plan 1998 2003 2006 No one in my type of job is allowed in the plan 12.9 12.3 11.7 Don’t work enough hours, weeks, months per year 34.7 30.7 32.2 Haven’t worked long enough for this employer 36.5 32.0 28.3 Started job too close to retirement date 0.9 2.1 0.9 Too young to participate 2.5 3.0 0.9 Can’t afford to contribute 8.4 11.2 15.7 Don’t want to tie up money 3.0 5.1 6.3 Employer doesn’t contribute or does not contribute enough 0.8 1.0 0.9 Don’t plan to be on the job long enough 1.8 1.4 0.4 Don’t need it 0.4 1.7 2.5 Have an IRA or other pension plan coverage 1.6 3.3 1.2 Spouse has a pension plan 5.3 1.3 1.6 Haven’t thought about it 5.4 2.0 4.1 Other reason 10.4 16.3 11.9 Total may exceed 100 since more than one response per person is allowed Source: SIPP, Census Bureau
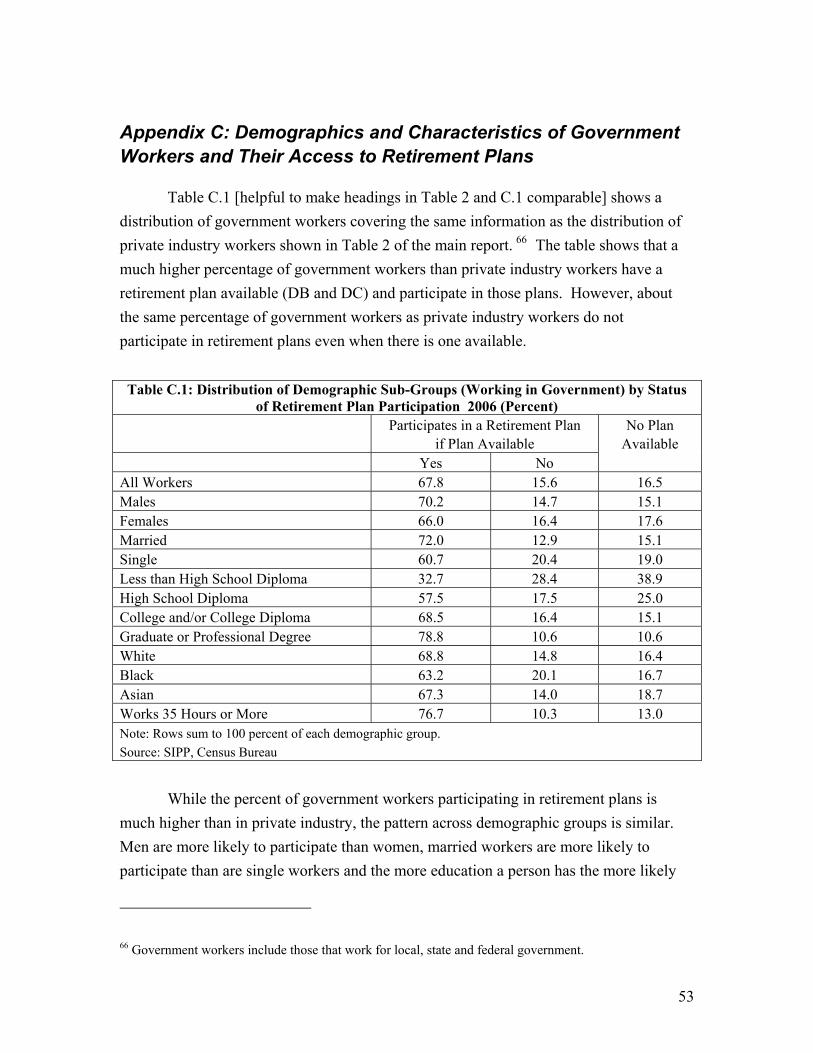
Appendix C: Demographics and Characteristics of Government Workers and Their Access to Retirement Plans
Table C.1 [helpful to make headings in Table 2 and C.1 comparable] shows a distribution of government workers covering the same information as the distribution of private industry workers shown in Table 2 of the main report. 66 The table shows that a much higher percentage of government workers than private industry workers have a retirement plan available (DB and DC) and participate in those plans. However, about the same percentage of government workers as private industry workers do not participate in retirement plans even when there is one available.
Table C.1: Distribution of Demographic Sub-Groups (Working in Government) by Status
of Retirement Plan Participation 2006 (Percent) Participates in a Retirement Plan
if Plan Available No Plan
Available Yes No All Workers 67.8 15.6 16.5 Males 70.2 14.7 15.1 Females 66.0 16.4 17.6 Married 72.0 12.9 15.1 Single 60.7 20.4 19.0 Less than High School Diploma 32.7 28.4 38.9 High School Diploma 57.5 17.5 25.0 College and/or College Diploma 68.5 16.4 15.1 Graduate or Professional Degree 78.8 10.6 10.6 White 68.8 14.8 16.4 Black 63.2 20.1 16.7 Asian 67.3 14.0 18.7 Works 35 Hours or More 76.7 10.3 13.0 Note: Rows sum to 100 percent of each demographic group. Source: SIPP, Census Bureau
While the percent of government workers participating in retirement plans is much higher than in private industry, the pattern across demographic groups is similar. Men are more likely to participate than women, married workers are more likely to participate than are single workers and the more education a person has the more likely
66 Government workers include those that work for local, state and federal government.
53

he or she is to participate in a retirement plan. In each group about 30 percent more people are participants than in the similar private industry group. This partially reflects the difference in availability although government workers do tend to be slightly older than the average private industry worker as well. Since older workers are more likely to participate in a retirement plan than are younger workers, this may have a marginal impact on the participation rates for government workers. However, the fact that approximately 16 percent of government workers do not participate in retirement plans when plans are offered indicates there may be educational or other issues that need to be addressed. Table C.2 shows the same characteristics for government workers as Table 3, in the main report, shows for private industry workers. Government workers in all three groups are slightly older, on average, than are the private industry workers. A smaller percentage of the workers in each of the three groups is male, but men are still more likely than women to be participating in a retirement plan. All three groups have a higher percentage of married workers than does the private industry group, and a much higher percentage of the workers participating in a retirement plan are married. All three groups also have longer tenure at their job than do the similar groups in private industry. However, like private industry, the workers not participating in a plan have worked only about half as long as those that are participating in a plan.
Table C.2: Characteristics of Government Workers in Retirement Plans and Not in Retirement Plans in 2006
Worker Participates if Plan Available
Workers with No Plan Available
Yes No Average Age 44.7 years 40.8 years 41.6 years Percent Male 44.8 40.6 39.6 Percent Married 67.0 52.0 57.7 Percent w Less than High School Diploma
1.0 3.9 5.1
Percent with Advanced College or Professional Degree
24.4 14.2 13.4
Percent White 79.6 74.4 77.5 Percent Black 14.0 19.3 15.2 Percent Work > 34 Hrs. per Week 88.3 51.5 61.2 Average Hours for Full-time workers
42.3 hours 42.2 hours 41.9 hours
Average No. of Years at Job 11.4 years 6.6 years 7.3 years
54
Bibliography
AARP. Designing 401(k) Plans That Encourage Retirement Savings: Lessons from Behavioral Finance, March 2006.
Aaronson, S. and Coronado, J. Are Firms or Workers Behind the Shift Away from DB Pension Plans? Finance and Economics Discussion Series, Federal Reserve Board, 2005.
Beshears, J. , J.Choi, D. Laibson, B Madrian. The Impact of Employer Matching on Savings Plan Participation under Automatic Enrollment, NBER working paper 13352, 2005.
Bryant, V. “Accumulation and Distribution of Individual Retirement Arrangements, 2004,” Statistics of Income, Internal Revenue Service, Spring 2008, pp. 90-101.
Bucks, B. et al. “Changes in U.S. Family Finances from 2004 to 2007: Evidence from Survey of Consumer Finances,” Federal Reserve Bulletin, February 2009, pp. A1-A56.
Centers for Disease Control. Deaths: Final Data for 2006, National Vital Statistics Report, Volume 57, No. 14, April 2009.
Choi, J., D. Laibson and B. Madrian. “Plan Design and 401(k) Savings Outcomes,” National Tax Journal 52(2), June 2004, pp. 275-298.
Copeland, C. How are New Retirees Doing Financially in Retirement? Issue Brief no. 302, Employee Benefit Research Institute, February 2007.
Costo, S. “Trends in Retirement Plan Coverage Over the Last Decade,” Monthly Labor Review, February 2006.
Duflo, E. and E. Saez. “Participation and investment decisions in a retirement plan: the influence of colleagues’ choices,” Journal of Public Economics, 85 (2002) pp. 121-148.
Dworak-Fisher, K. “Employer Generosity in Employer-matched 401(k) plans, 2002-03”, Monthly Labor Review, Bureau of Labor Statistics, July/August 2007.
55

Elliott, K. and Moore, J. “Cash Balance Pension Plans: The New Wave,” Compensation and Working Conditions, Bureau of Labor Statistics, Summer 2000.
Employee Benefit Research Institute. Retirement Plan Participation: Survey of Income and Program Participation (SIPP) Data, 2006, Notes, Vol.30. No. 2, February 2009.
Englelhardt, G. and Kumar, A. Employer Matching and 401(k) Participation: Evidence from Health and Retirement Study, Research Department Working Paper 0601, Federal Reserve Bank of Dallas, 2006.
Federal Reserve Board. Flow of Funds. Z.1, September 17, 2009.
Gale, W., M. Iwry and P. Orszag. The Automatic 401(K): A Simple Way to Strengthen Retirement Savings, The Retirement Security Project, No. 2005-1.
Gale, W. et al. Increasing Annuitization in 401(k) Plans with Automatic Trial Income, The Retirement Security Project, 2008.
Helman, R., et al. The Retirement System in Transition: The 2007 Retirement Confidence Survey, Issue Brief no. 304, Employee Benefit Research Institute, April 2007.
_____________. The 2009 Retirement Confidence Survey: Economy Drives Confidence to Record Lows: Many Looking to Work Longer, EBRI, Issue Brief no. 338, April 2009.
John, D. and J.M. Iwry. Pursuing Universal Retirement Security Through Automatic IRAs, Congressional Testimony before the House Ways and Means Committee’s Subcommittee on Select Revenue Measures, June 26, 2008.
Lusardi, A. and O. Mitchell. Financial Literacy and Retirement Preparedness: Evidence and Implications for Financial Education, WP 2006-144, Michigan Retirement Research Center, 2006.
__________. Financial Literacy, Retirement Planning, and Retirement Wellbeing: Lessons and Research Gaps, Conference on Financial Literacy, March 20, 2009.
Luttmer, E. Individuals’ Understanding of Social Security Benefits, Conference on Financial Literacy, March 13, 2009.
56

Madrian, B. and D.Shea. The Power of Suggestion: Inertia in 401(K) Participation and Savings Behavior, NBER working paper 7682, May 2000
Mincer, J. “Some Firms Suspend Their 401(k) Match,” Wall Street Journal, November 12, 2008.
Munnell, A., J. Aubry and D. Muldoon. The Financial Crisis and Private Defined Benefit Plans, Center for Retirement Research at Boston College, November 2008.
Munnell, A. and P. Perun. An Update on Private Pensions, Issue Brief No. 50, Center for Retirement Research at Boston College, August 2006.
Munnell, A. and M. Soto. Why are Companies Freezing Their Pensions?, CRR WP 2007-22, Center for Retirement Research at Boston College, December 2007.
Munnell, A., A. Sunden and C. Taylor. What Determines 401(k) Participation and Contributions? CRR WP 2000-12, December 2000.
Nash, B.J. “Opt In or Opt Out?” Region Focus, Federal Reserve Bank of Richmond, Winter 2007.
Nesmith, W., S. Utkus and J. Young. “Measuring the effectiveness of Automatic Enrollment,” Vanguard Center for Retirement Research, vol. 31 (2007).
Perun, P. and C.E. Steuerle. Why Not a “Super Simple” Saving Plan for the United States? Urban Institute, 2008.
Joel Popkin and Company. Cost of Employee Benefits in Large and Small Business. U.S. Small Business Administration, Office of Advocacy, 2005. http://www.sba.gov/advo/research/rs262tot.pdf.
Powell, R. “Don’t freeze pension plan,” Market Watch, July 28, 2009.
Purcell, P. and J. Topoleski. 401(k) Plans and Retirement Savings: Issues for Congress, Congressional Research Service, 7-5700, July 14, 2009.
The Retirement Security Project. Automatic IRAs: Extending Retirement Saving Opportunities to 75 Million More American Workers Project fact sheet, February 2007.
57

Starr-McClure, M. and Sunden, A. Workers’ Knowledge of their Pension Coverage: A Reevaluation, Federal Reserve Board of Governors, January 1999.
Thaler, R. and S. Benartzi. “Save More Tomorrow: Using Behavioral Economics to Increase Employee Savings,” Journal of Political Economy, Vol. 112 (2004)
U.S. Department of Commerce. New Census Bureau Data Reveal More Older Workers, Homeowners, Non-English Speakers, September 12, 2007.
U.S. Department of Labor. Employee Benefits in the United States, March 2008, August 7, 2008.
__________. Employee Benefits in the United States, March 2009, July 28, 2009.
__________. Automatic Enrollment 401(k) Plans for Small Business, IRS Publication No. 4674.
__________. Private Pension Plan Bulletin 2006, December 2008.
__________. Report of the Working Group on Financial Literacy of Plan Participants and the Role of the Employer, 2008.
U.S. Department of the Treasury, Internal Revenue Service. Retirement Plans for Small Business (SEP, SIMPLE, and Qualified Plans) 2008, Publication No. 560, January 15, 2009.
__________. Statistics of Income Bulletin.
__________. Individual Retirement Arrangements (IRAs), Publication No. 590.
U.S. Government Accountability Office. Defined Benefit Pensions: Survey Results of the Nation’s Largest Private Defined Benefit Plan Sponsors, GAO-09-291, March 2009.
__________. Private Pensions: Revision of Defined Benefit Pension Plan Funding Rules Is an Essential Component of Comprehensive Pension Reform, June 7, 2005.
__________. Private Pensions Alternative Approaches Could Address Retirement Risks Faced by Workers but Pose Trade-offs, GAO-09-642, July 2009.
58
59
__________. Pension Benefit Guaranty Corporation Financial Challenges Highlight Need for Improved Governance and Management, GAO-09-702T, May 20, 2009.
__________. Private Pensions Changes Can Produce a Modest Increase in Use of Simplified Employee Pensions, GAO/HRD-92-119, July 1992.
__________. Private Pensions Improving Worker Coverage and Benefits, GAO-02-225, April 2002.
__________. Private Pensions Plan Provisions Differ Between Large and Small Employers, GAO/HRD-89-105BR, September 1989.
__________. Private Pensions Most Employers That Offer Pensions Use Defined Contribution Plans, GAO/GGD-97-1, October 1996.
Van Derhei, J., Holden, Alonso and Copeland. 401(k) Plan Asset Allocation, Account Balances, and Loan Activity in 2007, Employee Benefit Research Institute, December 2008.
Watson Wyatt. Retirement Prospects Dim for Many Near-Retirees, 2009.
Workforce Management. Survey Finds Very Few Workers Understand Their Retirement Plan, September 11, 2009.