slope, rate of change, and steepness: do students ... · et al. 1996); geometry (usiskin et al....
TRANSCRIPT
Vol. 103, No. 7 • March 2010 | MatheMatics teacher 519
connecting researchto teachingDawn teuscher and robert e. reys
this department consists of articles that bring research insights and findings to an audience of teachers and other mathematics educators. articles must make explicit connections between research and teaching practice. Our conception of research is a broad one; it includes research on student learning, on teacher think-ing, on language in the mathematics classroom, on policy and practice in math-ematics education, on technology in the classroom, on international comparative work, and more. the articles in this department focus on important ideas and include vivid writing that makes research findings come to life for teachers. Our goal is to publish articles that are appropriate for reflective discussions at depart-ment meetings or any other gatherings of high school mathematics teachers. For further information, contact the department editors.
Edited by Thomas A. Evitts, [email protected] Shippensburg University, Shippensburg, PA 17257
Karen Heinz, [email protected] University, Glassboro, NJ 08028
Slope, Rate of Change, and Steepness: Do Students Understand These Concepts?
how do we mathematics teachers introduce the concepts of slope, rate of change, and steepness in our classrooms? Do students
understand these concepts as interchangeable or regard them as three different ideas? Here we report the results of a study of high school Advanced Placement (AP) Calculus students who displayed misunderstandings about the meaning of these three concepts. We then share an example of a typical rate-of-change problem commonly found in mathematics textbooks that may contribute to the development of these misconceptions. Finally, we provide a classroom task that supports the dis-cussion of the differences among these three con-cepts, and we ask readers to reflect on ways to help students differentiate among them.
The National Mathematics Advisory Panel (2008) has noted, “Algebra has emerged as a cen-tral concern, for it is a demonstrable gateway to later achievement” (p. 3). Rate of change is one of many algebra topics that are essential for students to understand as they progress into higher-level
mathematics. Linear rate of change is a founda-tional concept introduced in middle school and encountered throughout high school mathematics. It is typically examined each year as students’ study of linear functions continues to evolve.
Researchers have found that students at vari-ous levels have difficulty conceptualizing the idea of rate of change (Carlson et al. 2002; Herbert and Pierce 2008; Orton 1984; Thompson 1994; Ubuz 2007; and Wilhelm and Confrey 2003). These researchers have all noted that students are typi-cally introduced to rate of change through the slope formula. Further, students tend to practice input-ting numbers and calculating the slope of a line with little or no focus on interpreting the meaning of the result within a given context and with little consideration for units of measure. Generally, stu-dents are introduced first to slope and later to rate of change; perhaps students are not making the connection between these two concepts.
We focus on students’ work on an open-ended task used to gather data about their understanding of rate of change. The students in our study followed two different curricular paths to calculus yet had similar misunderstandings about rate of change.
stUDents’ PrecaLcULUs cUrricULUMIn 1992 the National Science Foundation (NSF) initi-ated a wave of major mathematics education reform by funding five secondary school mathematics cur-riculum projects. Although each curriculum series is different, they all include one common feature—the integration of mathematics topics to promote students’ connections across and within these top-ics. In contrast with the traditional subject-specific sequence—first-year algebra, geometry, second-year algebra, and precalculus—integrated mathematics curricula allow students to study algebra, geometry, and data analysis in each year of secondary school.
Copyright © 2010 The National Council of Teachers of Mathematics, Inc. www.nctm.org. All rights reserved.This material may not be copied or distributed electronically or in any other format without written permission from NCTM.
520 MatheMatics teacher | Vol. 103, No. 7 • March 2010
In our study, conducted in two secondary schools within the same district, we focused on 191 students who had completed four years of college preparatory mathematics and had enrolled in AP Calculus. Of the 191 students, 134 had followed single-subject curricula (hereafter referred to as APSSC) and had used three textbooks from the University of Chicago School Mathematics Project—Algebra (McConnell et al. 1996); Geometry (Usiskin et al. 1997); and Advanced Algebra (Senk et al. 1996)—and a fourth book, Precalculus Enhanced with Graphing Utilities (Sullivan and Sullivan III 2006), for their precal-culus course. The other 57 students had followed integrated mathematics curricula (hereafter referred to as APIC) and had used the four books of Contem-porary Mathematics in Context: A Unified Approach (Coxford et al. 2003), the Core Plus Mathematics Project textbook series.
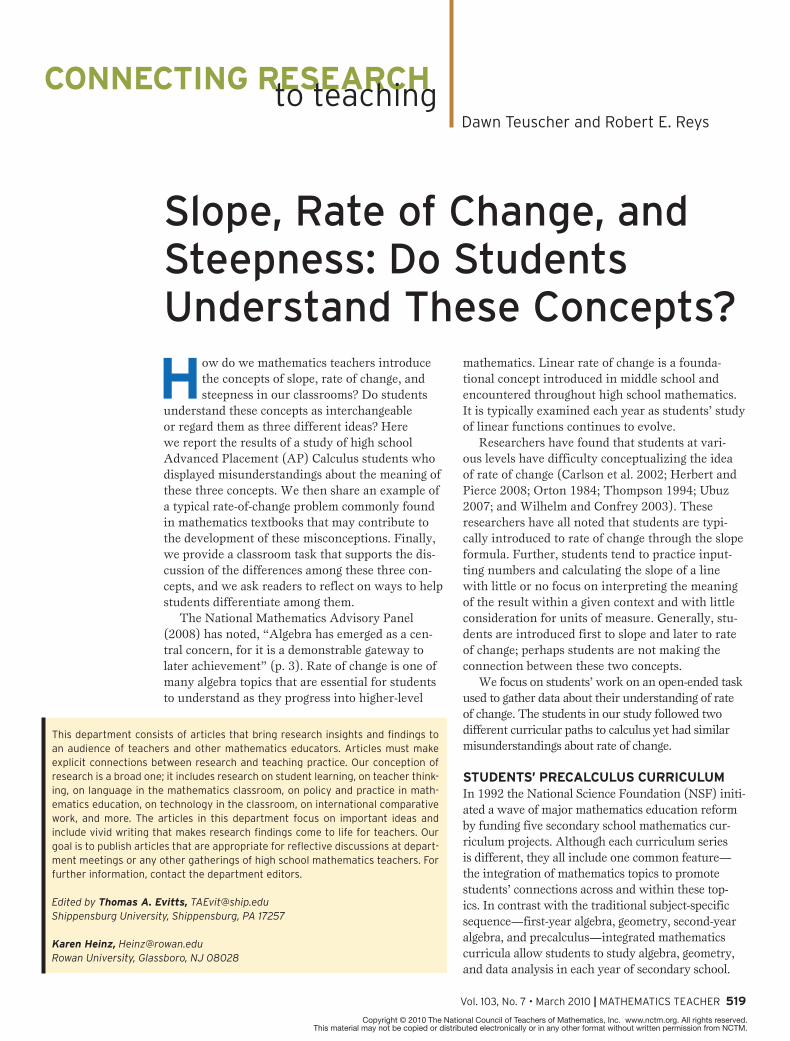
A precalculus teacher adapted the Piecewise Function task (see fig. 1) from a released 2003 AP Calculus free-response item. The three AP Calcu-lus teachers at the two schools believed that their students should know and understand the math-ematical concepts needed to solve this task before beginning AP Calculus. To assess students’ under-standing, the teachers had their students complete the task during class time at the beginning of the AP Calculus course, before any instruction.
How well would your students be able to answer the questions in the Piecewise Function task? What misunderstandings might you expect them to display when solving this task? What implications would their answers have on your teaching?
STUDENTS’ ERRORSWe scored students’ work using a rubric developed by collaborating mathematicians and mathematics educators. Partial credit was awarded on the basis
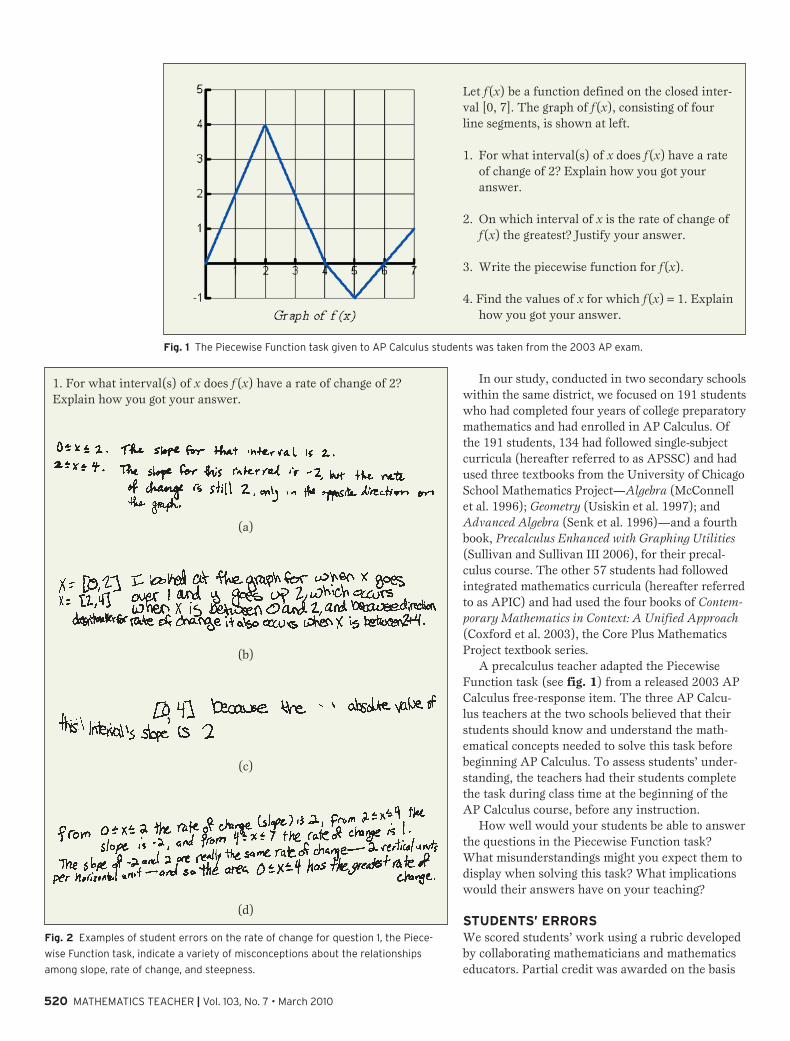
Fig. 2 examples of student errors on the rate of change for question 1, the Piece-
wise Function task, indicate a variety of misconceptions about the relationships
among slope, rate of change, and steepness.
1. For what interval(s) of x does f (x) have a rate of change of 2? Explain how you got your answer.
(a)
(b)
(c)
(d)
Let f(x) be a function defined on the closed inter-val [0, 7]. The graph of f(x), consisting of four line segments, is shown at left.
1. For what interval(s) of x does f(x) have a rate of change of 2? Explain how you got your answer.
2. On which interval of x is the rate of change of f(x) the greatest? Justify your answer.
3. Write the piecewise function for f(x).
4. Find the values of x for which f(x) = 1. Explain how you got your answer.
Fig. 1 the Piecewise Function task given to aP calculus students was taken from the 2003 aP exam.

Vol. 103, No. 7 • March 2010 | MatheMatics teacher 521
of a student’s explanation and answer for each question. Then we conducted a qualitative analysis of students’ responses to identify students’ errors within and across the two curricular paths.
Question 1 of the Piecewise Function task asked students to determine on what interval or intervals of x the function had a rate of change of 2 and to explain how they determined the interval or inter-vals. This question was answered correctly by 72 percent of the APSSC students and 42 percent of the APIC students. In contrast, 24 percent of the APSSC students and 47 percent of the APIC students incor-rectly listed other intervals as having a rate of change of 2: the intervals [0, 2] and [2, 4] and the interval [0, 4]. Two explanations students gave for choosing the intervals [0, 2] and [2, 4] were these: The slopes (2 and –2) were different for these two segments but the rates of change were the same (see fig. 2a); and the rates of change were the same for the two lines even though the directions of the segments were opposite (see fig. 2b). Although these students responded with the incorrect intervals, they did indi-cate that the two segments had different slopes.
On question 1, 9 percent of the APSSC students and 21 percent of the APIC students identified the interval [0, 4] as having a rate of change of 2. Although these students had explanations similar
to those of the students who chose the intervals [0, 2] and [2, 4], they added that the rate of change was the absolute value of the slope (see fig. 2c). It is also important to note that these 24 students did not recognize that something unique was happen-ing at the point x = 2—that is, the slope is unde-fined there. Instead, students collapsed the two intervals into one interval: [0, 4].
Question 2 of the Piecewise Function task asked students to determine on what interval of x the function had the greatest rate of change and then to justify their answer. For this question, 50 percent of the APSSC students and 28 percent of the APIC students answered correctly. After administering the task, we realized that the word greatest could have multiple meanings, depending on students’ conception of rate of change. For example, greatest could be interpreted as the largest magnitude, as in the sciences. However, because this task had no context, we scored the meaning of greatest as the largest number (e.g., 2 being greater than –2).
Table 1 lists the errors that students from both curricular paths made when answering question 2. Students’ errors and arguments were similar to those they gave in response to question 1; some students focused solely on the magnitude (absolute value) of the change. However, 6 percent of all
Looking for High School Resources?Check out www.nctm.org/high
Online articles
Topic resources
Teaching tips
Grants
Problems archive
Lessons and activities
We’ve got you covered—check us out!
membres609_421c high school resources journals

522 MATHEMATICS TEACHER | Vol. 103, No. 7 • March 2010
students (6 APSSC students and 5 APIC students) who incorrectly responded to question 1 with either the intervals [0, 2] and [2, 4] or the inter-val [0, 4] gave a correct answer to question 2. We hypothesized that the word greatest in question 2 may have led students to compare the values—not just the magnitudes—of 2 and –2.
For question 2, 24 percent of the APSSC students and 16 percent of the APIC students identified the
interval [0, 4] as the interval that had the greatestrate of change. The percentage of APSSC students who chose the interval [0, 4] on question 2 was more than twice the percentage of those who chose that interval on question 1. More than 80 percent of all students (both APSSC and APIC) who identified the incorrect interval [0, 4] on question 2 reasoned that the slopes of the graph were different but that the rates of change were equal (see fig. 2d).
To summarize, regardless of their curricular path, both APSSC and APIC students displayed confusion about the meanings of slope, rate of change, and steepness in relation to the given graph. Students from both groups who answered incor-rectly disregarded the sign of the slope as impor-tant when answering questions about the rate of change. A smaller portion of students from both groups gave no indication that the slopes for the two line segments [0, 2] and [2, 4] were different.
VOCABULARY IN TEXTBOOKS AND CLASSROOMS In this section, we discuss issues that curriculum developers and teachers should consider. Specifi-cally, we focus on the vocabulary used in textbooks and in the classroom, and we call attention to situ-ations outside the mathematics classroom that may contribute to how students conceptualize and use the terms slope, rate of change, and steepness.
The vocabulary used in textbooks and by teachers for rate of change is important and may, in fact, have contributed to students’ errors and misunderstand-ings. In our study, 37 percent of students did not identify the correct interval of x when asked to find where f(x) had a rate of change of 2 on the linear piecewise-function graph. The explanations students gave suggest that they have an incomplete under-standing of the concepts of slope, rate of change, and steepness and of the relationships among them.
A cursory search for these three terms in the two textbook series used by the students in this study revealed instances in both curricula where the terms slope, rate of change, and steepness were used interchangeably. However, our analysis of students’ responses to the Piecewise Function task suggests that students do not understand the terms as interchangeable; rather, they understand them as three different concepts that are not connected. We must help students understand the important differences in these terms and make correct con-nections among them.
The steepness of a line, for example, refers to a visual perception of the graph. To quantify steep-ness, students tended to calculate the slope of the two line segments and compare the values, disregarding the sign. In contrast, the slope and rate of change are values that quantify the relationship between
Table 1 Errors on Question 2
Errors % APSSC Students
(N = 134)
% APIC Students (N = 57)
Students included the interval [2, 4] 15 30
Students chose the interval [0, 4] 24 16
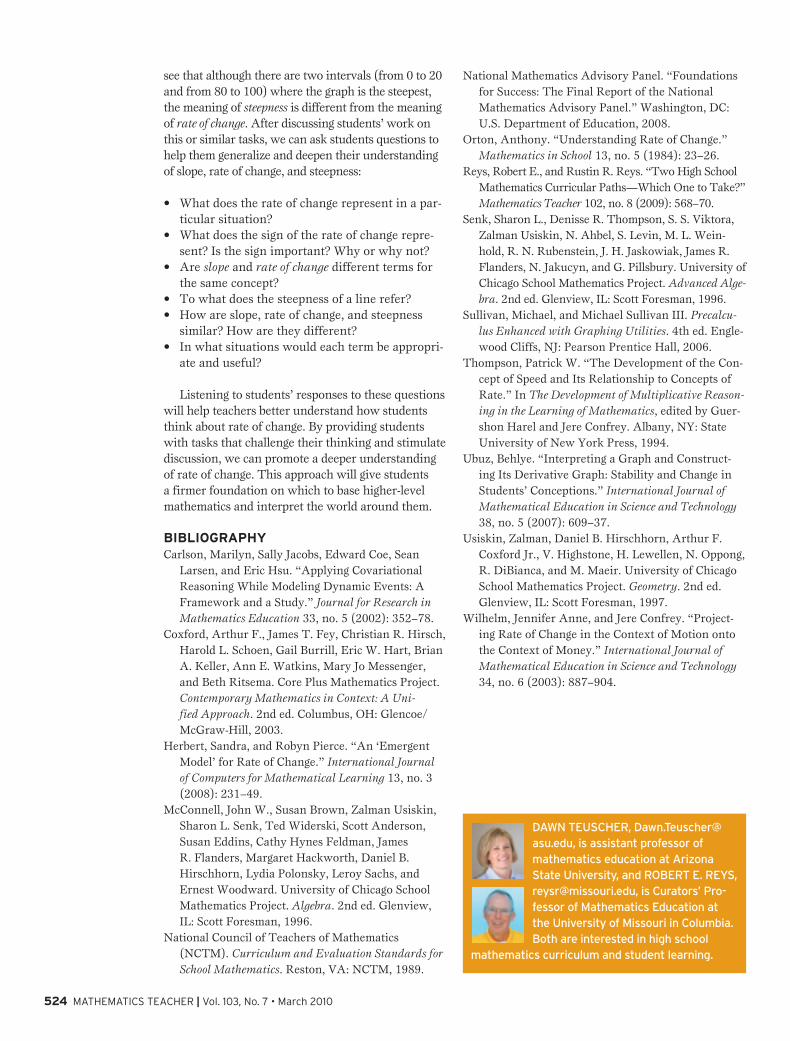
Fig. 3 The Price of Stock task presents another opportunity to ascertain students’
understanding of the relationships.
Price of Stock
Let f(x) be the function defined as the price of stock in dollars at a given time in minutes since 9:30 a.m. The graph of f(x), consisting of nine line segments, is shown above.
1. Find the rate of change over the following intervals for x and inter-pret the meaning of the rate of change in the context of the problem.
(a) [0, 20]
(b) [40, 60]
(c) [80, 100]
(d) [120, 140]
2. On which interval(s) of x is f(x) the steepest? What is the meaning of the steepness of the graph in the context of the problem?
3. Are the steepness and rate of change of f(x) the same on any intervals of x? What is the difference between rate of change and steepness?

Vol. 103, No. 7 • March 2010 | MatheMatics teacher 523
tual situation in which a person’s distance from home is expressed as a function of time. We may be interested in (a) the person’s speed (absolute value of the rate of change), (b) the person’s veloc-ity (rate of change), (c) the amount of time it takes him or her to travel a given distance, or (d) how far he or she traveled in a given time period. Thinking about the graph in the Piecewise Function task as a distance-versus-time graph, we can understand why some students might respond that the slopes are different but that the rates of change are the same. In this situation, the sign of the slope gives information about the direction the person is going (away from or toward home), but we typically pro-vide a positive number when reporting the speed (rate of change) that a person travels.
a tasK to ProMote DeePer UnDerstanDingWe conclude with a sample task for teachers and curriculum developers to consider using in their class-rooms and in textbooks to help students understand the difference between rate of change and steepness. The Price of Stock task (see fig. 3) helps students understand the importance of the sign in the rate of change and provides a meaningful context for inter-preting the rate of change. The task also helps students
the independent and the dependent variables. The sign of either the slope or the rate of change provides information about this relationship. For example, if the sign of the rate of change is negative, then as the independent variable increases, the dependent vari-able decreases. We recommend that teachers and cur-riculum developers use the terms slope, rate of change, and steepness correctly so that we can help students understand the subtle distinctions among them.
Often, students are asked to consider the steep-ness of a house roof and relate it to the number that is generated by using the slope formula. Students discover that the steeper the roof, the larger the number; similarly, the flatter the roof, the smaller the number. However, these numbers are generally positive. Although there is nothing wrong with using the contextual situation of a roof’s steepness to intro-duce slope, we must help our students understand that the slope of a line is calculated according to a particular orientation and that the sign of the slope indicates whether the line goes up or down (moving from left to right). One way to extend this example and help students focus on the sign in addition to the steepness is to ask them to find the slope of the other side of the roof and compare it with the original.
Examining how rate of change is used in other disciplines is also important. Consider the contex-
Visit www.nctm.org/meetings for up-to-date information.
Get blown away…by the valuable teaching knowledge and tools you’ll gain when you attend NCTM’s 88th Annual Meeting. The meeting will address the challenges that teachers face every day. Return to the classroom energized and excited to share what you’ve learned!
2010 NCTM Regional Conferences and ExpositionsDenveDenver, CO October 7–8
Baltimore, MD October 14–15
New Orleans, LA October 28–29
NCTM 2010ANNUAL MEETING& EXPOSITION
SAN DIEGO, CA • APRIL 21–24, 2010
Connections:Linking Concepts
and Context
sandiego809_432 NCTM journals Oct. 2009
524 MatheMatics teacher | Vol. 103, No. 7 • March 2010
National Mathematics Advisory Panel. “Foundations for Success: The Final Report of the National Mathematics Advisory Panel.” Washington, DC: U.S. Department of Education, 2008.
Orton, Anthony. “Understanding Rate of Change.” Mathematics in School 13, no. 5 (1984): 23–26.
Reys, Robert E., and Rustin R. Reys. “Two High School Mathematics Curricular Paths—Which One to Take?” Mathematics Teacher 102, no. 8 (2009): 568–70.
Senk, Sharon L., Denisse R. Thompson, S. S. Viktora, Zalman Usiskin, N. Ahbel, S. Levin, M. L. Wein-hold, R. N. Rubenstein, J. H. Jaskowiak, James R. Flanders, N. Jakucyn, and G. Pillsbury. University of Chicago School Mathematics Project. Advanced Alge-bra. 2nd ed. Glenview, IL: Scott Foresman, 1996.
Sullivan, Michael, and Michael Sullivan III. Precalcu-lus Enhanced with Graphing Utilities. 4th ed. Engle-wood Cliffs, NJ: Pearson Prentice Hall, 2006.
Thompson, Patrick W. “The Development of the Con-cept of Speed and Its Relationship to Concepts of Rate.” In The Development of Multiplicative Reason-ing in the Learning of Mathematics, edited by Guer-shon Harel and Jere Confrey. Albany, NY: State University of New York Press, 1994.
Ubuz, Behlye. “Interpreting a Graph and Construct-ing Its Derivative Graph: Stability and Change in Students’ Conceptions.” International Journal of Mathematical Education in Science and Technology 38, no. 5 (2007): 609–37.
Usiskin, Zalman, Daniel B. Hirschhorn, Arthur F. Coxford Jr., V. Highstone, H. Lewellen, N. Oppong, R. DiBianca, and M. Maeir. University of Chicago School Mathematics Project. Geometry. 2nd ed. Glenview, IL: Scott Foresman, 1997.
Wilhelm, Jennifer Anne, and Jere Confrey. “Project-ing Rate of Change in the Context of Motion onto the Context of Money.” International Journal of Mathematical Education in Science and Technology 34, no. 6 (2003): 887–904.
see that although there are two intervals (from 0 to 20 and from 80 to 100) where the graph is the steepest, the meaning of steepness is different from the meaning of rate of change. After discussing students’ work on this or similar tasks, we can ask students questions to help them generalize and deepen their understanding of slope, rate of change, and steepness:
• Whatdoestherateofchangerepresentinapar-ticular situation?
• Whatdoesthesignoftherateofchangerepre-sent? Is the sign important? Why or why not?
• Areslope and rate of change different terms for the same concept?
• Towhatdoesthesteepnessofalinerefer?• Howareslope,rateofchange,andsteepness
similar? How are they different?• Inwhatsituationswouldeachtermbeappropri-
ate and useful?
Listening to students’ responses to these questions will help teachers better understand how students think about rate of change. By providing students with tasks that challenge their thinking and stimulate discussion, we can promote a deeper understanding of rate of change. This approach will give students a firmer foundation on which to base higher-level mathematics and interpret the world around them.
BiBLiograPhYCarlson, Marilyn, Sally Jacobs, Edward Coe, Sean
Larsen, and Eric Hsu. “Applying Covariational Reasoning While Modeling Dynamic Events: A Framework and a Study.” Journal for Research in Mathematics Education 33, no. 5 (2002): 352–78.
Coxford, Arthur F., James T. Fey, Christian R. Hirsch, Harold L. Schoen, Gail Burrill, Eric W. Hart, Brian A. Keller, Ann E. Watkins, Mary Jo Messenger, and Beth Ritsema. Core Plus Mathematics Project. Contemporary Mathematics in Context: A Uni-fied Approach. 2nd ed. Columbus, OH: Glencoe/McGraw-Hill, 2003.
Herbert, Sandra, and Robyn Pierce. “An ‘Emergent Model’ for Rate of Change.” International Journal of Computers for Mathematical Learning 13, no. 3 (2008): 231–49.
McConnell, John W., Susan Brown, Zalman Usiskin, Sharon L. Senk, Ted Widerski, Scott Anderson, Susan Eddins, Cathy Hynes Feldman, James R. Flanders, Margaret Hackworth, Daniel B. Hirschhorn, Lydia Polonsky, Leroy Sachs, and Ernest Woodward. University of Chicago School Mathematics Project. Algebra. 2nd ed. Glenview, IL: Scott Foresman, 1996.
National Council of Teachers of Mathematics (NCTM). Curriculum and Evaluation Standards for School Mathematics. Reston, VA: NCTM, 1989.
DAWN TEUSCHER, [email protected], is assistant professor of mathematics education at Arizona State University, and ROBERT E. REYS, [email protected], is Curators’ Pro-fessor of Mathematics Education at the University of Missouri in Columbia. Both are interested in high school
mathematics curriculum and student learning.