slide 1 robert kellogg nrcs, beltsville results and lessons learned on regional/national modeling...
TRANSCRIPT

Slide 1
Robert Kellogg
NRCS, Beltsville
Results and Lessons Learned on Regional/National Modeling Efforts: Conservation Effects Assessment
Project (CEAP)

Why do we do large-scale regional modeling and
assessment?
Slide 2
Why do we do large-scale regional modeling and
assessment?
Slide 3
To provide information in support of policy development or management of government programs.

Why do we do large-scale regional modeling and
assessment?
Slide 4
To provide information in support of policy development or management of government programs.•How big is the problem?•What has already been accomplished?•What is left to do, and where?• What can be expected if specific actions
are taken?• What is the most cost-effective approach?

Slide 5
1. Describe study and findings
2. Challenges in developing and presenting results
3. Lessons learned

Slide 6
Goals of the CEAP Cropland National/Regional Assessment
1.Define and evaluate practices in use
2.Estimate the effects/benefits of conservation practices in use
3.Estimate the need for additional conservation practices
4. Simulate effects/benefits of additional treatment

Slide 7
Cropland Regional Assessments

Slide 8
Sampling and Modeling ApproachFarm survey
data at
NRI-CEAP sample points
Field-level modeling
APEX
Watershed modeling
HUMUS/SWAT
Onsite (field-level)
Effects
Off-Site Water
Quality Effects

Slide 9
Primary Sample Unit
(PSU)
Points
Statistical Design
Slide 10
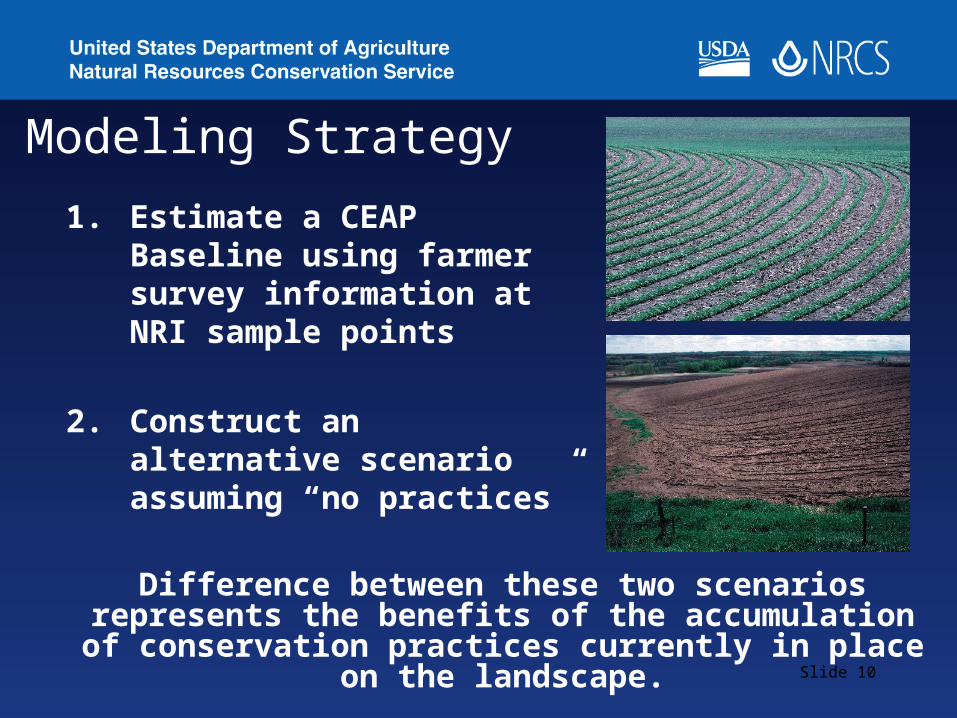
Modeling Strategy
1. Estimate a CEAP Baseline using farmer survey information at NRI sample points
2. Construct an alternative scenario assuming “no practices”
Difference between these two scenarios represents the benefits of the accumulation of
conservation practices currently in place on the landscape.

Slide 11
47-year minimum-maximum precipitation
60 62 64 66 68 70 72 74 76 78 80 82 84 86 88 90 92 94 96 98 0 2 4 615
20
25
30
35
40
45
50
55
60
65
An
nu
al p
rec
ipit
ati
on
(in
ch
es
/ye
ar)

Evaluation of Conservation Practices
Slide 12

The Baseline Conservation Condition
Slide 13
Soil erosion control Upper Miss.
Ches. Bay
Great Lakes
Structural practices for water erosion control
-- All acres-- HEL acres
45%72%
46%63%
26%37%
Tillage-- No till-- Mulch till
28%63%
48%40%
32%50%

The Baseline Conservation Condition
Slide 14
Nitrogen application for all crops in rotation
Upper Miss.
Ches. Bay
Great Lakes
Appropriate rate 39% 32% 40%
Appropriate timing 45% 54% 69%
Appropriate method 56% 35% 50%
Appropriate rate and timing and method
16% 12% 18%
No nitrogen applied 2% 3% 4.5%

The Baseline Conservation Condition
Slide 15
Nutrient application for all crops in rotation
Upper Miss.
Ches. Bay
Great Lakes
Appropriate rate and timing and method for both nitrogen and phosphorus, including acres with no applications
13% 9% 12%
Cover crops <1% 4% 1%

Losses of Sediment and Nutrients from
Fields
Slide 16

Sediment Loss (tons/acre), Baseline
Slide 17
Chesapeake Bay Upper Mississippi Great Lakes0
0.2
0.4
0.6
0.8
1
1.2
1.4
Av
era
ge
an
nu
al s
ed
ime
nt
los
s (
ton
s/a
cre
)

Nitrogen Loss (pounds/acre), Baseline
Slide 18Lost with surface runoff Lost in subsurface flows
0
5
10
15
20
25
30
35
Chesapeake Bay Upper Mississippi Great Lakes
Av
era
ge
an
nu
al n
itro
gn
e lo
ss
(p
ou
nd
s/a
cre
)

Nitrogen Loss in Subsurface Flows, Baseline
Slide 19
0 5 10 15 20 25 30 35 40 45 50 55 60 65 70 75 80 85 90 95 1000
10
20
30
40
50
60
70
80
90
100
110
120
130
140
150
160
170
180
Upper Mississippi Chesapeake Bay Great Lakes
Cumulative percent acres
Av
era
ge
an
nu
al l
os
s o
f n
itro
ge
n in
su
bs
urf
ac
e f
low
s
(po
un
ds
/ac
re)
Means: CB = 32.7 pounds/A UM = 18.7 pounds/A GL = 25.8 pounds/A

Inherent Vulnerability
Slide 20
UM CB GL
Avg. annual precipitation (inches) 34 42 34
Percent of cropped acres with slopes>2%
42% 60% 34%
Percent of cropped acres that are HEL
18% 44% 17%
Percent of cropped acres highly prone to surface water runoff
13% 23% 6%
Percent of cropped acres prone to leaching
9% 46% 30%

Conservation Treatment Needs
• Under-treated acres were identified as those with an imbalance between the level of potential loss—inherent vulnerability—and the level of conservation treatment.
• Acres were assigned to three levels of need for additional treatment—High Moderate, and Low Slide 21

Slide 22
Average annual loss of nitrogen in subsurface flows, GL--pounds/acre/yr
Soil leachingpotential
Low treatment
Moderate treatment
Moderately high treatment
High treatment
Low 25 22 9 7
Moderate 43 30 12 10
Moderately high 61 47 15 11
High 54 57 33 16

Acres Needing Conservation Treatment
Slide 23
Upper Mississippi Chesapeake Bay Great Lakes0%
10%
20%
30%
40%
50%
60%
70%
80%
90%
100%
High need for additional treatmentModerate need for additional treatment
Pe
rce
nt
of
cro
pp
ed
ac
res

Slide 24
Average annual loss of nitrogen in subsurface flows, GL--pounds/acre/yr
Low Moderate High0
10
20
30
40
50
60
Level of conservation treatment need for nitrogen in subsurface flows
Av
era
ge
an
nu
al l
os
s o
f n
itro
ge
n in
su
bs
urf
ac
e f
low
s
(po
un
ds
/ac
re)

Slide 25
Average annual loss of nitrogen in subsurface flows, GL--pounds/acre/yr
Low Moderate High0
10
20
30
40
50
60
Level of conservation treatment need for nitrogen in subsurface flows
Av
era
ge
an
nu
al l
os
s o
f n
itro
ge
n in
su
bs
urf
ac
e f
low
s
(po
un
ds
/ac
re)

High conservation treatment need for nitrogen and/or phosphorus loss

Challenges in developing and presenting results
Slide 27

Challenges in developing and presenting results
Slide 28
1. Evolution of models

Challenges in developing and presenting results
Slide 29
1. Evolution of models2. Establishing believability

Challenges in developing and presenting results
Slide 30
1. Evolution of models2. Establishing believability3. Simplicity versus complexity

Challenges in developing and presenting results
Slide 31
1. Evolution of models2. Establishing believability3. Simplicity versus complexity4. Forecasting…and meeting…report
publication deadlines

Challenges in developing and presenting results
Slide 32
1. Evolution of models2. Establishing believability3. Simplicity versus complexity4. Forecasting…and meeting…report
publication deadlines5. Presentations

Challenges in developing and presenting results
Slide 33
1. Evolution of models2. Establishing believability3. Simplicity versus complexity4. Forecasting…and meeting…report
publication deadlines5. Presentations6. Peer review

Lessons Learned…
Slide 34
1. Define clearly at the start the kinds of statements you will be including in your report, as well as what you will NOT address…
• Write up preliminary results and present
to users of the information early and often.
• Don’t wait for the modeling to be completed before drafting.
• Try to manage expectations of your audience.

Lessons Learned…
Slide 35
2. Involve a team of subject-area experts from different disciplines...
But discuss the project as a group frequently to keep all on the same page.

Lessons Learned…
Slide 36
3. Modeling decisions are NOT independent from the presentation of results…
Discuss assumptions and methods as a team to confirm that the “messages” in the
report are consistent with modeling assumptions,
and vice versa

Lessons Learned…
Slide 37
4. If “off-the-shelf” databases are fundamentally inappropriate for answering the questions, don’t try to “make do”…
Collect the data you need.

Lessons Learned…
Slide 38
5. Models and databases will always be modified and refined…
You will have to do everything over more
than once—plan on it.

Lessons Learned…
Slide 39
6. If your results appear to be new scientific findings, you are probably doing something wrong…
Regional modeling is primarily a synthesis of scientific knowledge and understanding.

Lessons Learned…
Slide 40
7. Document…document…document
• Establishes believability.• Avoids mis-use of the findings.• Explain why you chose a
method/assumption, and why alternatives were not chosen.
• Prepare documentation reports as you go…don’t wait until the end.

Lessons Learned…
Slide 41
8. Consider keeping the technical report separate from other communication products designed specifically to focus on messages.
9. Be patient with your audience.

Lessons Learned…
Slide 42
10. Avoid an open public review of a draft report.

Lessons Learned…
Slide 43
10. Avoid an open public review of a draft report.
11. Don’t get into a “model war” with either EPA or USGS.
Slide 44
Information on CEAP can be found at:
http://www.nrcs.usda.gov/Technical/nri/ceap/