skills supply and demand in south africa 7: skill supply and demand: ... key trends in skills supply...
TRANSCRIPT

SKILLS SUPPLY AND DEMANDIN SOUTH AFRICAIN SOUTH AFRICA
LABOUR MARKETINTELLIGENCE PARTNERSHIP

THELABOUR MARKET INTELLIGENCE PARTNERSHIP
is a collaboration between
institutional mechanism for
skills development
government and a nationalresearch consortium that aims to build a credible
IN SOUTH AFRICA.
This report is published in 2016 by the Labour Market Intelligence Partnership (LMIP), a research consortium led by the Human Sciences Research Council (HSRC), and funded by the Department of Higher Education and Training (DHET).
The ideas, opinions, conclusions or policy recommendations expressed in these reports are strictly those of the author(s) and do not necessarily represent, and should not be reported as, those of the HSRC-led consortium or the DHET.
Reddy, V., Bhorat, H., Powell, M., Visser, M. and Arends, A., (2016) Skills Supply and Demand in South Africa, LMIP Publication, Human Sciences Research Council, Pretoria.
www.lmip.org.za
Education and Skills Development (ESD) ProgrammeHuman Sciences Research Council134 Pretorius StreetPretoria, 0002
Contact person for correspondence:Mariette Visser ([email protected])Fabian Arends ([email protected])
Designed, typeset and proofread by Purple Frog Communications

ACKNOWLEDGEMENTS
This report is a product of the Labour Market Intelligence Partnership Project (LMIP), which is funded by the Department of Higher Education and Training (DHET) and undertaken by a consortium of research organisations led by the Human Sciences Research Council (HSRC). The analysis and writing of this report on Skills Supply and Demand for South Africa was a massive conceptual and empirical exercise.
ACKNOWLEDGEMENTS
Authors: Vijay Reddy, Haroon Bhorat, Marcus Powell, Mariette Visser and Fabian Arends
• Ms Mamphokhu Khuluvhe, Dr Hersheela Narsee and DDG Firoz Patel, of DHET, for their insight and advice.
• Ms Jean Skene and Ms Hilda Bartizal, from the DHET’s Higher Education Management Information Systems and Technical Vocational Education and Training Management Information Systems for providing data in order to make this publication possible.
• Monet Durieux from Statistics South Africa and Joan Roodt, an independent consultant, for their assistance with data analysis and interpretation of the Quarterly Labour Force Survey and the Labour Market Dynamics datasets.
• The authors are grateful to the valuable responses from LMIP
reviewers, Dr Glenda Kruss, Dr Mike Rogan, Dr Angelique Wildschut and Ms Bongiwe Mncwango.
• The authors gratefully acknowledge the extremely valuable recommendations from the external reviewers Professor Martin Gustafsson (University of Stellenbosch), Professor Mike Campbell (Independent Consultant – UK) and Dr Theodore Sparreboom (International Labour Organisation).
• We acknowledge the administrative contribution of Hilda Watani and Elmi de Koning (HSRC).
• We appreciate the proof reading contribution of Sylvia Hannan and Dr Andrea Juan (HSRC) and the efforts of the company, Purple Frog, for the layout and production of this document.
A number of people played a role in the completion of this first report. We would like to acknowledge their contributions
Skills supply and demand in South Africa 1

2 Skills supply and demand in South Africa
TABLE OF CONTENTS
Page
ACKNOWLEDGEMENTS 1
LIST OF FIGURES 4
LIST OF TABLES 5
ACRONYMS AND ABBREVIATIONS 6
FOREWORD FROM DHET 7
EXECUTIVE SUMMARY 8
CHAPTER 1: INTRODUCTION TO THE REPORT FOR SKILLS SUPPLY AND DEMAND IN SOUTH AFRICADescribing South Africa 14Rationale for and approach to skills planning 15Aims and objectives of the report on skills and demand and supply in South Africa 15Methodology and methodological issues 16
Defining skill 16Understanding skills demand 16Understanding skills supply 17Understanding skills mismatches 17
Limitations of our approach 17The structure of the report on skills demand and supply in South Africa 18
CHAPTER 2: ECONOMIC GROWTH AND EMPLOYMENT IN THE SOUTH AFRICAN ECONOMY: A BRIEF OVERVIEW
Economic growth 22Fixed investment and savings 25Export growth and diversification 26Middle-income country comparison 28Employment trends 29Concluding comments and implications for skills planning 31
CHAPTER 3: THE SOUTH AFRICAN LABOUR FORCEOverview of the South African labour force 34Who are the employed and the unemployed? 35
Spatial location of the employed and the unemployed 35Gender and population group of the employed and unemployed 36Age distribution of the employed and unemployed population 36Education level of the employed and unemployed population 37
Youth employment and unemployment 39 The age profile of youth 40The education level of youth 40
Immigrants in the labour force 42Concluding remarks and implications for skills planning 43
CHAPTER 4: SKILLS SUPPLY IN SOUTH AFRICAThe schooling system 46Profile of the University and TVET Sectors 47TVET Colleges: Courses, qualifications and skills 48Universities: Enrolments, qualifications and skills 50Enrolments and university completion by gender and race 53SETA-supported learning programmes 54Concluding comments and implications for skills planning 56

Skills supply and demand in South Africa 3
CHAPTER 5: UNDERSTANDING DEMAND THROUGH CHANGES IN THE STRUCTURE OF EMPLOYMENT
Employment distribution by industrial sector 60Agriculture 61Mining and quarrying 61Manufacturing 61Electricity, gas and water supply 62Construction 62Wholesale and retail trade 62Transport, storage and communication 62Financial intermediation, insurance, real estate and business 62Community, social and personal services 63
Trends in the occupational structure in the labour market 63Specific changes in the occupational structure of the employed 64
The employed by sector and occupation 64Changes in educational levels of occupational groups 66Skills to support government growth initiatives 68Employers’ perceptions of skills demand 69Occupations in high demand 70Concluding comments and skills implications 71
CHAPTER 6: UNDERSTANDING SKILLS MISMATCHESTypes of skills mismatches 74Signals on skills mismatches 74
Signals on demand mismatches 74Signals on educational supply mismatches 75Signals on qualification-job mismatches 77
Concluding comments and implications for skills planning 82
CHAPTER 7: SKILL SUPPLY AND DEMAND: FINDINGS AND RECOMMENDATIONSKey trends in skills supply and demand in South Africa 86Key recommendations for skills supply and demand 88
Challenges for economic growth and development 88Stronger co-ordination between growth and industrial policies and skills policies 88Improved levels of education and skills 88Improved match between field of study and labour market destination 89Improve the evidence base for future reports 89
Specific recommendations for the education and training sector 89Improved education and skills levels of the population 89Education and qualification levels to support high-skilled occupations 89Education and qualification levels to support semi-skilled occupations 90Education and qualification levels to support trade occupations 91
Concluding remarks 91
APPENDICES AND ADDITIONAL INFORMATIONAPPENDIX 1: Examination enrolments and completions in NCV4 Programmes in public TVET Colleges (2010, 2013, 2014)
94
APPENDIX 2: Examination enrolments and completions in NATED 6 Programmes in public TVET Colleges (2010, 2013, 2014)
95
APPENDIX 3: Total enrolment in universities by type of CESM field of study 2010 to 2014 96APPENDIX 4: Number and Shares of students who fulfilled the requirements for a degree or diploma per CESM field of study, 2010 to 2014
97
APPENDIX 5: Skills requirements from major national, provincial and metropolitan development strategies 98APPENDIX 6: Number of occupations in demand for the implementation of the Strategic Integrated Projects (SIPs) 99GLOSSARY OF TERMS 100WORKS CITED 102

4 Skills supply and demand in South Africa
LIST OF FIGURES
Figure 1.1 Framework for the analysis of skills supply, demand and mismatches 17
Figure 2.1 Trends in absolute value of GDP and real GDP growth, 1994 to 2014 22Figure 2.2 Trends in sectoral GDP growth rates, 1994 to 2014 23Figure 2.3 Sectoral contribution to GDP, 1994 and 2014 23Figure 2.4 Sectoral gross value-added and employment growth, 2001 to 2012 24Figure 2.5 Ratio of savings and investment relative to South Africa, 1994 – 2014 25Figure 2.6 Gross fixed capital investment trends in South Africa, 1990 to 2013 Q1 26Figure 2.7 Investment flows to South Africa, 2008 to 2012 26Figure 2.8 Export and import capacity (as % of GDP), 1994 to 2014 27Figure 2.9 Comparison of average annual growth rates of GDP per capita, 1994 to 2014 28Figure 2.10 Comparison of average annual growth in value added by sector, 1994 to 2014 28Figure 2.11 Trends in unemployment rate, 2000 to 2014 30
Figure 3.1 Jobs deficit: Gap between working-age and employed population (million) 31Figure 3.2 Provincial GDP, employment and unemployment, 2014 35Figure 3.3 Employed population by gender, 2010 to 2014 36Figure 3.4 Employed population by population group, 2010 to 2014 36Figure 3.5 Unemployed population by gender, 2010 to 2014 36Figure 3.6 Unemployed population by population group, 2010 to 2014 36Figure 3.7 Age distribution of the employed population, 2010 and 2014 36Figure 3.8 Age distribution of the unemployed population, 2010 and 2014 37Figure 3.9 Highest education level of the employed population, 2010 and 2014 37Figure 3.10 Highest education level of the unemployed population, 2010 and 2014 37Figure 3.11 Percentage of tertiary educated 25 to 64-years-old in 2000 and 2012 38Figure 3.12 Share of age groups of employed youth, 2010 and 2014 40Figure 3.13 Share of age groups of unemployed youth, 2010 and 2014 40Figure 3.14 Distribution of youth by highest level of education, 2010 and 2014 40Figure 3.15 Share of education levels of employed youth, 2010 and 2014 41Figure 3.16 Share of education levels of unemployed youth, 2010 and 2014 41Figure 3.17 Share of education levels of employed youth by age group, 2010 41Figure 3.18 Share of education levels of unemployed youth by age group, 2014 41
Figure 4.1 Number and percentage of learners achieving matriculation with a Bachelor passes in Mathematics passes at higher than 50% from 2010 to 2014.
47
Figure 4.2 Changing enrolment patterns in the University and TVET sector, 2010 to 2014 48Figure 4.3 University completers in 2010 and 2014 by CESM category 52Figure 4.4 Gender difference in university enrolment and completions by type of CESM field of study, 2014 53Figure 4.5 University enrolment and completions by CESM categories and population group, 2014 54
Figure 5.1 Shares of employment by age and sector, 2014 61Figure 5.2 Employed population by main industry sector and occupation (000s), 2014 65Figure 5.3 Occupational structure and educational skill levels in 2010 66Figure 5.4 Occupational structure and educational skill levels in 2014 66Figure 5.5 Educational skill level of fastest-growing technical occupations, 2010 67Figure 5.6 Educational skill level of fastest-growing technical occupations, 2014 67Figure 5.7 Top 15 occupations in demand identified using SETA PIVOTAL list 69

Skills supply and demand in South Africa 5
Table 2.1 Employment growth by sector, 2001 to 2012 25Table 2.2 Comparison of basket of export goods and services, 2005 to 2013 27Table 2.3 Middle-income country comparison of employment and unemployment rates, 1994 and 2014 29Table 2.4 Trends in employment, unemployment and labour market participation, 1995 to 2014 29
Table 3.1 Trends in tertiary and degree graduate qualifications among the employed (rounded to thousands) 38Table 3.2 Youth by employment status, 2011 to 2014 39Table 3.3 Number of work and business permits awarded by the Department of Home Affairs, 2011 to 2013 42
Table 4.1 Comparative country performance education statistics 47Table 4.2 Enrolments at public and private universities and TVET colleges, 2010 to 2014 49Table 4.3 Shares in enrolment in public universities and TVET colleges by gender and population group,
2010 to 201449
Table 4.4 Enrolment by vocational qualification type for Public TVET and Private FET, 2010 to 2014 49Table 4.5 Examination enrolments and completions in NCV 4 and NATED 6 programmes in public TVET
colleges, 2010, 2013 and 201450
Table 4.6 Total enrolment in universities by type of CESM field of study, 2010 to 2014 51Table 4.7 Number (and shares) of students who fulfilled the requirements for a degree or diploma according
to CESM field of study, 2010 to 201452
Table 4.8 Number of workers and unemployed persons registered for and certificated in SETA-supported learning programmes. by programme type, from 2010/11 to 2014/15
55
Table 5.1 Changes in employment by sector between 2010 and 2014 period 60Table 5.2 Changes in the occupational structure of the employed labour force between 2010 and 2014 63Table 5.3 Changes in employment levels at two-digit level occupations between 2010 and 2014 64Table 5.4 List of occupations in high demand at OFO digit level 2 70
Table 6.1 Occupations in demand and response of educational supply 76Table 6.2 Qualification gap for high-skilled occupations 77Table 6.3 Employed population with Higher Education qualifications by study field and main industry
sector, 201478
Table 6.4 Employed population with Higher Education qualifications by study field and main occupation (1-digit), 2014
78
Table 6.5 Employed population with TVET qualifications by study field and main industry sector, 2014 80Table 6.6 Employed population with TVET qualifications by study field and main occupation (1 digit), 2014 82
LIST OF TABLES

6 Skills supply and demand in South Africa
AEO African Economic Outlook
APDP Automotive Production and Development Programme
BankSETA Banking Sector Education and Training Authority
CAGR Comparison of Average Annual Growth Rate
CESM Classification of Educational Subject Matter
CHE Council on Higher Education
CRDP Comprehensive Rural Development Programme
DAFF Department of Agriculture, Forestry and Fisheries
DBE Department of Basic Education
DEA Department of Environmental Affairs
DED Department of Economic Development
DHA Department of Home Affairs
DHET Department of Higher Education and Training
DoL Department of Labour
DPRU Development Policy Research Unit
DTI Department of Trade and Industry
ECD Early Childhood Development
FASSET Financial and Accounting Services SETA
FDI Foreign Direct Investment
FET Further Education and Training
GDP Gross Domestic Product
GHS General Household Survey
HE Higher Education
HEI Higher Education Institution
HEMIS Higher Education Management Information System
HRDC Human Resource Development Council
HRD-SA Human Resources Development Strategy for South Africa
HSRC Human Sciences Research Council
IDZ Industrial Development Zone
ISCED International Standard Classification of Education
ISETT Information Technologies, Electronics, and Telecommunication Technologies
LFS Labour Force Survey
LMIP Labour Market Intelligence Partnership
MiWORC Migrating for Work Research Consortium
MoE Ministry of Education
MRV Most Recent Value
NATED National Accredited Technical Education Diploma
NCV National Certificate Vocational
NDP National Development Plan
NGP New Growth Path
NPC National Planning Commission
NPHE National Plan for Higher Education
NQF National Qualifications Framework
OECD Organisation for Economic Co-operation and Development
OFO Organising Framework for Occupations
OHS Ordinary Household Survey
PISA Programme for International Student Assessment
PIVOTAL Professional, Vocational, Technical and Academic Learning
QLFS Quarterly Labour Force Survey
RSA Republic of South Africa
SACMEQ Southern and Eastern Africa Consortium for Monitoring Educational Quality
SETAs Sector Education and Training Authorities
SIPs Strategic Integrated Projects
SME Small and Medium-sized Enterprises
StatsSA Statistics South Africa
STEM Science, Technology, Engineering and Mathematics
TETA Transport Education and Training Authority
TIMSS Trends in International Mathematics and Science Study
TVET Technical Vocational Education and Training
UKCES UK Commission for Employment and Skills
UNICEF United Nations Children's Emergency Fund
UNISA University of South Africa
UNU-WIDER United Nations University – World Institute for Development Economic Research
UoT University of Technology
WB World Bank
ACRONYMS AND ABBREVIATIONS

It is my pleasure to present to you the first report on Skills Supply and Demand in South Africa. The Department of Higher Education and Training has identified the provision of credible information, analysis and signals on the demand and supply of skills as an important contribution to the establishment of the institutional mechanism for skills planning in South Africa.
This report is a product of the Labour Market Intelligence Partnership, which is undertaken by a consortium of research organisations led by the Human Sciences Research Council, in partnership with the Department.
The report is an important resource to inform the planning and provisioning of education and training, as well as to assist individuals to make appropriate career and educational choices. The report is expected to contribute to the improvement of the responsiveness of the post-school education and training system to the needs of the economy and society more broadly, by supporting decision-making on matters pertaining to skills planning. It is expected to be used as a strategic resource to inform supply-side planning in post-school education and training
FOREWORD FROM DHET
particularly in relation to the allocation of funds, development of strategies and prioritisation, development of qualifications and programmes that are relevant to the needs of the labour market and information for career development.
It is hoped that planners, funders, policy makers, education and training institutions, skills development providers, employers as well as the media will use this report to guide them on matters pertaining to skills planning and the provision of education and training.
The Department will strive to improve the accuracy of this report and be more responsive to stakeholders’ needs. Your feedback, including suggestions for improvement, can be emailed to [email protected].
Mr GF QondeDirector-General: Department of Higher Education and Training
Pretoria, South Africa
Skills supply and demand in South Africa 7

8 Skills supply and demand in South Africa
This report provides a holistic understanding of the current supply and demand for skills in South Africa, and represents one of the first attempts to analyse how the two interact to inform future skills policy to support an inclusive economic growth path. The analytical approach used in this report represents a radical departure from manpower forecasting and attempts to understand the complexities and intricacies around how supply and demand interact, and the corresponding implications for reform.
EXECUTIVE SUMMARY
Under this approach, using largely data for the 2010 to 2014 period from the StatsSA Labour Force Surveys and the Higher Education Management Information System, signals on current and intermediate demand for skilled, semi-skilled and low-skilled occupations
are interpreted. The understanding of skills demand involved an exploration of the three inter-related aspects: the state of the economy; the characteristics of the employed and unemployed who make up the labour force; and current and intermediate demand from the analysis of changes in the structure of employment. We juxtaposed the signals of demand against the supply of skills from out of the formal school education system, the post-secondary education and training systems and also the workplace. The interaction between supply and demand provides the basis for interpreting signals on the nature and extent of skills shortages and mismatches facing South Africa. Only through understanding the complexities of how demand and supply interact is it possible to guide future investment and interventions, as well as support a move towards a more inclusive skills development path.
KEY TRENDS IN SKILLS SUPPLY AND DEMAND IN SOUTH AFRICA • The South African economy
has been characterised by low economic growth rates, leading to poor employment growth. This employment growth has not been sufficient to absorb the large numbers of youth coming onto the labour market for the first time.
The end result is an escalating unemployment rate.
• A key constraint to sustainable job creation in South Africa is the structural mismatch between labour demand and supply. Under this mismatch the economic growth has favoured high-skilled workers, despite the fact that the majority of the employed and the unemployed have low level skills.
• The South African labour force is made up of 15 million employed and 7.5 million unemployed people. Three quarters of the employed and 90% of the unemployed are from the African population group. Unemployment is also particularly high amongst youth (15 to 34 years) and this is increasing as more young people join the labour force.
• The education level and skill base of the labour force is lower than that of many other productive economies. Of the employed population, 20% has a tertiary qualification, 32% has completed secondary education, and close to half of the workforce do not have a grade 12 certificate. Sixty percent of the unemployed has less than a grade 12 certificate. This translates to 11.75 million of the labour force with less than a grade 12 certificate.
The South African labour force is made up of 15 million employed and 7.5 million unemployed people. Three quarters of the employed and 90% of the unemployed are from the African population group. Youth unemployment is particularly high at 45% and increasing as more young people join the labour force. 11.75 million persons of the labour force have less than a grade 12 certificate.

Skills supply and demand in South Africa 9
In 2014 there were 185 000 completers from the university sector. 21 000 NCV4 and 57 000 NATED6 programme completers from the TVET sector.
A critical constraint on the education and training system and the labour market is the inadequate quality of basic education.
• The sectors in which people work and the types of jobs available are changing. In contrast to pathways followed by other recently industrialised economies there is an absence of low-wage jobs in the manufacturing sector that could absorb the vast majority of unemployed who are looking for work. There has been a structural shift towards a service economy and a high dependence on high-skilled financial services. The former sector contributes towards growing the country’s GDP, but offers negligible opportunities for employment growth. The only sector experiencing significant employment growth is the state sector and this is not sustainable.
• Access to schools, universities, and TVET colleges has improved. However, quality remains elusive, leading to low progression through programmes in all types of educational institutions, as well as low completion rates from schools, TVET colleges, and universities.
• A critical constraint on the education and training system and the labour market is the inadequate quality of basic education. Success in the school subjects of Languages, Mathematics and Science forms the basis for participation and success in technical subjects in post-school education and training institutions, and in the workplace. Presently,
each year around 140 000 grade 12 students complete the matriculation examination with a bachelor’s pass, and of these only around 50 000 students pass Mathematics with a score higher than 50%. The pool of students who can potentially access university and Science based TVET programmes is very small, in comparison to the skill demands in the country.
• The university and TVET college sub-systems are the largest components of the post-school education and training system. In 2014, there were around 1.1 million students in the university sector and 0.8 million students in the TVET sector. Since 2010 the TVET sector has been expanding at an average rate of 23% per annum and the university sector has been expanding at an average rate of 2.1% per annum.
• Completion rates at both universities and TVET colleges are less than desirable in that in 2014 there were 185 000 completers from the university sector, 21 000 NCV4 and 57 000 NATED6 programme completers from the TVET sector.
• In both the university and TVET sectors the share of female enrolments is higher than the male enrolments. However the qualification differences support gender stereotypes in the literature, in that males are likely to study for the so-called masculine science, technology, and engineering-based subjects, whereas females are focused on so-called feminine subjects, such as Health, Education, and Social Sciences.
• Skills mismatch denotes the types of imbalances that occur between the types of skills developed and those needed in the world of work. Analysis of imbalances and mismatches provides signals to inform a
skills policy response. In South African context, we can categorise mismatches into three main types: demand mismatch, educational-supply mismatch and qualifications-job mismatch.
– Demand mismatch examines the shape and trajectory being followed by the economy, the types of jobs being created, and the skills set and expectations of the working-age population. A structural mismatch between labour demand and supply is the most significant type in the South African context, in that the economy and labour market show a demand for high-skilled workers, but there is a surplus of low-skilled workers.
– Educational supply mismatch examines the type of skills produced by different levels of education and training systems, and the degree to which they respond to skills demand in specific occupations. Our analysis of the education supply mismatch currently experienced highlights the need to enrol and graduate higher numbers of STEM graduates from both universities and TVET colleges. Further, there is a need for higher enrolments and completions rates in the building and construction, metal machinery and related trades programmes.

10 Skills supply and demand in South Africa
Skills planning must take into account the challenges of economic growth and inclusive development. The skill planning focus goes beyond the small number of skilled people in the workplace, but also on the unemployed, the youth, the low skilled, the marginalised and the vulnerable.
EXECUTIVE SUMMARY continued
– Qualification-job mismatch is comprised of two dimensions: firstly, the qualification gap which examines the match between the type of qualifications required by workers in medium and higher level occupations to perform their job effectively, and the actual type of qualifications held by those in such occupations. Secondly, it traces the sectors and occupations that the educational qualifications are absorbed into. This analysis revealed that there is a qualification gap in that less than half of managers, senior officials, technicians and associate professionals had a tertiary level qualification. Regarding the educational qualification-job mismatches, the evidence showed that higher education graduates tended to be employed in high-skilled occupations as managers, professionals, and technicians, and associate professionals. In contrast only a minority of those with TVET qualifications worked as technicians and associate professionals. Significantly, the data also revealed that nearly half of the higher education graduates are employed in the community, social and personal
services sector. Finally, a high proportion of the Science and Engineering graduates, from both higher and technical vocational education sectors, prefer to work in the financial services sector, as opposed to the manufacturing sector.
KEY RECOMMENDATIONS FROM THE ANALYSIS OF SKILLS SUPPLY AND DEMANDOur recommendations are based on an approach to skills planning that takes into account the challenges of economic growth and inclusive development in South Africa. The skills planning focus is not only on a small number of skilled people in the workplace, but also on the unemployed, the youth, the low-skilled, the marginalised, and those in vulnerable forms of employment, including the self-employed. The dilemma facing policy makers is how to respond to these diverse sets of development and occupational pathways, and decide how resources should be targeted for inclusive skills development. These imperatives may seem paradoxical, but each is essential to achieve a more inclusive growth and development trajectory.

Skills supply and demand in South Africa 11
IMPROVED MATCH BETWEEN FIELD OF STUDY AND LABOUR MARKET DESTINATIONOver half of the country’s graduates enter the Community and Social Services sector, which is dominated by the public sector. These positions offer graduates a relatively good salary, job security and other social benefits, such as healthcare and pensions. Unfortunately, this is distorting the labour market and not attracting graduates to the private sector labour market. The South African private sector must review its human resource strategies to attract more graduates to the sector.
IMPROVE THE EVIDENCE BASE FOR FUTURE REPORTSThe Department of Higher Education and Training must work closely with Statistics South Africa and the other relevant government departments to collect data for skills planning using their administrative data sets. This can be accomplished by participating and engaging in the National Statistics System (NSS) of StatsSA. Going forward, data on vacancies, immigration and emigration (including data about educational levels, employment sectors and occupations) must be included in future reports. Future reports must furthermore include skills forecasting models based on contextually appropriate methodologies.
The South African economy must respond to the twin challenges of participating in a globally competitive environment which requires a high skills base and a local context that creates low-wage jobs.
We make five key recommendations:
CHALLENGES FOR ECONOMIC GROWTH AND DEVELOPMENTRecognising that the South African jobs and skills history profile is different from the East Asian or European contexts, the economy must respond to the twin challenges of participating in a globally competitive environment which requires a high skills base and a local context that creates low-wage jobs (with supported training) to absorb the large numbers who are unemployed or in vulnerable jobs. The economy should start moving towards more labour-intensive forms of growth in order to absorb the growing levels of people, particularly young people, as first time labour market entrants. This will require significant changes to both industrial policy and the development pathways being pursued by the country.
STRONGER CO-ORDINATION BETWEEN GROWTH AND INDUSTRIAL POLICIES AND SKILLS POLICIESMore government co-ordination is needed, including stronger integration of government departments’ growth strategies and strategies targeting skills development and education. Currently there are many national and provincial-level strategies that aim to promote local economic development and deal with unemployment. These growth plans must take into account skills requirements, or they will likely experience difficulties in implementation. Therefore, government departments must realistically estimate the skills needed for the implementation of the strategy and plan their human resource strategy in advance.
IMPROVED LEVELS OF EDUCATION AND SKILLS A key constraint for improving skills levels of the population is the quality, progression, and completion within
the basic education sector. It is clear that the quality of basic education, progression rates through the system and educational outcomes must improve. We recommend the following regarding education and skills.
• Students who do access post-school educational institutions must receive a quality education and achieve progress through the system and achieve higher educational outcomes.
• Given the high numbers of the employed and unemployed with less than a grade 12 education, SETAs must play a role in facilitating occupationally directed programmes targeting this group. Among the priority areas is the unemployed youth group, especially those with less than a grade 12 education.
• The post-school education and training sector must respond by increasing the supply of Science, Engineering and Technology graduates; teachers, especially secondary school Mathematics and Science teachers as well as Early Childhood Development professionals.
• At the technician level there is an under supply of Engineering technicians and associate professionals, as well as building and construction, metal, machinery, electronic and electrical and related trades.
• The NPHE targets and fundings should be reviewed to increase the shares of SET enrolments in university courses from the present 30% to 35%, especially in the areas of Engineering and Health Professions. The TVET sector must develop enrolment targets in line with skills needed for the labour market, and we recommend a target of 45% for NCV4 and NATED6 (N6) Engineering courses.

12 Skills supply and demand in South Africa
1CHAPTER

INTRODUCTION TO THE REPORT FOR SKILLS SUPPLY AND DEMAND IN SOUTH AFRICA
Skills supply and demand in South Africa 13
Introduction to the annual report for skills supply and demand in South Africa
14 Skills supply and demand in South Africa
A challenge for any government is to estimate and anticipate the education and skills required to support societal development, and a productive and inclusive economic growth path.
The LMIP has conducted a number of research studies and produced research reports to inform skills planning in South Africa. One of the research projects1 of the LMIP was to propose a framework and set of indicators for skills planning2 which then informed the Government Gazette, No. 39319, 23 October 2015. The Framework for the Annual Report on Skills Supply and Demand in South Africa (RSA, 2015). This framework formed the basis for the report on Skills Supply and Demand in South Africa.
This report provides a holistic understanding of the current supply and demand for skills in South Africa, and represents one of the first attempts to analyse how the two interact to inform the future skills policy to support inclusive growth. The analytical approach used in this report represents a radical departure from manpower forecasting and attempts to understand the complexities and intricacies around how supply and demand interact, and the corresponding implications for reform.
This report must be viewed as a prototype, as LMIP was tasked with producing a skills planning conceptual framework that is relevant to South African realities and priorities, while wading through the terminology and definitions to make meaning for this context, and working within the parameters of available data. The information and intelligence generated in this report should inform skills policy and skills planning. The engagements from this report will also inform the refinement of the report structure and methodologies for future analyses to produce subsequent reports on skills supply and demand in South Africa.
DESCRIBING SOUTH AFRICACountries which have explicitly embarked on skills planning have approached this task informed by the realities and challenges facing their countries. The South African context and challenges associated with this is best described through the National Planning Commission (NPC) expression, “the triple challenges of poverty, inequality and unemployment”. Thus, the South African government’s response to build a skilled and capable workforce for inclusive development is a critical principle in informing our approach. The effects of the historical legacy of apartheid and disadvantage experienced continue to bedevil our society, especially the African population group. We will describe the characteristics of the South African society in relation to racial groups, gender, education, employment levels, poverty and inequality. This demographic context will inform the approaches and direction of skills planning.
In 2014 the South African population of 54 million was made up of 51% females. The population was 80% Africans, 9% Coloureds, 8.5% Whites and 2.5% Indians/Asians3. South Africa is a youthful country, with two-thirds of the population under the age of 35 years. As is the case with other low-income countries, there is youth bulge, with one third of the population being between the ages of 15 and 34 years.
The education levels of the population have been improving since 1994. When looking at the highest level of education amongst South Africans
Since 1994 there have been efforts to plan for skills needs, but these efforts are fragmented and the performance of the skills planning mechanism is imperfect as evidenced by continued skills shortages. There is therefore a need for a more co-ordinated, coherent, and responsive skills planning system. In 2009, the South African government prioritised skills planning through government priority Outcome 5.1.1 to “establish a credible institutional mechanism for skills planning” (DHET, 2010a).
To meet the Outcome 5.1.1 objectives, in 2012 the Department of Higher Education and Training (DHET) initiated a collaboration with an HSRC-led consortium (Human Sciences Research Council, University of Cape Town and University of Witwatersrand) to establish the Labour Market Intelligence Partnership (LMIP) project. In 2012, when Minister Nzimande launched the LMIP, he requested that it provides a scientific basis to “set up systems for reliable data indicating skills need, supply and demand in our labour market in a manner that will enable our country, including government and businesses, to plan better for the human resources development needs of our country”. This sentiment is endorsed in the White Paper for Post-School Education and Training which observes that, “although South Africa has put in place a range of ambitious measures to improve skills planning, the system has neither produced good information about skills needs, nor increased the quality of provision in areas needed by the economy” (DHET, 2013).
1 See lmip.org.za.2 See Reddy and Powell (2015) A Framework for Skills Planning Indicators. LMIP Publication.3 Definitions according to StatsSA.

Introduction to the annual report for skills supply and demand in South Africa
Skills supply and demand in South Africa 15
CHAP
TER
1
who are 20 years and older, 11.8% have Higher Education as their highest level of education, 28.9% have grade 12, 33.9% have some secondary education, and 25.5% have completed primary level or less as their highest level of education (StatsSA 2012b).
In 2014 there were 22 million people of working age, and of these, 15 million were employed and 8 million were not. Close to three quarters of the employed population are African and 90% of unemployed persons are African. Two thirds of the employed reside in the provinces of economic powerhouses namely Gauteng, Western Cape and KwaZulu-Natal.
While poverty levels have decreased since 1994, there is still a high number of South Africans living in poverty. In 2014, 21.5% of South Africa’s population were described as living below the extreme poverty line (StatsSA 2016). South Africa’s income inequality, as measured by the Gini coefficient, is consistently between the values of 0.66 and 0.69, making it one of the most unequal countries in the world (StatsSA 2014c).
RATIONALE FOR AND APPROACH TO SKILLS PLANNINGThere is growing consensus regarding the skills problems facing South Africa. Key strategy documents like the Human Resource Development Strategy for South Africa, National Skills Development Strategy III, National Development Plan and White Paper for Post-School Education and Training all draw attention to the risks associated with the poor supply of skills from the education and training system and the misalignment between skills supply and demand for the implementation of economic growth strategies (HRDC, 2009; DHET, 2010b; NPC, 2011; DHET, 2013). As a response to these concerns. South Africa decided on a more structured and co-ordinated approach to skills planning.
The South African approach to skills planning has evolved over time. During the apartheid era, the then government
adopted manpower planning models for skills planning. Post-1994, this was replaced by more flexible approaches to skills planning. The current philosophy underpinning a credible skills planning mechanism in South Africa is that the state, as opposed to the market, will take a role in directing economic development, facilitating employment, and determining the type of skills that people require in order to obtain decent and productive employment. This developmental approach is a departure from the reliance only on the market, and attempts are now being made by the state to track skills changes and demands in the labour market and the society, and respond accordingly with changes in supply. In addition, the state will help to ensure alignment is achieved between the government’s trade and investment strategies and economic growth initiatives, and those for education and training. Adopting such an approach will put the government in the driving seat, helping to ensure a more strategic approach to developing the country’s human resources.
Post-1994, there were attempts to understand the demand for skills. The first attempt involved a basic analysis of the supply and demand of skills and the publishing of scarce and critical skills lists by the Department of Labour (DoL, 2003). Recently, the DHET published the Lists of Occupations in High Demand for both 2014 and 2015 and the Department of Home Affairs (DHA) published the Critical Skills List (DHA, 2014; DHET, 2014a, 2015a).
Internationally, debates around the responses and policy reform for skills development have tended to focus on one of two approaches: matching transitions of economic growth with types of skills, or moving towards a higher growth trajectory characterised by increased investment in higher-level skills. The matching transitions debate tends to draw on lessons from East Asian economies and how the transitions in growth stages from Agriculture to the Manufacturing and Services sector should be accompanied by corresponding changes in the types of skills developed as the country
moves up the value chain. Debates surrounding the high-skill trajectory have come from European countries, especially Britain and other English-speaking countries where discourse has focused on how to move or maintain a high-skilled path to development, particularly in light of competition from other middle-income countries.
The matching transitions and high skill debates mainly apply to countries that have a defined development pathway, and these countries have located their competitive development strategy in the global economy. South Africa’s population is also characterised by low levels of numeracy and literacy, and skills development (and occupations in high demand), focuses on a small section of the labour force and the skills required in response to change or competition.
Developing an appropriate skills strategy for South Africa involves assessing the relationship between the changing structure of the economy and the type of skills required to support that economy. With the high level of unemployment there is also a need to consider both the structure of the economy and the skills of the unemployed so that we achieve inclusive growth.
AIMS AND OBJECTIVES OF THE REPORT ON SKILLS DEMAND AND SUPPLY IN SOUTH AFRICAThe primary aim of the Report on Skills Demand and Supply in South Africa is to inform planning and provisioning of education and training, as well as to assist individuals in making appropriate career and educational choices. The report is expected to contribute to the responsiveness of the post-school education and training system to meet the skills needs of the economy and society. It is also intended to be used as a strategic resource to inform supply-side planning in post-school education and training institutions, funding norms, and the development of qualifications and programmes that are relevant to the needs of the labour market and information for career development.

Introduction to the annual report for skills supply and demand in South Africa
16 Skills supply and demand in South Africa
The key objective of the report is to analyse the current and future demand of skills4, as well as the skills supply from the schooling system, post-school institutions, and the workplace, in order to propose a set of recommendations for skills development in post-school institutions and in the workplace. The approach in this report is to bring together the different signals for the demand for skills, and examine the responses from the skills supply system, in order to provide guidance for planners, managers, and stakeholders in the skills arena.
The investment to establish a credible skills planning mechanism for South Africa is important for a number of reasons, including:
• To provide a better understanding of skills supply and demand, especially for skilled and semi-skilled occupations, and this information can be used to plan the size and shape of the post-school education and training system (enrolment planning, new programmes and the infrastructure investment needed);
• To provide a better understanding of the skills set of the unemployed and this information can be used to plan appropriate training programmes for the unemployed;
• To support government’s economic development strategy and target resources to education and skills areas most in need, thus tackling skills shortages;
• To provide credible information to direct government resources at those skill areas where people are likely to gain employment, thus reducing unemployment; and
• To improve South Africa’s economic competitiveness and contribute to poverty alleviation.
METHODOLOGY AND METHODOLOGICAL ISSUESThe over-arching methodological approach guiding the analysis is shown in Figure 1.1. In this approach we interpret the signals for current and future demand for skilled, semi-skilled and low-skilled occupations5. The understanding of skill demand involved four inter-related areas: the state of the economy, the characteristics of the employed and unemployed who make up the labour force, current and future demand. Correspondingly we need to interpret the signals of skills supply from school and post-school institutions. The interaction between supply and demand provides signals of skills shortages and mismatches.
In writing this report a number of methodological issues had to be considered, relating to the definition and measurement of skill, time periods of the analysis, and data availability. In this first prototype report, we developed a skills planning model that is appropriate for the South African context. We have taken pragmatic decisions in writing this report – to focus on the high-level arguments, analysing available data to provide signals for skills planning and not to be paralysed by the range of definitional terms. We outline our approach below.
DEFINING SKILLIn writing the National Strategic Skills Audit for England, 2010 the authors say that “skills can be difficult to define and measure at an aggregate level. Skills are socially constructed, intangible and unobservable. Research uses a number of different measures to assess the quantity, level and content of skills possessed and deployed in the workplace” (UKCES, 2010, page 9). In practical terms, skills can often be measured in terms of qualifications or
occupations. In this report we analysed the educational qualifications as a proxy for skill. Low skills refer to those qualified at pre-matriculation National Qualifications Framework (NQF) levels (1 to 3) or no schooling (less than level 1). Intermediate skill levels are those qualified at NQF levels 4 to 5, and high skills refer to those qualified at NQF levels 6 to 10.
UNDERSTANDING SKILLS DEMANDThe estimates of skills demand involve the analysis of four inter-related areas: the state of the economy, the profile of the labour force, current demand, and future demand.
We analysed the economy by describing economic performance, savings and investments, export growth and diversification, and the related impact on employment and unemployment levels.
The South African labour force (both employed and unemployed) is described in relation to racial group, gender, age, and level of education. There is special reference to youth unemployment.
The analysis of current skill demand focuses on sectoral growth and the age profile of workers within the sector, occupational changes, and changes of skills within an occupation. In addition, we include an analysis of the occupations in high demand, skills needed to support government growth initiatives, and the perceptions of employers of skill needs.
This report does not include an analysis of future demand. Subsequent reports will provide an analysis of the projections on skills demand, including supply forecasted through the linked macro education model developed as part of the LMIP project6.
4 While the intention was to include future demand, we were unable to include this information in this report. It will be included for subsequent reports.
5 Skilled refers to professionals, managers, and technician and associate professional occupations; semi-skilled refers to clerical support workers and sales and services workers, skilled agricultural, craft and trade workers and plant and machine operators; and low-skilled refers to elementary and domestic workers.
6 The Real Centre at the University of Witwatersrand has worked with Applied Development Research Solutions to create a Linked Macro-Education Model for South Africa.

Introduction to the annual report for skills supply and demand in South Africa
Skills supply and demand in South Africa 17
CHAP
TER
1
The key data source for our analysis was the Quarterly Labour Force Survey and Labour Market Dynamics from Statistics South Africa.
UNDERSTANDING SKILLS SUPPLY We analysed skills supply and potential skills supply from the schooling sector, the Technical Vocational Education and Training (TVET) sector and the University sector. We focused on trends in enrolment and completion rates for each of the three educational levels, and in keeping with the transformational agenda, we highlight race and gender trends. The key data sources were from the examinations databases of Department of Basic Education (DBE) and the Higher Education and Training Management Information System (HETMIS) database from the DHET.
UNDERSTANDING SKILLS MISMATCHESDue to the large number of unpredictable variables influencing demand, the process of identifying skills shortages and skills mismatches is not a formulaic or algorithmic science, in that it is not possible to calculate the exact numbers of people needed in the different occupations or sectors. Instead, it is only possible to provide signals on where demand outstrips the supply for specific occupations at a particular point in time.
The approach used to understand skills mismatches was derived from methodologies used in a number of other studies, most significantly being the techniques used for The National Strategic Skills Audit for England 2010 (UKCES, 2010). However, there was a need to adjust to South African conditions and to conduct analyses with available data. At the time of writing this report there was no available survey data from enterprises to understand the extent or nature of skill gaps faced by employers7. Despite this limitation, a number of other data sources were available to help build a picture of mismatches in South Africa.
Following our analysis of skills supply and demand, we identified three types of mismatches, being demand mismatch, education supply mismatch, and qualification-job mismatch.
LIMITATIONS OF OUR APPROACH This is the first report analysing skills supply and demand at a national level, and there are a number of conceptual and methodological limitations. At a conceptual level it is important to understand that matching supply and demand is not a perfect science. There are many unpredictable factors that can influence this process, making
it difficult to anticipate exact future imbalances or mismatches. At best, it is possible to gather evidence on different signals and to understand occupational areas where imbalances or mismatches may occur. Using this evidence, it is then possible to provide guidance to planners and managers on what interventions are available over the immediate, or short to medium term to tackle mismatches. It is not possible with any degree of accuracy to recommend what can be done over the longer term, as deliberate estimates of exact numbers of skills required over the long run are rarely correct or useful to policy makers.
At a methodological level, the most severe limitations are the scarcity and quality of data. It would have been preferable to compare data between the 1994 and 2014 period, which would have helped to provide a measure of changes over the post-apartheid period. Where possible, attempts were made to compare trends between the two periods. Unfortunately, this was not possible for most indicators due to the fact that time series data was not collected. There are also limitations to the current approach for understanding skills shortages and mismatches. Most of the evidence has relied on data from household surveys, especially the Quarterly Labour Force Survey (QLFS)8.
Figure 1.1: Framework for the analysis of skills supply, demand and mismatches
4. Skills Mismatches
5. Skills PolicyResponses
2. Skill Supply 3. Skill Demand
1. ContextEconomy, Demography
and Labour Force
7 As part of the LMIP project. researchers at the Development Policy Research Unit (DPRU), at the University of Cape Town piloted an enterprise survey administered by the SETAs. See lmip.org.za for further details.
8 Refer to the following paper for further discussion of data limitations: Gustafsson M. (2015). Enrolment ratios and related puzzles in developing countries: Approaches for interrogating the data drawing from the case of South Africa. International Journal of Educational Development, 42: 63 to 72.

Introduction to the annual report for skills supply and demand in South Africa
18 Skills supply and demand in South Africa
In South Africa there have been a number of changes in definitions of broad occupational categories, and the use of surveys has changed. This makes it difficult to track trends over time and to see how demand has or hasn’t changed as the case may be. A further limitation is that the sample size is not large, making it difficult to
get accurate occupational data beyond two digit levels, which prevents us from providing details about demand for specific occupations beyond two digits. Another limitation is that our approach failed to accurately understand demand or changes that are occurring within enterprises.
Despite the limitations above, attempts have been made to make the best use of available data. Where possible, our analysis draws on a number of different data sources, helping to triangulate findings and add to the validity of our findings; this provided the basis for our recommendations.
THE STRUCTURE OF THE REPORT ON SKILLS DEMAND AND SUPPLY IN SOUTH AFRICAThis report is the first of a series of reports produced by DHET in partnership with the HSRC, as part of the LMIP. The structure of this report is as follows:
CHAPTER 2
CHAPTER 3
CHAPTER 4
Provides the key findings and recommendations from the analyses. These findings and
recommendations are rooted in contextually appropriate skills planning models that take into account the challenges of economic growth and
inclusive development and the structural inequalities in the society.
Extends the analysis of the demand for skills and provides an understanding of the mismatches that exist in the labour market. Skills mismatches is an
encompassing term which refers to the various types of imbalances between skills offered and skills needed in
the world of work and how the jobs respond to present skill levels. This analysis provides policy makers with signals for interventions to tackle skills mismatches.
Examines the changes in the structure of employment and skills from 2010 to 2014 in the standard industrial sectors and occupational categories. We also analyse the skills needed to support the government growth projects, employers’ perceptions of skills needed in their firms, and outline the analysis to identify the list of occupations in high demand. Together, this data helps us to build a picture of the demand for occupations and skills, and provides a signal to the
education and training system on areas of supply to be prioritised.
CHAPTER 5
CHAPTER 6
CHAPTER 7
0n economic growth and employment in the South African economy briefly outlines South Africa’s
economic performance between 1994 and 2014, and explores the structural and policy constraints that
continue to impede the country’s path towards inclusive growth.
Provides an overview of the South African labour force (the employed and unemployed) for the 2010 to 2014
period through an analysis of the demographics (spatial location, gender, racial group, age, and education
level) for both groups. Given the high levels of youth unemployment, we highlight this group, giving special
attention to its education levels.
Describes the supply and potential supply of skills from the Schooling sector, the TVET sector, and the
university sector. This provides the basis for identifying the types of skills that people acquire when they move
through the education system and enter the labour market. This chapter focuses on trends in enrolment
and completion rates for each educational level.

Introduction to the annual report for skills supply and demand in South Africa
Skills supply and demand in South Africa 19
CHAP
TER
1

20 Skills supply and demand in South Africa
2CHAPTER

Skills supply and demand in South Africa 21
ECONOMIC GROWTH AND EMPLOYMENT IN THE SOUTH AFRICAN ECONOMY: A BRIEF OVERVIEW

Economic growth and employment in the South African economy: A brief overview
22 Skills supply and demand in South Africa
This chapter provides a context for skills planning by outlining South Africa’s economic performance between 1994 and 2014, and exploring the structural and policy constraints that continue to impede the country’s path towards inclusive growth. This chapter draws substantially from a paper by Bhorat, Cassim and Hirsch (2014) entitled Policy co-ordination and growth traps in a middle-income country setting: the case of South Africa, produced under the United Nations University – World Institute for Development Economic Research (UNU-WIDER).
Since 1994, the South African economy has been characterised by positive, but low levels of economic growth, persistently high levels of (pre-1994 driven) unemployment, and rising household income inequality. While some noticeable gains have been made in reducing household poverty, improving access to social services, and delivering housing and other linked infrastructural services – the gains from economic growth remain concentrated
in households at the upper end of the income distribution. Comparisons with other emerging market countries highlight South Africa’s poor economic performance. While several middle-income countries have achieved rapid economic growth in the last two decades. South Africa appears to be trapped in what can be considered a middle-income country growth trap (Bhorat et al, 2014).
ECONOMIC GROWTH By comparison with other middle-income countries, South Africa’s economic growth experience over the last few years has been poor. Between 1994 and 2007, the economy grew at an average rate of 3.6%, despite experiencing growth rates of above 5% between 2005 and 2007. Rapid gross domestic product (GDP) growth during the 2005 to 2007 period partly reflects strong growth in resource exports as a result of the global commodity boom, driven in large part by China’s fast-paced levels of economic growth and intensive demand for natural resources. The South African economy was, however, heavily affected by the global financial crisis in 2007, and growth rates have not yet recovered to pre-crisis levels. Figure 2.1 illustrates that between 2008 and 2014, average growth stood at 1.9%, indicating that
weakened commodity prices, as well as domestic constraints, continue to hinder post-crisis growth.
The low and volatile growth rates experienced since 1994 reflect an economy that has become vulnerable to external shocks, and one that remains largely driven by trends in global growth and demand. As shown in Figure 2.1, the sharp declines in growth in 1998 and 2009 reflect the aftermath of the East Asian financial crisis and the global financial crisis, respectively. In both instances, the contagion effect of these crises appears to have had a relatively more significant impact on growth in South Africa compared with other emerging markets, and certainly most other Sub-Saharan African countries. However, this disparity is also due to the fact that the financial sector in South Africa is significantly more developed and globally connected, and thus more susceptible to the impact of turmoil in international financial markets.
Nevertheless, the South African economy sustained positive and increasing levels of growth between 2001 and 2007. This was partly a result of growing domestic demand – largely due to rising household consumption expenditure, as well as an expansion in the Manufacturing, Construction, and Financial Service sectors. As shown in
Figure 2.1: Trends in absolute value of GDP and real GDP growth, 1994 to 2014
0
500 000
1 000 000
1 500 000
2 000 000
2 500 000
3 000 000
3 500 000
1994 1996 1997 1998 1999 2000 2001 2002 2003 2004 2005 2006 2007 2008 2009 2010 2011 2012 2013 20141995
SA Real GDP (value) (R millions) SA Real GDP growth (%) Sub-Saharan Africa Real GDP growth (%)
Real GDP grow
th (%)Re
al G
DP (R
mill
ions
)
-4
-2
0
2
4
6
8
10
Source: Statistics South Africa (2016); World Bank (2016)

Economic growth and employment in the South African economy: A brief overview
Skills supply and demand in South Africa 23
CHAP
TER
2
Figure 2.2, manufacturing output grew by an average rate of 3.1% between 1994 and 2000, and 3.9% between 2001 and 2007, as trade liberalisation policies, combined with a favourable exchange rate, began to boost South Africa’s manufacturing exports. Construction output grew significantly, at an average rate of 9.3% between 2001 and 2007, largely on account of preparations for the 2010 Football World Cup. Average output growth of 7.0% in the Financial Services sector reflected growing retail banking and insurance services. Similarly, positive output growth in the Mining sector between 2001 and 2007, following negative growth in the previous period (1994 to 2000), further indicates China’s strong demand for natural resources.
The mild boom in sectoral output in the early 2000s was, however, brought to a halt in 2008 following the global economic recession. In particular, manufacturing output growth declined to an average rate of 0.5% between 2008 and 2014; and mining output fell by 0.9% over the same period. While agricultural output increased fairly significantly, by 3.7% during the period, this was mainly due to the steep rise in food prices in 2008. Trends in output growth at the sectoral level also highlight South Africa’s weak economic
growth experience, and reflect an economy that has become underpinned by a declining primary sector, sluggish growth in manufacturing, and a continued reliance on commodity exports.
Economic growth in post-apartheid South Africa, while modest, has been driven largely by capital-intensive industries, retail trade, and financial services, rather than productive and labour-intensive sectors such as Agriculture and Manufacturing. In faster-growing middle-income countries, there has been a tendency to follow a development pathway characterised by a shift in economic activity and employment from low-productivity sectors, such as Agriculture, to high-productivity sectors, such as Manufacturing, and ultimately towards high-skilled services sectors (Bhorat et al, 2014). This growth path leverages new technologies, builds a skilled labour force, and raises productivity – which together lead to higher levels of growth and employment. In South Africa, however, this has not been the case. The contribution to GDP by Manufacturing has declined over time, while that of Financial Services, Transport, and Government services has increased (see Figure 2.3).
Figure 2.2: Trends in sectoral GDP growth rates, 1994 to 2014
-2
0
2
4
6
8
10
Agricultural Mining Manufacturing Utilities Construction Retail Trade Transport Financialservices
Governmentservices
Personalservices
1994 – 2000 2001 – 2007 2008 – 2014
Aver
age
grow
th ra
te (%
)
Source: Statistics South Africa (2016a) and authors’ calculations
Figure 2.3: Sectoral contribution to GDP, 1994 and 2014
Source: Statistics South Africa (2016a)
1994 2014% %
Agriculture 3 3Mining 16 8Manufacturing 16 14Utilities 3 3Construction 3 4Wholesale and Retail Trade 14 15Transport 6 9Financial and Business Services 16 22Government Services 20 17Personal Services 6 6
2014
1994

Economic growth and employment in the South African economy: A brief overview
24 Skills supply and demand in South Africa
The contribution of Mining to GDP declined significantly from 16% to 8%, while the Manufacturing sector’s share of GDP declined from 16% in 1994 to 14% in 2014. The contribution of Agriculture to GDP remained stagnant, while the share of GDP held by the Financial and Business Services sector grew substantially from 17% to 22% over the period.
The above suggests very clearly that the collapse of the mining industry, the weak performance in agriculture, and crucially – the collapse of manufacturing output in South Africa – have essentially generated a growth path starved of regular, low-wage jobs. Into this growth lacuna, output generation (expanded on further below) has been forced into a high-skills-biased employment trajectory dependent on the financial services sector for growth, and the retail and public sectors for jobs.
The growth and employment trajectory can be seen in the interaction between the sectoral contribution to GDP and employment growth, as shown in Figure 2.4. Each bubble represents a sector, and the size of the bubble indicates the relative size of employment in that sector in 2001. The co-ordinates of the centre of each bubble therefore indicate the sector’s output and employment growth over the period. Bubbles above the 45-degree line show sectors whose employment growth exceeded output growth, and vice versa for bubbles
below the line. Sectors with positive output growth are expected to have positive employment growth, while declining sectors are expected to shed jobs (Bhorat et al, 2014).
Specifically, no sectors are above the 45-degree line, indicating that employment growth was less than output growth for all sectors of the economy for the period 2001 to 2012. Mining and Agriculture fared particularly poorly during the period: output growth was negative for mining (-0.3%) and a low positive for agriculture (2.2%); employment declined considerably, falling by 4.1% in the Mining sector, and by 5.1% in the Agriculture sector. Employment growth in the Manufacturing sector was near zero over the period, despite a positive output growth rate of 2.4%. Conversely, the Construction and Financial Services sectors showed relatively high output and employment growth during the period.
The growth in the secondary and tertiary sectors has not been sufficient to absorb new entrants into the labour market, including those who have lost jobs in the Agriculture and Mining sectors since 2001 (See Table 2.1). Between 2001 and 2012, the primary sector shed 719 000 jobs, while the secondary sector added 537 000 jobs, driven mainly by the construction industry. Overall, community services (including government services) were responsible for the bulk of employment
growth over the period, adding 1 million jobs to the economy, and reflecting the dominance of the public sector in employment generation.
It is clear from Table 2.1, an albeit brief empirical overview, that post-apartheid South Africa has, thus far, delivered an economy characterised by an eroding primary sector and an un-dynamic Manufacturing sector. In turn, however, the modest growth levels since 1994 have been marked by a rise in Financial and Business Services, as well as Wholesale and Retail Trade. In short, this post-apartheid growth path has been built around South Africa’s sophisticated and globally competitive financial sector and its consumer-driven domestic aggregate demand.
According to Bhorat et al (2014), sustained low levels of economic growth over the past decade have, in turn, had a muted impact on employment, perpetuating high levels of unemployment and household income inequality. Longer-term growth at appreciably higher levels, which underpins employment and rising living standards, would have to involve a far broader spectrum of the economy than the tertiary sector. The weakness of mining, agriculture, and in particular manufacturing, hinders the longer-term ability of the South African economy to grow, generate employment and improve living standards.
Figure 2.4: Sectoral gross value-added and employment growth, 2001 to 2012
Construction
Financial Services
Transport
Trade
Manufacturing
Agriculture
Community Services
-1 0 1 2 3 4 5 6-7-6-5-4-3-2-1012345678
7 8 9
Average annual gross value added growth (%)
Aver
age
annu
al e
mpl
oym
ent g
row
th (%
)
-1 0 1 2 3 4 5 6 7 8 9
Mining
ConstructionConstructionTransport
Community Services
Source: Bhorat et al, 2014

Economic growth and employment in the South African economy: A brief overview
Skills supply and demand in South Africa 25
CHAP
TER
2
FIXED INVESTMENT AND SAVINGS High investment and savings rates have traditionally been considered key drivers of economic growth, at least in the fast-growing emerging markets in Asia. China, for example, stands out with investment and savings rates well above 30% over the last two decades (WB, 2016). In contrast, South Africa’s investment and savings rates have been relatively low. Between 1994 and 2014, gross savings and gross fixed capital investment averaged 16.4% and 18.1%, respectively. Figure 2.5 displays the ratio of average investment
Table 2.1: Employment growth by sector, 2001 to 20129
Employment growth Employment shares (%) Share of change
Absolute Relative 2001 2012 2001 – 2012
Primary (719 232) (2.6) 0.15 0.07 (0.28)Agriculture (514 468) (2.7) 0.10 0.04 (0.20)Mining (204 764) (2.2) 0.05 0.02 (0.08)
Secondary 537 376 1.0 0.21 0.21 0.21Manufacturing 112 149 0.3 0.14 0.12 0.04Utilities 10 774 0.5 0.008 0.008 0.004Construction 414 453 2.5 0.05 0.07 0.16
Tertiary 2 720 821 1.6 0.63 0.71 1.08Wholesale and Retail Trade 513 572 0.9 0.21 0.21 0.20Transport 288.364 2.1 0.04 0.06 0.11Financial Services 782 108 2.8 0.09 0.13 0.31Community Services 1 041 524 2.1 0.17 0.22 0.42Private households 95 253 0.4 0.09 0.08 0.04Total 2 497 763 1.0 1.0 1.0 1.0
Source: Bhorat et al, 2014
9 Relative employment growth is measured by %ΔEj/%ΔΣjEj and share of change is measured by ΔEj/ΔΣjEj.
Figure 2.5: Ratio of savings and investment relative to South Africa, 1994 to 2014
0.0
0.5
1.0
1.5
2.0
2.5
3.0
China India Indonesia Malaysia Brazil Turkey
Gross savings Gross fixed capital formation
Ratio
rela
tive
to S
outh
Afr
ica
(%)
Source: World Bank (2016) and Bhorat et al (2014) calculations
and savings rates of middle-income countries relative to South Africa. Countries with similarly low growth rates, such as Brazil and Turkey, have shown similar low investment and savings rates. Conversely, investment and savings rates in the fast-growing Asian economies have been at least 1.5 times greater than South Africa over the period.
Low savings rates in South Africa are a result of various factors. Persistent low economic growth and low per capita income growth, high unemployment, and low public savings are among the factors impeding domestic savings,
creating a cycle of insufficient savings and economic stagnation (Loazya et al, 2000). The low savings rate also partly explains South Africa’s low fixed investment rate. Other constraints to investment include perceived political risks, lack of competition in highly concentrated industries, and a scarcity of skills in the labour market (Bhorat et al, 2014). These constraints have hindered growth in both foreign and domestic investment in South Africa, despite the fact that returns to capital have been favourable, and often similar to other emerging markets (WB, 2011). In particular, real returns averaged around 15% between the 1994 and 2008 period, while nominal returns were 22% in the 2005 to 2008 period – the same as in China, albeit over a longer period. Returns have been substantially higher than the prime lending rate, which is particularly surprising given the modest growth experienced by the South African economy. However, as returns increased, investment levels tapered off. It is possible that domestic and foreign investors in South Africa may be inelastic with respect to the return on capital, but somewhat elastic to other factors such as perceived political risks, structural impediments, and low national savings rates. Structural barriers include low levels of industrial

Economic growth and employment in the South African economy: A brief overview
26 Skills supply and demand in South Africa
competition because of concentrated industries with high barriers to entry, and volatile labour relations that are essentially a tax on investment and the scarcity of skills. The latter serves to raise the cost of doing business, which may outweigh the high investment returns available in the South African market.
Where investment has grown, it has been driven by the private sector, while government and public enterprise expenditure tends to be fairly low. Private investment has made up between 65% and 75% of total investment, and has been facilitated through large-scale capital expenditure projects in the Mining, Platinum, Automotive, Chemical Manufacturing, Retail, Real Estate and Tourism sectors. It is worth noting that industries that attracted investment were invariably capital-intensive in nature, so reinforcing the economy’s growth trajectory (Figure 2.6).
The national savings rate is arguably much lower than comparator economies because of the persistently high levels of youth unemployment (currently around 36%), low levels of GDP growth, `and low levels of public savings (WB, 2011). In contrast, faster-growing middle-income countries are generally characterised by higher
levels of national savings, as shown in Figure 2.6.
South Africa’s low savings rate has meant that financing investment has necessitated a fairly large current account deficit. Financing of the deficit has largely been through portfolio investment instead of foreign direct investment (FDI), the latter being the more stable and consistent capital flow option for emerging markets. To put
this into context, portfolio investment in South Africa has averaged around double the proportion of FDI annually (Figure 2.7).
EXPORT GROWTH AND DIVERSIFICATIONIn addition to high savings and investment rates, fast-growing middle-income countries have generated sustained high growth and employment rates by growing export capacity, boosting international competitiveness, and more importantly, diversifying their basket of export goods and services. In China and India, for example, export capacity increased by an average rate of 15.7% and 12.9% per year, respectively, between 1994 and 2014. In South Africa, exports grew by a mere 3.5% per year, on average, during the same period. Despite relatively low growth in exports, South Africa’s trade capacity appears to be in line with several other middle-income countries, reflecting the recent boom in commodity export revenues (see Figure 2.8).
Nevertheless, Figure 2.8 indicates that in the fast-growing Asian economies, such as India and China, the GDP share of exports has been higher than that of imports over the period. In South Africa, Brazil and Turkey, where
Figure 2.6: Gross fixed capital investment trends in South Africa, 1990 to 2013 Q1
1990
GFCI: General Govt GFCI: Public Enterprise GFCI: Private Business
0
10
20
30
40
50
60
70
80
Inve
stm
ent (
%)
1994 1996 1997 1998 1999 2000 2001 2002 2003 2004 2005 2006 2007 2008 2009 2010 2011 2012 201319951992 19931991
Source: South African Reserve Bank (2014) and Bhorat et al (2014) calculations
Figure 2.7: Investment flows to South Africa, 2008 to 201210
2012 2011 2010 2009 20080
20
40
60
80
100
(%)
Portfolio Investment FDIDirect Investment
Source: South African Reserve Bank (2014) and Bhorat et al (2014) calculations.
10 While external investment flows may include other sources. we have only included FDI and Portfolio Investment for the purpose of this analysis.

Economic growth and employment in the South African economy: A brief overview
Skills supply and demand in South Africa 27
CHAP
TER
2
economic growth has been relatively low, exports have made up a similar, if not lower, share of GDP than imports. This suggests that, on the one hand, a trade orientation tilted towards exports is critical to high economic growth, but on the other hand, a key factor in the inability of slow-growing middle-income countries to “catch up” to the Asian economies has been limited diversification of exports towards manufacturing and high-technology exports (Bhorat et al, 2014).
As outlined in Table 2.2, South Africa’s export base has remained dominated by mineral resources exports and services exports, particularly financial services. Specifically, ores and metals exports have, on average, made up 28.4% of merchandise exports over the 2005 to 2013 period. This ranks the highest among other middle-income countries in the sample, and almost five times higher than the sample average. Similarly, South Africa’s insurance financial services exports have also been high, at 7.0% of commercial services exports during the period, coming second only to Brazil. In contrast, manufacturing exports lagged behind, although not the lowest in the sample of middle-income countries. Manufacturing exports comprised 49.9% of merchandise exports, significantly below China’s average of 93.2%, as well as the sample average of 64.3%. High-technology exports were also extremely low compared to other middle-income countries. These exports made up 5.5% of manufacturing exports, compared to the sample average of 21.3%.
In summary, after the advent of democracy in 1994, South Africa re-entered the global economy through a rapid process of trade liberalisation. While imports and exports increased relatively sharply. South Africa lagged behind its emerging-market peers, who had better production methods and a more diversified basket of goods. While sanctions had encouraged domestic diversification of production in South Africa, management, skill and technology levels were not comparable to other developing countries. In addition, liberalisation led to greater import penetration than export diversification, although
Figure 2.8: Export and import capacity (as % of GDP), 1994 to 2014
0
20
40
60
80
100
Brazil India China South Africa Indonesia Malaysia
Average exports (% GDP) Average imports (% GDP)
(%)
PhilippinesTurkey
Source: World Bank (2016) and Bhorat et al (2014) calculations
Table 2.2: Comparison of basket of export goods and services, 2005 to 2013
High-technology exports (% of manufacturing exports)
Insurance and financial services (% of
commercial service exports)South Africa 5.52 6.99Brazil 11.41 7.46China 27.52 1.58India 6.98 5.52Indonesia 7.05 2.02Malaysia 46.94 1.71Philippines 59.65 1.15Turkey 1.78 3.38Average 21.32 3.73
Manufacturing exports
(% of merchandise exports)Food exports
(% of merchandise exports)South Africa 49.87 8.80Brazil 42.06 29.67China 93.19 2.81India 64.86 9.28Indonesia 39.98 15.70Malaysia 66.17 10.62Philippines 78.48 7.80Turkey 79.91 10.06Average 64.31 11.84
Ores and metals exports
(% of merchandise exports
Agricultural rawmaterials exports
(% of merchandise exports)South Africa 28.43 1.83Brazil 13.81 3.71China 1.59 0.47India 5.78 1.75Indonesia 8.61 6.05Malaysia 1.94 2.48Philippines 4.71 0.72Turkey 3.69 0.50Average 8.57 2.19
Source: World Bank (2014) and Bhorat et al (2014) calculations

Economic growth and employment in the South African economy: A brief overview
28 Skills supply and demand in South Africa
it is true that in the earlier years of liberalisation it appeared that South African producers were able to respond to export opportunities. South African competitiveness was, however, hampered by several factors including skills constraints and a notoriously volatile exchange rate. In addition, investment is biased towards heavy manufacturing as opposed to light manufacturing industries. As a result, the composition of exports is still made up of a large share of commodity exports (ores and metal exports). Furthermore, manufactured exports still rely heavily on primary commodity inputs. As such, South Africa’s export profile continues to be capital-intensive in nature and driven by natural resources (Bhorat et al, 2013). The only evident and significant diversification in exports is through insurance and financial services (4% average annual growth) and perhaps tourism.
MIDDLE-INCOME COUNTRY COMPARISONWhen compared with similar middle-income countries, South Africa’s economic performance adds weight to the argument that the country may be trapped in a vicious cycle of low, single-digit growth. A comparison of GDP per capita growth rates illustrates that
Figure 2.9: Comparison of average annual growth rates of GDP per capita, 1994 to 2014
0
2
4
6
8
10
Brazil India ChinaSouth Africa Indonesia Malaysia
CAGR, GDP per capita (%)
(%)
PhilippinesTurkey
Source: World Bank (2016) and calculations by Bhorat et al (2014)
South Africa has failed to converge to the high growth levels experienced by several other middle-income countries. As shown in Figure 2.9, China sustained high levels of GDP per capita growth between 1994 and 2014, with an average annual growth rate of 9%.
In the same vein, India, Malaysia and Indonesia have achieved GDP per capita growth rates above 3%. However, both Brazil and South Africa have, on average, failed to achieve per capita growth rates above 2%. GDP per capita growth in South Africa averaged a mere 1.3% over the period, which was the lowest growth rate among other middle-income countries.
A cross-country comparison of sectoral growth rates between 1994 and 2014 also indicates that South Africa’s productive sectors have lagged severely behind that of the fast-growing Asian economies in the last 20 years. As illustrated in Figure 2.10, during the 1994 to 2014 period, manufacturing value added grew by an annual average rate of 11.0% in China, 7.5% in India, 6.0% in Malaysia, and 5.0% in Indonesia. While Brazil had the lowest annual average growth rate in manufacturing value added (1.5%). South Africa was not far behind at 2.5%. Output growth in industry and services also lagged behind other middle-income countries,
Figure 2.10: Comparison of average annual growth in value added by sector, 1994 to 2014
0
2
4
6
8
10
12
South Africa Brazil Turkey Philippines Malaysia Indonesia India China
Manufacturing (value added) Industry (value added) Services (value added)
CAG
R (%
)
Source: World Bank (2016) and Bhorat et al (2014) calculations

Economic growth and employment in the South African economy: A brief overview
Skills supply and demand in South Africa 29
CHAP
TER
2
despite these two sectors being the drivers of growth, albeit at modest levels, in South Africa.
The gains from rapid growth in Asian economies, particularly in the manufacturing sectors, are also reflected in the stable and low unemployment rates sustained by these economies between 1994 and 2014. As displayed in Table 2.3, South Africa stands out among its middle-income country peers, with an unemployment rate in excess of 20% over the period. Even when compared to similarly slow-growing countries, like Brazil (with an even poorer-performing manufacturing sector) South Africa’s unemployment rate is extraordinarily high.
Table 2.3: Middle-income country comparison of employment and unemployment rates, 1994 and 2014
Unemployment rate (%)
1994 2014South Africa 20.0 25.1Brazil 6.0 6.8Turkey 8.6 9.2Malaysia 3.8 2.0Philippines 8.4 7.1Indonesia 5.0 6.2India 3.7 3.6China 4.3 4.7
Source: World Bank (2016)
Thus, it appears that the South African economy has diverged significantly from other middle-income countries, especially those in Asia. The post-apartheid economy has become increasingly susceptible to external shocks on global growth and demand, which appear to reverse the modest growth gains experienced by the economy immediately following the end of apartheid, as well as renewed growth in the early 2000s. While external events have placed significant pressure on the South African economy, internal constraints are largely to blame for low growth and high unemployment. These constraints include the continued reliance on resource-based exports, and a growth path built on capital-intensive rather than labour-intensive industries (Bhorat et al, 2014). South Africa lags behind other middle-income countries in key areas such as fixed investment and savings, export diversification, and most importantly, in the development of a diverse and dynamic Manufacturing sector. These bottlenecks present a significant and drawn-out challenge to economic growth and sustained employment generation in South Africa.
EMPLOYMENT TRENDSOne of the key deleterious consequences of South Africa’s low and volatile growth rates is the poor outcomes in the labour market, particularly for low-skilled workers and previously disadvantaged racial groups. As indicated in Table 2.4 below, employment growth since the end of apartheid has not been sufficient to absorb the rapidly growing supply of workers: the economy generated 5.6 million jobs between 1995 and 2014, while the labour force grew by almost twice this quantum, resulting in 9.8 million new entrants into the labour market. A consequence of labour force growth in excess of employment growth, over the period, was a large expansion in the number of unemployed individuals, as well as an increasing number of discouraged job seekers. Unemployment roughly doubled, by the broad definition11, from 4.2 million people in 1995 to 8.4 million people in 2014, and the number of discouraged job seekers increased from 2.2 million in 1995 to 3.3 million in 2014, Table 2.4.
Table 2.4: Trends in employment, unemployment and labour market participation, 1995 to 2014
Category1995 (Oct)
(’000)2005 (Sept)
(’000)2014 (Sept)
(’000)
Change (1995 – 2014) Target growth
rate(1995 – 2014)
Employment absorption
rate(1995 – 2014)
Absolute(’000)
Percent(%)
Broad definition estimatesEmployment 9 515 12 301 15 117 5 602 58.88
102.97 57.17Unemployment 4 239 7 800 8 436 4 197 99.01Labour force 13 754 20 100 23 552 9 798 71.24Narrow definition estimatesEmployment 9 515 12 301 15 117 5 602 58.88
91.66 64.24Unemployment 2 032 4 487 5 151 3 119 153.49Labour force 11 547 16 788 20 268 8 721 75.53
Source: OHS (1995), QLFS (2008:3), QLFS (2014:3) (Statistics South Africa) and Bhorat et al (2014) calculations
11 Two standard definitions of unemployment are used in this section, namely the narrow definition (used as the official definition by Statistics SA) and the broad (or expanded) definition of unemployment. According to Statistics South Africa (2016a), individuals are narrowly unemployed if they “(a) did not work during the seven days prior to the interview, (b) want to work and are available to start work within a week of the interview, and (c) have taken active steps to look for work or to start some form of self-employment in the four weeks prior to the interview”. The broad (or expanded) definition of unemployment does not include criterion (c), and therefore includes discouraged workers.

Economic growth and employment in the South African economy: A brief overview
30 Skills supply and demand in South Africa
A basic litmus test of these labour market trends can be done using two simple performance indicators: the target growth rate and the employment absorption rate (Bhorat, 2006). The target growth rate measures how fast employment would have had to expand in order to provide work for all new entrants to the labour market over a given period12, and the employment absorption rate (which is the ratio of actual employment growth and the target growth rate) indicates the proportion of the net increase in the labour force that finds employment. An absorption rate equal to 100 denotes a situation where the increase in labour force is fully accounted for by an increase in employment; and an absorption rate of greater than 100 indicates a situation in which unemployment falls in absolute terms. Therefore, the closer the absorption rate is to 100, the better the actual employment performance is, relative to the desired performance.
The results in Table 2.4 on page 29 illustrate, however, that while
employment grew by 58.9% between 1995 and 2014, employment would have had to grow by 103% – almost double the actual rate – to ensure that all new entrants into the labour market (by the broad definition) were able to find employment. Additionally, the absorption rate indicates that by the broad definition, the economy was only been able to generate 57 jobs for every 100 economically active individuals that entered the labour market between 1995 and 2014. Even by the narrow definition, the number of jobs created for every 100 new entrants into the labour market increased only marginally, to 64 jobs per 100 economically active individuals.
These statistics indicate that South Africa’s dire labour market performance is in many ways a consequence of a rapidly growing labour force, or at least an opening up of the labour market to individuals who, during apartheid, were previously restricted from fully participating in the economy (Bhorat, 2006). Furthermore, the racial discrimination and segregation policies
of the apartheid era, which are reflected in poor educational attainment and skills levels, as well as spatial disparities between housing and economic activity for predominantly disadvantaged population groups, perpetuate the barriers to employment. This labour market outcome, i.e. one characterised by a rapid influx of low-skilled workers, combined with economic growth that has not been able to generate enough low-skill, low-wage jobs at the same pace, has resulted in stubborn and persistently high rates of unemployment. As illustrated in Figure 2.11, unemployment rates have remained above 25% since 2000.
With economic growth continually reliant on a volatile Mining sector, and a growing tertiary sector, much of the labour force remained excluded from South Africa’s post-apartheid growth path. The economy appears to be trapped in a sectoral growth vs employment trap, reflecting a critical mismatch in labour demand and supply.
Figure 2.11: Trends in unemployment rate, 2000 to 2014
0
500
1 000
1 500
2 000
2 500
3 000
3 500
4 000
4 500
2000 2001 2002 2003 2004 2005 2006 2007 2008 2009 2010 2011 2012 2013 2014
Number of discouraged workers (’000s) Narrow unemployment rate (%) Expanded unemployment rate (%)
(%)
(’000
s)
0
5
10
15
20
25
30
35
40
45
Source: LFS (2000: Q3 – 2007: Q3). QLFS (2008:Q3 – 2014:Q3) (Statistics South Africa)
12 The target growth rate captures the growth required to provide employment to only new entrants, and is independent of the rate or level of unemployment in the base year (e.g. 1995). Employment growth at the target rate would result in a reduction in the overall unemployment rate, Bhorat (2006).

Economic growth and employment in the South African economy: A brief overview
Skills supply and demand in South Africa 31
CHAP
TER
2
CONCLUDING COMMENTS AND IMPLICATIONS FOR SKILLS PLANNINGThe first part of this chapter provided an overview of South Africa’s post-apartheid economic performance, while highlighting some of the key constraints to rapid and inclusive growth, as well as employment. Since 1994, the South African economy has been characterised by low and volatile growth rates, extremely high unemployment, and rising inequality. Despite having one of the strongest economies on the African continent. South Africa has not only performed poorly relative to its continental peers, but has also lagged behind other fast-growing middle-income countries. While the advent of democracy in 1994 resulted in South Africa’s re-entry into the global economy, it also resulted in a domestic economy that has become increasingly vulnerable to external shocks, and heavily reliant on natural resource exports and a globally competitive Financial Services sector for growth.
The volatile state of the economy, combined with a lack of high growth, have had dire outcomes in the labour market. Employment growth has not been sufficient to absorb a rapidly growing labour force – with
the result being an inordinately high unemployment rate. This chapter argues that a key constraint to sustainable job creation in South Africa is the structural mismatch between labour demand and supply: the post-apartheid period has delivered an economy characterised by an eroding primary sector, and a weak and un-dynamic Manufacturing sector. Growth has instead been built on large capital-intensive industries, and a rapidly growing Services sector. Economic growth, while modest, has thus favoured high-skilled workers, despite the fact that the majority of the unemployed population is low-skilled. Failure to grow the Agricultural and, in particular, the Manufacturing sectors, has therefore resulted in an economy starved of low-skill, low-wage jobs. This has impacted the youth, partly magnified by the increasing number of individuals coming into the labour market.
The key implication from this analysis is that the skills planning cannot be seen in isolation from the economic growth and employment trajectories. The South African labour force is made up of high and low-skilled workers, and the challenge for the trajectory of the economy is to respond with the supply of high and low-skilled jobs, while still trying to improve productivity and grow the economy.

32 Skills supply and demand in South Africa
3CHAPTER

Skills supply and demand in South Africa 33
THE SOUTH AFRICAN LABOUR FORCE

The South African labour force
34 Skills supply and demand in South Africa
An engaged and productive society and economy is dependent on an educated citizenry and a skilled and capable workforce. The working-age population, in turn, expects to find decent jobs, earn a livelihood, and make a contribution to the society and the economy. The South African labour force has been and continues to be shaped by the aftermath of apartheid, leading to two major contemporary challenges: the challenge to grow the skills and capability levels of the workforce which started from a very low base; and to reduce one of the highest unemployment rates in the world. This chapter, like Chapter 2, provides contextual information to inform skills planning.
In this chapter we provide an overview of the South African labour force13 (the employed and unemployed) for the 2010 to 2014 period through an analysis of demographic variables (spatial location, gender, population group, age and education level), and examine the trend over this period. This will provide signals to both post-school education and training, and workplace training programmes on how they organise the education and training programmes. Given the high levels of youth unemployment in the country, we have chosen to highlight this group, especially with regard to its education levels. In describing the labour force we will also examine the characteristics of immigrants to the labour force as a further signal of the skills need in the country.
OVERVIEW OF THE SOUTH AFRICAN LABOUR FORCEThe South African employed population in the labour force increased from 13.8 million in 2010 to 15.1 million in 2014, hence an additional 1.3 million jobs were created. In the same period, the official number of unemployed persons rose from 4.6 million to 5.1 million (Figure 3.1). Further, much of the working-age population has resigned itself to the state of unemployment (discouraged job seekers) and are not looking for jobs, this group rose from 2 million to 2.4 million for the same period14. Thus, the jobs deficit (the gap between the unemployed working-age population and the employed population) increased by 1.1 million from 2010 to 2014. From 2010 the total number of working-age persons has increased, but the rate of growth of the working-age population is twice the rate of the growth of employment. This high level of unemployment contributes to South Africa’s continued status as one of the most unequal societies in the world.
South Africa experiences high levels of unemployment and this is a major threat at the personal, social, and economic level of the country. The official unemployment rate in 2001 was 26.2%, and this figure decreased to the lowest rate yet in 2008, the start of the recession, when the rate was 22.5%. Unfortunately, the unemployment levels started increasing in 2010 at 24.9%, and reached a rate of 25.1% in 2014. Based on the expanded unemployment definition, 35.4% and 35.3% of the economically active population was unemployed in 2010 and 2014 respectively.
Figure 3.1: Jobs deficit: Gap between working-age population and employed population (million)
2010 2011
Employed population
Popu
latio
n in
mill
ion
2012 2013 2014
Unemployed populationDiscouraged job seekerEconomically active population
0
5
10
15
20
25
2010 2011 2012 2013 2014
13.8 14.1 14.4 14.9 15.1
4.6 4.6 4.8 4.9 5.1
2 2.3 2.3 2.3 2.4
20.4 21 21.5 22.1 22.6
Source: Authors’ own calculations based on the Labour Market Dynamics data, StatsSA (2014b)
13 The labour force is defined as the number of people aged 15 years and older in the population who are either employed or unemployed (StatsSA 2016a). It does not include those who are unable or those not seeking to work (e.g., persons in institutions, retirees, full-time students).
14 There are two unemployment measures: the unemployed looking for jobs (official) and the unemployed not looking for jobs i.e. discouraged workers (expanded).

The South African labour force
Skills supply and demand in South Africa 35
CHAP
TER
3
The following sections provide an analysis of the employed and unemployed by spatial location, population group, gender, age group, and highest level of education. The information about unemployment in the following sections is based on the expanded definition of unemployment.
WHO ARE THE EMPLOYED AND THE UNEMPLOYED?SPATIAL LOCATION OF THE EMPLOYED AND THE UNEMPLOYEDThere are significant variations among different provinces in South Africa, which impacts on employment and further exacerbates inequalities, Figure 3.2 confirms that economic growth is concentrated in three provinces: Gauteng, KwaZulu-Natal, and Western Cape. In contrast, the economically poorer-performing provinces are the Northern Cape, Free State, Limpopo, Eastern Cape, North West and Mpumalanga. There is a need to address regional disparities, but this is made difficult by the lack of economic and employment opportunities in the poorer-performing provinces.
In 2014 the Gauteng province contributed just over one third (34%)
Figure 3.2: Provincial GDP, employment and unemployment, 2014
0
5
10
15
20
25
30
35
Eastern Cape
Free State Gauteng KwaZulu-Natal
Limpopo Mpumalanga
GDP Share of employed Share of unemployed
Perc
enta
ge sh
are
NorthernCape
WesternCape
North West
Eastern Cape Free State Gauteng KwaZulu-Natal Limpopo Mpumalanga North West Northern Cape Western Cape
7.6 5.0 34.4 16.1 7.2 7.5 6.6 2.1 13.6
8.9 4.9 31.9 16.4 7.9 7.5 6.0 2.0 14.5
12.5 6.2 24.4 19.2 8.9 9.8 7.8 2.5 8.6
Source: Employment shares based on StatsSA’s QLFS and the share in GDP, StatsSA (2014b)
to South Africa’s GDP, and the KwaZulu-Natal and Western Cape provinces together contributed close to one third of the GDP. The other six provinces, Eastern Cape, Limpopo, Mpumalanga, North West, Free State, and Northern Cape, combined contributed just over a third of the GDP.
The shares of the employed population by province mirror the provincial GDP shares. One third of the employed reside in Gauteng, with close to one-sixth each residing in the Western Cape and KwaZulu-Natal. The shares of the employed population in the provinces have been fairly constant since 2010, except in KwaZulu-Natal where there was a decrease by three percentage points, and an increase by two percentage points in Gauteng between 2010 and 2014.
All provinces experience unemployment, and the shares of the unemployed are lower than the shares of employed in only Western Province and Gauteng. In all other provinces the shares of the unemployed are higher than the shares of the employed. This presents challenges to provinces in terms of how new jobs will be created to absorb the unemployed.
South Africa experiences high levels of unemployment and this exacerbates inequalities. The challenge is how new jobs will be created to absorb the unemployed.

The South African labour force
36 Skills supply and demand in South Africa
GENDER AND POPULATION GROUP OF THE EMPLOYED AND UNEMPLOYEDGiven the past discrimination policies, both by population groups and gender, it is important to track the changes for these variables. The gender and population group distribution data of the employed population is illustrated in Figures 3.3 and 3.4, and for the unemployed in Figures 3.5 and 3.6 from 2010 to 2014.
From 2010 to 2014, the shares of the employed African population group increased by three percentage points from 70% to 73%, the shares of the Coloured group remained constant, and the shares of Whites and Indians/Asians have slightly decreased. The levels and rates of unemployment are racialised, and in 2014 the majority of the unemployed population was African at 89%. This was followed by the Coloured group at 8%, and the White and Indian/Asian groups both made up the other 3%.
There are fewer women than men participating in the labour market, but the trend analysis shows that the participation patterns are improving. Between 2010 and 2014 the participation of women increased marginally by 0.6 percentage points, from 43.2% to 43.8%. For all population groups, the employed female shares are lower than male shares, and the largest difference between males and females is in the African group, suggesting that the most disadvantaged group are African females. Similarly, more females than males were unemployed across the five-year period and again the share of unemployed females decreased by 1.3 percentage points from 52.6% in 2010 to 51.3% in 2014.
AGE DISTRIBUTION OF THE EMPLOYED AND UNEMPLOYED POPULATION
Close to two thirds of the South African population is under the age of 34 years. This important demographic poses major social, skills and employment challenges. The age pattern of the employed provides an indication of who is able to get into jobs and the pipeline of skills to meet replacement demand
Figure 3.3: Employed population by gender, 2010 to 2014
2010 2011
Male
2012 2013 2014
Female
0
20
40
60
80
100
(%)
2010 2011 2012 2013 2014
56.8 56.6 56.6 56 56.2
43.2 43.4 43.4 44 43.8
Figure 3.4: Employed population by population group, 2010 to 201415
2010 2011
African/Black
2012 2013 2014
Coloured
0
20
40
60
80
100
(%)
Indian/Asian White
2010 2011 2012 2013 2014
70 71 72 73 73
11 11 11 11 11
4 3 3 3 3
15 15 14 13 13
Source: StatsSA (2014b)
Figure 3.5: Unemployed population by gender, 2010 to 2014
2010 2011
Male
2012 2013 2014
Female
0
20
40
60
80
100
Shar
e (%
)
2010 2011 2012 2013 2014
47.4 47.2 47.6 48.2 48.7
52.6 52.8 52.4 51.8 51.3
Figure 3.6: Unemployed population by population group, 2010 to 2014
2010 2011 2012 2013 20140
20
40
60
80
100
Shar
e (%
)
African/Black ColouredIndian/Asian White
2010 2011 2012 2013 2014
89.4 89.3 89.2 88.9 88.7
7.3 7.4 7.6 7.6 7.6
0.9 1.0 1.1 1.3 1.2
2.3 2.3 2.1 2.3 2.4
15 In 2010 Africans made up 79.3% of the population and Whites 9.2%. In 2014 Africans made up 80.0% of the population and Whites 8.5%.
Figure 3.7: Age distribution of the employed population, 2010 and 2014
05
10
15
20
25
30
35
40
15 to 24 25 to 34 45 to 54 55 to 64
2010 2014
Perc
enta
ge sh
are
(%)
35 to 44
15 to 24 25 to 34 35 to 44 45 to 54 55 to 64
9,2 32,4 30,1 20,2 8,1
8,3 31,4 30,9 20,3 9,0
Source: StatsSA (2014b)

The South African labour force
Skills supply and demand in South Africa 37
CHAP
TER
3
i.e. who will be able to take over jobs as others retire. The age pattern of the unemployed points to vulnerable groups in the labour force and signals where to direct training efforts. The age distribution of the employed and unemployed population is presented in Figures 3.7 and 3.8, respectively.
Figure 3.7 shows that close to 60% of the employed are above the age of 35 years; the shares of employment for people aged 35 years and older have increased slightly (by almost two percentage points), and those for the younger generation have decreased similarly. This is a concern as South Africa is a youthful country, and employment for the youth should be increasing. More than two thirds of the unemployed are in the 15 to 34-year age group (categorised as youth), and it is encouraging that this ratio has decreased by 2.7 percentage points from 69.1% in 2010 to 66.4% in 2014. However, this high level of unemployment for the youth group presents a major social and skills challenge for the country.
EDUCATION LEVEL OF THE EMPLOYED AND UNEMPLOYED POPULATIONIt is universally recognised that higher levels of educational attainment are associated with better health and well-being, higher employment rates, better labour market opportunities, and higher earning. We report on the educational qualifications of the labour force from 2010 and 2014, which we acknowledge is only one measure of skills.
The education level of the employed population is increasing (Figure 3.9). From 2010 to 2014 the shares of the employed with a matriculation certificate or higher increased by 2.6 percentage points from 49.9% to 52.5%. The shares of the employed with a tertiary education increased from 19.3% in 2010 to 20.5% in 2014. The number and share of the employed with ‘primary completed or lower’ education, although decreasing, was still over 2 million workers in 2014. This group constituted 16.6% of the employed in 2010 and 13.8% in 2014. The majority of these 2 million workers
Figure 3.8: Age distribution of the unemployed population, 2010 and 2014
05
10
15
20
25
30
35
40
15 to 24 25 to 34 45 to 54 55 to 64
2010 2014
Perc
enta
ge sh
are
(%)
35 to 44
15 to 24 25 to 34 35 to 44 45 to 54 55 to 64
31.2 37.9 19.0 9.3 2.6
28.4 38.0 20.6 10.0 2.9
Source: StatsSA (2014b)
Figure 3.9: Highest education level of the employed population, 2010 and 2014
0
10
20
30
40
50
Primary completedor lower
Secondarynot completed
Secondarycompleted
Tertiary
2010 2014
Perc
enta
ge sh
are
(%)
Primary completed or lower
Secondary not completed
Secondary completed Tertiary
16.6 33.5 30.6 19.3
13.8 33.7 32.0 20.5
Figure 3.10: Highest education level of the unemployed population, 2010 and 2014
0
10
20
30
40
50
Primary completedor lower
Secondarynot completed
Secondarycompleted
Tertiary
2010 2014
Perc
enta
ge sh
are
(%)
Primary completed or lower
Secondary not completed
Secondary completed Tertiary
19.4 47.0 28.9 4.7
15.6 48.7 29.7 6.0
Source: StatsSA (2014b)

The South African labour force
38 Skills supply and demand in South Africa
are over 35 years of age, close to 90% are from the African population group, and just over 10% are from the Coloured population group.
Figure 3.10 represents the distribution of the highest level of education of the unemployed population for 2010 and 2014. Close to two thirds of the unemployed have an education level that is less than a secondary education certificate. This analysis confirms other research on the returns to the educational investment, and that those with less than a grade 12 certificate are extremely vulnerable in the labour market (Bhorat et al, 2015).
Another important indicator for any emerging industrialised country is the level of tertiary education16 and degree of graduate attainment of the population. The employed population with a tertiary education is gradually increasing in numbers and constituted 20.5% of the employed population in 2014 compared to 19.3% in 2010.
Figure 3.11: Percentage of tertiary educated 25 to 64-year-olds in 2000 and 2012
0
10
20
30
40
602000 2012
50
Chin
a2
Sout
h Af
rica
Indo
nesia
1
Braz
ilTu
rkey
Italy
Chile
1
Mex
ico
Port
ugal
Slov
ak R
epub
licCz
ech
Repu
blic
Colo
mbi
a1
Aust
riaHu
ngar
yPo
land
Slov
enia
Gree
ceGe
rman
yLa
tvia
Fran
ceSp
ain
OEC
D av
erag
eN
ethe
rland
sDe
nmar
kIc
elan
dBe
lgiu
mSw
eden
Switz
erla
ndEs
toni
aN
orw
ayLu
xem
bour
gFi
nlan
dIre
land
New
Zea
land
Uni
ted
King
dom
Aust
ralia
Kore
aU
nite
d St
ates
Isra
elJa
pan
Cana
daRu
ssia
n Fe
dera
tion
1. Year of reference 2011. 2. Year of reference 2010.Countries are ranked in ascending order of the percentage of 25 to 64-year-olds who have attained tertiary education in 2012 (or latest available year).Source: OECD. Table A1.4a. See Annex 3 for notes (www.oecd.org/edu/eag.htm)Source: OECD. (2014)19
19 OECD defines tertiary education as an ISCED 5A programme which provides access to research-based programmes and professions with high skill requirements. This is different from the definition used by StatsSA.
Table 3.1 provides the rounded off numbers of employed persons with tertiary education. In 2014 those employed and having tertiary education qualifications were made up of 1.2 million (39%) higher education (HE) graduates and 1.8 million (61%) diploma and certificate completers.
As South Africa aspires to improve its level of education and skills, it is important to benchmark our education and skills level against other countries. Figure 3.11 provides the comparative statistic for tertiary education for 25 to 64-year-olds in a number of countries.
Table 3.1: Trends in tertiary and degree graduate qualifications among the employed (rounded to thousands)
201317 2014Tertiary employed 3 041 000 3 072 000Employed with HE qualifications18 1 178 000 1 201 000Employed with diploma and certificate qualifications 1 863 000 1 871 000
Source: StatsSA (2014b)
16 StatsSA (2016a) has used the following definition to categorise tertiary education: individuals who have obtained an undergraduate or post-graduate degree or have completed secondary school and, in addition, obtained a certificate or diploma of at least six months’ full-time duration.
17 Reliable data for previous years was not available.18 Closer examination of the StatsSA data revealed that there were some inconsistencies in
the categorisation of the TVET and HE qualifications in relation to study fields, and for more accurate skills estimates we suggest further cleaning of the data related to qualifications and study fields data (Q1.7 and Q1.8 in QLFS).

The South African labour force
Skills supply and demand in South Africa 39
CHAP
TER
3
Table 3.2: Youth by employment status, 2011 to 2014
2011 2012 2013 2014
Number % Number % Number % Number %Youth 18 908 974 36.7 19 139 816 36.6 19 367 380 36.6 19 582 969 36.5Working-age population (15 to 34 years) 10 499 797 10 675 735 10 852 215 10 982 462Employed working-age population (15 to 34 years) 5 771 360 55.2 5 867 779 54.9 6 008 030 55.3 6 021 178 54.8• 15 to 24 years 1 271 608 1 241 850 1 277 125 1 263 226• 25 to 34 years 4 499 752 4 625 928 4 730 906 4 757 951Youth neither in education, employment, training (official unemployment) 3 205 253 30.5 3 270 917 30.6 3 294 877 30.3 3 376 843 30.7• 15 to 24 years 1 286 015 1 329 173 1 352 093 1 330 180• 25 to34 years 1 919 238 1 941 744 1 942 784 2 046 662Discouraged youth job seekers 1 523 185 14.5 1 537 039 14.4 1 549 307 14.3 1 584 441 14.4
Source: StatsSA (2014)
Among the countries compared, South Africa has one of the lowest levels of tertiary education in its population. In Brazil, 13.0% of the 25 to 64-year-old population had attained a tertiary education qualification in 2012, compared to South Africa where 6.4% attained the same qualification. While it is acknowledged that South Africa started off in 1994 from low levels of education, it is imperative that the level of tertiary education of the population and labour force is increased to support growth and productivity of the economy.
YOUTH EMPLOYMENT AND UNEMPLOYMENTSouth Africa has a fairly young population, with almost two thirds
of the population under the age of 34 years. A total of 37% of the South African population is categorised as youth (15 to 34 years of age). The profile of youth in terms of the working-age population, and the official unemployment rates, is provided in Table 3.2. Unemployment, and in particular youth unemployment, is a major concern in South Africa. Close to half of the youth is neither in education, employment, nor training, and this trend has been consistent over the last few years. The unemployed youth are made up of almost equal proportions of males and females, 87% of the unemployed youth are African and 8% are from the Coloured population group. This presents a major social, policy, and skills challenge.
South Africa is a youthful country with two thirds of the population under the age of 35. This youth bulge could result in either a youth dividend or a youth bomb.

The South African labour force
40 Skills supply and demand in South Africa
Figure 3.14: Distribution of youth by highest level of education for 2010 and 2014
0
10
20
30
40
50
Primary completedor lower
Secondarynot completed
Secondarycompleted
Tertiary
2010 2014
Perc
enta
ge sh
are
amon
g yo
uth
(%)
Primary completed or lower
Secondary not completed
Secondary completed Tertiary
10.5 42.4 36.1 11.0
8.2 42.5 36.5 12.8
Source: StatsSA (2014b)
Figure 3.12: Share of age groups of employed youth, 2010 and 2014
0
10
20
30
40
50
15 to 19 20 to 24 30 to 34
2010 2014Pe
rcen
tage
shar
e am
ong
empl
oyed
(%)
25 to 29
15 to 19 20 to 24 25 to 29 30 to 34
2.0 20.1 37.1 40.8
1.8 19.2 37.5 41.5
Figure 3.13: Share of age groups of unemployed youth, 2010 and 2014
0
10
20
30
40
50
15 to 19 20 to 24 30 to 34
2010 2014
Perc
enta
ge sh
are
amon
g un
empl
oyed
(%)
25 to 29
15 to 19 20 to 24 25 to 29 30 to 34
9.8 35.3 32.2 22.7
7.7 35.1 32.4 24.8
Source: StatsSA (2014b)
THE AGE PROFILE OF YOUTHThe population group and gender profile of economically active youth in 2014 was as follows: 82% African, 9% Coloured, 2% Indian/Asian, and 6% white, and comprised 54.0% male and 46.0% female. The age distribution of the employed and unemployed youth is presented in Figure 3.12 and Figure 3.13 respectively.
Among the youth group, the employment participation increases with age, and very few 15 to 19-year-olds participate in the labour market. Youth in the 25 to 34-year age group claim 79% of the shares of the youth employed. Youth unemployment is higher for those under the age of 30, and the group aged 20 to 30 years makes up two thirds of the unemployed youth.
THE EDUCATION LEVEL OF YOUTH
The distribution of the economically active youth by highest level of education achieved is presented in Figure 3.14.
The education level among the economically active youth increased slightly from the period 2010 to 2014. The share of tertiary education qualifications increased by 1.8 percentage points from 11.0% in 2010 to 12.8% in 2014. The share of the youth group with less than a grade 12 education, though still very high, decreased marginally from 52.9% in 2010 to 50.7% in 2014.

The South African labour force
Skills supply and demand in South Africa 41
CHAP
TER
3
Figure 3.15: Share of education levels of employed youth, 2010 and 2014
0
10
20
30
40
50
60
Primary completedor lower
Secondarynot completed
Secondarycompleted
Tertiary
2010 2014
Perc
enta
ge sh
are
amon
g em
ploy
ed (%
)
Primary completed or lower
Secondary not completed
Secondary completed Tertiary
8.7 36.1 38.7 16.4
7.0 35.4 38.9 18.8
Source: StatsSA (2014b)
Figure 3.16: Share of education levels of unemployed youth, 2010 and 2014
0
10
20
30
40
50
60
Primary completedor lower
Secondarynot completed
Secondarycompleted
Tertiary
2010 2014
Perc
enta
ge sh
are
amon
g un
empl
oyed
(%)
Primary completed or lower
Secondary not completed
Secondary completed Tertiary
12.4 49.4 33.2 5.0
9.4 50.2 34.0 6.4
Source: StatsSA (2014b)
Figure 3.17: Share of education levels of employed youth by age group, 2010
15-19 20-24 25-29 30-340
20
40
60
80
100
Perc
enta
ge sh
are
(%)
Primary completed or lowerSecondary not completedSecondary completedTertiary
15 to 19 20 to 24 25 to 29 30 to 34
19.6 7.0 5.8 7.5
44.2 36.3 34.8 35.0
35.1 44.3 39.6 35.9
1.1 12.4 19.8 21.6
Source: StatsSA (2014b)
The general conception is that youth are unemployed as a result of the low education levels, Figures 3.15 and Figure 3.16 present the distribution of the economically active employed and unemployed youth by highest level of education for the years 2010 and 2014. The following analysis will highlight differences between the results presented in the two graphs.
Figures 3.15 and Figure 3.16 mirror the pattern for the general population (See page 37, Figure 3.9 and 3.10). The employed youth have higher levels of educational attainment than the unemployed youth. The education level of the employed youth increased from 2010 to 2014, and 60% of the unemployed youth have not completed their secondary education. This signals an opportunity where the education and skill level of the majority of the unemployed youth should be increased to a grade 12 or equivalent level NQF level 4).
Figures 3.17 and Figure 3.18 illustrate the shares of education levels of the employed and unemployed youth by age group for 2014, respectively. Across all age groups, those with less than a grade 12 certificate are most vulnerable in the labour market.
Figure 3.18: Share of education levels of unemployed youth by age group, 2014
15-19 20-24 25-29 30-340
20
40
60
80
100
Perc
enta
ge sh
are
(%)
Primary completed or lowerSecondary not completedSecondary completedTertiary
15 to 19 20 to 24 25 to 29 30 to 34
17.0 8.0 8.1 10.9
54.8 48.6 50.3 50.9
27.8 37.9 33.3 31.4
0.4 5.5 8.3 6.9
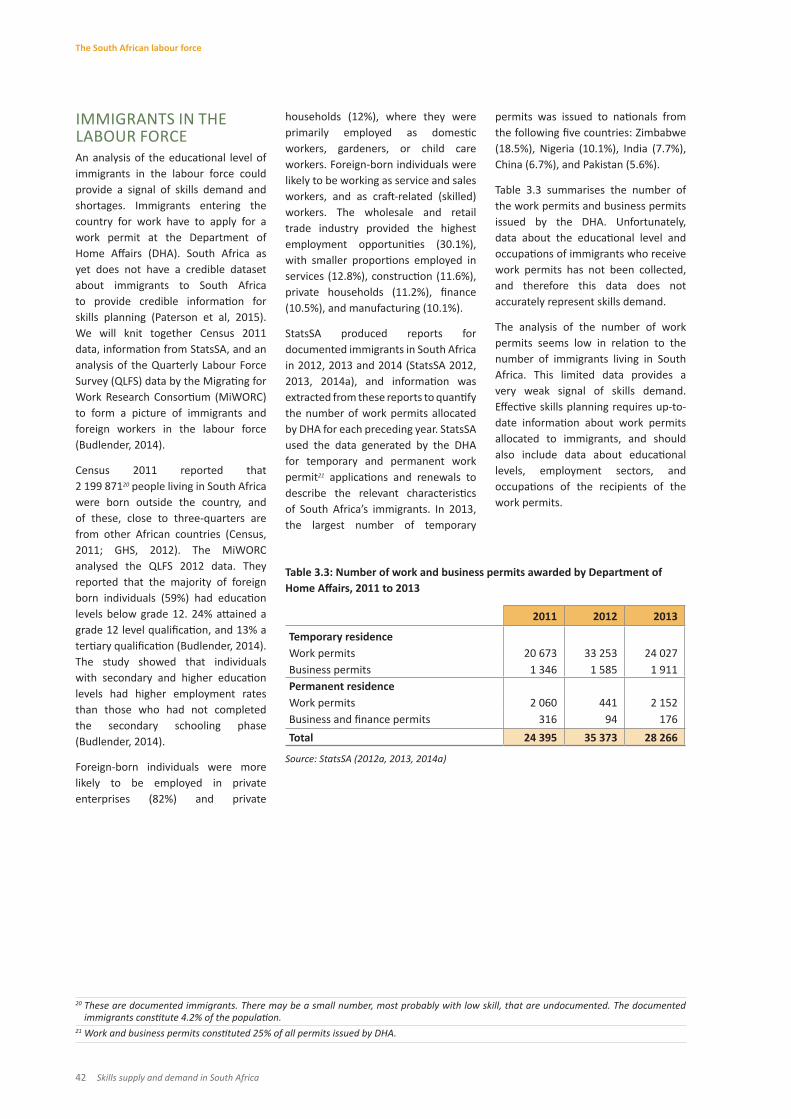
The South African labour force
42 Skills supply and demand in South Africa
permits was issued to nationals from the following five countries: Zimbabwe (18.5%), Nigeria (10.1%), India (7.7%), China (6.7%), and Pakistan (5.6%).
Table 3.3 summarises the number of the work permits and business permits issued by the DHA. Unfortunately, data about the educational level and occupations of immigrants who receive work permits has not been collected, and therefore this data does not accurately represent skills demand.
The analysis of the number of work permits seems low in relation to the number of immigrants living in South Africa. This limited data provides a very weak signal of skills demand. Effective skills planning requires up-to- date information about work permits allocated to immigrants, and should also include data about educational levels, employment sectors, and occupations of the recipients of the work permits.
Table 3.3: Number of work and business permits awarded by Department of Home Affairs, 2011 to 2013
2011 2012 2013
Temporary residence Work permits 20 673 33 253 24 027Business permits 1 346 1 585 1 911Permanent residenceWork permits 2 060 441 2 152Business and finance permits 316 94 176Total 24 395 35 373 28 266
Source: StatsSA (2012a, 2013, 2014a)
IMMIGRANTS IN THE LABOUR FORCEAn analysis of the educational level of immigrants in the labour force could provide a signal of skills demand and shortages. Immigrants entering the country for work have to apply for a work permit at the Department of Home Affairs (DHA). South Africa as yet does not have a credible dataset about immigrants to South Africa to provide credible information for skills planning (Paterson et al, 2015). We will knit together Census 2011 data, information from StatsSA, and an analysis of the Quarterly Labour Force Survey (QLFS) data by the Migrating for Work Research Consortium (MiWORC) to form a picture of immigrants and foreign workers in the labour force (Budlender, 2014).
Census 2011 reported that 2 199 87120 people living in South Africa were born outside the country, and of these, close to three-quarters are from other African countries (Census, 2011; GHS, 2012). The MiWORC analysed the QLFS 2012 data. They reported that the majority of foreign born individuals (59%) had education levels below grade 12. 24% attained a grade 12 level qualification, and 13% a tertiary qualification (Budlender, 2014). The study showed that individuals with secondary and higher education levels had higher employment rates than those who had not completed the secondary schooling phase (Budlender, 2014).
Foreign-born individuals were more likely to be employed in private enterprises (82%) and private
households (12%), where they were primarily employed as domestic workers, gardeners, or child care workers. Foreign-born individuals were likely to be working as service and sales workers, and as craft-related (skilled) workers. The wholesale and retail trade industry provided the highest employment opportunities (30.1%), with smaller proportions employed in services (12.8%), construction (11.6%), private households (11.2%), finance (10.5%), and manufacturing (10.1%).
StatsSA produced reports for documented immigrants in South Africa in 2012, 2013 and 2014 (StatsSA 2012, 2013, 2014a), and information was extracted from these reports to quantify the number of work permits allocated by DHA for each preceding year. StatsSA used the data generated by the DHA for temporary and permanent work permit21 applications and renewals to describe the relevant characteristics of South Africa’s immigrants. In 2013, the largest number of temporary
20 These are documented immigrants. There may be a small number, most probably with low skill, that are undocumented. The documented immigrants constitute 4.2% of the population.
21 Work and business permits constituted 25% of all permits issued by DHA.

The South African labour force
Skills supply and demand in South Africa 43
CHAP
TER
3
CONCLUDING REMARKS AND IMPLICATIONS FOR SKILLS PLANNINGThis overview described the characteristics of the employed and the unemployed, especially youth who are unemployed. There are 15 million people employed and 7.5 million unemployed. Three quarters of the employed and 90% of the unemployed are from the African population group. Close to half of the employed population of South Africa is between the ages of 30 and 44 years. The highest level of unemployment is for the youth group (15 to 34 years) where 45% of the group is either unemployed or a discouraged job seeker.
While the education level in the country increased slightly between
2010 and 2014, this is too low to stimulate the economy. About 20% of the employed population has a tertiary qualification, 32% has completed secondary education, 33% has some secondary education, and 14% has some primary education. A total of 60% of the unemployed has less than a grade 12 certificate. Of the 2.2 million documented immigrants in South Africa, close to 60% also has less than a grade 12 certificate.
Given the differentiated educational levels and labour market status of the working-age population, there must be multiple skills policy responses to raise the education and skills levels of the labour force. On the one hand, for an expanding, innovative and productive labour market, the shares of tertiary level workers must be increased. The
high number of workers with less than a grade 12 certificate calls for responses to improve educational qualifications, as well as to provide structured workplace training opportunities to improve workers’ skill levels to meet the challenges of the changing workplace conditions.
Offering differentiated skills programmes for the unemployed must become a priority, especially those with less than a grade 12 certificate. For those who have a grade 12 certificate there should be more occupational directed programmes, especially for those areas needed in the labour market.

44 Skills supply and demand in South Africa
4CHAPTER
SKILLS SUPPLY IN SOUTH AFRICA
Skills supply and demand in South Africa 45

Skills supply in South Africa
46 Skills supply and demand in South Africa
When looking at the schooling sector, Mathematics performance is analysed, as well as the number of bachelor passes, and how these have changed over time. Understanding these trends is important as these skills provide the basis for entry into the next level of the education system. At the TVET level, patterns of enrolment levels by the study fields of Engineering, Services, and Business are analysed. At the higher education level, the analysis is focused on enrolment and completion rates for Business, Science, Engineering, and Technology and Humanities study fields. Together, this evidence provides the basis for identifying whether or not South Africa is developing the knowledge base to tackle current and future demand, as well as to help solve the growing skills shortages and mismatches being experienced.
• The education system is unequal and, in general, only 25% to 30% of learners across all grade levels achieve the minimum competence in Mathematics and Science.
The throughput rate of learners from grades 1 to 12 is of concern, with low numbers of learners proceeding to achieving a secondary school certificate. This is best illustrated by the following results: 1.27 million learners began school in grade 1 in 2003; nine years later in 2011, 1.05 million learners were in grade 9 (end of the compulsory basic education phase), and three years later 0.57 million learners wrote the grade 12 examination (matriculation exit examination). Less than 40% of the learners who reach grade 9 complete the matriculation examinations (Branson et al, 2014; Isdale et al, 2016).
The quality of the matriculation (grade 12) pass rates, and in particular the indicator of the number of bachelor’s passes22, provides an indication of the potential pool available to enter post-school education and training institutions, especially in technical areas. Figure 4.1 shows the trend for the period 2010 to 2014. In this period there has been a 19% increase in the number of learners completing grade 12 with a bachelor’s pass.
The low quality of Mathematics performance throughout the education system results in a low number of high-quality Mathematics passes in the matriculation examination. While the country boasted an average of 141 000 bachelor’s passes in the 2010 to 2014 period, the average number of learners who passed with Mathematics scores greater than 50% for the same period is 51 300. This is the pool of school leavers who could access the Science, Engineering, and Technology and Health-related tertiary level courses.
The South African gross enrolment rates at primary and secondary schools are high, and comparable with other countries (Table 4.1). Similarly,
THE SCHOOLING SYSTEMAn outcome of the apartheid government’s policy is a low-quality and unequal schooling system, leading to a post-school education system that is not accessible to those with poor levels of schooling. Education is a key priority, and the country has invested enormous resources to improve the schooling system. The state has improved access to schooling (notably at the primary level), but positive outcomes, notably in Mathematics and Science subjects, remain elusive. As we shall see later, this poor foundation impacts negatively on the types and quality of skills entering the labour market.
The key measure of the wellbeing of our educational system is the achievement of learners. Analysis of the performance of the South African schooling population using the results from national (Annual National Assessments), regional (Southern and Eastern Africa Consortium for Monitoring Educational Quality (SACMEQ)), and international (Trends in International Mathematics and Science Study (TIMSS)) assessments all point to the following (Reddy and Juan, 2014):
• The national Mathematics, reading, and Science average scores are consistently low over time and across different grades. TIMSS 2011 showed that, although South African scores are still low, there has been some improvement in Mathematics and Science performance between 1996 and 2011.
22 Minimum requirement to register for a qualification at a university.
An outcome of the apartheid government’s policy is a low-quality and unequal schooling system, leading to a post-school education system that is not accessible to those with poor levels of schooling.
This chapter describes the supply and potential supply of skills from the formal schooling, TVET, and university sectors. This provides the basis for identifying the types of skills that people acquire when they move through the education system and enter the labour market. The topic that this report tackle, is whether or not South Africa is producing the appropriate skills and qualifications at each level, and the extent to which this facilitates inclusive employment. At a general level, this chapter focuses on trends in enrolment and completion rates for each of the three broad educational levels. More detailed analysis is undertaken on pertinent labour market issues at these three institutional stages of human capital accumulation.
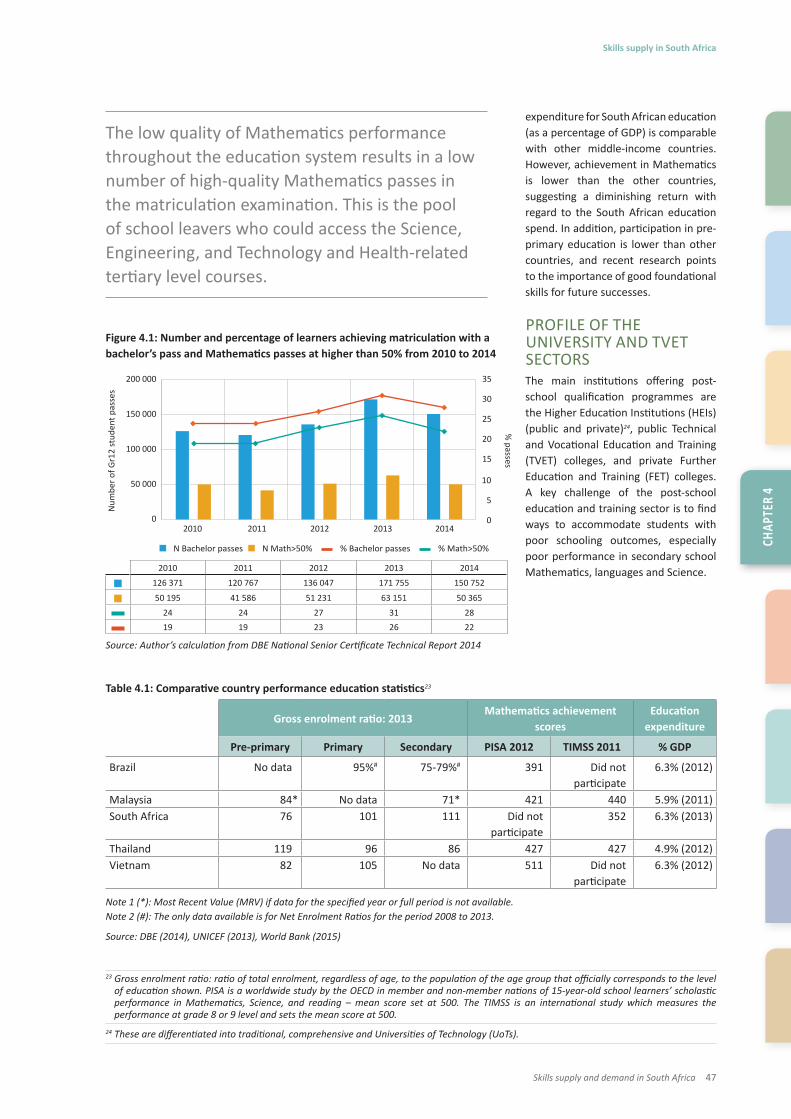
Skills supply in South Africa
Skills supply and demand in South Africa 47
CHAP
TER
4
expenditure for South African education (as a percentage of GDP) is comparable with other middle-income countries. However, achievement in Mathematics is lower than the other countries, suggesting a diminishing return with regard to the South African education spend. In addition, participation in pre-primary education is lower than other countries, and recent research points to the importance of good foundational skills for future successes.
PROFILE OF THE UNIVERSITY AND TVET SECTORSThe main institutions offering post-school qualification programmes are the Higher Education Institutions (HEIs) (public and private)24, public Technical and Vocational Education and Training (TVET) colleges, and private Further Education and Training (FET) colleges. A key challenge of the post-school education and training sector is to find ways to accommodate students with poor schooling outcomes, especially poor performance in secondary school Mathematics, languages and Science.
Figure 4.1: Number and percentage of learners achieving matriculation with a bachelor’s pass and Mathematics passes at higher than 50% from 2010 to 2014
0
50 000
100 000
150 000
200 000
2011 2013 20142010
Num
ber o
f Gr1
2 st
uden
t pas
ses
2012
N Bachelor passes N Math>50% % Bachelor passes % Math>50%
0
5
10
15
20
25
30
35
% passes
2010 2011 2012 2013 2014
126 371 120 767 136 047 171 755 150 752
50 195 41 586 51 231 63 151 50 365
24 24 27 31 2819 19 23 26 22
Source: Author’s calculation from DBE National Senior Certificate Technical Report 2014
Table 4.1: Comparative country performance education statistics23
Gross enrolment ratio: 2013Mathematics achievement
scoresEducation
expenditure
Pre-primary Primary Secondary PISA 2012 TIMSS 2011 % GDP
Brazil No data 95%# 75-79%# 391 Did not participate
6.3% (2012)
Malaysia 84* No data 71* 421 440 5.9% (2011)South Africa 76 101 111 Did not
participate352 6.3% (2013)
Thailand 119 96 86 427 427 4.9% (2012)Vietnam 82 105 No data 511 Did not
participate6.3% (2012)
Note 1 (*): Most Recent Value (MRV) if data for the specified year or full period is not available.Note 2 (#): The only data available is for Net Enrolment Ratios for the period 2008 to 2013.
Source: DBE (2014), UNICEF (2013), World Bank (2015)
23 Gross enrolment ratio: ratio of total enrolment, regardless of age, to the population of the age group that officially corresponds to the level of education shown. PISA is a worldwide study by the OECD in member and non-member nations of 15-year-old school learners’ scholastic performance in Mathematics, Science, and reading – mean score set at 500. The TIMSS is an international study which measures the performance at grade 8 or 9 level and sets the mean score at 500.
24 These are differentiated into traditional, comprehensive and Universities of Technology (UoTs).
The low quality of Mathematics performance throughout the education system results in a low number of high-quality Mathematics passes in the matriculation examination. This is the pool of school leavers who could access the Science, Engineering, and Technology and Health-related tertiary level courses.

Skills supply in South Africa
48 Skills supply and demand in South Africa
In 201325, the university sector comprised 23 public universities and 113 private universities, with 85% of all Higher Education students enrolled in public universities (DHET, 2016). The TVET sector is comprised of 50 public and 296 private institutions26, with 80% of all TVET students enrolled in public institutions. The Higher Education sector has an established data and information system (HEMIS), but the TVET data and information system is in a fledgling state, therefore the quality and integrity of the data is being improved. The data on private education and training institutions is incomplete and being consolidated, and must therefore be treated cautiously. The enrolments at public and private universities and TVET colleges for the 2010 to 2014 period are presented in Table 4.2.
From 2010 to 2014, enrolments have increased in both universities and TVET colleges. Public university enrolments increased by 8.5% during this period. The National Development Plan (NDP)is to enrol 1.6 million students in public Higher Education Institutions (HEIs) by 2030 and, with the current trend (provided that the schooling system provides university eligible school completers) this target is on track to be met. The TVET sector enrolments have fast expanded from 2010 to 2014, with enrolments at public TVET colleges doubling. The enrolment target in public TVET colleges is 1 million by 2016 and 2.5 million in 2030 NDP.
Figure 4.2 compares the enrolment patterns in the University and TVET sector for the period from 2010 to 2014. The increased share of the TVET sector reflects the state’s investment in education and training at intermediate and technical levels.
A key indicator to track the transformation in the post-school education and training is reached by analysing enrolment by gender and population group. As shown in Table 4.3, in the last four years, female students constituted 58% of the shares of university enrolments; additionally, in the TVET sector, shares of female enrolments have been increasing, and since 2013 have surpassed male enrolments, reaching 54% in 2014 (Table 4.3).
Africans recorded the highest enrolment figures at universities and TVET colleges, with increases in the shares every year from 2010 to 2014. The 2014 statistics show that around 70% of the university enrolments are African, 17% are White, 6.3% are Coloured and 5.5% are Indian/Asian. The TVET sector is made up of 84% African, 6% Coloured, 2% White and 0.5% Indian/Asian28.
TVET COLLEGES: COURSES, QUALIFICATIONS AND SKILLSPublic TVET and private FET colleges offer a number of qualification types: certificates, diplomas, and short courses. The qualification types that lead to a certificate are the National Certificate Vocational (NCV) and NATED Report 191 N1-3 courses29. It is difficult to provide definitive headcount figures for all courses and programmes offered at TVET colleges as there are many types of programmes, short courses, qualifications, and routes to qualifications, as well as part-time and full-time students. The TVET information systems are being consolidated, and as the data improves we could provide more nuance and detail to this curriculum information. Table 4.4 describes the enrolments by different vocational qualification types for public TVET and private FET colleges for the period 2011 to 2014.
The enrolments in public TVET colleges are significantly higher than enrolments at private FET colleges. In line with the resistance to the NCV courses and demand for the National Accredited Technical Education Diploma (NATED) courses (Nzimande, 2011), the enrolments for NATED 1 to 6 courses have increased by 187% in public TVET colleges between 2010 and 2014, and these enrolments constitute the highest shares (69% in 2014) of all enrolments. Data for 2012 and 2013 shows that two thirds of all NATED enrolments are for courses at the N4 to N6 levels, and just over 40% of all public TVET enrolments are for courses at NQF level 5 and 6 (N4 to N6). This means that 40% of TVET enrolments are categorised as being above NQF level 4.
25 Two new universities, Sol Plaatjie University and University of Mpumalanga, with small enrolments started in 2015.26 The colleges offer a range of qualifications from Engineering, to Business, to Nursing, to skills for a company. For more information, see:
http://www.dhet.gov.za/Registers_DocLib/Register%20of%20Private%20Colleges%20(0 1%20October%202015).pdf28 The racial profile of the South African population in 2014 was: 80% African, 9% Coloured, 2.5% Indian/Asian and 8.5% White.29 The minimum requirement for admission to the NCV and N1 programmes is grade 9, and for N4-6 grade 12, NCV courses are offered in the
Engineering, Business and Services subject areas. The NATED 1 to 6 courses are offered in Engineering areas only. At the end of N3, a student completes with a certificate in Engineering (NQF level 4). They could then progress to N4 courses, N4 to N6 courses are largely in Business and Services subject areas, with a few Engineering programmes offered. Upon completion of the N6 programme, which includes work place-based learning, a student qualifies with a diploma (NQF level 5).
Figure 4.2: Changing enrolment patterns in the University and TVET sector, 2010 to 2014
2010 2011
Universities
2012 2013 2014
TVET College
0
20
40
60
80
100
(%)
2010 2011 2012 2013 2014
71.4 70.1 59.2 60.6 58
28.6 29.9 40.8 39.4 42
Source: Author’s calculations from DHET (2016)
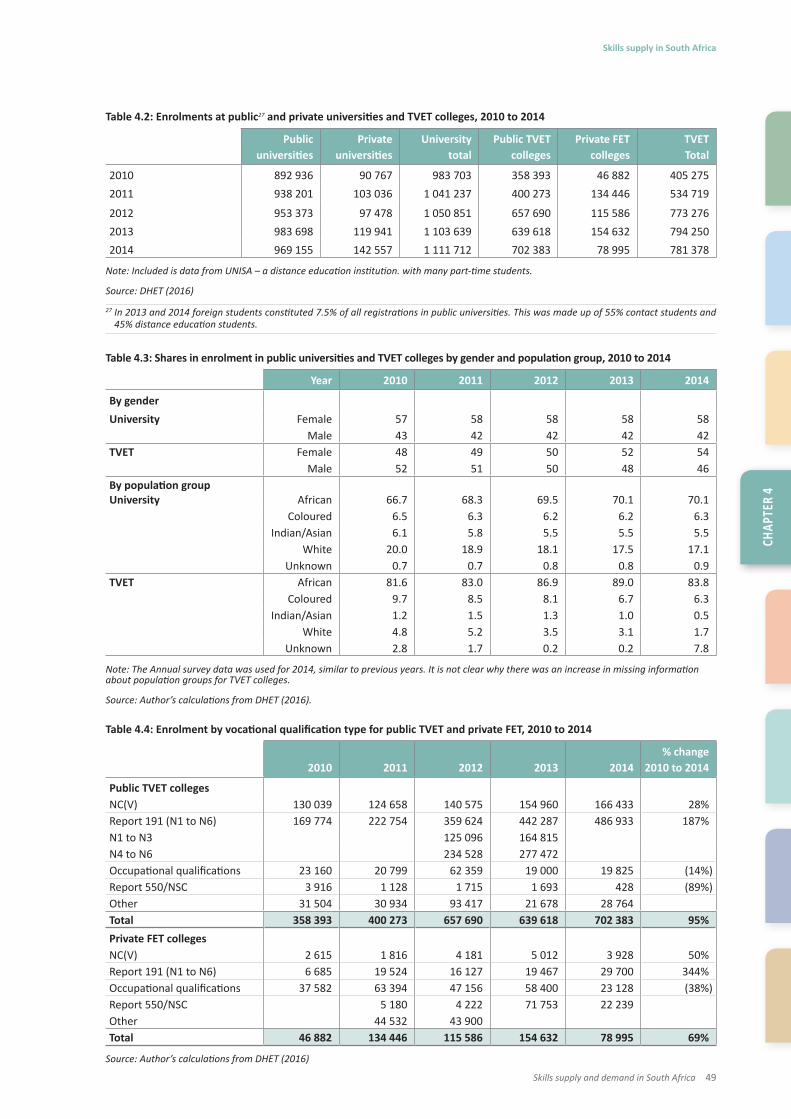
Skills supply in South Africa
Skills supply and demand in South Africa 49
CHAP
TER
4
Table 4.2: Enrolments at public27 and private universities and TVET colleges, 2010 to 2014
Public universities
Private universities
University total
Public TVET colleges
Private FETcolleges
TVET Total
2010 892 936 90 767 983 703 358 393 46 882 405 2752011 938 201 103 036 1 041 237 400 273 134 446 534 719
2012 953 373 97 478 1 050 851 657 690 115 586 773 2762013 983 698 119 941 1 103 639 639 618 154 632 794 2502014 969 155 142 557 1 111 712 702 383 78 995 781 378
Note: Included is data from UNISA – a distance education institution. with many part-time students.
Source: DHET (2016)
27 In 2013 and 2014 foreign students constituted 7.5% of all registrations in public universities. This was made up of 55% contact students and 45% distance education students.
Table 4.3: Shares in enrolment in public universities and TVET colleges by gender and population group, 2010 to 2014
Year 2010 2011 2012 2013 2014
By genderUniversity Female 57 58 58 58 58
Male 43 42 42 42 42TVET Female 48 49 50 52 54
Male 52 51 50 48 46By population groupUniversity African 66.7 68.3 69.5 70.1 70.1
Coloured 6.5 6.3 6.2 6.2 6.3Indian/Asian 6.1 5.8 5.5 5.5 5.5
White 20.0 18.9 18.1 17.5 17.1Unknown 0.7 0.7 0.8 0.8 0.9
TVET African 81.6 83.0 86.9 89.0 83.8Coloured 9.7 8.5 8.1 6.7 6.3
Indian/Asian 1.2 1.5 1.3 1.0 0.5White 4.8 5.2 3.5 3.1 1.7
Unknown 2.8 1.7 0.2 0.2 7.8
Note: The Annual survey data was used for 2014, similar to previous years. It is not clear why there was an increase in missing information about population groups for TVET colleges.
Source: Author’s calculations from DHET (2016).
Table 4.4: Enrolment by vocational qualification type for public TVET and private FET, 2010 to 2014
2010 2011 2012 2013 2014% change
2010 to 2014
Public TVET collegesNC(V) 130 039 124 658 140 575 154 960 166 433 28%Report 191 (N1 to N6) 169 774 222 754 359 624 442 287 486 933 187%N1 to N3 125 096 164 815N4 to N6 234 528 277 472Occupational qualifications 23 160 20 799 62 359 19 000 19 825 (14%)Report 550/NSC 3 916 1 128 1 715 1 693 428 (89%)Other 31 504 30 934 93 417 21 678 28 764Total 358 393 400 273 657 690 639 618 702 383 95%Private FET colleges NC(V) 2 615 1 816 4 181 5 012 3 928 50%Report 191 (N1 to N6) 6 685 19 524 16 127 19 467 29 700 344%Occupational qualifications 37 582 63 394 47 156 58 400 23 128 (38%)Report 550/NSC 5 180 4 222 71 753 22 239Other 44 532 43 900Total 46 882 134 446 115 586 154 632 78 995 69%
Source: Author’s calculations from DHET (2016)

Skills supply in South Africa
50 Skills supply and demand in South Africa
Many TVET students enrol for a course that leads to an NQF level 4 qualification (matric equivalent). Anecdotal and past research evidence shows that students enter these qualification routes after completing a matriculation examination and thus following a “zig-zag”, rather than a linear educational trajectory (Kruss et al, 2012).
In private FET colleges, occupational (38% in 2013) and the mix of “other” qualifications constitute the highest share of enrolments. Private FETs have higher numbers of students registering for occupational qualifications than public TVETs.
Just over 90% of students who register for TVET programmes remain in the programme for the year and sit for the year-end examination. It is an encouraging signal that there is a high retention level of students in the TVET system. The concern is that, of all students who wrote the certificate examinations, only 40% of those in public institutions and 33% in private institutions pass all subjects in the year to gain their relevant certificate (DHET, 2016). In Table 4.5 we examine the patterns of enrolments in examinations and completion rates in the NCV 4 and NATED 6 programmes (leading to a
certificate and diploma respectively). We have categorised the programmes into the following disciplines: Engineering, Services and Business, the focuses of the TVET sector30.
From 2010 to 2014 there was a general increase in the numbers of students writing the NCV 4 and NATED 6 Engineering study field examinations. However, only one in four students who sat for the examination was successful in completing the NCV 4 qualification, and one in two students who sat for the examination was successful in completing the NATED 6 qualifications.
Participation in the Services study field for both NCV 4 and NATED 6 has increased from 2010 to 2014, and completion rates are between 40% and 60% in most courses, apart from the Transport and Logistics course and the Public Relations course. Participation in the Business Studies courses is high and increasing, especially in the NATED 6 programmes, but completion rates for most courses are disappointing at less than 40%.
While pass rates have been improving since 2010, this analysis underscores the fact that many students who have registered for courses and participated
in the year programme have not been successful in completing the courses. The TVET sector has successfully improved access, but now it is critical to improve the quality of the TVET experience and pass rate for these courses so that students complete and receive their certificates and diplomas.
UNIVERSITIES: ENROLMENTS, QUALIFICATIONS, AND SKILLSThe National Plan for Higher Education (2001) recommended that enrolments in fields of study at universities should comprise 40% Humanities, 30% Business and Commerce, and 30% Science, Technology and Engineering (SET)31. The potential skills gain for the labour market from university enrolments and completers is best understood through an analysis of the Classification of Educational Subject Matter (CESM) field of the qualification. The traditional categorisation of the CESM fields is Business, Science, Engineering and Technology, and Humanities. For the purposes of skills planning, we have further categorised the SET field into Science and Technology, Engineering and Health Sciences. We have also
Table 4.5: Examination enrolments and completions in NCV4 and NATED 6 programmes in public TVET colleges, 2010, 2013, 2014
2010 2013 2014 2010 2013 2014
Number writing exams
Numbercompleted
Numberwriting exams
Number completed
Number writing exams
Number completed
% completed
% completed
%completed
NC(V) Level 4 programmes: NQF level 4Engineering 4 207 1 060 8 187 2 099 7 559 1 628 25.2 25.6 21.5Services 1 285 662 3 451 1 750 4 107 1 953 52 51 48Business 4 084 1 894 9 743 4 110 9 799 3 824 46 42 39N6 Programmes: NQF Level 6Engineering 18 642 8 611 15 928 7 925 46 49.8Services 2 226 786 4 628 2 367 35 57Business 21 722 5 737 36 053 13 886 26 39
Source: Author’s calculations from HEMIS (2010 to 2014) and National Examinations Database (November 2013)
30 See Appendices 1 and 2 for the details relating to specific courses.31 Pre-2001, the university enrolments were 49% in the field of Humanities and Social Sciences, 26% in Business and Commerce, and 25% in SET.

Skills supply in South Africa
Skills supply and demand in South Africa 51
CHAP
TER
4
disaggregated the Humanities field into Arts, Education, and Other Humanities and Social Sciences. The enrolment patterns by CESM fields of study from 2010 to 2014 are provided in Table 4.632.
Over the last five years (2010 to 2014), the share of enrolments for the CESM Humanities category increased from 41% to 42.3%; the Business, Economics and Management Studies share decreased slightly from 31.2% to 28.1%; additionally, enrolments in Education held a noteworthy share of the total enrolments (17.1% in 2014). The SET enrolment share (key skills to support the growth of the economy) increased from 28% in 2010 to 29.6% in 2014. Within the broad SET category, the enrolments in Engineering (both at UoTs and traditional universities) grew from approximately 71 000 in 2010 to 82 500 in 2014 (a 16% increase); enrolments in the Science subjects grew from approximately 130 000 to 159 000 (a 22% increase); and the Health and Health-related subjects grew from 51 000 to 56 000 (an 11% increase). This shift towards higher
numbers and shares in the SET subject areas is a move in the right direction, as these skills are key to supporting economic growth.
While South Africa has improved the access to and enrolment rates at universities, it has not done as well with regard to the progression of students and completion of the relevant qualifications. This is well documented in the Council on Higher Education’s (2013) Report of the Task Team on Undergraduate Curriculum Structure. The report found that one in four students in contact institutions graduate in regulation time. Completion rates are especially low in Engineering and Science degrees and diplomas, as well as the Professional Commerce degrees, all of which have particular significance for economic development.
The completion rates for these qualifications are as follows: Bachelor of Engineering 23%. Bachelor of Science 23%. Engineering diplomas 5%. Science diplomas 14%. and four-year Commerce degrees 26%33.
Table 4.6: Total enrolment in universities by type of CESM field of study, 2010 to 2014
Numbers Shares
CESM FIELDS 2010 2011 2012 2013 2014 2010 2011 2012 2013 2014
BUSINESS. ECONOMICS AND MANAGEMENT STUDIES 278 843 288 487 282 299 279 954 272 409 31.2 30.8 29.6 28.5 28.1SCIENCE. ENGINEERINGAND TECHNOLOGY 251 334 264 447 273 279 283 622 287 221 28.0 28.0 28.0 29.0 29.6Science 129 545 135 826 140 517 146 325 158 742 14.5 14.4 14.7 14.9 16.3Engineering 71 172 77 150 78 128 81 336 82 433 8.0 8.2 8.2 8.3 8.5Health Professions and Related Clinical Sciences 50 614 51 468 54 635 55 962 56 074 5.7 5.5 5.7 5.7 5.8HUMANITIES 362 749 385 266 397 792 420 122 409 525 41 41 42 43 42.3Visual and Performing Arts 12 669 13 571 13 375 13 510 13 573 1.4 1.4 1.4 1.4 1.4Education 145 413 164 939 168 608 172 991 166 099 16.3 17.6 17.7 17.6 17.1Other Humanities and Social Sciences 204 662 206 739 215 797 233 622 229 853 22.9 22.0 22.6 23.7 23.7Total 892 936 938 201 953 373 983 698 969 155 100 100 100 100 100
Source: Author’s calculations from HEMIS (2010 to 2014)
32 See Appendix 3 for the details relating to specific courses. 33 The analysis in the CHE report was based on detailed longitudinal cohort studies data of all first-time entering students in the 2005 and 2006
intakes into all three- and four-year degree and diploma programmes. The completion rate applied in the CHE (2013) report refers to the (Cohort) completion rate, which is the percentage of a given student intake, or cohort, that graduates (a longitudinal measure).
Access to schools, universities and TVET colleges has improved. However, quality remains elusive, leading to low progression through programmes in all types of educational institutions, as well as low completion rates from schools, TVET colleges and universities.

Skills supply in South Africa
52 Skills supply and demand in South Africa
Table 4.7 analyses the trends from 2010 to 2014 of students who fulfilled the requirements for a degree or diploma according to the CESM field of study34..
Just over 153 000 individuals graduated with diplomas or degrees from South African universities in 2010. This number increased to just over 185 000 in 2014 i.e. a 21% increase (Figure 4.3). In 2014, the Business, Economics, and Management Sciences graduates contributed 27.2% to the shares of university completers; the SET completers constituted 30% of the shares, and the Humanities completers accounted for 42.8% of the shares (Education made up 20% of these shares).
From 2010 to 2014, the number of university students completing Engineering qualifications increased by 39%, Health Science completers increased by 12%, and Computer and Information Sciences completers increased by 43%. This growth is commendable, however, as we are starting from a low base there is a still a way to go in order for the supply to meet the demand in these critical subject areas.
Table 4.7: Number (and shares) of students who fulfilled the requirements for a degree or diploma according to CESM field of study, 2010 to 2014
Numbers Shares
CESM field of study 2010 2011 2012 2013 2014 2010 2011 2012 2013 2014
BUSINESS, ECONOMICS AND MANAGEMENT STUDIES 41 657 44 155 46 044 49 051 50 381 27.2 27.5 27.7 27.1 27.2SCIENCE, ENGINEERINGAND TECHNOLOGY 42 760 46 100 48 848 53 176 55 574 27.9 28.7 29.4 29.4 30.0Science 21 356 23 282 25 196 27 525 28 931 14.0 14.5 15.1 15.2 15.6Engineering 10 200 11 084 11 696 13 284 14 077 6.7 6.9 7.0 7.3 7.6Health-related Professions 11 201 11 733 11 958 12 368 12 567 7.3 7.3 7.2 6.8 6.8HUMANITIES 68 908 70 363 71 096 78 596 79 420 44.9 43.8 42.8 43.5 42.8Arts 2 867 2 908 3 154 3 042 3 098 1.9 1.8 1.9 1.7 1.7Education 37 892 37 879 35 478 38 212 37 076 24.7 23.6 21.4 21.1 20.0Other Humanities and Social Sciences 28 149 29 574 32 463 37 342 39 247 18.4 18.1 19.6 20.7 21.2Total 153 325 160 623 165 986 180 823 185 385 100 100 100 100 100
Source: Author’s calculations from HEMIS (2010 to 2014)
Figure 4.3: University completers in 2010 and 2014 by CESM category
0
50 000
100 000
150 000
200 000
National Business, Economic,
ManagementStudies
Humanities
2010 2014
Science,Engineering,Technology
NationalBusiness, Economic,
Management StudiesScience, Engineering,
Technology Humanities
153 322 41 655 42 757 68 908
185 394 50 380 55 574 79 749
Source: Author’s calculations from HEMIS (2010 and 2014)
34 See Appendix 4 for the details relating to specific courses.

Skills supply in South Africa
Skills supply and demand in South Africa 53
CHAP
TER
4
ENROLMENTS AND UNIVERSITY COMPLETION BY GENDER AND RACEIn this section, we examine the enrolment and completion rates by gender, Figure 4.4 illustrates the difference between enrolment rates and completion rates for males and females.
In these 20 CESM categories, male enrolments and graduations are higher in the study fields of Architecture and the Built Environment; Computer and Information Sciences; Engineering, Mathematics and Statistics; Philosophy, Religion and Theology; and Military Sciences, Female enrolments and graduations are higher in Visual
Figure 4.4: Gender difference in university enrolment and completions by type of CESM field of study, 2014
Source: Author’s calculation from HEMIS (2014)
and Performing Arts; Business-related studies; Communication and Journalism; Education, Health and Health-related professions; Languages and Linguistics; Life Sciences; Psychology; and the Social Sciences. One of the key findings from this part of the analysis is that qualification differences support gender stereotypes in the literature, in that males are likely to study for Technical, Science, Technology and Engineering-based subjects, whereas females are focused on humanities subjects, such as Health, Education and Social Sciences. Thus, a reformed skills policy must focus on re-ordering this gender bias in relation to particular Higher Education outcomes.
While the shares of female students in both the university and TVET sectors have increased, there are still gender differences in the fields of qualification.
Agriculture, Agricultural Operations and Related Sciences
Architecture and the Built Environment
Visual and Performing Arts
Business, Economics and Management Studies
Communication, Journalism and Related Studies
Computer and Information Sciences
Education
Engineering
Health Professions and Related Clinical Sciences
Family Ecology and Consumer Sciences
Languages, Linguistics and Literature
Law
Life Sciences
Physical Sciences
Mathematics and Statistics
Military Sciences
Philosophy, Religion and Theology
Psychology
Public Management and Services
Social Sciences
Total
Enrolment Graduates
100 80 60 40 20 0 20 40 8060
Male Female
Percent (%)

Skills supply in South Africa
54 Skills supply and demand in South Africa
In this section, we examine the enrolment and completion rates by race categories, as illustrated in Figure 4.5.
Each of the racial groups are enrolled in different CESM categories. Relative to the size of a particular racial group, the enrolments are higher for the White and Indian/Asian groups. Similarly, the completion levels are higher for the White and Indian/Asian groups.
SETA-SUPPORTED LEARNING PROGRAMMES The Sector Education and Training Authorities (SETAs) have the mandate to provide workplace training to those who are in employment, and to offer training to the unemployed. This section uses the data collated by the Department of Higher Education and Training on the number of workers and unemployed persons who are registered in SETA-supported learning programmes. In Table 4.8 we report
on learnerships35, artisanal learning programmes36, and skills programmes37 (Kruss et al, 2012).
The number of learnership registrations has increased from close to 50 000 in 2010 to just over 77 000 in 2014 (an increase of 54%). The participants in learnership programmes are both workers and the unemployed, and a higher proportion of learnerships are awarded to the unemployed. The number of skills programme registrations doubled from 66 000 in 2010 to 138 000 in 2014, and the majority of the participants are workers. There is a smaller number of artisanal learning programme registrations, however, this increased from around 24 000 in 2011 to 28 000 in 2014. Over this time period, the certification rates for learnerships increased from 50% to 73%; artisanal learning programmes increased from 50% to 70%; and for skills programmes certification rates were very high at over 100%.
The total number of workers and the unemployed people participating in SETA-supported programmes is low when considering the educational level of the labour force. Given that close to half of the employed do not have grade 12 (matric) certificates, workplaces should be offering general training to raise the education and skill level, as well as specialised training related to particular work tasks. Analysis of the figures provided in the statistics on post-school education and training in South Africa documents shows that in 2010, 0.74% of the unemployed population attended SETA-supported learning programmes. Participation rose to 1.6% of the unemployed population in 2014. Furthermore, with high levels of youth unemployment, where the majority have only either incomplete or completed secondary education, there is a strong argument for SETAs to facilitate the increase of skills training efforts to the unemployed in general and specifically the unemployed youth.
35 Learnerships refer to a learning programme that leads to an occupational qualification or semi-qualification and includes apprenticeships and cadetships.
36 An artisanal learning programmes include apprenticeships, learnerships, internships, cadetships or other programmes undertaken at the workplace in preparation of an occupation that is on the official list of artisan occupations.
37 Skills programmes refer to a semi-qualification as defined in the National Qualifications Framework (NQF) Act, 2008 (Act No 67 of 2008).
Figure 4.5: University enrolment and completions by CESM categories and population group, 2014
0
50 000
100 000
150 000
200 000
250 000
300 000En
rolm
ents
Gra
duat
es
Business, Economics and Management
Studies
Science Engineering Health Related
Professions
Arts Education Other Humanities
and Social Sciences
Enro
lmen
ts
Gra
duat
es
Enro
lmen
ts
Gra
duat
es
Enro
lmen
ts
Gra
duat
es
Enro
lmen
ts
Gra
duat
es
Enro
lmen
ts
Gra
duat
es
Enro
lmen
ts
Gra
duat
es
African Coloured Indian/Asian White
Source: Author’s calculations from HEMIS (2014)

Skills supply in South Africa
Skills supply and demand in South Africa 55
CHAP
TER
4
Table 4.8: Number of workers and unemployed persons registered for and certificated in SETA-supported learning programmes. by programme type, from 2010/11 to 2014/15
REGISTERED CERTIFICATED
YEARLearner-
ships
Artisanal learning
programmeSkills
programme Learnerships
Artisanal learning
programmeSkills
programme38
2010/11 47 649 9 316 66 133 30 864 (65%) 3 432 (37%) 75 531
2010/11 Workers 19 308 1 661 10 361 518
2010/2010 Unemployed 24 261 7 655 18 047 2 914
2011/12 43 871 24 415 87 906 29 197 (67%) 14 023 (58%) 87 527
2011/12 Workers 16 371 71 656 9 646 71 417
2011/2012 Unemployed 27 679 16 250 19 524 16 110
2012/13 50 885 21 849 74 587 37 158 (73%) 15 277 (70%) 86 491
2012/13 Workers 20 678 64 105 14 399 68 173
2012/2013 Unemployed 30 207 10 482 22 759 18 318
2013/14 75 782 26 670 92 508 38 796 (52%) 18 110 (68%) 109 547
2013/14 Workers 29 614 74 107 14 923 90 694
2013/2014 Unemployed 45 742 18 363 23 823 18 787
2014/15 77 931 28 302 137 880 40 891 (52%) 14 389 (51%) 106 459 (77%)
2014/15 Workers 29 100 105 305 18 685 (64%) 82 536 (78%)
2014/2015 Unemployed 48 831 32 575 22 206 (45%) 23 923 (73%)
Source: Author’s calculation from DHET. 2016
38 Completion numbers are higher than registrations, probably because some programmes continue to the subsequent year, and are only counted in the year of completion.
In 2010, 0.74% of the unemployed attended SETA supported training programmes. This doubled to 1.6% in 2014. Given the high levels of youth unemployment, where the majority have less than a secondary certificate, there is a strong argument for SETAs to facilitate skills training for the unemployed.
Skills supply in South Africa
56 Skills supply and demand in South Africa
CONCLUDING COMMENTS AND IMPLICATIONS FOR SKILLS PLANNINGThe purpose of this chapter is to identify the types of skills people acquire when they move through the education system and whether or not this corresponds to the needs of the current and future economy.
This analysis confirms findings from other studies that suggest that access to schools, universities, and TVET colleges has improved. However, quality remains elusive, leading to low progression through programmes in all educational institutions, as well as low completion rates from schools, TVET colleges, and universities. The key challenge is improving the quality of the educational experience in both school and post-school institutions, ideally leading to an improvement of the quality and quantity of completers. Thus, skills planning requires more than estimates of numbers needed, and must also include strategies to improve the quality and relevance of educational programmes.
The key constraint for the South African education and training system and labour market is the quality of basic education. The schooling system must improve the quality of the educational experience from the foundation phase of schooling, as well as achievement scores across a number of disciplines, particularly Languages, Mathematics and Science. Success in these subjects forms the basis for participation and success in technical subjects in post-school education and training institutions, and in the workplace. The skills planning process must involve the Department of Basic Education (DBE), and there needs to be a co-ordinated system-wide effort to improve the quality of teaching and learning of
Literacy and Languages, and Numeracy and Mathematics.
Currently there is a high number of secondary school non-completers. Most secondary school students follow the single academic pathway. Post-grade 9, the education system should offer a differentiated set of programmes and courses to meet the expectations and abilities of the students. At the moment, the combination of programmes available at TVET and community colleges is very complicated. Although these programmes are being reviewed and consolidated by the DBE and DHET, the results need to be clearly communicated to learners and their families, so that available options are well understood.
The university and TVET college sectors form a big part of the post-school education and training system, and since 2010 the TVET sector has been expanding at a much higher rate (average of 23% per annum) than the University sector, which has been expanding at an average of 2.1% per annum. The TVET sector has grown and the completers from this sector could provide useful skills sets to support the economic growth of South Africa.
While the education system has done well in increasing participation in universities and TVET colleges, it is equally important to interrogate the type and quantity of skills produced at these institutions. Most students remain in their courses and write examinations, but the success rate in examination is of concern. Only 40% of students who write the certificate examinations (NCV) pass to gain the relevant qualification. The NATED 6 programmes achieve higher success, with increased pass rates in the Engineering, Services, and Business fields of learning.
In the University sector, enrolments were guided by the National Plan for Higher Education (NPHE) broad targets of 30% for Business, Economics and Management Sciences; 30% for Science, Engineering and Technology; and 40% for Humanities (MoE, 2001). This may be the time to reconsider the NPHE targets and increase the shares of SET enrolments to 35%, especially in the areas of Engineering and Health Professions.
The TVET sector offers qualifications in the subject areas of Engineering, Business Studies and Services. Currently, there are no guidelines for enrolment targets for each of these study areas. In 2014, for the NATED6 programme, 57% of completers were from Business programmes and 32% were from Engineering programmes. The TVET sector should develop enrolment targets in line with skills needed for the labour market.
While we recognise that the data and information about registration and completions in SETA-supported learning programmes need to be improved, the analysis of the available data reveals that the number of participants in SETA-supported programmes is low. Given that half of the labour force has less than a grade 12 certificate, workplace-supported education and training would be an appropriate mechanism to enhance skills levels. Further, given the high levels of youth unemployment, with the majority having an incomplete secondary education. SETAs could facilitate the relevant occupational training programme to enhance the skills set of individuals to increase their access to the labour market. SETAs need to play a bigger role in skills development programmes for the employed and unemployed.

Skills supply in South Africa
Skills supply and demand in South Africa 57
CHAP
TER
4

58 Skills supply and demand in South Africa
5CHAPTER

Understanding demand through changes in the structure of employment
UNDERSTANDING DEMAND THROUGH CHANGES IN THE STRUCTURE OF EMPLOYMENT
Skills supply and demand in South Africa 59

Understanding demand through changes in the structure of employment
60 Skills supply and demand in South Africa
Chapter Two analysed the performance of the economy and the significant changes that have occurred over the past four years. The purpose of this chapter is to analyse changes occurring in the structure of the economy and these analyses then provide signals of demand for skills. At first, this chapter examines the employment and skills changes from 2010 to 2014 in the standard industrial sectors and occupations; secondly, how the government has initiated a number of growth projects to stimulate the economy, which we analysed to ascertain which skills are required to successfully implement these growth projects; thirdly, we report on employers’ perceptions of skills needed in their firms; and lastly we outline the analysis to identify the list of occupations in high demand. Together, this data helps us to build a picture of the demand for occupations and skills, and provides a signal to the education and training system on areas of supply to be prioritised.
EMPLOYMENT DISTRIBUTION BY INDUSTRIAL SECTOR In order to understand demand, it is necessary to look at changes within individual industrial sectors of the economy. Table 5.1 provides an overview of the structure of employment and the trends from 2010 to 2014.
The sectors that employed the largest numbers of people in South Africa in 2014 are as follows: Community, Social and Personal Services sector (23%); followed by the Wholesale and Retail sector (21%); and then the Financial Services sector (13%). In addition, the number of people working in the Community, Social and Personal Services sector over the 2010 to 2014 period increased by 773 400. Within the Financial Services and Wholesale and Retail Trade sectors, the number of workers increased by 378 300 and 276 100 respectively. The Electricity sector (1%) and the Mining sector (3%) employed the fewest number of workers.
The sectors that experienced the highest relative employment changes from 2010 to 2014 were the Mining and Quarrying sector (2.5%) and Electricity sector (1.9%). However, these are both
relatively small employment sectors. The sectors with the lowest relative employment change for the same period were Manufacturing (0.07%) and Agriculture (0.6%). Manufacturing is the fourth largest sector of employment, and thus needs to support the creation of new jobs to absorb new entrants to the labour market.
Figure 5.1 provides an analysis of the age profile of workers in each of the sectors. The majority of the workforce is between the ages of 25 and 44 years. The age analysis provides an understanding of sectors with higher ageing populations and thus a signal of workers with particular skills required to replace those who will be retiring in the near future. Almost all sectors have around 10% or less of the workers in the 55 to 64-year age group, and twice the number of workers in the 45 to 54-year-old age group. The Electricity, Gas and Water sector may be vulnerable to changes due to retirements, as 15% of the workforce is between the ages of 55 and 64 years and 17% are in the 45 to 54-year age group.
To understand the longer-term employment trends and the details of changes within each of the industrial sectors, further analysis is presented below.
Table 5. 1: Changes in employment by sector between 2010 and 2014 period
Shares of employment
in 2010 (%)
Absolutechanges:
2010 to 2014Percentage
change:
Relativeemployment
shift39
Shares of employment
in 2014
Agriculture, Hunting, Forestry and Fishing 5 61 068 9.4 0.6 5Mining and Quarrying 2 120 681 32.2 2.5 3Manufacturing 13 18 883 1.1 0.07 12Electricity, Gas and Water Supply 1 26 859 29.6 1.9 1Construction 8 190 250 17.8 1.1 8Wholesale and Retail Trade 22 276 113 9.3 0.6 21Transport, Storage and Communication 6 158 964 20.3 1.3 6Financial Intermediation, Insurance, Real Estate and Business 13 378 294 22.5 1.4 13Community, and Social and Personal Services 21 773 393 28.1 1.8 23Private households 9 87 702 7.6 0.5 8Nationally 100 2 092 574 15.8 100
Source: StatsSA (2014b)
39 This refers to how each sector shifts relative to the average and is calculated by percentage change of each sector divided by percentage change nationally.

Understanding demand through changes in the structure of employment
CHAP
TER
5
Skills supply and demand in South Africa 61
AGRICULTURE While the number of workers in the Agricultural sector has increased by 61 000 from 2010 to 2014, the shares of those employed in this sector has remained fairly stable at around 5%. This must be viewed against a longer-term picture, as the percentage of those working in this sector at the beginning of the century was around 15% of total employment. The falling share of employment in this sector has implications for South Africa’s status as a net food producer as well as employment opportunities for low-wage earners.
MINING AND QUARRYING The Mining and Quarrying sector contributes a significant amount to the country’s GDP, but its role in supporting employment is negligible. This sector is predominantly semi-skilled, and professionals and managers make up only 7% of those employed in the sector. Employment numbers for the 1990 to 2012 period show that the
number of workers in the Gold sector declined by 350 000 (DPRU, 2013). However, it is pleasing to note that the number of workers employed in the sector increased by 120 700 over the 2010 to 2014 period. The increase in employment in this sector has come from the slight expansion in coal and platinum production.
MANUFACTURINGThe growth of employment in the Manufacturing sector over the 2010 to 2014 period has remained fairly negligible, with an increase of only 18 900 employees. This sector contributes 12% of the country’s GDP and the changes in the numbers employed are relatively small, reflecting the capital-intensive nature of certain sub-sectors. The most capital-intensive sub-sectors are those which convert primary resources into semi-processed products. This covers steel, chemical and aluminium products, and due to these products’ technological economies of scale there are few
Figure 5.1: Shares of employment by age and sector, 2014
0
20
40
60
80
100
Agriculture, Hunting, Forestry
and Fishing
Mining and
Quarrying
Manufacturing Electricity,Gas and
Water Supply
Construction Wholesale and Retail
Trade
(%)
FinancialIntermediation,
Insurance, Real Estateand Busines
Community, Social and Personal Services
Transport, Storage
and Communication
15 to 24 year 25 to 34 year 35 to 44 year 45 to 54 year 55 to 64 year
Private households
Agriculture, Hunting,
Forestry and Fishing
Mining and Quarrying
Manu-facturing
Electricity, Gas and
Water SupplyConstruc-
tion
Wholesale and Retail
Trade
Transport, Storage and
Communication
Financial Intermediation, Insurance, Real
Estate and Business
Community, Social and Personal services
Private households
12.0 3.8 8.1 4.3 8.8 13.4 7.3 8.3 5.4 4.2
31.1 34.1 30.7 37.0 36.3 34.7 33.4 36.1 26.5 22.5
27.2 29.3 31.9 27.0 29.1 28.6 31.1 32.2 33.1 32.1
20.7 24.4 20.4 17.0 17.2 16.3 18.2 16.5 24.2 28.9
9.0 8.4 8.8 14.7 8.7 7.1 10.0 6.9 10.8 12.2
Source: StatsSA (2014b)
incentives to expand employment. In contrast, potential employment opportunities can be found in the Clothing and Footwear sub-sectors. However, these are not likely to expand due to competition from lower cost producers in the Far East (Zalk, 2014). The sub-sector with perhaps more potential for employment growth is Automotive. This sub-sector has been given momentum by the government’s Automotive Production Development Programme (APDP) which aims to increase employment, and expand automotive production to 1.2 million vehicles by 2020 (DTI, 2015). It is hoped that this will be achieved by a combination of inward investment and an expansion in component suppliers. According to the DTI (2015), around 30 000 people are employed directly in the sector, and a further 80 000 employed by suppliers. However, these numbers are not large enough to respond to the job needs, and the sector has also been subject to recent

Understanding demand through changes in the structure of employment
62 Skills supply and demand in South Africa
industrial disputes, raising questions about whether the domestic purchasing power is enough to drive such an expansion, all of which will directly influence employment levels. Thus the flat-lining of the Manufacturing sector is part of a broader structural growth problem for the South African economy.
ELECTRICITY, GAS AND WATER SUPPLYEmployment levels in the Electricity, Gas and Water Supply sector represent a small percentage (1%) of the country’s total employment, but numbers employed in this sector have increased by nearly 30% over the 2010 to 2014 period. The overwhelming majority of workers in the sector are employed in the generation and distribution of electricity (83%), followed by collection, purification and distribution of water (12%), and manufacturing and distribution of gaseous fuels (5%).
Despite the small numbers employed in this sector, it makes a significant impact due to its importance to other sectors. There are two main employment issues affecting the sector, the first being a lack of technical skills and experience amongst those employed in the sector. A second employment issue, and one that could impact positively on future employment, is the move towards greener forms of energy. The Green Economy Accord signed in 2011, promised to create a minimum of 300 000 jobs in activities that contribute to greening the economy by 2020 (DED, 2011).
CONSTRUCTIONThe number of jobs in the Construction sector has grown by nearly 200 000 over the 2010 to 2014 period. The majority of these jobs are contract-based and temporary, and close to 90% of those employed are males. In contrast to other sectors, employment is cyclical in nature and the numbers employed will depend on the stages of the economic cycle. This means that employment is volatile, and significant numbers are working in the informal sector due to the contract nature of the work.
Like most other countries, the government and public sector are the key drivers of investment and
employment in the sector. The key government macro-strategies including the National Development Plan (NDP), the New Growth Path (NGP), Industrial Development Zones (IDZs), Strategic Integrated Projects (SIPs), and the Comprehensive Rural Development Programme (CRDP). These will have a positive impact on employment in the sector. Expenditure for the SIPs is estimated to be in the region of R4 trillion over the next 15 years, and the employment requirements have been identified by DHET (2015b). If the National Treasury is able to support this investment it could lead to job creation. However, the concern is that the public investment may not materialise due to a low-growth environment.
WHOLESALE AND RETAIL TRADEThe Wholesale and Retail sector is the second largest employer, at 21% of workers in all sectors in 2014, and numbers increased by 276 000 for the 2010 to 2014 period. The Wholesale and Retail sector is one of the most important employment sectors in South Africa. It is important to highlight that there is a growing informality in the sector, with 67% of people in formal employment and the remainder in informal employment. This sector is made up of 51% men and 49% women, with 6% of the workforce classified as “highly skilled” (DHET, 2014b).
Although the numbers employed in this sector are high, future growth prospects are uncertain. In part, this is due to lack of business confidence in the sector. Key factors in shaping business opinions have been the large-scale strikes in South Africa over the past few years, the contraction of the primary sector, and the dampening of consumer demand, all of which will influence employment levels in the sector.
On the positive side, the recent optimism in the global economy could have an impact on consumer demand in the sector. The potential for employment is also driven by a number of key retail chains which have established networks and branches in neighbouring countries. Prospects for future growth in the Retail sector across
the African continent are encouraging in that this will contribute towards the expansion of employment in the sector (AEO, 2015).
TRANSPORT, STORAGE AND COMMUNICATIONThe Transport, Storage and Communication sector is the seventh largest sector for employment in South Africa, with the sector increasing by 159 000 employees over the 2010 to 2014 period. There are two major sub-sectors, namely Transportation and Storage, and Communications.
The Transport and Storage sector employs around 774 000 people according to the Transport Education and Training Authority (TETA). In contrast to many other service sectors, this sector is dominated by males, with women representing only 20% of those working in the sector. This is also a relatively low-skilled sector, with around 55% workers categorised as having low-skilled occupations.
Communications, the third key sub-sector, employed around 143 000 people in 2010 according to the Information Technologies, Electronics, and Telecommunication Technologies (ISETT) SETA (ISETT-SETA, 2011). There is not much detailed analysis of this sub-sector, but it is expected that technological advancements in networking technologies will mean that more high-skilled workers are required in this sector.
FINANCIAL INTERMEDIATION, INSURANCE, REAL ESTATE AND BUSINESSThe Financial Intermediation, Insurance, Real Estate, and Business sector is the third largest source of employment in South Africa. The number of workers employed in this sector has grown by 378 000 over the 2010 to 2014 period. Within this sector there are two main sub-sectors generating most of the employment, each with different characteristics.
One of the key sub-sectors for employment is Finance, Real Estate, and Banking Services. According to the Finance and Accounting Services SETA (FASSET), the number employed in this sub-sector grew from around

Understanding demand through changes in the structure of employment
CHAP
TER
5
Skills supply and demand in South Africa 63
115 000 in 2010 to 135 000 in 2013 (FASSET, 2014). It is important to note that 92% of companies in the sector are small and medium-sized enterprises (SMEs), employing fewer than 50 people. Another important characteristic of this sector is the fact that 56% of those employed are women.
The second key sub-sector is Banking, The Banking SETA, BankSETA, estimates that for 2014, around 161 000 people were employed in the sector, 60% being women. What is equally significant is that around 50% of those in professional and managerial positions are women (BankSETA, 2013). The employment prospects for the Banking sector look stable. The sub-sector is strong by international standards, being ranked number two in the global competitiveness report out of 142 countries), and on the verge of expanding across the African sub-continent, all of which factors should be good for future employment prospects. Of concern is that many of those who are employed in the sector are employed through the temporary employment services, creating vulnerable jobs.
COMMUNITY, SOCIAL AND PERSONAL SERVICESMore people are employed in this sector than any other sector. The number of workers employed in this
sector increased by 773 400 over the 2010 to 2014 period, and represents the highest growth numbers of any sector in South Africa. This sector comprises a number of sub-sectors, including Public Administration, Defence, Compulsory Social Services, Education, Human Health, and Social Work. This Public sector-led employment creation is a concerning trend as it will not contribute directly to economic growth in the country.
TRENDS IN THE OCCUPATIONAL STRUCTURE IN THE LABOUR MARKET One of the key policy issues to understand is the way in which demand is impacting the occupational structure of the labour market, and what types of skills are needed. Changes in the occupational structure of the South African labour market between 2010 and 2014 are shown in Table 5.2. The most significant absolute change over the 2010 to 2014 period is the growth in the number of workers in elementary occupations by 572 10040, and service and sales workers (461 800), as well as managers and senior officials (276 000), craft and trade workers (223 000), and clerical support workers (210 200). This reflects the trend that the longer-term structural shift is towards
a service-orientated economy and low-skilled workers.
The largest percentage change and highest relative employment shift in the number of jobs was for managers and service and sales workers. Moreover, there were relatively small increases in the professional and technicians and associate professional categories, with a relative employment shift of 0.7 and 0.4 respectively. The interesting question would be whether the slow growth in these occupations is due to a lack of jobs, or a lack of workers.
Table 5.2: Changes in the occupational structure of the employed labour force between 2010 and 2014
Main occupation (OFO-1digit) 2010 2014Absolute
changePercentage
change
Relative employment
shift41
Managers and senior officials 1 087 645 1 363 640 275 995 25.4 1.6Professionals 1 225 579 1 363 185 137 606 11.2 0.7Technicians and associate professionals 999 443 1 067 497 68 054 6.8 0.4Clerical support workers 1 459 140 1 669 339 210 199 14.4 0.9Service and sales workers 1 881 146 2 342 970 461 824 24.6 1.6Skilled agricultural, forestry, fishery, craft and related trades workers 1 704 629 1 915 983 211 354 12.4 0.8Plant and machine operators and assemblers 1 120 966 1 275 800 154 834 13.8 0.9Elementary occupations 3 745 725 4 317 828 572 103 15.3 1.0Total 13 224 273 15 316 242 2 091 969 15.8
Source: StatsSA (2014b)
40 While these numbers are increasing, it is not enough to match the increase in the number of new entrants to the labour force who have low skills.
41 This is calculated by percentage change for an occupation divided by total percentage change.
The most significant absolute change over the 2010 to 2014 period is the growth in the number of workers in elementary occupations and service and sales workers. This reflects the trend that the longer-term structural shift is towards a service orientated economy.

Understanding demand through changes in the structure of employment
64 Skills supply and demand in South Africa
SPECIFIC CHANGES IN THE OCCUPATIONAL STRUCTURE OF THE EMPLOYED
More details of changes in occupational demand can be seen by investigating how the two-digit level occupations42 have grown over the 2010 to 2014 period. The 20 occupations that experienced the largest growth in employment numbers between 2010 and 2014 are shown in Table 5.3.
The 20 largest growth occupations consist of four each from occupations classified as elementary and those classified as service and sales workers, three from occupations for trades workers, and two each from the occupations classified as clerical support workers, plant operators, professionals and managers. There was one occupation in the associate professional category.
Skills associated with elementary occupations, plant operators, service and sales workers and clerical support workers can be developed relatively quickly. The occupations which are experiencing significant growth are as follows: administrative and commercial managers; production and specialised service managers; teaching professionals; business and administration professionals; science and engineering associate professionals; building and related trades workers; electrical and electronics trade workers; and metal, machinery, and related trades workers. Skills within these occupations take a while to develop and are signals for the direction of education and training priorities, assuming that the economy continues to develop as it did over the 2010 to 2014 period.
THE EMPLOYED BY SECTOR AND OCCUPATIONThe overall structure of employment in South Africa by sector and occupation is shown in Figure 5.2. The sector which employs the largest number of people is the Community, Social, and Personal Services (23% of jobs), and thus one in four jobs in the labour market is generated by the government. This is followed by jobs in the Wholesale and Retail sector (21% of jobs), and Financial Sector (13% of jobs). The Manufacturing sector accounts for one job in eight, and the Construction sector accounts for one job in 12.
The low-skilled elementary occupations, 28% of all jobs, employ the largest number of people in the labour force. The three higher-skilled occupational groups (managers, professionals,
Table 5.3: Changes in employment levels at two-digit level occupations between 2010 and 2014
Two-digit occupations 2010 2014Absolute
changePercentage
change
Administrative and commercial managers 633 603 919 162 285 559 45.1
Cleaners and helpers 1 508 682 1 755 956 247 274 16.4
Refuse workers and other elementary workers 115 337 270 070 154 733 134.2
Labourers in mining, construction, manufacturing and transport 775 318 927 480 152 162 19.6
Personal care workers 240 872 381 653 140 781 58.5
Protective services workers 673 565 799 875 126 310 18.8
Personal services workers 384 852 507 287 122 435 31.8
Drivers and mobile plant operators 695 824 816 102 120 278 17.3
Other clerical support workers 526 054 644 010 117 956 22.4
Agriculture, forestry and fishery labourers 799 149 900 189 101 040 12.6
Building and related trades workers 690 021 789 741 99 720 14.5
Sales workers 581 857 654 155 72 298 12.4
Electrical and electronics trades workers 226 709 295 351 68 642 30.3
Teaching professionals 582 672 649 943 67 271 11.5
Stationary plant and machine operators 391 538 438 567 47 029 16.7
Metal, machinery and related trades workers 403 625 450 124 46 499 11.5
Science and engineering associate professionals 250 103 291 804 41 701 16.7
Business and administration professionals 234 885 273 142 38 257 16.3
Numerical and material recording clerks 321 552 358 254 36 702 11.4
Production and specialised service managers 37324 73 210 35 886 96.1
Source: StatsSA (2014b)
42 The Organising Framework for Occupations (OFO) classifies occupations on the basis of skill level and skill specialisations.

Understanding demand through changes in the structure of employment
CHAP
TER
5
Skills supply and demand in South Africa 65
and associate professionals and technicians), together, account for one quarter of all jobs43. Managers and senior officials account for 8.8% of jobs, professionals 8.9% of jobs, and technicians and associate technicians 7% of all jobs. A further 12.5% of the employed work in skilled and related trades occupations. One quarter of all jobs are in the clerical support workers, and service and sales workers occupation – again signalling the growth of the Services sector.
The occupational profile for each of the sectors is different, with over 44%
of all jobs in the Community, Social, and Personal Services sector in the three higher-skilled occupations. In the Financial sector, 40% of all jobs are higher-skilled occupations. The majority of jobs in private households are for cleaners and helpers, one of the elementary occupations. Three quarters of the jobs in the Agriculture sector, a quarter in the Wholesale and Retail sector, and close to one fifth in the Mining and Quarrying, Manufacturing, and Construction sectors are for elementary occupations.
Figure 5.2: Employed population by main industry sector and occupation (000s), 2014
Clerical support workers Service and sales workers Skilled agricultural, forestry, fishery, craft and related trades Workers
0
500
1 000
1 500
2 000
2 500
3 000
3 500
Agriculture, Hunting, Forestry
and Fshing
Mining and
Quarrying
Manufacturing Electricity,Gas and
Water Supply
Construction Wholesale and Retail
Trade
FinancialIntermediation,
Insurance, Real Estate
and Business
Community, Social and Personal Services
Transport, Storage
and Communication
Managers Professionals Technicians and associate professionals
Private households
Plant and machine operators and assemblers Elementary occupations
Agriculture, Hunting,
Forestry and Fishing
Mining and Quarrying
Manu-facturing
Electricity, Gas and
Water SupplyConstruc-
tion
Wholesale and Retail
Trade
Transport, Storage and
Communication
Financial Intermediation, Insurance, real
Estate and Business
Community, Social and Personal Services
Private households
25 12 169 16 117 343 142 265 243 0
3 17 54 8 19 37 31 278 893 0
8 20 130 13 39 122 56 278 387 0
7 34 137 12 34 459 144 342 482 0
9 5 47 4 6 952 37 468 777 20
66 133 446 30 712 358 31 74 47 0
65 113 464 20 45 97 362 45 56 0
519 94 314 14 276 834 127 280 608 1 209
Source: StatsSA (2014b)
43 The comparative share in England is 44% (UKCES, 2010).

Understanding demand through changes in the structure of employment
66 Skills supply and demand in South Africa
CHANGES IN EDUCATIONAL LEVELS OF OCCUPATIONAL GROUPSSignificant trends in the labour market can be observed by examining differences in educational levels between occupational groupings over the 2010 to 2014 period. The changes in the educational skill levels in occupations between the years 2010 and 2014 are shown in Figures 5.3 and 5.444. At a general level, the data shows that for this period the educational skills level of occupations appears to be rising slightly. High-skilled workers increased by 1% from 16% to 17% from 2010 to 2014, and this is particularly noticeable for the technicians and associate professionals occupational category where the shares of high skills increased by 6% from 2010 to 2014.
Workers with intermediate skills in the workforce increased by 1% from 33% to 34%, and the most noticeable increases occurred for elementary workers, by 2%, for service and sales workers by 3%, and for plant and machine operators by 4%. Figure 5.4: Occupational structure and educational skill level in 2014
0 10 20 30 40 50 60 70 80 90 100
Low skills Intermediate skillsHigh skills Not indicated
Percent (%)
Elementary occupations
Plant and machine operators and assemblers
Skilled agricultural, forestry, fishery, craft and related trades workers
Service and sales workers
Clerical support workers
Technicians and associate professionals
Professionals
Managers
Elementary occupa-
tions
Plant and machine operators
and assemblers
Skilled agricultural,
forestry, fishery,
craft and related trades
workers
Service and sales workers
Clerical support workers
Technicians and
associate professionals
Profes-sionals
Man-agers
76.3 59.4 61.1 44.8 18.0 18.3 7.1 23.9
20.0 35.9 29.3 46.6 59.7 41.6 27.5 43.9
1.4 2.9 7.0 6.4 20.1 36.8 61.1 27.6
2.2 1.8 2.6 2.2 2.3 3.2 4.2 4.6
Source: StatsSA (2014b)
Figure 5.3: Occupational structure and educational skill level in 2010
Low skills Intermediate skillsHigh skills Not indicated
0 10 20 30 40 50 60 70 80 90 100Percent (%)
Elementary occupations
Plant and machine operators and assemblers
Skilled agricultural, forestry, fishery, craft and related trades workers
Service and sales workers
Clerical support workers
Technicians and associate professionals
Professionals
Managers
Elementary occupa-
tions
Plant and machine operators
and assemblers
Skilled agricultural,
forestry, fishery,
craft and related trades
workers
Service and sales workers
Clerical support workers
Technicians and
associate professionals
Profes-sionals
Man-agers
78.6 62.4 62.4 47.5 20.9 19.8 7.7 26.0
18.4 32.4 29 44.1 58.6 45.2 28.5 40.9
1.0 2.4 4.8 5.9 18.2 31.2 61.2 29.2
2.0 2.9 3.7 2.6 2.3 3.8 2.5 3.8
Source: StatsSA (2014b)
44 We defined “educational skill level” in relation to qualification. Low educational skills refer to those qualified at pre-matriculation NQF levels 1 to 3 or no schooling (less than level 1). Intermediate educational skill levels are those qualified at NQF levels 4 to 5, and high educational skills level refer to those qualified at NQF levels 6 to 10.

Understanding demand through changes in the structure of employment
CHAP
TER
5
Skills supply and demand in South Africa 67
Figure 5.5: Educational skill level of fastest-growing technical occupations, 201045
Low IntermediateHigh Not indicated
0 10 20 30 40 50 60 70 80 90 100Percent (%)
Electrical and electronics trades workers
Building and related trades workers
Metal, machinery and related trades workers
Science and engineering associate professionals
Teaching professionals
Business and administration professionals
Production and specialised services managers
Administrative and commercial managers
Electrical and
electronics trades
workers
Building and
related trades
workers
Metal, machinery
and related trades
workers
Science and
engineering associateprofes-sionals
Teaching profes-sionals
Business and
admini-stration profes-sionals
Production and
specialised services
managers
Admini-strative
and commercial managers
40 74 59 22 6 7 22 10
43 22 33 43 16 35 47 43
12 1 4 33 76 57 27 45
5 3 4 2 2 2 4 3
Source: StatsSA (2014b)
Figure 5.6: Educational skill level of fastest-growing technical occupations, 2014
0 10 20 30 40 50 60 70 80 90 100
Low IntermediateHigh Not indicated
Percent (%)
Electrical and electronic trades workers
Building and related trades workers
Metal, machinery and related trades workers
Science and engineering associate professionals
Teaching professionals
Business and administration professionals
Production and specialised services managers
Administrative and commercial managers
Electrical and
electronics trades
workers
Building and
related trades
workers
Metal, machinery
and related trades
workers
Science and
engineering associateprofes-sionals
Teaching profes-sionals
Business and
admini-stration profes-sionals
Production and
specialised services
managers
Admini-strative
and commercial managers
36 73 59 23 5 6 26 9
40 22 34 39 14 32 46 41
21 3 5 36 78 59 24 46
3 2 2 3 4 3 3 4
Source: StatsSA (2014b)
More details on the educational skill levels can be observed by reference to the skill levels within the 20 largest growing occupations, and how they have changed over the 2010 to 2014 period. From the list of 20 occupations, we focus on eight two-digit occupations that fall within OFO categories 1, 2, 3, and 6 (Figure 5.5 and 5.6). Skills for these occupations are developed at post-school education and training institutions.
The shares of high skills of both the business and administration professionals and teaching professionals increased between 2010 and 2014. The educational skills set of managers is lower than for professionals, and there were no significant changes in skills between 2010 and 2014. Surprisingly, less than half of the administrative and commercial managers, and only one quarter of production and specialised service managers, are categorised as having high skills. Appointment to senior level is likely due to experience and historical advantages. There have not been high levels of upskilling, measured through formal qualifications, in the categories of trades workers, except for the electrical and electronics trades where the shares of high skills rose from 12% in 2010 to 21% in 201446. The workers in the science and engineering associate professional category also experienced an increase in skills level from 2010 to 2014.
45 Annual data is derived by pooling together the four quarters of the QLFS and reported numbers are the averages for the year.
46 Issues for trades and artisanal workers may go beyond the supply and demand issues and three research projects in LMIP deal with these issues (Gamble, 2016; Mbatha et al, 2015; Wildschut et al, 2016).

Understanding demand through changes in the structure of employment
68 Skills supply and demand in South Africa
SKILLS TO SUPPORT GOVERNMENT GROWTH INITIATIVES In order to stimulate the economy and contribute to job creation, government has initiated a number of economic growth projects. We reviewed a number of government’s economic development policies to generate a broad estimate of the current and future skills demand of implementing key development strategies, including programmes that are specifically designed as job-creating projects (Kalina and Rogan, 2016). The review examined 27 major development strategy documents (see Appendix 5) from both the national and provincial governments, as well as the major metropolitan municipalities. Providing an indication of current and future skills needs for the growth projects was challenging in view of the fact that very few of the strategies provide assessments of the skill needs. Where plans do provide some indication of skills requirements, these largely exist in low-skill occupations, such as those required in the productive industries; or in high-skill applications, such as those demanded by SET industries or within the knowledge-based economy.
Overall, the signals from these plans provide a broad indication of the type of skills that would be required to implement government’s economic development policies. The following aggregated estimates provide an indication of possible skills requirements:
• The Medium-Term Strategic Framework provides a comprehensive indication of the skills required for their medium-term strategic plan. Its skills development plan provides targets for PhD graduates. Engineering and Science graduates, as well as Health, Natural, and Physical Science graduates. The plan identifies the need for 20 000 new teachers a year.
• The innovation and knowledge-based economy plan for the next 10 years has set a target for 3 000 PhDs in SET fields.
• The Industrial Policy Action Plan requires technical and high-level design skills for manufacturing, the plastics value chain, and broad-based skills within the saw-milling industry.
• The National Development Plan and the New Growth Plan point to the need for high, medium and low skills in the Services sector and manufacturing industry.
• The Department of Rural Development and Land Reform Strategic Plan requires skills in the areas of geomatics and spatial planning.
• The Square Kilometre Array telescope requires skills in the areas of planning, construction, installation of technical equipment, software development, maintenance, and astronomical research.
• Operation Phakisa expects to create up to 1 million new jobs within the “blue economy” by 2033. Skills required include highly skilled professional, such as oceanographers and marine biologists, as well as medium and low-skilled individuals within the Department of Environmental Affairs (DEA) and the Department of Agriculture, Forestry and Fisheries (DAFF) who can assist in monitoring, enforcement and compliance efforts, as well as participants who can be trained and employed by the DEA as field rangers.
• The Eastern Cape Provincial Plan will create the following high, medium, and low-skilled job opportunities: 113 000 jobs in agriculture, 166 000 in manufacturing, 149 000 in construction, 130 000 in tourism, 70 000 in the social economy, and 140 000 in knowledge-based services.
• The Western Cape Government Provincial Strategic Plan emphasises the importance of agriculture skills, with 100 000 planned jobs in agricultural processing and 60 000 high-skill jobs expected in the oil and gas exploration sector.
• The Limpopo Development Plan highlights skills needs in the areas of engineering, healthcare, social
development, and research and development.
• The eThekwini Economic Development and Job Creation Strategy and the Human Resource Development Strategy for South Africa (HRD-SA) 2010 to 2030, requires skills in the areas of construction, design, engineering, and manufacturing.
• The City of Cape Town Poverty Alleviation and Reduction Policy Strategy requires low-skill workers for the Expanded Public Works Programme.
Another key signal on skills requirements can be obtained through an analysis of the 18 Strategic Integrated Projects (SIPs). The SIPs are a key part of the government’s national infrastructure plan to transform the economic landscape, strengthen the delivery of basic services, and simultaneously create a significant number of new jobs47. The SIPs team has developed a methodology, and worked with stakeholders, to estimate the skills needs for the successful implementation of the SIPs, SIPs identified a total of 90 occupations (Appendix 6) where there are skills shortages, and of these, 35 occupations were in the Science, Technology, and Engineering fields.
The evidence of skills needs from the government growth plans and strategies is mixed, as it tends to confirm many of the findings at the national levels. These include a predominance of low-skill job opportunities in the future. These low-skill jobs should be accompanied by further and workplace training opportunities. At the same time, there is also a number of strong signals that must be considered, especially around the demand for STEM skills in higher-level occupations, the demand for teachers, and the increased demand for agricultural skills in the Western Cape. These findings point to another dimension, namely the significance of regional initiatives, the need to understand local demand for skills, and how skills shortages differ from region to region.
47 See: DHET (2015b)

Understanding demand through changes in the structure of employment
CHAP
TER
5
Skills supply and demand in South Africa 69
EMPLOYERS’ PERCEPTIONS OF SKILLS DEMANDS A key part of understanding the types of skills required by the economy is to examine employers’ perceptions. This is an important signal, since as employers are the ultimate recruiter of skilled labour and their perceptions provide a more fine-grained picture. The most comprehensive source of employer perspectives in South Africa can be obtained from the SETA’s PIVOTAL48 list. This list is compiled by SETA based on the information collated in the workplace skills plans received from employers, and from surveys of employers in their sector49.
We collated and analysed the PIVOTAL lists produced by each of the SETAs and
found that a total of 144 occupations were identified as being in demand. We counted the number of times each occupation was identified as being in demand. This data allowed us to identify the top 15 occupations perceived by employers as being in demand, and their relative importance in relation to each other (Figure 5.7).
Once again, this figure highlights the fact that managerial positions are perceived as an area where demand outstrips supply, especially for production and service managers, and administrative and commercial managers. The evidence also reveals that technicians and associate professionals are in high demand. This suggests that employers are finding it difficult to recruit for middle-level
occupations such as science and engineering associate professionals, health associate professionals, business and administration associate professionals, legal, social, cultural, and related associate professionals, and information and communications technicians.
The next occupational group identified as experiencing a shortage by employers is agriculture, forestry, fishery, and craft workers, especially amongst the different trades. Within this occupational group the shortage areas include: metal, machinery and related trades; electrical and electronic trades workers; building and related trades workers; and food processing, wood working, garment, and other craft and related trades workers.
Figure 5.7: Top 15 occupations in demand identified using SETA PIVOTAL list
Adm
inist
rativ
e an
d co
mm
erci
al m
anag
ers
Prod
uctio
n an
d sp
ecia
lised
serv
ices
man
ager
s
Scie
nce
and
engi
neer
ing
prof
essio
nals
Scie
nce
and
engi
neer
ing
asso
ciat
e pr
ofes
siona
ls
Heal
th a
ssoc
iate
pro
fess
iona
ls
Busin
ess a
nd a
dmin
istra
tion
asso
ciat
e pr
ofes
siona
ls
Lega
l, so
cial
, cul
tura
l and
rela
ted
asso
ciat
e pr
ofes
siona
ls
Info
rmati
on a
nd c
omm
unic
ation
s tec
hnic
ians
Num
eric
al a
nd m
ater
ial r
ecor
ding
cle
rk
Oth
er c
leric
al su
ppor
t wor
kers
Pers
onal
serv
ice
wor
kers
Build
ing
and
rela
ted
trad
es w
orke
rs
Met
al, m
achi
nery
and
rela
ted
trad
es w
orke
rs
Elec
tric
al a
nd e
lect
roni
c tr
ades
wor
kers
Food
pro
cess
ing,
woo
d w
orki
ng, g
arm
ent a
nd
othe
r cra
ft an
d re
late
d tr
ades
wor
kers
Stati
onar
y pl
ant a
nd m
achi
ne o
pera
tors
Driv
ers a
nd m
obile
pla
nt o
pera
tors
Clea
ners
and
hel
pers
Labo
urer
s
0
2
4
6
8
10
12
14
16
18
(%)
Source: Author’s calculations from SETA-produced PIVOTAL List
48 This refers to the Professional, Vocational and Technical Occupational List.49 Each SETA constructs its own scarce skills lists, and submission of these lists can provide the basis for funding of occupations that are viewed
as being in demand. The top 10 ranked occupations from each SETA were used to create the PIVOTAL list.

Understanding demand through changes in the structure of employment
70 Skills supply and demand in South Africa
Another significant trend is the dominance of service-level occupations across all the major groups. For instance, within the managers category, the occupations perceived to be in the greatest shortage are production and service-level managers. Similarly, within the technicians and associate level professionals, one of the key identified shortage areas is the business and administrative area.
There is also a significant shortage of science and technology-based occupations, especially at the professional and technician level. It is also important to note that amongst craft occupations there is considerable demand for technically based skills.
OCCUPATIONS IN HIGH DEMANDIn 2014 the Department of Higher Education and Training published the first List of Occupations in High Demand (DHET, 2014)50. This list was constructed using a number of data sources and stakeholder consultation. A year later the methodology was refined and the List of Occupations in High Demand 2015 was published (DHET, 2015)51. In the 2015 list. In all, 340 occupations (described at the six-digit level OFO code) were identified as occupations in high demand. Using this list, the following two-digit occupations were generated.
50 List of Occupations in High Demand 2014. No 38174 Government Gazette. 4 November 2014.51 List of Occupations in High Demand 2015. No 39604 Government Gazette. 19 January 2016.
Table 5.4: List of occupations in high demand at OFO digit level 2
OFO Code at digit level 2 Name of occupation
1. Managers
11 Chief executives, senior officials and legislators12 Administrative and commercial managers13 Production and specialised services managers14 Hospitality, retail and other services managers2. Professionals21 Physical, mathematical and engineering science professionals22 Health professionals23 Teaching professionals24 Business and administration professionals25 Information and communication technology professionals26 Legal, social and cultural professionals3. Technicians and associate professionals31 Science and engineering associate professionals32 Health associate professionals33 Business and administration associate professionals35 Information and communication technicians4. Clerical support workers42 Customer service clerks43 Numerical and material recording clerks5. Service and sales workers53 Personal care workers54 Protective service workers6. Skilled agricultural. forestry. fishery. craft and related trades workers64 Building and related trade workers65 Metal, machinery and related trade workers66 Handicraft and printing workers67 Electrical and electronics trade workers
68Food processing, wood working, garment and other craft-related trade workers
7. Plant and machine operators and assemblers71 Stationary plant and machine operators72 Assemblers73 Drivers and mobile plant operators
There is a significant shortage of science and technology based occupations at both the professional and technician level.

Understanding demand through changes in the structure of employment
CHAP
TER
5
Skills supply and demand in South Africa 71
CONCLUDING COMMENTS AND SKILLS IMPLICATIONSThe demand for skills is a derived demand determined by structural changes in the economy. Through the analysis of different data sources we were able to signal the changes in employment and education skill levels. The data shows that the country is experiencing slow growth and, while this is impacting on employment, it is not having a significant influence on unemployment reduction. The South African economy is characterised by shortages for high-skilled jobs and high levels of unemployment for those with lower levels of education and training. Many of the government-supported growth initiatives have prioritised the creation of low-skill jobs and the development of high-level skills, especially in the SET areas.
The sectors in which people work and the types of jobs available are changing. At national level, the data reveals that there is a structural shift towards a service economy. This changing structure of the economy
reveals the absence of low-wage jobs in the manufacturing sector and a high dependence on the high-skilled financial services. Into this breach has stepped a public sector, with the unintended consequence that it, along with labour brokers, have become key nodes of employment generation in the South African economy. This pattern of growth and its attendant employment outcomes are not sustainable.
The impact of the structural shift for occupations is surprising. For the skilled occupational level, the relative demand for managers is increasing. No significant demand is apparent for other professional occupational areas, suggesting that this might be a result of the overall demand for high-end skills being low, or that there are high vacancy levels, signalling a shortage of these skills. There is also no significant growth in the number of jobs for technicians and associate level professionals. However, for employers, occupations in the technicians and associate professionals category are a high priority.
The demand for semi-skilled level occupations was highest for services and sales workers, where there was a 25% growth over the 2010 to 2014 period. In the case of skilled agriculture, forestry, and trade workers, as well as plant operators, the growth in demand was higher than for professional-level occupations. The evidence also points to a demand for certain types of trade occupations (e.g. building and related trades workers, electrical and electronics trade workers, metal, machinery and related trades workers). The demand for trade workers is corroborated by employers.
The age profile of workers by the industrial sectors reassures the labour market that there is a pipeline of workers at different age levels, in almost all sectors, to replace the workers who will be retiring. The most vulnerable sector when it comes to replacement demand is the Electricity, Gas, and Water sector, where 15% of the workforce is between the ages of 55 and 64 years and 17% is between 45 and 54 years.

72 Skills supply and demand in South Africa
6CHAPTER

UNDERSTANDING SKILLS MISMATCHES
Skills supply and demand in South Africa 73
Understanding skills mismatches
74 Skills supply and demand in South Africa
Skills planning must respond to the needs of the labour market and the society. An effective and efficient labour market requires that the skills of the workforce match those required by employers, and that the type of skills produced by the different levels of the education system should respond to market demand. Further, the types of jobs created must also match the skills of the population, especially the unemployed. Skills mismatch is an encompassing term which refers to various types of imbalances between skills offered and skills needed in the world of work.
The preceding chapters focused on understanding how different factors influenced the demand for skills, through an analysis of the performance of the economy and changes in the labour market. This chapter takes the analysis further and provides an understanding of the types of mismatches and where mismatches exist in the labour market. This analysis will then provide policy makers with signals for interventions to tackle skills mismatches.
TYPES OF SKILLS MISMATCHESA just and inclusive society requires that there are job opportunities for all, and that workers possess the requisite skills to do the job. When workers’ skills do not match what is required by employers and the education and training system fails to produce skills needed by the labour market, there is a mismatch. When the type of skills required for a job and the skills of the working age do not match, there is a mismatch. When employees do not work in the sectors and occupations they have studied for then there is mismatch.
We adopted a comprehensive approach to estimate mismatches and identified three types of mismatches in the South Africa context. In this
preliminary analysis we identified three types of mismatches: demand mismatch, educational supply mismatch and qualification-job mismatch.
• Demand mismatch examines the shape and trajectory of the economy, the types of jobs that are being created, and the skills set and expectations of the working-age population. In this analysis we estimated the types of skills required by the jobs in the economy (measured by the type of occupations and the sectors being developed) and the skills set of the majority of the country’s population (measured by the education level).
• Educational supply mismatch examines how supply responds to areas of skills demand. For the educational supply mismatch, we analysed the relationship between skills demand and the skills currently produced by the education system. For instance, if mechanical engineers were identified as being in demand, then our analysis investigated the extent to which the current post-school education and training system is producing mechanical engineers. If the supply is not producing the type of qualification identified as a demand, an educational supply mismatch is assumed to exist.
• Qualification-job mismatch examines the qualification gaps for skilled jobs and then traces the sectors and occupations that the educational qualifications are absorbed into. For the qualification gap we examined the qualification level of workers in skilled occupations and the changes over time. To determine where the qualifications are absorbed, we examined the subject area qualification (higher or technical vocational education) for those with a tertiary education in the workplace. This data was then analysed against the occupational areas and sectors in which the same people worked. There is an assumption that those who studied a particular subject area would be employed in a sector and occupation relevant to their qualification. For instance, if a person studied for an engineering TVET
qualification, there is an assumption that they would be employed as a technician and would probably work in the Manufacturing or Construction sector. When this does not occur, there is a qualification-job mismatch.
SIGNALS ON SKILLS MISMATCHES Estimating the mismatch for each of the three categories identified involves different approaches and assumptions. Each of these categories is not mutually exclusive and there is a degree of interaction between the mismatches.
SIGNALS ON DEMAND MISMATCHES The South African developmental challenge is to both grow the economy and to create jobs for the majority of the population. The South African economy and labour market is characterised as one where there is a demand for high skill, but a surplus of low-skilled workers (Bhorat and Jacobs, 2010). The first and perhaps the most significant mismatch, the demand mismatch, is that between the trajectory and skills demand of the economy and the skills set and expectations of the labour force.
Economic growth in post-apartheid South Africa, while modest, has been driven largely by capital-intensive industries, retail trade, and financial services, rather than labour-intensive sectors such as Agriculture and Manufacturing. As outlined earlier, development in most middle-income countries is characterised by a move away from low-productivity Agricultural sectors, towards the labour-intensive Manufacturing sector, then to technologically advanced manufacturing, and eventually to the high-skilled Services sector. Under such a developmental trajectory, technological advances will result in productivity improvements in the Agricultural sector, and the displaced rural workers are then absorbed into the labour-intensive and semi-skilled Manufacturing sector. This growth path leverages new technologies, builds a skilled labour force, and raises productivity – which together lead to higher levels of growth and employment. In the case of South

Understanding skills mismatches
CHAP
TER
6
Skills supply and demand in South Africa 75
Africa, this transition has not occurred in this manner, and development has therefore been characterised by stagnation in the Agricultural sector and a decline in the Mining sector. The labour-intensive Manufacturing sector has failed to materialise and is instead dominated by capital-intensive work.
The South African development trajectory appears to have skipped a stage and moved into a skills-biased employment trajectory which is dependent on the Financial Services sector for growth, and on the Wholesale and Retail, and public sector for jobs. This growth is not sufficient to absorb new entrants into the labour market, including those who have lost jobs in the Agriculture and Mining sectors since 2001. Overall, Community Services (including Government Services) were responsible for the bulk of employment growth over the period, adding 750 000 jobs from 2010 to 2014 to the economy, and reflecting the dominance of the public sector in employment generation.
At the same time, the growth trajectory needs to be considered against what is happening in society. The country is experiencing continuous rises in unemployment. Currently, the country has a labour market of 15 million people and 8 million people are unemployed. Of the 8 million unemployed, around 5 million are between the ages of 15 and 34 years. From 2010 the total number of the working-age population has been increasing but the rate of growth of the working-age population is twice the rate of the growth of employment. It is predicted that a significant number of people will enter the labour force in the next five years, and it is questionable whether or not they can be absorbed into the current labour market.
Presently close to half of the employed and 60% of the unemployed populations have not completed their secondary education. While the educational levels are a barrier to access and progression in the labour market, the policy challenge remains to create low-wage jobs to absorb the
unemployed and to design appropriate workplace training programmes for the employed to improve their skills level and progress in the labour market.
SIGNALS ON EDUCATIONAL SUPPLY MISMATCHES Signals on educational supply mismatches are derived from the analysis of skills demand. This involves identifying where immediate medium and long-term action is required to tackle skills mismatches52. Within each of these categories there is an assumption that certain occupations are strategic to the country’s development and that there is a corresponding risk of not investing in skills, skills which are critical to supporting the economy. These are classified as “red” skills or occupations as presented in Table 6.1. These skills demands are not being met due to their severe shortage or the fact that they require a long lead time to produce. The second skill or occupational category is classified as “pink”. These are viewed as critical to the economy, but the magnitude of the demand is not high, and they require a shorter time to develop. The final category is “amber”, which occupations are experiencing a demand, but are not viewed as critical to national growth and development, and can be met in the short to medium term by increasing supply.
Table 6.1, on page 76, lists the occupations identified as being in demand by the extent of demand, red being severe demand, pink not as severe, and amber less severe demand. In the left column of the table are the occupations in demand. This is categorised from the perspective of skilled and semi-skilled occupations. Typically, skilled occupations are managers, professionals, or technicians and associate professionals, who in most instance would require qualification at NQF levels 5, 6 or 7 to perform their job effectively. The semi-skilled comprise clerical support, service and sales workers, and skilled agricultural, forestry and trades workers, as well as plant operators. The qualifications for
these occupations would normally be at NQF level 4 or 5.
The right column of the table provides evidence on the supply from the education and training system, i.e. completers in the corresponding qualifications from the universities and TVET colleges in 2014. This leads to the analysis of the degree of matches between the demand for specific occupations and evidence on supply. As would be expected, completely accurate information is not available to determine the level of matches, however, it does provide a signal for skills planning requirements.
What then do these signals tell us about educational supply mismatches:
• There is a demand for managers, but the demand exists for managers with particular technical subject knowledge and expertise, not just general managers.
• At the professional level the key signals for policy makers are related to the significant demand for Science, Technology, and Engineering graduates. There are around 55 000 Science, Technology, Engineering, and Mathematics (STEM) graduates each year, and this does not appear to be enough to match the existing demand. STEM graduates are needed for management occupations, engineering professions and occupations, medical professions, as well as for teaching professions. The nature and extent of STEM occupation demand is clearly identified in a number of sources, including the list of occupations in high demand. What is also clear is that the number of STEM qualifications will have to expand considerably in order to meet demand. As we shall see in the next section STEM graduates are flexible and versatile, and can be readily employed in other sectors.
• For teachers, the analysis highlighted a number of specific mismatches. Analysis of replacement demand points to needing at least 25 000 new teachers a year to offset those
52 We draw upon the methodology developed for the 2010 Skills Audit for the UK (UKCES, 2010).

Understanding skills mismatches
76 Skills supply and demand in South Africa
Table 6.1: Occupations in demand and response of educational supply
DEMAND FOR QUALIFICATION SUPPLY OF QUALIFICATIONS
Occupational area
Red classification: Severe demand
Pink classification: Moderate demand
Amber classification: Less severe Signals on current supply. 2014
SKILLED
Managers Production and service managers Administrative and commercial managers
Health managersHospitality, retail and other service managers
Health and safety managersLegal and ICT managers
• 11 366 N6 TVET qualification in Business-related qualifications
• 50 380 Business and Management graduates
• 7 270 Law graduates
Professionals Teachers: early childhood development and Mathematics and ScienceSTE professionalsBusiness and administrative professionals
Social welfare professionals Health and social service professionals, especially medical doctors
Accounting and finance professionalsMining engineersLife scientists
• 17 000 new Education graduates
• 14 077 engineers graduated from universities
• 6 800 ICT graduates annually from University sector
• 12 500 Health Profession graduates
• 7 270 Law graduates • 29 000 Science graduates
Technicians and associate professionals
Business and administrative associate professionals STE and associate professionalsFood and beverage technicians
Health associate professionalsMining and engineering techniciansMining technologists
Legal, social, cultural and related associatesInformation and communication technicians
• 3 824 Business and Administrative completers at NCV level 4
• 1648 Engineering completers at NQF level 4
• 130 ICT completers at NQF level 4
• 8 000 NATED6 Engineering completers from TVET colleges.
SEMI-SKILLED
Clerical support workers and service and sales workers
Sales workersPersonal care workersPersonal service workers
Skilled agricultural and trade workers
Building and trade-related workersMetal machinery and related tradesElectrical and electronic trades workers
Food processingWood working
Garment, craft and related trade workers
• 329 Civil, Building and Construction; 520 Engineering-related design; and 595 Electrical Infrastructure Construction Engineers completed at NQF level 4
Plant and machine operators and assemblers
Drivers and plant operators
Assemblers • 5 process plant operators completed courses at a TVET college
Source: Analysis from the previous chapters

Understanding skills mismatches
CHAP
TER
6
Skills supply and demand in South Africa 77
retiring. The supply system is increasing the supply each year, with the 2014 figures showing that 17 000 new teachers graduated from the tertiary institutions that year alone. There are shortages, in particular, for Early Childhood Development (ECD) practitioners and for Mathematics and Science secondary school teachers.
• For the skilled technician level, the demand areas are for business and administrative associate professionals, and STEM associate professionals. There were 50 000 Business and Management completers from universities and 8 000 N6 Engineering completers from TVET colleges.
• For workers in the semi-skilled trades, there is demand in the building and construction, metal machinery and related trades, as well as electrical and electronic trades. The numbers produced for each of the areas by the TVET colleges are only a few hundred. This points to a significant educational supply mismatch.
SIGNALS ON QUALIFICATION-JOB MISMATCHESThe qualification-job match analysis attempts to obtain signals on whether the right number and types of qualifications are being produced to meet the needs in the workplace, and whether or not individuals are working in sectors and occupations linked to
their tertiary education and training. In this approach, qualifications are used as a proxy for measuring skills, and we will focus on workers with tertiary qualifications. Two different approaches, the qualification gap and the job mismatch, are used to understand the qualification-job mismatch.
The approach to estimate the qualification gap is, firstly, to analyse the shares of workers in the labour market employed in high-skilled occupations, namely managers, professionals, technicians and associate professionals, in order to understand demand53 and to track how this has changed over time. Secondly, we estimate the skill level of workers in these occupations by calculating the shares of workers with tertiary qualifications (Table 6.2).
The evidence reveals that the demand for high-skilled managerial occupations increased by 0.8% percentage points from 8.0% in 2010 to 8.8% in 2014; the demand for high skilled professional occupations has dropped slightly (from 9.3% in 2010 to 8.9% in 2014); and the demand for technicians and associated professional occupations has decreased slightly from 7.4% to 7.0%. In addition, the analysis of the change in skill level (from 2010 to 2014) in the high-skilled occupations revealed that: tertiary qualifications of managers increased by 2.4 percentage points; tertiary qualifications of professionals
increased by 3.7 percentage points; and for technicians and associate professionals this increase was 5.3 percentage points.
These findings highlight the fact that workers in professional level occupations are much more likely to have a tertiary level qualification than those in managerial or technical occupations. The qualification level of managers and technicians is surprisingly low, given the status of these occupations and that, in recent years, around 200 000 new tertiary qualifications have been produced each year from the university and TVET college sectors.
The second approach for investigating qualification matches is to analyse the sectors and occupations in which the graduates are employed. Qualifications are traditionally classified into the three Classification of Educational Subject Matter (CESM) categories: Business, Commerce and Management Studies; Science, Engineering and Technology; and Humanities. To produce more textured information for the skills planning processes, we disaggregated the three CESM categories further into six categories: Business, Commerce and Management studies; Science; Engineering or Engineering Technology; Healthcare or Health Sciences; Visual and Performing Arts; Education, Training and Development; and Other Humanities and Social Sciences.
Table 6.2: Qualification gap for high-skilled occupations
Demand for higher skills level (estimated
by the shares of employed persons in the
occupational area)
Education skill level of employers in high-skilled
occupations54
2010 2014 2010 2014
Managers 8.0% 8.8% 42.9% 45.3%Professionals 9.3% 8.9% 74.5% 78.2%Technicians and associate professionals 7.4% 7.0% 38.2% 43.5%
Source: Author’s calculations from QLFS and Labour Market Dynamics (2010. 2014). StatsSA
53 This is a blunt indicator of demand as we have not estimated the number of vacancies. The number employed in a particular occupation plus the number of vacancies will provide a better estimation of demand.
54 Estimated by shares with a tertiary qualification.

Understanding skills mismatches
78 Skills supply and demand in South Africa
Table 6.3: Employed population with Higher Education qualifications by study field and main industry sector, 2014
Main industry sector
NUMBERS SHARES
Business, Commerce,
Manage-ment
studies Science
Engineering or
Engineering Technology
Health Care
or Health Sciences
Arts, Visual or
Performing
Education, Training or
Develop-ment
Other Humanities
and Social Sciences
Undefined (Other) Total
Business, Commerce,
Manage-ment
studies Science
Engineering or
Engineering Technology
Health Care
or Health Sciences
Arts, Visual or
Performing
Education, Training or
Develop-ment
Other Humanities
and Social Sciences
Undefined (Other) Total
Agriculture, Hunting, and Forestry and Fishing 1 671 4 321 293 0 0 0 357 1 428 8 070 1 5 0 0 0 0 0 2 1
Mining and Quarrying 5 987 2 488 6 470 249 0 1 045 2 339 727 19 305 2 3 5 0 0 0 1 1 2
Manufacturing 32 593 7 892 27 115 4 083 2 861 1 224 11 749 10 881 98 398 10 8 23 4 14 0 5 18 8
Electricity, Gas and Water Supply 5 887 259 4 910 0 0 838 0 530 12 424 2 0 4 0 0 0 0 1 1
Construction 7 894 1 405 18 185 596 1 620 815 3 721 269 34 505 2 1 15 1 8 0 2 0 3
Wholesale and Retail Trade 32 643 4 251 6 678 5 328 2 428 4 342 11 389 5 920 72 979 10 5 6 5 12 2 5 10 6
Transport and Storage, and Communication 19 576 3 982 8 125 1 425 1 068 2 810 14 892 1 547 53 425 6 4 7 1 5 1 7 3 4
Financial Intermediation, Insurance, Real Estate, and Business 128 790 37 726 37 214 2 988 6 161 6 638 69 252 13 474 302 243 41 40 31 3 29 3 30 22 25
Community, Social and Personal Services 81 704 31 486 9 675 93 116 6 834 236 543 113 641 25 479 598 478 26 34 8 86 32 93 50 42 50
Private households 71 0 0 0 141 381 0 0 593 0 0 0 0 1 0 0 0 0
Other 0 0 0 0 0 0 565 0 565 0 0 0 0 0 0 0 0 0
Total 316 816 93 810 118 665 107 785 21 113 254 636 227 905 60 255 1 200 985 100 100 100 100 100 100 100 100 100
Source: Labour Market Dynamics, StatsSA (2014b)
Table 6.4: Employed population with Higher Education qualifications by study field and main occupation (1-digit), 2014
Occupation (OFO classification)
NUMBERS SHARES
Business, Commerce,
Manage-ment
studies Science
Engineering or
Engineering Technology
Health Care
or Health Sciences
Arts, Visual or
Performing
Education, Training or
Develop-ment
Other Humanities
and Social Sciences
Undefined (Other) Total
Business, Commerce,
Manage-ment
studies Science
Engineering or
Engineering Technology
Health Care
or Health Sciences
Arts, Visual or
Performing
Education, Training or
Develop-ment
Other Humanities
and Social Sciences
Undefined (Other) Total
Managers 117 328 24 649 44 047 7 914 6 407 28 688 54 338 13 359 296 730 37 26 37 7 30 11 24 22 25
Professionals 118 401 51 158 47 808 66 853 7 459 212 525 88 844 21 463 614 511 37 55 40 62 35 83 39 36 51
Technicians and associate professionals 27 325 8 572 12 688 24 654 3 694 5 552 37 981 14 555 135 021 9 9 11 23 17 2 17 24 11
Clerical support workers 39 756 3 872 1 559 3 921 1 333 3 447 30 773 5 162 89 823 13 4 1 4 6 1 14 9 7
Service and sales workers 7 360 2 697 2 586 3 218 272 2 985 8 413 3 928 31 459 2 3 2 3 1 1 4 7 3
Skilled agricultural. forestry, fishery, craft and related trades workers 579 2 506 7 658 1 087 1 792 777 1 966 1 355 17 720 0 3 6 1 8 0 1 2 1
Plant and machine operators, and assemblers 1 840 0 1 731 138 0 0 1 675 431 5 815 1 0 1 0 0 0 1 1 0
Elementary occupations 4 224 357 588 0 154 665 3 918 0 9 906 1 0 0 0 1 0 2 0 1
Total 316 813 93 811 118 665 107 785 21 111 254 639 227 908 60 253 1 200 985 100 100 100 100 100 100 100 100 100
Source: Labour Market Dynamics, StatsSA (2014b)

Understanding skills mismatches
CHAP
TER
6
Skills supply and demand in South Africa 79
Table 6.3: Employed population with Higher Education qualifications by study field and main industry sector, 2014
Main industry sector
NUMBERS SHARES
Business, Commerce,
Manage-ment
studies Science
Engineering or
Engineering Technology
Health Care
or Health Sciences
Arts, Visual or
Performing
Education, Training or
Develop-ment
Other Humanities
and Social Sciences
Undefined (Other) Total
Business, Commerce,
Manage-ment
studies Science
Engineering or
Engineering Technology
Health Care
or Health Sciences
Arts, Visual or
Performing
Education, Training or
Develop-ment
Other Humanities
and Social Sciences
Undefined (Other) Total
Agriculture, Hunting, and Forestry and Fishing 1 671 4 321 293 0 0 0 357 1 428 8 070 1 5 0 0 0 0 0 2 1
Mining and Quarrying 5 987 2 488 6 470 249 0 1 045 2 339 727 19 305 2 3 5 0 0 0 1 1 2
Manufacturing 32 593 7 892 27 115 4 083 2 861 1 224 11 749 10 881 98 398 10 8 23 4 14 0 5 18 8
Electricity, Gas and Water Supply 5 887 259 4 910 0 0 838 0 530 12 424 2 0 4 0 0 0 0 1 1
Construction 7 894 1 405 18 185 596 1 620 815 3 721 269 34 505 2 1 15 1 8 0 2 0 3
Wholesale and Retail Trade 32 643 4 251 6 678 5 328 2 428 4 342 11 389 5 920 72 979 10 5 6 5 12 2 5 10 6
Transport and Storage, and Communication 19 576 3 982 8 125 1 425 1 068 2 810 14 892 1 547 53 425 6 4 7 1 5 1 7 3 4
Financial Intermediation, Insurance, Real Estate, and Business 128 790 37 726 37 214 2 988 6 161 6 638 69 252 13 474 302 243 41 40 31 3 29 3 30 22 25
Community, Social and Personal Services 81 704 31 486 9 675 93 116 6 834 236 543 113 641 25 479 598 478 26 34 8 86 32 93 50 42 50
Private households 71 0 0 0 141 381 0 0 593 0 0 0 0 1 0 0 0 0
Other 0 0 0 0 0 0 565 0 565 0 0 0 0 0 0 0 0 0
Total 316 816 93 810 118 665 107 785 21 113 254 636 227 905 60 255 1 200 985 100 100 100 100 100 100 100 100 100
Source: Labour Market Dynamics, StatsSA (2014b)
Table 6.4: Employed population with Higher Education qualifications by study field and main occupation (1-digit), 2014
Occupation (OFO classification)
NUMBERS SHARES
Business, Commerce,
Manage-ment
studies Science
Engineering or
Engineering Technology
Health Care
or Health Sciences
Arts, Visual or
Performing
Education, Training or
Develop-ment
Other Humanities
and Social Sciences
Undefined (Other) Total
Business, Commerce,
Manage-ment
studies Science
Engineering or
Engineering Technology
Health Care
or Health Sciences
Arts, Visual or
Performing
Education, Training or
Develop-ment
Other Humanities
and Social Sciences
Undefined (Other) Total
Managers 117 328 24 649 44 047 7 914 6 407 28 688 54 338 13 359 296 730 37 26 37 7 30 11 24 22 25
Professionals 118 401 51 158 47 808 66 853 7 459 212 525 88 844 21 463 614 511 37 55 40 62 35 83 39 36 51
Technicians and associate professionals 27 325 8 572 12 688 24 654 3 694 5 552 37 981 14 555 135 021 9 9 11 23 17 2 17 24 11
Clerical support workers 39 756 3 872 1 559 3 921 1 333 3 447 30 773 5 162 89 823 13 4 1 4 6 1 14 9 7
Service and sales workers 7 360 2 697 2 586 3 218 272 2 985 8 413 3 928 31 459 2 3 2 3 1 1 4 7 3
Skilled agricultural. forestry, fishery, craft and related trades workers 579 2 506 7 658 1 087 1 792 777 1 966 1 355 17 720 0 3 6 1 8 0 1 2 1
Plant and machine operators, and assemblers 1 840 0 1 731 138 0 0 1 675 431 5 815 1 0 1 0 0 0 1 1 0
Elementary occupations 4 224 357 588 0 154 665 3 918 0 9 906 1 0 0 0 1 0 2 0 1
Total 316 813 93 811 118 665 107 785 21 111 254 639 227 908 60 253 1 200 985 100 100 100 100 100 100 100 100 100
Source: Labour Market Dynamics, StatsSA (2014b)

Understanding skills mismatches
80 Skills supply and demand in South Africa
Table 6.3, on page 78, presents information about the sectors in which graduates with a Higher Education qualification work, and Table 6.4, on page 77 presents information about the occupations in which these graduates work.
The stark result is that three quarters of all Higher Education graduates work in two sectors – 50% of the graduates work in Community, Social and Personal Services, followed by 25% in the Financial Services sector, and a smaller proportion (8%) works in the Manufacturing sector.
The Community, Social and Personal Services sector includes a number of government services. It is pleasing to note that 93% of the Education, Training, and Development graduates and 86% of Healthcare and Health Sciences graduates work in the public sector. Half of all Humanities graduates
are employed in this sector, in addition to one third of Science graduates and a quarter of the Business graduates.
Another important trend is that 40% of Science graduates and 31% of Engineering graduates work in financial services. This pattern of STEM graduates working in the Financial Services sector is found in many countries. It seems that skills gained in studying the STEM-based subjects are transferable to a number of sectors and occupations, and the conditions in the Financial Services field have acted as a magnet for graduates. This phenomenon has created shortages in the STEM sectors. All of this indicates some degree of qualification-job mismatch, i.e. people are not directly using their technical knowledge in sectors where they work.
Other sectors have a closer match with relevant qualifications, including Business and Commerce graduates,
where 41% work in Financial Services. In general, the data on Higher Education graduates shows a mixed picture, with some qualification-job mismatches occurring for Science and Engineering graduates, but for the vast majority of graduates, their qualifications appear to be fit for purpose in that they are employed in positions that match their broad skill areas.
In order to further explore the qualification-job match for Higher Education graduates, the analysis turned to the type of occupations in which graduates are employed and how this relates to the subject they studied (see Table 6.4). The data in Table 6.4 shows that nearly 90% of graduates are employed in managerial, professional or technician and associate level positions, with the majority (51%) in professional positions. This is to be expected, and confirms there is a strong match
Table 6.5: Employed population with TVET qualifications by study field and main industry sector, 2014
Main industry sector
NUMBERS SHARES
Business, Commerce,
Manage-ment
studies Science
Engineering or
Engineering Technology
Health Care
or Health Sciences
Arts, Visual or
Performing
Education, Training or
Develop-ment
Other Humanities
and Social Sciences
Undefined (Other) Total
Business, Commerce,
Manage-ment
studies Science
Engineering or
Engineering Technology
Health Care
or Health Sciences
Arts, Visual or
Performing
Education, Training or
Develop-ment
Other Humanities
and Social Sciences
Undefined (Other) Total
Agriculture, Hunting, and Forestry and Fishing 2 856 8 202 3 623 303 0 264 1 374 2 098 18 720 1 7 1 0 0 0 1 1 1
Mining and Quarrying 9 640 1 145 35 749 1 638 0 1 204 3 155 6 830 59 361 2 1 9 1 0 0 1 4 3
Manufacturing 48 216 14 072 70 745 4 128 3 258 7 054 13 599 19 392 180 464 10 12 18 2 16 2 6 11 10
Electricity, Gas and Water Supply 4 787 1 965 20 548 204 0 264 483 2 580 30 831 1 2 5 0 0 0 0 1 2
Construction 16 738 7 601 49 854 2 609 0 2 164 5 218 6 619 90 803 4 6 13 1 0 1 2 4 5
Wholesale and Retail Trade 83 754 19 235 38 385 10 168 4 839 11 503 37 722 28 973 234 579 18 16 10 6 24 4 16 16 13
Transport and Storage, and Communication 32 111 4 737 35 907 1 447 271 3 346 19 064 13 077 109 960 7 4 9 1 1 1 8 7 6
Financial Intermediation, Insurance, Real Estate, and Business 139 277 29 090 72 928 5 928 5 000 9 716 37 869 36 173 335 981 30 24 19 3 25 3 17 21 18
Community, Social and Personal Services 130 761 34 460 52 611 148 306 6 948 258 740 109 412 58 351 799 589 28 28 14 85 34 88 48 33 43
Private households 3 765 322 985 681 0 926 1 037 1 532 9 248 1 0 0 0 0 0 0 1 0
Other – 205 1 392 0 0 0 0 0 1 597 0 0 0 0 0 0 0 0 0
Total 471 905 121 034 382 727 175 412 20 316 295 181 228 933 175 625 1 871 133 100 100 100 100 100 100 100 100 100
Source: Author’s calculations from Labour Market Dynamics. StatsSA (2014b)

Understanding skills mismatches
CHAP
TER
6
Skills supply and demand in South Africa 81
between the type of qualifications obtained by Higher Education graduates and the occupations in which they are employed.
More significant trends are apparent when we look at the destination of graduates by their qualification subject areas. For Business and Commerce graduates, the overwhelming majority is either employed as managers (37%), professionals (37%) or clerical support workers (13%). Of the Science graduates, 55% are employed as professionals and 26% as managers. Half the Engineering and Technology graduates are employed as either professionals (40%) or technicians and associate professionals (11%). For Health graduates, a similar trend is apparent in that graduates are employed as either professionals (62%) or as technicians and associate professionals (23%).
Table 6.5: Employed population with TVET qualifications by study field and main industry sector, 2014
Main industry sector
NUMBERS SHARES
Business, Commerce,
Manage-ment
studies Science
Engineering or
Engineering Technology
Health Care
or Health Sciences
Arts, Visual or
Performing
Education, Training or
Develop-ment
Other Humanities
and Social Sciences
Undefined (Other) Total
Business, Commerce,
Manage-ment
studies Science
Engineering or
Engineering Technology
Health Care
or Health Sciences
Arts, Visual or
Performing
Education, Training or
Develop-ment
Other Humanities
and Social Sciences
Undefined (Other) Total
Agriculture, Hunting, and Forestry and Fishing 2 856 8 202 3 623 303 0 264 1 374 2 098 18 720 1 7 1 0 0 0 1 1 1
Mining and Quarrying 9 640 1 145 35 749 1 638 0 1 204 3 155 6 830 59 361 2 1 9 1 0 0 1 4 3
Manufacturing 48 216 14 072 70 745 4 128 3 258 7 054 13 599 19 392 180 464 10 12 18 2 16 2 6 11 10
Electricity, Gas and Water Supply 4 787 1 965 20 548 204 0 264 483 2 580 30 831 1 2 5 0 0 0 0 1 2
Construction 16 738 7 601 49 854 2 609 0 2 164 5 218 6 619 90 803 4 6 13 1 0 1 2 4 5
Wholesale and Retail Trade 83 754 19 235 38 385 10 168 4 839 11 503 37 722 28 973 234 579 18 16 10 6 24 4 16 16 13
Transport and Storage, and Communication 32 111 4 737 35 907 1 447 271 3 346 19 064 13 077 109 960 7 4 9 1 1 1 8 7 6
Financial Intermediation, Insurance, Real Estate, and Business 139 277 29 090 72 928 5 928 5 000 9 716 37 869 36 173 335 981 30 24 19 3 25 3 17 21 18
Community, Social and Personal Services 130 761 34 460 52 611 148 306 6 948 258 740 109 412 58 351 799 589 28 28 14 85 34 88 48 33 43
Private households 3 765 322 985 681 0 926 1 037 1 532 9 248 1 0 0 0 0 0 0 1 0
Other – 205 1 392 0 0 0 0 0 1 597 0 0 0 0 0 0 0 0 0
Total 471 905 121 034 382 727 175 412 20 316 295 181 228 933 175 625 1 871 133 100 100 100 100 100 100 100 100 100
Source: Author’s calculations from Labour Market Dynamics. StatsSA (2014b)
These findings suggest that most Higher Education graduates are employed at the occupational level for which they have been trained. However, there is a mismatch particularly in the sectors in which Engineering and Science graduates work. Aside from this trend, there are no significant qualification-job mismatches for graduates, and their type of employment in most instances reflects the qualification they obtained.
In order to further explore the qualification-job match for TVET graduates, the analysis turned to sectors and the type of occupations in which graduates are employed and how this relates to the area in which they completed their studies (see Table 6.5 and Table 6.6).
We will examine the mismatch between the qualification graduates obtain and the job in which they are employed.
The cost of developing a TVET graduate is more than for a Business or Services graduate, due to the higher cost of the capital equipment involved in training. Therefore, a qualification mismatch in the TVET sector can have implications on how efficiently resources have been used. Data on the subject areas of TVET graduates and the sector in which they are employed is shown in Table 6.5. Overall, only 10% of TVET graduates are employed in the Manufacturing sector, with the majority being employed in Community, Social, and Personal Services sector (43%) and the Financial Services sector (18%). This data points to a qualification-job mismatch.
At the level of specific qualifications, some significant qualification-job mismatches can also be found.
Similar proportions of Science (12%), Engineering (18%), and Visual and Performing Arts (16%) TVET graduates

Understanding skills mismatches
82 Skills supply and demand in South Africa
work in the manufacturing sector. One would have expected that higher shares of Science TVET graduates would work in the Manufacturing sector than those who studied the performing arts. Science and Engineering TVET graduates also work in the Wholesale and Retail Trade sector, Financial Services sector, and Community, Social and Personal Services sector.
The occupations in which TVET graduates are employed are shown in Table 6.6. What is surprising is that a significant proportion of TVET graduates is employed as professionals (23%), clerical workers (18%), and managers (16%), compared to those employed as technicians (17%), suggesting a qualification-job mismatch. Ideally, more TVET graduates should work as technicians or associate professionals.
When we analyse the specific qualifications of TVET graduates and the specific occupation in which they are employed, a number of important trends can be seen. It is crucial to highlight that half of those with Health Science qualifications and 20% of
those with Science qualifications are employed as technicians, indicating a reasonable qualification match.
The picture surrounding the qualification-job match of those with TVET qualifications is complex and requires more research. Attention must be drawn to the fact that the majority of those with TVET qualifications are not employed as technicians or associate professionals.
CONCLUDING COMMENTS AND IMPLICATIONS FOR SKILLS PLANNINGThe current approach for understanding skill mismatches must be seen as an exploratory analysis and the development of a prototype. This process will be refined in subsequent analyses. This approach attempted to provide a foundation and framework for policy makers to start understanding the nature of skills demands and skills mismatches facing South Africa, and the extent to which these mismatches occur at the three identified levels. The adoption of such an approach
provides a basis for policy makers to start targeting resources and making significant reforms. The evidence also highlights that the reform agenda is about demand and supply, as well as the ways in which they interact. The introduction of only supply measures will not solve South Africa’s employment and skills challenges.
The mismatches within the South African economy occur at three levels. The starting point for reform is to consider the mismatches that are occurring at the demand level. There are many people who need to find employment but have limited skills. At the same time, a considerable proportion of new jobs are elementary and in vulnerable forms of employment. This is not a long-term sustainable future for inclusive growth. The growing number of unemployed people needs to be absorbed in sectors where there are more labour-intensive forms of employment.
In the case of the educational supply mismatch, the picture is mixed. For managers, there is a need to increase
Table 6.6: Employed population with TVET qualifications by study field and main occupation (1 digit), 2014
Occupation (OFO classification)
NUMBERS SHARES
Business, Commerce,
Manage-ment
studies Science
Engineering or
Engineering Technology
Health Care
or Health Sciences
Arts, Visual or
Performing
Education, Training or
Develop-ment
Other Humanities
and Social Sciences
Undefined (Other) Total
Business, Commerce,
Manage-ment
studies Science
Engineering or
Engineering Technology
Health Care
or Health Sciences
Arts, Visual or
Performing
Education, Training or
Develop-ment
Other Humanities
and Social Sciences
Undefined (Other) Total
Managers 128 483 20 558 63 278 8 631 6 060 19 835 33 215 26 530 306 590 27 17 17 5 30 7 15 15 16
Professionals 42 775 23 095 50 268 37 511 3 215 233 349 26 221 17 067 433 501 9 19 13 21 16 79 11 10 23
Technicians and associate professionals 64 623 24 207 69 577 90 618 5 091 9 726 31 444 28 229 323 515 14 20 18 52 25 3 14 16 17
Clerical support workers 153 574 21 506 36 764 10 474 2 518 11 708 64 032 27 822 328 398 33 18 10 6 12 4 28 16 18
Service and sales workers 43 084 14 162 17 460 20 945 2 077 11 845 52 315 39 059 200 947 9 12 5 12 10 4 23 22 11
Skilled agricultural, forestry, fishery, craft and related trades workers 8 675 6 574 104 772 1 960 811 2 771 7 439 18 572 151 574 2 5 27 1 4 1 3 11 8
Plant and machine operators, and assemblers 7 705 4 057 22 972 1 354 545 1 109 5 226 8 641 51 609 2 3 6 1 3 0 2 5 3
Elementary occupations 22 977 6 867 17 628 3 917 0 4 842 9 042 9 711 74 984 5 6 5 2 0 2 4 6 4
Total 471 896 121 026 382 719 175 410 20 317 295 185 228 934 175 631 1 871 118 100 100 100 100 100 100 100 100 100
Source: Author’s calculations from Labour Market Dynamics, StatsSA (2014b)

Understanding skills mismatches
CHAP
TER
6
Skills supply and demand in South Africa 83
the supply of graduates in certain technical subjects. However, this should be supported by improved professional workplace experience and mentorships. Other professions where mismatch occurred included STEM graduates. It is clear that STEM graduates have a set of versatile skills and therefore they are able to, and do, work in different sectors. The implication for education and training is that there is a need to enrol and graduate higher numbers of STEM students than are required by STEM occupations. With regard to teachers, there were specific mismatches, particularly in the area of secondary school Mathematics and Science teachers and ECD professionals. At the technician level, there appears to be an under-supply of engineering technicians and associate professionals, as well as building and construction, metal, machinery, and related trades. The evidence points to a mismatch that can be addressed by increasing the supply of jobs.
Finally, regarding the qualification-job mismatches, three issues need to be
highlighted with regard to which sectors and occupations tertiary level graduates enter. Firstly, Higher Education graduates tended to be employed in high-skilled occupations as managers, professionals, and technicians and associate professionals. In the case of those with TVET qualifications, it is a surprise to see that only a minority worked as technicians and associate professionals. Secondly, nearly half of the Higher Education graduates are employed in the Community, Social and Personal Services sector. Thirdly, a high proportion of the Science and Engineering graduates, from both higher and technical vocation education sectors, prefer to work in the Financial Services sector, as opposed to the Manufacturing sector. This raises uncertainty about the use of skills resources, and about whether or not more career guidance and an understanding of the nature of workplaces are required to match qualifications and occupations more closely.
Table 6.6: Employed population with TVET qualifications by study field and main occupation (1 digit), 2014
Occupation (OFO classification)
NUMBERS SHARES
Business, Commerce,
Manage-ment
studies Science
Engineering or
Engineering Technology
Health Care
or Health Sciences
Arts, Visual or
Performing
Education, Training or
Develop-ment
Other Humanities
and Social Sciences
Undefined (Other) Total
Business, Commerce,
Manage-ment
studies Science
Engineering or
Engineering Technology
Health Care
or Health Sciences
Arts, Visual or
Performing
Education, Training or
Develop-ment
Other Humanities
and Social Sciences
Undefined (Other) Total
Managers 128 483 20 558 63 278 8 631 6 060 19 835 33 215 26 530 306 590 27 17 17 5 30 7 15 15 16
Professionals 42 775 23 095 50 268 37 511 3 215 233 349 26 221 17 067 433 501 9 19 13 21 16 79 11 10 23
Technicians and associate professionals 64 623 24 207 69 577 90 618 5 091 9 726 31 444 28 229 323 515 14 20 18 52 25 3 14 16 17
Clerical support workers 153 574 21 506 36 764 10 474 2 518 11 708 64 032 27 822 328 398 33 18 10 6 12 4 28 16 18
Service and sales workers 43 084 14 162 17 460 20 945 2 077 11 845 52 315 39 059 200 947 9 12 5 12 10 4 23 22 11
Skilled agricultural, forestry, fishery, craft and related trades workers 8 675 6 574 104 772 1 960 811 2 771 7 439 18 572 151 574 2 5 27 1 4 1 3 11 8
Plant and machine operators, and assemblers 7 705 4 057 22 972 1 354 545 1 109 5 226 8 641 51 609 2 3 6 1 3 0 2 5 3
Elementary occupations 22 977 6 867 17 628 3 917 0 4 842 9 042 9 711 74 984 5 6 5 2 0 2 4 6 4
Total 471 896 121 026 382 719 175 410 20 317 295 185 228 934 175 631 1 871 118 100 100 100 100 100 100 100 100 100
Source: Author’s calculations from Labour Market Dynamics, StatsSA (2014b)

84 Skills supply and demand in South Africa
7CHAPTER

SKILLS SUPPLY AND DEMAND: KEY FINDINGS AND RECOMMENDATIONS
Skills supply and demand in South Africa 85

Skills supply and demand: Key findings and recommendations
86 Skills supply and demand in South Africa
The findings from the analysis of skills supply and demand and the interaction of supply and demand signals provide skills planners with signals for credible skills planning. The argument has been made that we need contextually appropriate models for skills planning that take into account the challenges of economic growth and inclusive development in South Africa. Given the multiple development pathways confronting South Africa, skills planning is not only about matching supply and demand in the formal private and public sector more effectively (which is a difficult task in and of itself, given the data challenges in SA), but also about taking into account past structural inequalities on the basis of race, gender and spatial location. The skills planning focus is not only for a small number of skilled people in the workplace, but also on the unemployed, the youth, low-skilled people, the marginalised, and those in vulnerable forms of employment, including people who work for themselves. At the heart of the response is the need to deliver skills that respond to the current and future economic trajectory being followed by South Africa (and not only the critical or scarce skills that are targeted at a minority of the country’s population).
The policy reform agenda must consider how to respond to skills demands and mismatches for different groups; initiate wider reforms in the education and training system; raise demand to support employment growth; raise skill levels in targeted sectors of the economy; as well as respond to the development trajectory being followed by South Africa. This
includes a formal sector with a large number of semi-skilled and low-skilled jobs, and a smaller number of high-skilled jobs. The number of people without work is increasing, especially the youth, for whom education and skills development as well as creation of jobs which match their skill level are priorities. The dilemma facing policy makers is how to respond to these diverse sets of development pathways, and deciding how resources should be targeted for skills development. These imperatives may seem paradoxical, but all are essential for more inclusive growth and development.
This chapter begins with a summary of key skills supply and demand issues facing South Africa and then presents key recommendations for skills planning, followed by specific recommendations to follow a more inclusive approach to skills development.
KEY TRENDS IN SKILLS SUPPLY AND DEMAND IN SOUTH AFRICAWe documented the state of the economy, described the characteristics of the employed and unemployed who make up the labour force, examined changes in the structure of the economy to provide signals on the nature and extent of skills in demand. This was followed by an analysis of the supply and potential supply of skills resulting from formal education, universities and the Technical Vocational Education and Training (TVET) colleges system. Thereafter, we examined the interaction between skills supply and demand to understand mismatches in the shape of the economy, in the educational skills produced and about the labour market destinations of those with post-school qualifications.
What have we learnt?
Since 1994, the South African economy has been characterised by low growth rates, persistent high unemployment rates and rising inequality This has led to dire outcomes in the labour market. Employment growth has not been sufficient to absorb a rapidly growing labour force, with the result being an inordinately high and
noticeably inertial unemployment rate. A further constraint to sustainable job creation in South Africa is the structural mismatch between labour demand and supply. The post-apartheid economy has delivered an economy characterised by an eroding primary sector, and a weak and un-dynamic Manufacturing sector; growth has instead been built on large capital-intensive industries, and a rapidly growing Services sector. Economic growth, while low, has favoured high-skilled workers, despite the fact that the majority of those in employment and the unemployed population are semi-skilled or low-skilled. The failure to grow the Agriculture and, in particular, the Manufacturing sector, has therefore resulted in an economy starved of low-skill, low-wage jobs. Into this breach has stepped a public sector, with the unintended consequence that it has become a key node of employment generation in the South African economy. This pattern of growth and its attendant employment outcomes are neither desirable nor sustainable.
South Africa has a high and growing level of unemployment, especially among the youthThe South African labour force is made up of 15 million employed and 7.5 million unemployed people. The most recent data shows 87% of unemployed people are from the African population group, 60% of the unemployed have less than a grade 12 certificate, and 45% are between the ages of 15 and 34 years. The rate of growth of the working-age population is twice the rate of growth of new entrants to the labour market. This has especially impacted the youth, and is partly magnified by new entrants (with less than a completed secondary education) coming into the labour market. Unemployment presents a major social and skills challenge.
The level of education in South Africa is lower than in most economically productive countriesSince 1994, access has expanded in the basic and post-school education and training levels. Now, the challenge facing the education and training system is completion levels and

Skills supply and demand: Key findings and recommendations
CHAP
TER
7
Skills supply and demand in South Africa 87
quality outcomes. By all achievement measures, the quality of basic education, although slowly improving, is still low, and the challenge to raise the levels of literacy and numeracy remains. This is a major concern considering that even in an economy based on a low-skill trajectory, a workforce that has completed its school-leaving certificates and gained basic numeracy and literacy skills is required. While South Africa has improved its educational outcomes in the last decade, the pace of this improvement is not commensurate with the level of investments made by both the state and private sector for education.
Poor-quality outcomes in the schooling system create significant problems for those entering TVET colleges and universities. Within both these sectors there have been improvements to access, with enrolment levels expanding across all subject areas. TVET sector enrolments have grown much faster than the University sector, and TVET completers could provide a useful skill sets to support economic growth. However, the completion rates at both universities and TVET colleges are low. This is exacerbated for Science and Engineering degrees and diplomas, as well as the professional Commerce degrees, qualifications which are key for economic development. The low number of school completers with high-quality passes and the poor completion rates of those who register for tertiary qualifications lead to a low supply of skilled tertiary education completers to the labour market.
In addition to the poor levels of educational outcomes from the school and post-school sectors, the education level of the present working-age
population is also low. One fifth of the employed have a tertiary qualification. For a competitive economy, South Africa must raise the educational level of the workforce.
Presently, around 140 000 grade 12 students complete the matriculation examination with a bachelor’s pass, and of these around 50 000 students pass Mathematics with a score higher than 50%. This forms a relatively small pool of students who can potentially access university and Science-based TVET programmes, in comparison to the skill demands in the country.
In 2014, there were around 1.2 million students in the University sector and 0.8 million students in the TVET sector. By all accounts, significant proportions of students do not progress successfully through their courses and programmes. The low progression and success rates mean that there is an even smaller pool of graduates to form the future highly skilled workforce.
Of the labour force, close to half of the employed (7.25 million) and 60% of the unemployed (4.5 million) do not have a grade 12 (matric) certificate. This means that 11.75 million of the labour force have less than a grade 12 certificate. This represents a large portion of the population who could benefit from education and training programmes. In 2014, only 1.6% of the unemployed participated in SETA-supported learning programmes.
From our analysis we identified three types of mismatches related to skills and the economy.
Skills mismatch refers to various types of imbalances between skills offered and skills needed in the world of work. For South Africa we categorised mismatches
into three types: demand mismatch. educational-supply mismatch and qualifications-job mismatch. Demand mismatch examines the shape and trajectory of the economy, the types of jobs that are being created, and the skills set and expectations of the working-age population. Educational supply mismatch examines how supply responds to areas of skills demand. Qualification-job mismatch examines the qualification gaps for skilled jobs and then traces the sectors and occupations that the educational qualifications are absorbed into.
At the demand level, as referred to earlier, there is a structural mismatch between labour demand and supply, in that the South African economy and labour market is characterised as one where there is a demand for high skill, but a surplus of low-skilled workers.
The implication from the education supply mismatch is the need to enrol and graduate higher numbers of STEM graduates at both universities and TVET colleges. Further, there is a need for more higher enrolments and completions in the building and construction, metal, machinery and related trades programmes.
The qualification-job mismatch reveals that there is a qualification gap in that less than half of managers, senior officials, technicians and associate professionals had a tertiary level qualification. Secondly, the evidence highlights the sectors and occupations workers with tertiary qualifications enter. The Higher Education graduates tended to be employed in the high-skilled occupations as managers, professionals, and technicians and associate professionals. In the case of those with TVET qualifications, it is a surprise to see that only a minority worked as technicians and associate professionals. Nearly half of the Higher Education graduates are employed in the community, Social and Personal Services sector, which is dominated by the public sector. A high proportion of the Science and Engineering graduates, from both higher and technical vocational education sectors, prefer to work in the financial services sector, as opposed to the manufacturing sector.
A structural mismatch between labour demand and supply is the most significant type in the South African context, in that the economy and labour market show a demand for high skilled workers, but there is a surplus of low-skilled workers.

Skills supply and demand: Key findings and recommendations
88 Skills supply and demand in South Africa
Progress on race and gender transformationThe shares of African and female workers in the workforce have been increasing, but African females are still the most disadvantaged group. With the present data we cannot, with confidence, comment about shifts in participation by race and gender at the occupational level.
The levels of education of the workforce, especially for the African population, have been increasing. The enrolment and graduations, by population group, at both universities and TVET colleges has been increasing and is now closer to South Africa’s demographic profile.
From 2010 to 2014 shares of female students in both the University and TVET sectors increased, and recently surpassed the shares of male enrolments. However, an analysis of university completers shows that qualification differences support gender stereotypes in the literature, in that males are likely to study for the so-called masculine science, technology, and engineering-based subjects, whereas females are focused on so-called feminine subjects, such as health, education, and social sciences. Thus a reformed skills policy must focus on re-ordering this gender bias in higher educational outcomes.
Improving data for an accurate picture of supply and demand for informed skills planning The analysis of skills supply and demand requires appropriate and credible data. The key data sources used in this report are the StatsSA Quarterly Labour Force Survey (QLFS) and Labour Market Dynamics data, as well as the Higher Education Management Information Systems data (data for the Higher Education system is more reliable than data for the TVET sector). We recognise that these datasets are being updated and our findings must be interpreted in that context.
For scientifically credible and reliable estimates we were only able to report on occupations at the 2-digit level for certain years. It should be noted that, in our estimations of the employed
and signals of shortages in sectors and occupations, we have not factored in vacancies. Thus our analysis may give an incomplete and, in some instances, may not provide a comprehensive picture of skills demand.
South Africa does not as yet have a credible enterprise survey, which creates a major data gap. A credible enterprise survey could have provided richer information about employees and the types of workplace training that occur. Other key labour market data that is essential for skills planning is student tracking and destination studies, and skills requirements for both private sector expansion and government growth plans.
KEY RECOMMENDATIONS FOR SKILLS SUPPLY AND DEMANDOur recommendations are based on an approach to skills planning that takes into account the challenges of economic growth and inclusive development in South Africa. The skills planning focus is not only on a small number of skilled people in the workplace, but also on the unemployed, the youth, low-skilled people, the marginalised, and those in vulnerable forms of employment, including the self-employed. The dilemma facing policy makers is how to respond to these diverse sets of development and occupational pathways, and decide how resources should be targeted for inclusive skills development. These imperatives may seem paradoxical, but all are essential to achieve a more inclusive growth and development trajectory.
We make five key recommendations.
CHALLENGES FOR ECONOMIC GROWTH AND DEVELOPMENTRecognising that the South African jobs and skills history profile is different from the East Asian or European contexts, the economy must respond to the twin challenge of participating in a globally competitive environment, which requires a high skills base and a local economy that creates low-wage jobs (with supported training) to absorb the large numbers of persons who are unemployed or in vulnerable jobs.
The economy should start moving towards more labour-intensive forms of growth in order to absorb the growing numbers of people, particularly young people, entering the labour market in search of jobs. This will require significant changes to both industrial policy and the development pathways being pursued by the country.
STRONGER CO-ORDINATION BETWEEN GROWTH AND INDUSTRIAL POLICIES AND SKILLS POLICIESMore government co-ordination is needed, including stronger integration of government departments’ growth strategies and strategies targeting skills development and education. Currently there are many national and provincial-level strategies that aim to promote local economic development and deal with unemployment. These growth plans take into account skills requirements, or they will likely experience difficulties in implementation. Therefore, government departments must realistically estimate the skills needed for the implementation of the strategy and plan their human resource strategy in advance.
IMPROVED LEVELS OF EDUCATION AND SKILLS The Education and Training sector has a triple responsibility: To improve the levels of education of the population, to improve the skills sets of the youth, to increase supply in areas identified as in demand for the present and future economy and to support inclusive growth. We recommend the following regarding education and skills.
• Improve the quality of basic education. The key constraint to higher levels of education is the quality of basic education, especially in the Numeracy/Mathematics and Literacy/Languages areas. The Department of Basic Education must improve the quality of educational experiences leading to improved educational outcomes.
• At the professional level there is a demand for STEM graduates. STEM graduates are needed for management occupations, engineering professions, medical professions, as well as for teaching

Skills supply and demand: Key findings and recommendations
CHAP
TER
7
Skills supply and demand in South Africa 89
professions. It is clear that STEM graduates have a set of versatile skills and therefore they can, and do, work in different sectors. The implication for education and training is that there is a need to enrol and graduate higher numbers of STEM graduates than are required by current levels of STEM occupations. We must increase the number of teachers particularly in the area of secondary school Mathematics and Science teachers as well as ECD professionals.
• For managers, there is a need to increase the supply of graduates in certain technical subjects. These graduates should then be supported by improved professional workplace experience and mentorships to gain management skills.
• At the technician level, there is an under-supply of engineering technicians and associate professionals, as well as building and construction, metal, machinery, electronic and electrical and related trades.
• With high levels of youth unemployment, the majority having either incomplete or completed secondary education, there is a strong argument to prioritise appropriate skills training for this group. The SETAs are mandated to play a key role in this process, especially for those who have minimal skills and face difficulties gaining employment.
• The National Plan for Higher Education targets and fundings should be reviewed to increase the shares of SET enrolments in university courses from the present 30% to 35%, especially in the areas of Engineering and Health Professions.
• The TVET sector must develop enrolment targets in line with skills needed for the labour market, and we recommend a target of 45% for NCV4 and NATED6 (N6) Engineering courses.
IMPROVED MATCH BETWEEN FIELD OF STUDY AND LABOUR MARKET DESTINATIONOver half of the country’s graduates enter the Community and Social Services sector, which is dominated by the public sector. These positions
offer graduates a relatively good salary, job security and other social benefits, such as healthcare and pensions. Unfortunately, this is distorting the labour market and not attracting graduates to the private sector labour market. Globally, the private sector is a key generator of jobs and growth, and the South African private sector must review its human resource strategies to attract more graduates to the sector.
IMPROVE THE EVIDENCE BASE FOR FUTURE REPORTSThe Department of Higher Education and Training must work closely with Statistics South Africa and the other relevant government departments to collect data for skills planning using their administrative data sets. This can be accomplished by participating and engaging in the National Statistics System (NSS) of StatsSA. Going forward, data on vacancies, immigration and emigration (including data about educational levels, employment sectors and occupations) must be included in future reports. A credible enterprise survey could have provided richer information about employees and the types of workplace training that occurs. Other key labour market data that is essential for skills planning is student tracking and destination studies, and skills requirements for both private sector expansion and government growth plans. Future reports must furthermore include skills forecasting models based on contextually appropriate methodologies.
SPECIFIC RECOMMENDATIONS FOR THE EDUCATION AND TRAINING SECTORIMPROVED EDUCATION AND SKILLS LEVELS OF THE POPULATION• Improve the quality of basic
education. The key constraint to higher levels of education is the quality of basic education, especially in the Numeracy/Mathematics and Literacy/Languages areas. The Department of Basic Education must improve the quality of educational experiences leading to improved educational outcomes.
• Expand the provision of Community Education and Training (CET) college programmes: We should increase the education level of the population so that higher levels of the population achieve NQF level 4 qualification. Given the high numbers of the employed and unemployed with a less than NQF level 4 qualifications, these groups must be targeted to have their skills upgraded through CET programmes.
• Enhance the capacity of CET colleges to deliver basic skills training linked to the labour market: A national policy for community colleges was developed in 2014. However, many community colleges do not have effective capacity or staff to deliver effective basic skills training. An initiative for improving the capacity of teachers to deliver the CET college programmes must be fast-tracked, and appropriate learning materials developed, including innovative mechanisms for delivery. This must be supported with improved planning at CET colleges so that basic skills training is more closely aligned to the local economic situation.
EDUCATION AND QUALIFICATION LEVELS TO SUPPORT HIGH-SKILLED OCCUPATIONS• Enrolment targets for STEM areas
must be raised: There is a growing demand for higher-level skilled workers. Specific growth is being experienced in the STEM level occupations. These graduates are vital for innovation and technical
The education supply mismatch currently experienced highlights the need to enrol and graduate higher numbers of STEM graduates from both universities and TVET colleges.

Skills supply and demand: Key findings and recommendations
90 Skills supply and demand in South Africa
advancement. Our recommendation is that enrolment levels for STEM subjects at universities should be expanded. Currently, enrolment level targets at universities are set at 30% for STEM-based subjects and 40% for Humanities. We recommend a change in the funding formula to 35% for the STEM category of subjects, 35% for Humanities and 30% for the Business and Management category.
• Expand enrolment levels for certain education professionals: Evidence highlights that demand for education professionals in particular subject areas is increasing. This has been driven by two factors: present shortages in the education system; and the numbers of those expected to retire over the next five years. Specific occupations that need to be developed include ECD experts, Science teachers, and secondary school teachers. According to the available evidence, 20 000 school teachers need to be trained each year to meet current and future demand.
The Funza Lushaka programme that supports students registered to become teachers must continue and be expanded for specific subject disciplines.
• Management programmes at the Higher Education level should target technical areas and encompass a workplace development component: Demand for managers is increasing and is especially high for the following areas: production and services, administrative and commercial managers, health, hospitality, retail, health and safety. Management programmes at universities should be designed for these technical areas and not only generic management or business degree programmes. However, effective managers in these areas cannot be developed through degree-level programmes alone. There is a need for continual development and mentorship within the workplace for specific managers. This should be facilitated by SETAs and involve improved engagement between universities and employers in priority service sectors.
• Upgrade the skills of existing managers through customised programmes involving TVET colleges: Managers have been one of the highest growing occupational areas over the past four years. They are vital for improving the effectiveness and performance of organisations in the public and private sectors. Currently, only around 45% of managers have a tertiary level qualification. This is low by international standards and needs to be raised. SETAs can play a key role in bringing employers and TVET colleges together to develop continuous, accredited professional development programmes for managers in the workplace.
• Establish attainment targets for technicians to obtain tertiary level qualifications: Outside of managers, one of the highest areas of demand is for technician and associate professionals. In the past, this group was regarded as semi-skilled, but in the global context they are recognised as skilled workers. Unfortunately, in
South Africa only 44% of technicians have a tertiary level qualification. This is low by international standards and attainment targets must be established for these workers to obtain tertiary level qualifications.
EDUCATION AND QUALIFICATION LEVELS TO SUPPORT SEMI-SKILLED OCCUPATIONS• Raise the qualification level of
programmes delivered by TVET colleges: At present only 40% of enrolments at TVET colleges are for programmes leading to NQF level 5 and 6 qualifications. This number is low, and reflects that many colleges are attempting to redress the failures of the formal school system. While this effort is commendable, emphasis within the tertiary education system should also be on raising qualification levels to beyond NQF level 4.
• Develop targets for the technical subjects studied at intermediate level: The data for 2014 shows that at NQF level 4, only 35% of students are enrolled in Engineering programmes. The majority is enrolled in either Business (46%) or service-level programmes. At NQF level 6, a lower amount (28%) of students were enrolled in Engineering programmes for 2014. Programmes leading to technician level qualifications should be tailored more towards technical subjects, and hence enrolment targets need to be set by DHET. We suggest that 45% of the TVET enrolments should be in Science and Engineering programmes.
• Improve pass rates for technical subjects studied at the intermediate skill qualification level: Available evidence suggests that there is much wastage occurring in the training of people at an intermediate level. On average, around 60% of students fail to complete their programmes and obtain a qualification. The failure rate for those in N6 Engineering programmes is around 50%. Attention must be given as to why the failure rate is so high and how it can be adjusted, especially for technical-based subjects.
Qualification-job mismatch revealed that nearly half of the higher education graduates are employed in the Community, Social and Personal Services sector and a high proportion of the Science and Engineering graduates, from both higher and technical vocational education sectors, prefer to work in the Financial Services sector, as opposed to the manufacturing sector.

Skills supply and demand: Key findings and recommendations
CHAP
TER
7
Skills supply and demand in South Africa 91
• Improve the placement of those with TVET qualifications into technician positions: Currently, only a minority of those with TVET qualifications enter technician jobs. The evidence shows that only 17% of those with a TVET qualification work as technicians, and 18% as clerical workers. A better match must be achieved between those studying for a TVET-based qualification and the proportion entering technician positions. SETAs must play an improved role in linking colleges with potential employers, and facilitating TVET graduates into technician positions.
• SETAs must play a more active role in supporting the development of intermediate skills: Currently, there are around 7.5 million workers and 4.8 million unemployed persons in the labour market with less than a grade 12 qualification. This group is in urgent need of upskilling and represents the bulk of the workforce that could benefit from training. In 2014, SETAs only supported 77 000 workers and the unemployed through learnerships. This represents a very small percentage of the total workforce who could benefit from training. SETAs must work more effectively with education and training providers and employers to deliver this training. The recent White Paper on post-school education and training identified this as a new priority role for SETAs.
EDUCATION AND QUALIFICATION LEVELS TO SUPPORT TRADE OCCUPATIONS• Introduce the workforce with
under grade 12 qualifications to trade occupations: Some signals highlighted the demand for trade workers, particularly for building and trade-related workers, metal, machinery and related trades, and electrical and electronic trades. At the same time, there is a significant number of people with under grade 12 qualifications, both in the workplace and that are unemployed. This target group should be directed into trade occupations, as these skills can be developed in a shorter period
of time. The responsible party for directing people into such training and occupations is SETAs.
• Increase the share of government funds to trade-related skills by formal accredited providers: Currently a higher number of short-term occupationally directed training is provided by private FET colleges. The SETAs must make funds available to support provision and regulation of this training, either directed through public TVET colleges or through competition among private providers.
• Facilitate the expansion of on-the-job training for trade occupations: Many government interventions and public resources have supported on-the-job training, but this tends to focus on higher-level skills, leading to qualifications above grade 12 (and not trade skills). A significant proportion of the trades can only be developed through on-the-job training, and this must be supported.
CONCLUDING REMARKS The identification of skills demand and mismatches, and the corresponding policy response, have focused on increasing supply through improved funding to education and training providers and the workplace. For nearly all occupational areas there are structures in place to increase supply.
For certain occupations, our recommendations pointed to the importance of introducing changes to the workplace. The nature of work has changed, and the way workplaces are organised, including human resources strategies, therefore also need to adapt to the needs of our complex economy. But not only that, these strategies should also be aligned to the individual needs and preferences of the labour force. Within the private sector, there is a need to ensure that the appropriate attraction and retention strategies are in place. Many researchers in the skills field have also pointed out that such measures should be accompanied by attempts to raise demand in the workplace, helping companies to
improve productivity and support moves up the value chain. These are commendable arguments, but given the existing educational quality problems, emphasis should be on improvements at existing levels before attempting to raise demand.
The skills demands identified in this report have focused on occupations that are in high demand now or will be in the near future. Studies from other countries emphasise the need to focus on the longer term and anticipate the future demand for skills. This would seem like a good idea, but the reality is more complex. It is important to construct appropriate skills forecasting methods and tools and, given the unpredictability of the global and national economies, recognise the limitations associated with these forecasts.
This document is one of the first attempts in South Africa to undertake a comprehensive analysis of the demand and supply of skills, attain understanding about priority areas, and develop corresponding responses. There are a number of shortcomings in this work, but the present research will provide a template for moving forward and undertaking a more detailed analysis in the future. For the next report on Skills Supply and Demand in South Africa, we need to re-visit Government Gazette No 39319 (The Framework for the Annual Report on Skills Supply and Demand in South Africa), and modify the framework in relation to the conceptual framework and learnings from this report and in relation to available data.

92 Skills supply and demand in South Africa
ANNEXURES

APPENDICES AND ADDITIONAL INFORMATION
Skills supply and demand in South Africa 93

Appendices and additional information
94 Skills supply and demand in South Africa
Examination enrolments and completions in NCV4 programmes in public TVET colleges (2010, 2013, 2014)
2010 2013 2014 2010 2013 2014
Number who
wroteexams
Number completed
Number who
wrote exams
Number completed
Number who
wrote exams
Number completed
% completed
%completed
%completed
Civil Engineering, Building and Construction 741 135 1 510 398 1 471 329 18.8 27 22.4
Electrical, Infrastructure and Construction 1 444 433 2 682 778 2 489 595 30.0 29 23.9
Engineering and Related Design 1 419 376 2 533 593 2 368 520 26.5 24 22.0
Information Technology and Computer Studies 603 116 1 227 254 1 041 130 19.2 21 12.5
Mechatronics 191 56 157 49 30 31.2
Process Plant Operations 44 20 33 5 46 15.2
Engineering 4 207 1 060 8 187 2 099 7 559 1 628 25.2 25.6 21.5
Education and Development 431 263 491 288 61 58.7
Hospitality 518 199 1 169 429 1 343 532 38.4 37 39.6
Safety in Society 210 118 789 388 845 336 56.2 50 39.8
Tourism 557 345 1 062 670 1 268 748 61.9 63 59.0
Transport and Logistics 160 49 30.6
Services 1 285 662 3 451 1 750 4 107 1 953 52 51 48
Finance, Economics and Accounting 901 314 1 793 506 1 773 412 34.9 29 23.2
Management 538 219 1 127 499 1 012 447 40.7 45 44.2
Marketing 419 191 1 138 441 1 112 381 45.6 39 34.3
Office Administration 2 226 1 171 5 685 2 664 5 902 2 584 52.6 47 43.8
Business 4 084 1 894 9 743 4 110 9 799 3 824 46 42 39
Primary Agriculture 327 98 549 155 711 219 30 29 30.8
Other 327 98 549 155 711 219 30 29 30.8
Source: HEMIS (2010 to 2014). National Examinations Database (November 2013)
APPENDIX 1

Appendices and additional information
ANNE
XURE
S
Skills supply and demand in South Africa 95
Examination enrolments and completions in NATED6 programmes in public TVET colleges (2010, 2013, 2014)
2010 2013 2014 2010 2013 2014
Number who
wroteexams
Number completed
Number who
wrote exams
Number completed
Number who
wrote exams
Number completed
% completed
%completed
%completed
Engineering Studies 18 642 8 611 15 928 7 925 46 49.8
Engineering 18 642 8 611 15 928 7 925 46 49.8
Educare 727 349 1 924 1 310 48 68.1
Hospitality and Catering Services 514 154 1 010 455 30 45.0
Public Relations 603 132 892 220 22 24.7
Tourism 382 151 802 382 40 47.6
Services 2 226 786 4 628 2 367 35 57
Financial Management 4 118 1 131 6 820 2 910 27 42.7
Marketing Management 2 343 496 3 902 1 443 21 37.0
Public Management 1 630 554 2 599 1 046 34 40.2
Human Resources Management 5 485 1 393 8 698 3 503 25 40.3
Business Management 4 900 877 8 356 2 388 18 28.6
Farming Management 110 29 233 76 26 32.6
Legal Secretary 5 1 8 3 25 37.5
Management Assistant 3 131 1 256 5 437 2 516 40 46.3
Business 21 722 5 737 36 053 13 886 26 39
Art and Design 118 70 244 131 59 53.7
Clothing Production 92 43 126 70 47 55.6
Popular Music: Performance 23 12 16 6 50 37.5
Popular Music: Studio Work 18 9 19 12 50 63.2
Other 251 134 405 219
Source: HEMIS (2010 to 2014). National Examinations Database (November 2013)
APPENDIX 2

Appendices and additional information
96 Skills supply and demand in South Africa
Total enrolment in universities by type of CESM field of study 2010 to 2014
CESM FIELDS
NUMBERS SHARES
2010 2011 2012 2013 2014 2010 2011 2012 2013 2014
BUSINESS. ECONOMICS AND MANAGEMENT STUDIES 278 843 288 487 282 299 279 954 272 409 31.2 30.8 29.6 28.5 28.1
SCIENCE, ENGINEERING AND TECHNOLOGY 251 334 264 447 273 279 283 622 287 221 28.0 28.0 28.0 29.0 29.6
Science 129 545 135 826 140 517 146 325 158 742 14.5 14.4 14.7 14.9 16.3
Agriculture, Agricultural Operations and Related Sciences 14 514 16 915 18 110 18 277 28 787 1.6 1.8 1.9 1.9 1.9
Architecture and the Built Environment 11 624 10 804 11 022 11 141 11 262 1.3 1.2 1.2 1.1 1.2
Computer and Information Sciences 38 075 36 891 39 369 40 871 40 613 4.3 3.9 4.1 4.2 4.2
Family Ecology and Consumer Sciences 2 641 2 967 3 120 3 384 3 390 0.3 0.3 0.3 0.3 0.3
Life Sciences 22 044 22 093 24 700 26 087 27 683 2.5 2.4 2.6 2.7 2.9
Physical Sciences 24 769 24 752 27 846 28 948 30 165 2.8 2.6 2.9 2.9 3.1
Mathematics and Statistics 15 835 21 359 16 331 17 525 16 839 1.8 2.3 1.7 1.8 1.7
Military Sciences 43 45 19 92 3 0.0 0.0 0.0 0.0 0.0
Engineering 71 172 77 150 78 128 81 336 82 433 8.0 8.2 8.2 8.3 8.5
Health and Related Clinical Sciences 50 614 51 468 54 635 55 962 56 074 5.7 5.5 5.7 5.7 5.8
HUMANITIES 362 749 385 266 397 792 420 122 409 525 41 41 42 43 42.3
Visual and Performing Arts 12 669 13 571 13 375 13 510 13 573 1.4 1.4 1.4 1.4 1.4
Education 145 413 164 939 168 608 172 991 166 099 16.3 17.6 17.7 17.6 17.1
Other Humanities and Social Sciences 204 662 206 739 215 797 233 622 229 853 22.9 22.0 22.6 23.7 23.7
Communication, Journalism and Related Studies 21 628 21 591 20 765 22 452 21 393 2.4 2.3 2.2 2.3 2.2
Languages, Linguistics and Literature 24 109 18 594 18 971 21 587 21 910 2.7 2.0 2.0 2.2 2.3
Law 47 084 49 577 51 923 55 489 56 723 5.3 5.3 5.4 5.6 5.9
Philosophy, Religion and Theology 5 835 5 842 6 183 6 722 6 709 0.7 0.6 0.7 0.6 0.7
Psychology 33 601 31 110 29 788 33 927 32 465 3.8 3.3 3.1 3.4 3.3
Public Management and Services 30 663 31 443 33 750 34 878 33 152 3.8 3.4 3.5 3.5 3.4
Social Sciences 41 742 48 582 54 417 58 567 57 501 5.0 5.0 6.0 6.0 5.9
Total 892 936 938 201 953 373 983 698 969 155 100 100 100 100 100
Source: HEMIS (2010 to 2014)
APPENDIX 3

Appendices and additional information
ANNE
XURE
S
Skills supply and demand in South Africa 97
Number and shares of students who fulfilled the requirements for a degree or diploma per CESM field of study, 2010 to 2014
CESM FIELD OF STUDY
NUMBERS SHARES
2010 2011 2012 2013 2014 2010 2011 2012 2013 2014
BUSINESS. ECONOMICS AND MANAGEMENT STUDIES 41 657 44 155 46 044 49 051 50381 27.2 27.5 27.7 27.1 27.2
SCIENCE, ENGINEERING AND TECHNOLOGY 42760 46100 48848 53 176 55 574 27.9 28.7 29.4 29.4 30.0
Science 21 356 23 282 25 196 27 525 28 931 14.0 14.5 15.1 15.2 15.6
Agriculture, Agricultural Operations and Related Sciences 2 580 3 029 3 320 3 703 3 878 1.7 1.9 2.0 2.0 2.1
Architecture and the Built Environment 2 907 3 106 3 055 3 172 3 226 1.9 1.9 1.8 1.8 1.7
Computer and Information Sciences 4 756 5 145 5 887 6 564 6 796 3.1 3.2 3.5 3.6 3.7
Family Ecology and Consumer Sciences 479 543 554 637 699 0.3 0.3 0.3 0.4 0.4
Life Sciences 4 405 4 583 5 272 5 731 6 070 2.9 2.9 3.2 3.2 3.3
Physical Sciences 4 188 4 428 4 939 5 223 5 749 2.7 2.8 3.0 2.9 3.1
Mathematics and Statistics 2 036 2 436 2 162 2 492 2 512 1.3 1.5 1.3 1.4 1.4
Military Sciences 5 12 7 3 1 0.0 0.0 0.0 0.0 0.0
Engineering 10 200 11 084 11 696 13 284 14 077 6.7 6.9 7.0 7.3 7.6
Health 11 201 11 733 11 958 12 368 12 567 7.3 7.3 7.2 6.8 6.8
HUMANITIES 68 908 70363 71096 78 596 79420 44.9 43.8 42.8 43.5 42.8
Arts 2 867 2 908 3 154 3 042 3 098 1.9 1.8 1.9 1.7 1.7
Education 37 892 37879 35478 38 212 37076 24.7 23.6 21.4 21.1 20.0
Other Humanities and Social Sciences 28 149 29 574 32 463 37 342 39 247 18.4 18.1 19.6 20.7 21.2
Communication, Journalism and Related Studies 2 983 3 244 3 557 3 916 4 038 1.9 2.0 2.0 2.2 2.2
Languages, Linguistics and Literature 2 523 2 795 3 121 3 654 3 595 1.6 1.7 1.9 2.0 1.9
Law 5 290 5 560 5 989 6 721 7 270 3.5 3.5 3.6 3.7 3.9
Philosophy, Religion and Theology 1 201 1 219 1 297 1 349 1 341 0.8 0.8 0.8 0.7 0.7
Psychology 5 259 5 235 5 654 6 756 6 853 3.4 3.3 3.4 3.7 3.7
Public Management and Services 4 619 5 205 5 623 6 327 6 369 3.0 3.2 3.4 3.5 3.4
Social Sciences 6 274 6 316 7 224 8 620 9 781 4.1 3.9 4.4 4.8 5.3
Total 153325 160623 165986 180 823 185385 100 100 100 100 100
Source: Author’s calculations from HEMIS (2010 to 2014)
APPENDIX 4

Appendices and additional information
98 Skills supply and demand in South Africa
Skills requirements from major national, provincial and metropolitan development strategies
Policy document Type of skills required Skills category Skills requirements
City of Cape Town Poverty Alleviation and Reduction Policy
Skills relevant to the Expanded Public Works Programme (EPWP)
Low Unspecified
Department of Rural Development and Land Reform Strategic Plan 2015 – 2020
Geomatics and spatial planning skills High Unspecified
Department of Trade and Industry Strategic Plan
Unspecified Unspecified Unspecified
Eastern Cape Vision 2030 Provincial Development Plan
Agriculture, manufacturing, construction, tourism, social economy, knowledge-based services
High, medium, low 113 000 jobs in agriculture 166 000 in manufacturing 149 000 in construction 130 000 in tourism 70 000 in social economy employment 140 000 in knowledge-based services
eThekwini Economic Development and Job Creation Strategy
Construction, engineering Low, high Unspecified
eThekwini Integrated Development Plan (IDP) Unspecified Unspecified Unspecified
Gauteng Province Department of Economic Development Strategic Plan
Unspecified Unspecified Unspecified
Human Resource Development Strategy for South Africa (HRD-SA) 2010 to 2030
Design, engineering and artisanship, particularly skills critical to the manufacturing, construction and cultural industries
High Unspecified
Industrial Policy Action Plan Technical and high-level design skills for manufacturing
Skills across the plastics value chain, Broad-based skills within the saw-milling industry
High, medium, low Unspecified
Innovation Towards a Knowledge-Based Economy, Ten-Year Plan for South Africa (2008 to 2018)
Science, engineering and technology High 3 000 SET PhDs graduated in South Africa per year
Jo’burg 2040 Growth and Development Strategy
Unspecified Unspecified Unspecified
KwaZulu-Natal Provincial Growth and Development Strategy
Business management, finance and entrepreneurship for SMEs
Low Unspecified
Limpopo Development Plan 2015 to 2019 Engineering, healthcare, social development, research and development
High Unspecified
Medium-Term Strategic Framework Artisans Medium 18 110 in 2013 to 24 000 per annum by 2019
PhD graduates High from 1 870 per year in 2013 to 2 400 per year by 2019
Engineering science human and animal health
High 57 000 over the five-year period – 9 974 were produced in 2012
Natural and physical sciences High (45 000 over the five-year period – 8 015 were produced in 2012)
Teacher graduates Medium 36 000 over the five-year period – 6 366 were produced in 2012
20 000 by 2019, an increase from 13 740 in 2012
National Department of Tourism Strategic Plan Unspecified Unspecified Unspecified
APPENDIX 5

Appendices and additional information
ANNE
XURE
S
Skills supply and demand in South Africa 99
Policy document Type of skills required Skills category Skills requirements
National Development Plan Labour-intensive services and industry Predominantly low, but also some medium and high skills
5.9 million jobs by 2020 and 11 million jobs by 2030
National Skills Development Strategy III Unspecified Unspecified Unspecified
New Growth Path Positions within the manufacturing industry. Otherwise unspecified. Some demand in the services sector for finance, public administration, and business management skills
High, medium, low 330 000 low skilled 860 000 medium skilled 13 000 highly skilled openings
North West Provincial Development Plan Advanced agricultural Unspecified Unspecified
South African National Infrastructure Plan Job creation in construction, supply and productive sectors. Skills demand in engineering, planning, architecture, and public administration
Low, high, medium Shortages in 90 OFO occupations, 35 of which were in the SET fields: five were in management, 30 for professions, 14 for technician and associate professionals, two for services and clerical, 16 for trades workers, seven for plant or machine operators, 16 for elementary workers
South African Tourism Strategic Plan Unspecified Unspecified Unspecified
Support for Astronomy and the SKA Facility Job creation at the SKA facility in the capacity of planning, construction, installation of technical equipment, software development, maintenance, and astronomical research
High Unspecified
Tourism Development Framework for the City of Cape Town
Tourism, SME management Unspecified Unspecified
Tshwane Vision 2055 Unspecified Unspecified Unspecified
Western Cape Government Provincial Strategic Plan
Agri-processing skills, engineering and technical skills for oil and gas exploitation
High, medium and low for agri-processing, high for oil and gas
100 000 jobs across all skill levels in agri-processing
60 000 high skill jobs in oil and gas exploration
Youth Enterprise Development Strategy Entrepreneurial skills, business management
Medium, low Unspecified
APPENDIX 6Number of occupations in demand for the implementation of the strategic integrated projects (SIPs)
Major OFO
Number ofoccupations
in total
Numberof skills in total
Number of scarce
occupations
Number of scarce
skills totalPossible
shortage
1: Managers 33 16 799 5 14 486 1 1002: Professionals 57 19 917 30 15 697 5 3003: Technicians and associate professionals 45 26 433 14 14 804 3 3004: Clerical and support workers 16 7 611 2 5 370 4505: Service and sales workers 5 1 353 0 0 06: Trades 51 62 642 16 32 254 7 2507: Plant and machine operators 20 28 654 7 15 368 1 2508: Elementary occupations 22 41 919 16 3 400 6 400Total 249 205 329 90 101 379 25 050
Source: DHET (2015b) Skills for and through SIPs

Appendices and additional information
100 Skills supply and demand in South Africa
Term Definition
Artisanal learning programme
Includes an apprenticeship, learnership, internship, cadetship or other programme undertaken at the workplace.
Bachelor pass A specific matriculation pass category which qualifies a learner who has completed the National Senior Certificate examination to enter a bachelor degree at a university.
Certification Formal recognition of a qualification or part qualification awarded to a successful learner.
Classification of Educational Subject Matter (CESM)
The Classification of Educational Subject Matter (CESM) defines the basis used in the Higher Education Management Information System (HEMIS) and each institution’s instruction and research activities must be related to it. CESM categories provide a single, coherent system for classifying subject matter regardless of the level of instruction, type of institution, or source of support.
Completers Individuals who successfully completed a qualification including certificates, diplomas, courses, programmes or degrees.
Completion rate Refers to a percentage of a given student intake, or cohort, that graduates.
Discouraged work seekers
Person without work, who wants to work but has not taken active steps to seek work in the reference period.
Documented immigrants
A citizen of another country who enters the country with a view to residing permanently, and has been granted or has applied for permanent residence of that country.
Economically active Persons of working age who are available for work, and are either employed or unemployed but have taken active steps to find work in the reference period.
Economically inactive People who are not available for work, such as full-time scholars and students, full-time homemakers, those who are retired and those who are unable or unwilling to work.
Economy A large set of inter-related production and consumption activities that aid in determining how scarce resources are allocated. It encompasses all activities related to production, consumption and trade of goods and services in an area.
Employed People aged between 15 and 64 years who, during the reference week, did any work for at least one hour, or had a job or business but were not at work (i.e. were temporarily absent).
Gender Social distinction between males and females.
Graduate In the current report refers to a student who has satisfied all the requirements of a degree for which he/she was registered.
Graduation rates Graduation rates are calculated by dividing the total number of qualifications awarded at an institution by the total number of students enrolled in that year.
Gross domestic product
The value of a country's overall output of goods and services (typically during one fiscal year) at market prices, excluding net income from abroad. GDP can be estimated in three ways: expenditure basis: how much money was spent; output basis: how many goods and services were sold; and income basis: how much income (profit) was earned.
Gross enrolment ratio Ratio of total enrolment, regardless of age, to the population of the age group that officially corresponds to the level of education shown.
Higher education Is used to refer to the education that normally takes place in universities and other higher education institutions, both public and private, which offer qualifications on the Higher Education Qualifications Framework (HEQF).
Job deficit A gap between the working age population and the employed population.
Labour force All employed and unemployed persons of working age (excluding not economically active persons).
Labour market All persons aged 15 to 64 years who are employed, unemployed and not economically active (inactive).
Labour/employment Absorption Rate
Refers to the proportion of the working-age population that is employed.
Learner Any person receiving basic education or who is obliged to receive education in terms of the South African Schools Act, 1996. The current report also refers to a learner as a person receiving education or training in a learnership, apprenticeship and internship
GLOSSARY OF TERMS

Appendices and additional information
ANNE
XURE
S
Skills supply and demand in South Africa 101
Term Definition
Learnership Refers to a learning programme that leads to an occupational qualification or part-qualification and includes an apprenticeship and cadetship.
Learning programme A structured set of learning offerings and related assessment and attainment requirements.
Low skilled occupations Refers to elementary and domestic work.
Main occupations (OFO) classification
Refers to the one digit level code of an occupation classified on the Organising Framework of Occupations (OFO). (Note: SASCO classification of occupations as used by StatsSA in the QLFS was recoded to the OFO classification. OFO classification is thus used in the report.)
Major field of study The subject area(s), according to CESM classification, in which a student may specialise in the final year of study for a degree/diploma/certificate instructional programme.
Matriculation Refers to completing the final year of high school (grade 12). The matric certificate is received as a qualification on graduating from high school.
Migration Refers to the movement of people from one country to another.
Occupation The type of work a person does according to the Organising Framework of Occupations (OFO), irrespective of the industry.
Primary sector Includes Mining and Quarrying, Agriculture, Forestry and Fishing.
Qualification Successful completion of a level of education or organised course of study, usually denoted by the acquisition of a certificate, e.g. school-leaving certificate, diploma, degree or professional title.
Secondary sector Includes Manufacturing, Electricity, Gas and Water (utilities) and Construction.
Sector A defined portion of social, commercial or educational activities used to prescribe the boundaries of an Education and Training Quality Assurance body (ETQA).
Semi-skilled occupations
Includes clerks, sales, skilled agriculture, craft, and machine operators grouped.
Skill levels Skill is defined in relation to qualifications. Low skills refer to those qualified at pre-matriculation NQF levels (1-3) or no schooling (less than level 1). Intermediate skill levels are those qualified at NQF levels 4-5 and high skills levels refer to those qualified at NQF levels 6-10.
Skilled occupations Refers to professionals, managers and technician level occupations grouped.
Skills programmes Skills programmes refers to a part-qualification as defined in the National Qualifications Framework (NQF) Act, 2008 (Act No. 67 of 2008).
Target growth rate The target growth rate measures how fast employment would have had to expand in order to provide work for all new entrants to the labour market over a given period.
Tertiary education Individuals who have obtained an undergraduate or post-graduate degree or have completed secondary school and in addition obtained a certificate or diploma of at least six months' full-time duration.
Tertiary sector Refers to Trade, Transport, Finance, Community and Social Services, and private households.
Unemployment Two standard definitions are used, 1) Narrow definition of unemployment: Unemployed persons as individuals aged between 15-64 who a) did not work during the seven days prior to the interview, (b) want to work and are available to start work within a week of the interview, and (c) have taken active steps to look for work or to start some form of self-employment in the four weeks prior to the interview. The broad (or expanded) definition of unemployment does not include criterion (c), and therefore includes discouraged workers.
Unskilled employees Persons who have not undergone any formal training or of whom no minimum level of education is required.
Vacancies Available funded positions/posts for immediate filling on the survey reference date and for which recruitment action had been taken.
Workforce In the current report refers to people who are currently in employment.
Working age population Comprises everyone aged 15 and above who fall into each of the labour market components (employed, unemployed, not economically active during the reference week).
Youth Refers to persons aged from 15 to 34 years.

Appendices and additional information
102 Skills supply and demand in South Africa
WORKS CITEDAEO (2015) South Africa 2015. African Economic Outlook. Available at: http://www.africaneconomicoutlook.org/en/countries
BankSETA (2013) Banking Sector Skills Plan 2013 to 2014. Available at: http://www. bankseta.org.za/downloads/Banking_Sector_Skills_Plan_2013-14.pdf
Bhorat, H., Cassim, A., and Hirsch, A. (2014) Policy Co-ordination and Growth Traps in a Middle-income Country Setting: The Case of South Africa. Working Paper Series. World Institute for Development Economic Research (UNU-WIDER).
Bhorat ,H., Cassim, A., and Tseng, D. (2015) Higher education. employment and economic growth: Exploring the interactions. LMIP Report 5. Available at: http://www.lmip.org.za/document/lmip-report-5-higher-education-employment-and-economic-growth-exploring interactions
Bhorat, H., Hirsch, A., Kanbur, R., and Ncube, M. (2013) Economic Policy in South Africa Past. Present. and Future. Oxford Companion to the Economics of South Africa. Oxford University Press.
Bhorat, H. and Jacobs, E. (2010) An Overview of the Demand for Skills for an Inclusive Growth Path. Development Bank of Southern Africa. Available at: http://www.dbsa.org/EN/About-Us/Publications/Documents/An%20overview%20of%20the%20demand%2for%20skills%20for%20an%20inclusive%20growth%20path%20by%20Haroon%20Bhorat%20and%20Eln%C3%A9%20Jacobs.pdf
Bhorat, H and Oosthuizen, M. (2006) The Post-Apartheid South African Labour Market. DPRU Working Paper 05/93. Cape Town: University of Cape Town.
Branson, N., Hofmeyr, C. and Lam, D. (2014) Progress through school and the determinants of school dropout in South Africa. Development Southern Africa. 31(1). 106-126.
Budlender, D. (2014) Migration and employment in South Africa: Statistical analysis of the migration module in the Quarterly Labour Force Survey. third quarter 2012. African Centre for Migration & Society. University of the Witwatersrand.
CHE (2013) A proposal for undergraduate curriculum reform in South Africa: The case for a flexible curriculum structure. Report to the Task Team on Undergraduate Curriculum Structure. Council on Higher Education. Discussion Document. Council on Higher Education.
DBE (2014) National Senior Certificate Technical Report. Department of Basic Education. Available at: http://www.education.gov.za/Portals/0/Documents/Reports/NSC%202014%20Technical%20Report%20.pdf?ver=2015-01-05-083624-000
DED (2011) New Growth Path (NGP) Accord 4: Green economy accord. Department of Economic Development. Available at: http://www.info.gov.za/view/DownloadFileAction?id=159756
DHA (2014) Skills or Qualifications determined to be critical for the Republic of South Africa in Relation to an application for Critical Skills Visa or Permanent Residence. Department of Home Affairs. Government Gazette No. 37716. Available at: http://www.vfsglobal.com/dha/southafrica/pdf/immigration_critical_skills_160416.pdf
DHET (2010a) Delivery Agreement 5: A Skilled and Capable Workforce to Support an Inclusive Growth Path. Department of Higher Education and Training. Available at: http://www.dpme. gov.za/publications/Outcomes%20Delivery%20Agreements/Outcome%2005%20Skills.pdf
DHET (2010b) National Skills Development Strategy IIII (2010 -2016). Department of Higher Education and Training. Available at: http://www.dhet.gov.za/Booklets/NSDS%20III%20 Progress%20Report%20-%207%20October%202013%20-%20V11.pdf
DHET (2013) White Paper for Post-School Education and Training: Building an Expanded. Effective and Integrated Post-School System. Department of Higher Education and Training. Available at: http://www.dhet.gov.za/SiteAssets/Latest%20News/White%2 0paper% 20for% 20post-school%20 education% 20and%2 0training.pdf
DHET (2014a) List of Occupations in High Demand, 2014. Department of Higher Education and Training. Government Gazette No. 38174. Available at: http://www.gov.za/sites/www.gov. za/files/38174_gon863.pdf
DHET (2014b) Wholesale & Retail Seta Sector Skills Plan Update 2014 to 2015. Department of Higher Education and Training. Available at http://wrlc.org.za/wp-content/uploads/2014/12/WRSETA-Sector-Skills-Plan-Update-2014-15_FinalReport_30092014.pdf

Skills supply and demand in South Africa 103
Appendices and additional information
ANNE
XURE
S
DHET (2015a) List of Occupations in High Demand, 2015. Department of Higher Education and Training. Available at: http://www.dhet.gov.za/DHET%20Statistics%20Publication/List%2 0of%20Occupations%20in%20High%20Demand%202015%20.pdf
DHET (2015b) Skills for and Through SIPs: Progress report March 2015. Department of Higher Education and Training. Available at: https://sip-skills.onlinecf.net/SKILLSforandthroug hSIPs/Documents%20Skills%20for%20and%20through%20SIPs%20Report%202014/Skills%20for%20and%20through%20SIPs%20Progress%20Report%20March%202015.pdf
DHET (2015c) Statistics on Post-School Education and Training in South Africa: 2013. Department of Higher Education and Training. Available at: http://www.dhet.gov.za/DHET%20Statistics% 20Publication/Statistics%20on%20Post-School%20Education%20and%20Training%20in%20Sout h%20Africa%202013.pdf
DHET (2016) Statistics on Post-School Education and Training in South Africa: 2014. Department of Higher Education and Training. Available at: http://www.justice.gov.za/commissions/FeesHET/docs/2014-Statistics-Post-School-ET-SA.pdf
DoL (2003) State of skills in South Africa. Skills Planning Unit. Department of Labour. Available at: http://www.stafftraining.co.za/downloads/state_of_skills.pdf
DPRU (2013) Employment in the Mining and Quarrying Industry in South Africa. Factsheet 10. May 2013. Available at http://www.dpru.uct.ac.za/sites/default/files/image_tool/images/36/2013-06-11%20Mining%20Factsheet_0.pdf
DTA (2015) Presentation on SA Automotive Sector. EDD parliamentary Portfolio Committee. Department of Trade and Industry. Available at: https://www.thedti.gov.za/parliament/2015/SA_Automotive_Sector.pdf
FASSET (2014) FASSET Sector Skills Plan Update for the Period 1 April 2015 to 31 March 2020. The Finances and Accounting Services SETA. Available at: http://www.fasset.org.za/downloads/SSP_2015-2016-DRAFT-15_November_2014_For_Submission.pdf
Gamble J. (2016) Work and Qualifications Futures of Artisans and Technicians. Labour Market Intelligence Partnership Report 19. Soon to be available at: http://www.lmip.org.za.
HRDC (2009) Human Resource Development Strategy for South Africa (2010-2030). Human Resource Development Council. Available at: http://www.cathsseta.org.za/wp-content/uploads/2013/0 4/hrds-sa-edited-final.pdf
Isdale, K., Reddy, V., Winnaar, L., and Zuze, L., (2016) Smooth, Staggered or Stopped: Educational Transitions in the South African Youth Panel Study. Labour Market Intelligence Partnership Publication. Human Sciences Research Council.
ISETT-SETA (2011) Sector Skills Plan 2011-2016. ISETT-SETA. Available at: https://www.mict.org.za/downloads/Isett_Seta_Sector_Skills_Plan_2011_2016_Jan_2011_Version_v2p1.pdf
Kalina, M. and Rogan, M., (2016) Estimating the current and future skills demand of government’s national growth and development policies. LMIP Report. Soon to be available at: http://www.lmip.org.za.
Kruss, G., Wildschut, A., Janse van Rensburg, D., Visser, M., Haupt, G., and Roodt, J. (2012) Impact Assessment of National Skills Development Strategy II: developing skills and capabilities through the learnership and apprenticeship pathway systems: synthesis report: assessing the impact of learnerships and apprenticeships under NSDSII. Department of Labour. Available at: http://www.hsrc.ac.za/en/research-outputs/ktree-doc/13800
Loazya, N., Schmidt-Hebbel, K., and Servén, L. (2000) Savings in Developing Countries: An Overview. The World Bank Economic Review. Vol. 14. No. 3: 393–414
Mbatha, N., Wildschut, A., Mcnwango, B., Ngazimbi, X., and Twalo T. (2015) Towards understanding the distinctive nature of artisan training. Implications for skills planning in South Africa. Labour Market Intelligence Partnership Report 2. Available at: http://www.lmip.org.z a/document/lmip-report-2-towards-understanding-distinctive-nature-artisan-training-implications-skills.
MoE (2001) Draft National Plan for Higher Education in South Africa. Ministry of Education. Available at: http://www.unisa.ac.za/contents/projects/docs/National%20Plan%20Higher %20Education.pdf
NPC (2011) National Development Plan: Vision for 2030. National Planning Commission. Available at: www.npconline.co.za. 01/12/2012 – 014/01/2013

104 Skills supply and demand in South Africa
Appendices and additional information
Nzimande, B. (2011) DHET Ministers 2011 Budget Speech. Department of Higher Education and Training. Available at: https://pmg.org.za/briefing/18905/
OECD (2014) Education at a Glance 2014: OECD Indicators. OECD Publishing. Available at: https://www.oecd.org/edu/Education-at-a-Glance-2014.pdf
Paterson, A., Visser ,M., Arends, F., Mthethwa, M., Twalo, T., and Nampala, T. (2015) High-Level Audit of Administrative Datasets. Department of Higher Education.
Reddy, V. and Juan, A. (2014) Quality school mathematics: an elusive aspiration? In: Meyiwa T., Nkondo M., Chitiga-Mabugu M., Sithole M. & Nyamnjoh F. (eds) State of the Nation 2014: South Africa 1994-2014: a twenty-year review. Cape Town: HSRC Press: 296-309.
Reddy, V. and Powell, M. (2015) Indicators and Data to Support Skills Planning in South Africa. LMIP Report No. 13.
RSA (2008) National Qualifications Framework (NQF) Act. 2008. Act No. 67 of 2008. Available at: http://www.saqa.org.za/docs/legislation/2010/act67.pdf
RSA (2015) The Framework for the Annual Report on Skills Supply and Demand in South Africa. Republic of South Africa. Government Gazette. No. 39319 (23 October 2015). Available at: http://www.gov.za/sites/www.gov.za/files/39319_gon1007.pdf.
StatsSA (2012a) Documented immigrants in South Africa. 2011. Statistical release P0351.4
StatsSA (2012b) P0301.4: Statistical release: Census 2011. Retrieved from http://www.statssa.gov.za/publications/P03014/P030142011.pdf
StatsSA (2013) Documented immigrants in South Africa. 2012. Statistical release P0351.4
StatsSA (2014a) Documented immigrants in South Africa. 2013. Statistical release P0351.4
StatsSA (2014b) Labour Market Dynamics in South Africa. Statistics South Africa.
StatsSA (2014c) Poverty Trends in South Africa: An examination of absolute poverty between 2006 and 2011.
StatsSA (2016a) Labour Force Survey (LFS) (Various Years). Statistics South Africa.
StatsSA (2016b) Ordinary Household Survey. 1995 (OHS) (Various Years). Statistics South Africa.
StatsSA (2016c) Quarterly Labour Force Survey (LFS) (Various Years). Statistics South Africa.
UKCES (2010) Skills for Jobs: Today and Tomorrow. UK Commission for Employment and Skills. Available at: https://www.gov.uk/government/uploads/system/uploads/attachment_data/file/339954/national-strategic-skills-audit-for-england-2010-volume-1-key-findings.pdf
UNICEF (2013) UNICEF Indicators Databank (2013). United Nations Children's Emergency Fund. Available at: http://www.unicef.org/southafrica/resources_4768.htm
WB (2011) South Africa Economic Updates. Issue 1. Washington. DC: World Bank.
WB (2016) World Bank Indicators Databank (Various Years). World Bank. Available at: http://databank.worldbank.org/data/reports.aspx?source=world-development-indicators
Wildschut, A., and Meyer, T. (2016) The Shifting Boundaries of Artisanal Work and Occupations. Labour Market Intelligence Partnership Report 20. Available at: http://www.lmip.org.za/sites/default/files/documentfiles/504.%20The%20Shifting%20Boundaries%20of%20Artisanal%20Work%20And%20Occupations_0.pdf.
Zalk, N. (2014) What is the role of manufacturing in boosting economic growth and employment in South Africa? Econ3x3.org. Available at: http://www.econ3x3.org/article/what-role-manufacturing-boosting-economic-growth-and-employment-south-africa
WORKS CITED continued

CORPORATE INFORMATIONHUMAN SCIENCES RESEARCH COUNCILPretoriaPrivate Bag X 41, Pretoria, South Africa 0001Tel: +27 12 302 2000Fax: +27 12 302 2001 Cape TownPrivate Bag X9182, Cape Town, South Africa 8000Tel: +27 21 466 8000Fax: +27 21 466 8001 DurbanPrivate Bag X07, Dalbridge, South Africa 4014Tel: +27 31 242 5400Fax: +27 31 242 5401
LABOUR MARKET INTELLIGENCE PARTNERSHIP www.lmip.org.za
An electronic version of the report is available on the LMIP website
DEPARTMENT OF HIGHER EDUCATION AND TRAININGPretoria Office123 Fr ancis Baard Street, Pretoria 0001Private Bag X174, Pretoria 0001 Tel + 27 12 312 5911 Cape Town Office 103 Plein Street, Parliament Towers, Cape Town 8001Private Bag X9192, Cape Town 8000Tel + 27 21 469 5175Fax + 27 21 461 4761
Websitewww.dhet.gov.za
Call Centre Information0800 87 2222Email: [email protected]

www.lmip.org.za