skilled perception duijst & duijst
TRANSCRIPT

1
Is there a difference in performance of young
soccer players between small-sided games
and competition matches?
Vrije Universiteit van Amsterdam
Faculty of Human Movement Sciences
Specialization: Sport
Qualification: Master’s programme in Human
Movement Sciences: Sport, Exercise and Health
Research internship
Author: Jeffery Duijst; Edwin Duijst
Supervisor: prof. dr. Geert J.P.Savelsbergh
December 2014

2
Is there a difference in performance of young soccer players
between small-sided games and competition matches?
Jeffrey Duijst, Edwin Duijst
Article info Abstract Date: 11-7-2014 The aim of this study is to investigate the difference in
performance of young soccer players between small-
sided games and competition matches. We defined
skilled perception as how well a player can use visual
information and the ability to anticipate future events.
For every participant three different performance
indicators for skilled perception are obtained. That is:
independent judgments by 8 trainers and the actual
performance analysis shown in the two different types
of games. For that purpose, trainers watch video film of
4 vs 4 games and ranked the 8 payers from very good
till less good with respect to skilled perception.
The video films of 4 vs 4 and 11 vs 11 are analyses by
two experimenters with respect to skilled perception
based on a scoring list. A significant relationship is
found between trainer judgements and performance
measured by scoring list in 4 vs 4. Also a significant
relationship is found between skilled perception scores
of the 4 vs 4 and 11 vs 11. It is concluded that 4 vs 4
and 11 vs 11 show no differences in performance for
skilled perception. The designed scoring list for the
trainers could be a useful tool to identify talent.
Words:
Keywords:
Skilled perception, Small-sided
games, Soccer, Talent
identification
Introduction
Soccer is one of the most popular and most played sports in the world. A very important aspect in
every sport, and also in soccer, is youth development and identification. Anticipation is a key
parameter in the field of youth development and identification. Soccer players has to deal with a
complex and quickly changing environment. Before deciding what action is required in a specific
situation players have to pick up information from the ball, opponents and teammates. Opponents

3
try to restrict ‘time’ and ‘space’ that is available to make that decision. This `temporal pressure’
suggests that a part of the total performance of a soccer player is dependent on his ability to
anticipate on future soccer situations. Consider, for instance, the calmness a world class midfield
player has when receiving and passing the ball, suggesting he has ‘all the time in the world’. The
ability to anticipate on future events distinguishes skilled from less skilled soccer players (Williams,
2000).
The way a soccer player uses visual information could be a good indicator to predict talent
(Savelsbergh, Haans, Kooijman & van Kampen, 2010). According to Savelsbergh et al. (2010)
differences in visual search and locomotion behaviour can be a good and usable indicator to
Identify young talented soccer players.
The Royal Dutch Soccer Federation (KNVB)(Dokter, 1993) uses the terms insight and awareness to
explain how good a player uses visual information. Savelsbergh, Onrust, Rouwenhorst, & van der
Kamp (2006) and Savelsbergh et al. (2010) used the term skill in perception. In many sports athletes
have to intercept, catch or hit a fast moving ball. To do this action correctly, the athletes have to hit
or catch the ball at the right place and the right time (Caljouw, van der Kamp, & Savelsbergh, 2004a;
Caljouw, van der Kamp, & Savelsbergh, 2004b; Savelsbergh, Whiting, & Bootsma, 1991). Important to
successfully perform this kind of action is skill in perception and the accurate and efficient execution
of the movement pattern (Williams, Davids, & Williams, 1999). The contribution of visual information
skill in perception is equally important as the motor skills. (Savelsbergh et al., 2006; Savelsbergh, van
der Kamp, Williams, & Ward, 2005; Savelsbergh, Williams, van der Kamp, & Ward, 2002; Williams &
Elliot, 1999). For that reason is the performance output form an athlete a contribution of skill in
perception and the available motor skills. It has become clear that skill in perception is an important
subject in sports and in particular soccer expertise (Abernethy, Thomas & Thomas, 1993; Starkes and
Allard, 1993; Williams & Elliot, 1999).
In the last decade several researchers examined the skill of perception extensively. A well-used
method in examining skill perception is to ask participants to predict the end result of video clips.
Those videos show more or less predictive information from the opponent’s body or the ball’s flight
path. Their findings show that experts possess superior anticipatory skills compared to their novice
counterparts (Abernethy & Russel, 1987; Helsen & Starkes, 1999; Savelsbergh et al., 2002; Ward &
Williams, 2003; Williams & Davids, 1998; Williams, Davids, Burwitz, & Williams, 1994; Williams &
Elliot, 1999). Research shows that the ability to pick up advance information from visual sources
appears to be the fundamental difference between experts and novices (Abernethy & Russel, 1987;
Helsen & Starkes, 1999; Savelsbergh et al., 2002, 2005; Williams & Elliot, 1999). Elite soccer players
have developed an extensive soccer-specific knowledge base that enables them to recognize
meaningful associations between the position and movement of players in game situations
4
(Savelsbergh et al., 2006; Williams et al., 1994). How the athlete uses information is essential.
(Abernethy & Russel, 1987; Savelsbergh et al., 2006). This perception action perspective is based on
the ideas of Gibson (1979), who suggested that movement control is based on a continuous coupling
to available perceptual information, which is presumed to evolve over time (Savelsbergh & van der
Kamp, 2000; Savelsbergh et al., 2006).
The Royal Dutch Soccer Federation has a pronounced vision on developing young soccer players. The
basic idea is that when players are motivated practicing their sport, they will learn more from it and
therefore become a better soccer player (Dokter, 1993). Dokter (1993) emphasize that from soccer
training the most enjoyment can be gained in situations where players can score as much as possible
and have to prevent the opponent from scoring a goal. On a full size pitch children don't have
enough touches of the ball and therefore don't learn enough. The opinion of Dokter (1993) is as
follow: “We suggest that children up to the age of 11 should play games with smaller sides and on
smaller fields. This way the young soccer players have more ball contacts and in match situation this
improves their vision“ (Dokter, 1993). This vision of the Royal Dutch Soccer federation leads to the
well-known small sided game 4 against 4. Dokter (1993) says that 4 against 4 is the smallest way of
playing the game without losing any of the ingredients that makes soccer the game as it is. He says
that all the skills can be developed, which are: technical, motor skills, physical, game insight,
awareness (vision) and communication.
Within the field of research the use of small-sided games in soccer as a means of developing young
players is well documented (Carling, 2010; Casamichana & Castellano, 2010; Dellal, Chamari, Owen,
Wong, Lago-Penas & Hill-Haas, 2011; Hill-Haas, Coutts, Dawson, & Rowsell, 2010; Rampinini,
Impellizzerri, Castagna, Abt, Chamari, Sassi, 2007). In these studies the manipulation of pitch size,
number of players, verbal encouragement and rule changes within small-sided games have been
investigated in a wide range of different participants. This manipulation is in order to investigate the
differences between the physical load during small-sided games and matches. They measured heart
rate responses, distance covered, velocity and acceleration during small-sided games (Dellal,
Chamari, Pintus, Girard, Cotte & Keller, 2008; Hill-Haas et al., 2010; Jones & Drust, 2007; Little &
Williams, 2006; Owen, Twist, & Ford,2004; Rampinini et al., 2007). Small-sided games with various
rule changes have been suggested to be a way of exposing players to match-specific situations (Jones
& Drust, 2007). Soccer players constantly exposed to these various situations in small-sided games
have been suggested to improve their decision-making skills, technical skills, tactical knowledge and
physical conditioning (Owen, Wong, McKenna, & Dellal, 2011). Owen et al. (2011) investigated
number of block, headers, interceptions, passes, dribbles, shots and tackles in small-sided games.
Compared to large games, small-sided games induced significantly lesser total ball contacts per
games but significantly greater ball contacts per individual (Owen et al., 2011).
5
When comparing small-sided games with match play, few studies have attempted to report the
different demands placed upon the players.
In this context, Gabbett & Mulvey (2008) studied the movement patterns of small-sided games with
elite women soccer players. They compared their training results with domestic, national and
international standard matches. These authors reported that both the 3 vs 3 and 5 vs 5 small-sided
games recreated match-play physical activity but presented an insufficient training stimulus to
simulate the intensity and repeated-sprint demands of a standard competition match. In the
research field of small-sided games compared with large sided games in skilled perception it’s still
unknown whether the performance is correlated. Especially studies of skilled perception of young
soccer player. The aim of this study is to investigate the difference in performance of young soccer
players between small-sided games and competition matches. The correlation will be calculated
between skilled perception indicators of small-sided games and competition matches. For that
purpose a performance scoring list is developed. This scoring list measures the performance output
of the soccer player which can be indirectly related to skill in perception. It is hypothesized that the
performance measured by the scoring list in 4 vs 4 and 11 vs 11 in performance should show a
significant correlation.
Method
Participants
Thirty- two young elite soccer players participated in the experiment and were treated in accordance
with the local institution’s ethical guidelines. The players played in two different teams, under 13 and
under 12 from Feyenoord Rotterdam youth department. Sixteen of the participants played in under
12 and sixteen played in under 13. These 32 players had a mean age, height and body weight of
respectively 12,2 years(SD 0,57), 151 cm(SD 8,6) and 39,7 kg(SD 6,2). Their experience in soccer was
7.0 years (SD 1.1). Written consent was obtained from one of their parents or a guardian.
Overview of the equipment
A Canon XH-A1 and a Panasonic AVCCAM were used to film the 4 vs 4 games. Next to the cameras
soccer equipment was needed. To analyse the 11 vs 11 games a Mac computer was available at
Varkenoord. See table 1 for the overview of the equipment.
6
Procedure
Filming the small-sided games 4 vs 4
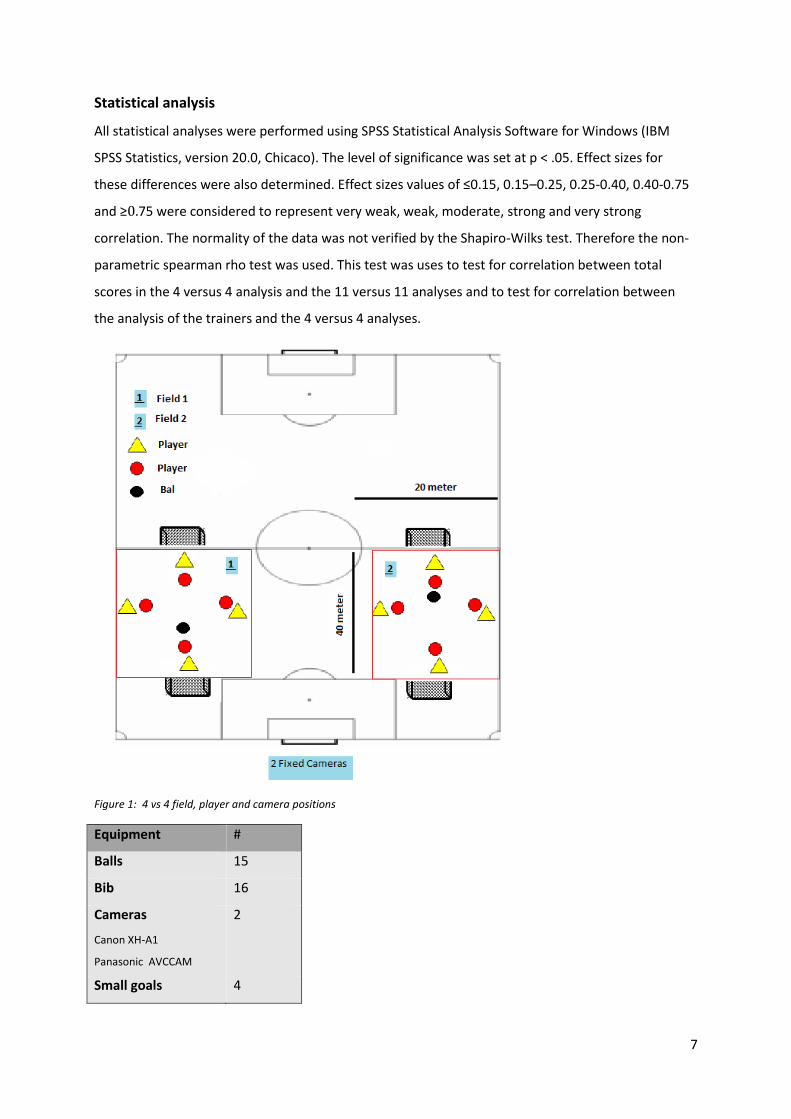
The players were filmed while playing a 4 vs 4 soccer game on a 20 x 40 m field (Figure 1). Two small-
sided games were filmed at the same time. On both ends of the field a small goal was placed. The
intention of the game is to score more goals than the opposite team. The duration of a match was 6
minutes with a small break of 2 minutes between the matches. After every game the composition of
the teams changed. In total every player played five matches. The two teams were filmed on the
same day.
The competition matches 11 vs 11
The players played a match on a 60 by 100 m field. The duration of a match was 60 minutes with 2
halves of 30 minutes. The extra-time in each halve was excluded from the analysis and thus only the
activities during the 60 min is analysed. Ten players were analysed during two different half’s of two
different matches. The video of the matches were available at Varkenoord Feyenoord youth
department.
Analysis small- sided games and competition matches
The players were analysed in three different ways. First eight soccer trainers of the Feyenoord Youth
Academy were asked to rank the players after every small-sided game based on skilled perception.
Each trainer watched five small-sided games. The average rank of the player was used to make a final
ranking. This ranking resulted in three best and two worst players of both teams. So in total the
result from the trainers was six players who scored high in skilled perception and four players who
scored low in skilled perception in de small-sided games. The second analysis was made based on the
results of the trainers. The ten players were analysed by a scoring list based on skilled perception
(table 2). See table 1 for these parameters and their definitions. The last way the players were
analysed was by the same scoring list based on skilled perception but now the ten players were
analysed in normal competition matches 11 vs 11.
To establish this score list (table 2) at first hand a lot of variables were analysed. After analysing some
different players the list was reduced to important variables that happened more often. Different
expert soccer trainers helped defining the variables. A hand notational system was used to evaluate
the score list. To ensure the validity of the data the video recordings were played back several times.
Special attention was applied in order to ensure the reliability of technical observations.
7
Statistical analysis
All statistical analyses were performed using SPSS Statistical Analysis Software for Windows (IBM
SPSS Statistics, version 20.0, Chicaco). The level of significance was set at p < .05. Effect sizes for
these differences were also determined. Effect sizes values of ≤0.15, 0.15–0.25, 0.25-0.40, 0.40-0.75
and ≥0.75 were considered to represent very weak, weak, moderate, strong and very strong
correlation. The normality of the data was not verified by the Shapiro-Wilks test. Therefore the non-
parametric spearman rho test was used. This test was uses to test for correlation between total
scores in the 4 versus 4 analysis and the 11 versus 11 analyses and to test for correlation between
the analysis of the trainers and the 4 versus 4 analyses.
Figure 1: 4 vs 4 field, player and camera positions
Equipment #
Balls 15
Bib 16
Cameras
Canon XH-A1
Panasonic AVCCAM
2
Small goals 4

8
Cones 30
Table 1: Overview of the equipment
Parameter Definition
Receive Player gains or attempts to gain control of the ball in order to retain possession.
Well received The player successfully gains or attempts to gain control of the ball in order to retain possession.
Defensive pressure/interception Preventing an opponent’s pass from reaching its intended destination or put pressure on a player in possession of the opponent.
Successfully defensive pressure/interception Successfully preventing an opponent’s pass from reaching its intended destination or put successfully pressure on a player in possession of the opponent.
Amount of passes Pass: Player in possession sends the ball to a team mate (e.g., using the foot, thigh, or chest; using various techniques such as ground, lofted, chip, flick, or volley; over short or long distances). Amount of passes given by a player in a match.
Amount of passes correct Amount of successful passes given by a player in a match.
Amount of passes forward Amount of passes forward given by a player in a match.
Amount of passes forward correct Amount of successful passes forward given by a player in a match.
Transition to possession Switch from possession opponent to ball possession.
Successfully transition to ball possession Creating the right conditions to win the ball.
Transition to possession opponent Switch from ball possession to possession opponent.
Successfully transition to possession opponent Creating the right conditions in order to achieve a goal in possession.
Table 2: Definitions parameters skilled perception

9
Results
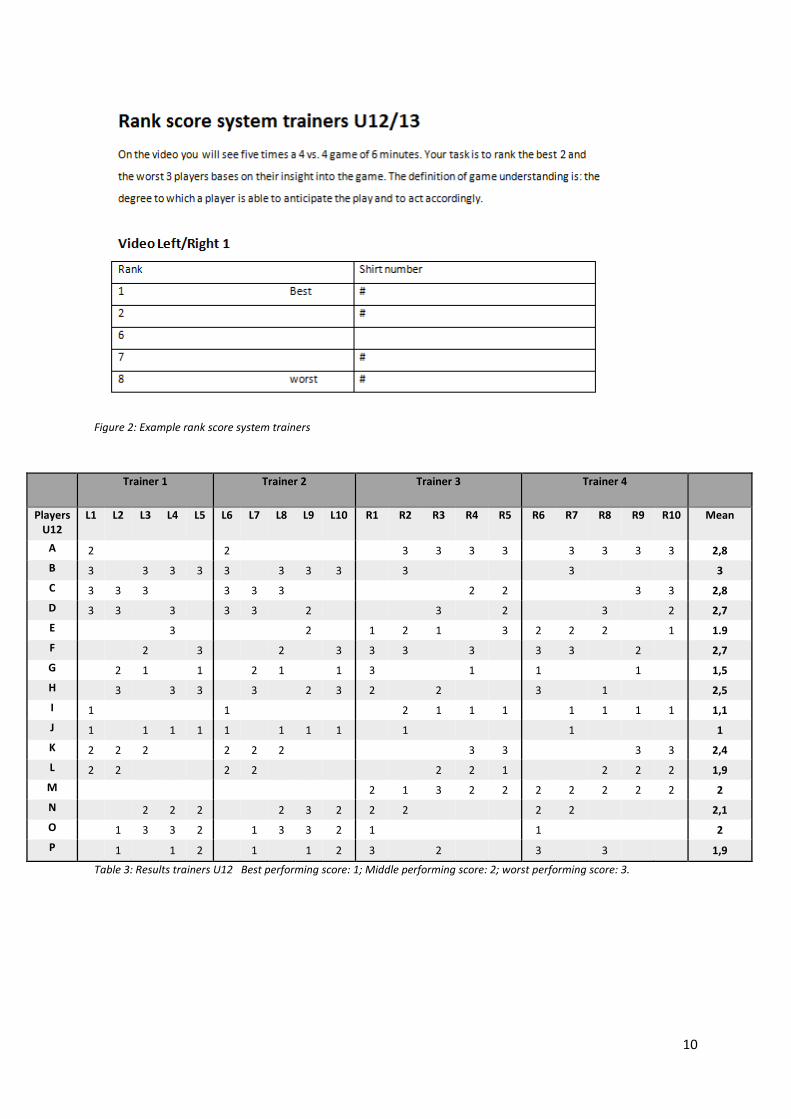
Table 3 and 4 provide an overview of the results of the analyses of the trainers. All players are rated
in total ten times by four different trainers. The trainers had to rank the three best and two worst
players in every match (see figure 2). This leads to a best performing score (1), middle performing
score (2) and worst performing score (3). The total score is an average of the ten scores. Players with
the lowest means were the best performing players. It’s notable that the trainers ranked the players
generally in the same performing score. Therefore its look likes the trainers are unanimous in their
judgement. Secondly it’s also notable that the results represent a clear division between the good
and the less performing players. For the analysis of the 11 vs 11 the three best and two worst players
of both teams of which video material was available were chosen(see table 7).
To analyse the 4 vs 4 and the 11 vs 11 games a scoring list was developed. This score list was used to
analyse five 4 vs 4 games and 2 half’s of 30 minutes in 11 vs 11 of every player. See table 2 for the
parameters and their definition. The parameters are established in percentages (see table 5 and 6).
In these tables an example is provided how a (total) score is obtained for player A. This scoring list
measures the soccer performance of the participant. This performance output represents the skill in
perception and the accurate and efficient use of motor skill from the young soccer player. After
processing the data for the score list it was decided not to use the transition parameters. Firstly we
found that this parameter was very dependent on which position the player played in the team.
Secondly, it was difficult to measure and define what is a good transition (because it’s very
subjective whether a player performs a good transition or not).
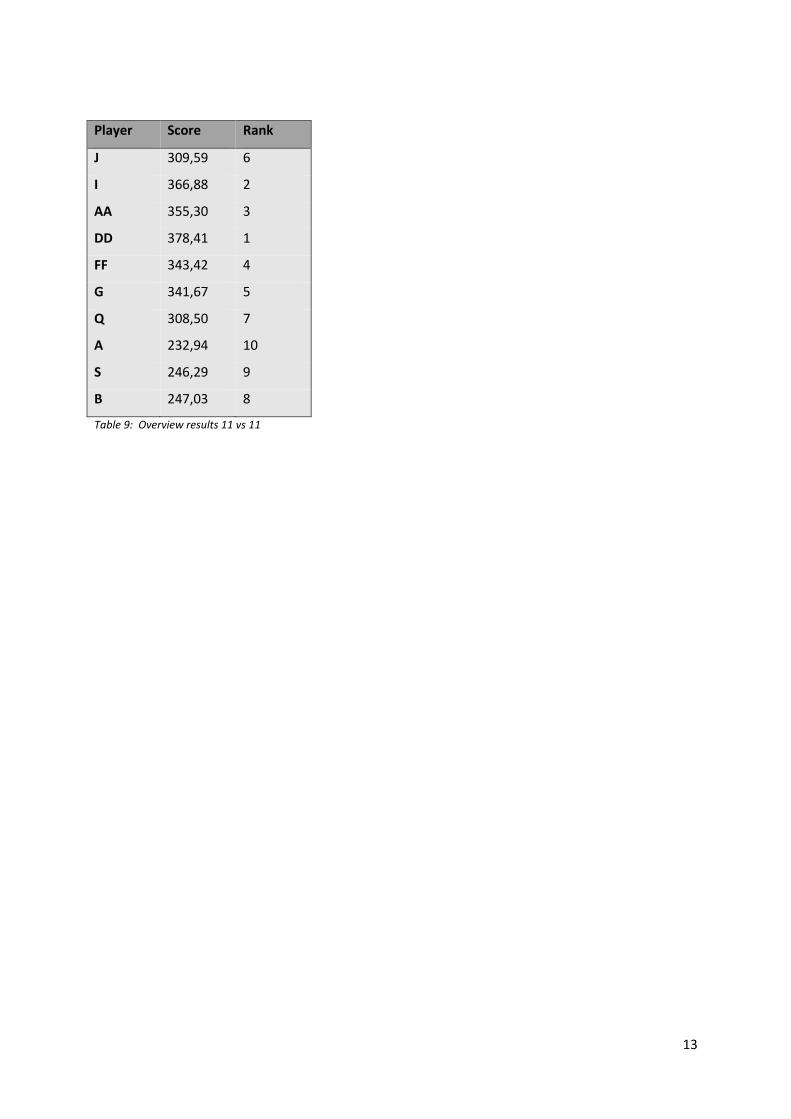
Table 8 is an overview of the results from the 4 vs 4 and table 9 is the overview of the results from 11
vs 11. In table 8 and 9 it’s notable that almost all players except one were ranked as the best 6
players in the 4 vs 4 also were ranked as the best 6 players in 11 vs 11.
First we analysed whether the judgements of the trainers (table 7) correlate with the findings of the
4 vs 4 analyses (table 8). The result of the spearman rho test shows a very strong significant
correlation (Rho= 0.806, p=0.005).
Secondly, it was analysed whether the findings of the 4 vs 4 (table 8) is correlated with those of the
11 vs 11 (table 9). The results of the spearman rho test shows again a very strong significant
correlation (Rho= 0.782, p= 0.008).
10
Figure 2: Example rank score system trainers
Trainer 1 Trainer 2 Trainer 3 Trainer 4
Players U12
L1 L2 L3 L4 L5 L6 L7 L8 L9 L10 R1 R2 R3 R4 R5 R6 R7 R8 R9 R10 Mean
A 2
2
3 3 3 3
3 3 3 3 2,8
B 3
3 3 3 3
3 3 3
3
3
3
C 3 3 3
3 3 3
2 2
3 3 2,8
D 3 3
3
3 3
2
3
2
3
2 2,7
E
3
2
1 2 1
3 2 2 2
1 1.9
F
2
3
2
3 3 3
3
3 3
2
2,7
G
2 1
1
2 1
1 3
1
1
1
1,5
H
3
3 3
3
2 3 2
2
3
1
2,5
I 1
1
2 1 1 1
1 1 1 1 1,1
J 1
1 1 1 1
1 1 1
1
1
1
K 2 2 2
2 2 2
3 3
3 3 2,4
L 2 2
2 2
2 2 1
2 2 2 1,9
M
2 1 3 2 2 2 2 2 2 2 2
N
2 2 2
2 3 2 2 2
2 2
2,1
O
1 3 3 2
1 3 3 2 1
1
2
P
1
1 2
1
1 2 3
2
3
3
1,9
Table 3: Results trainers U12 Best performing score: 1; Middle performing score: 2; worst performing score: 3.

11
Trainer 5 Trainer 6 Trainer 7 Trainer 8
Players U13
L1 L2 L3 L4 L5 L6 L7 L8 L9 L10 R1 R2 R3 R4 R5 R6 R7 R8 R9 R10 Mean
Q
1
1
2
2 2
3 3
2
3 3
2,2
R
1 1 2
3 1 1
1
1 2
1 1,4
S
3 3 3
3 3 3 2 3
3 3
2,9
T
2 3
2 2 3 2 2
1 1 2
2
U 3 3 2
2 3 3 2
1
2
2
2,3
V 3 2 2
3 1 2
2 3
2 3 2,3
W 3
2
3 3 2 3
3 3 2 3 2,7
X 2
2
1
2
2
1 2
2
1 2 1,7
Y
3
3
2
3 3
3 3
3
2 3
2,8
Z
2 3 3
3 3 3
2
3 2
3 2,7
AA
1 1 1
1 1 1 1 2
1 2
1,2
BB
3 2
2 3 3 3 2
3 3 3
2,7
CC 2 3 3
2 3 2 3
2
3
3
2,6
DD 1 2
2 2
1 1 1
1 1 1 1,3
EE 2
2
2
1
2
2 2
2
2 2 1,9
FF 1
1
2
2
1 1
2
1 1
2 1,4
Table 4: Results trainers U13 Best performing score: 1; Middle performing score: 2; worst performing score: 3.
Player A
Parameters
Received 13
Well received 13
Percentage 100%
Defensive pressure/interception 34
Successfully defensive pressure/interception 17
percentage 50%
Amount of passes 32
Amount of passes correct 19
Percentage 59,38%
Amount of passes forward 19
Amount of passes forward correct 11
Percentage 57,90%
Total percentage 267,27 Table 5: Result 4 vs 4 player A

12
Player A
Parameters NAC (first half) Sparta (first half)
Received 4 3
Well received 4 2
Percentage 100% 66,67%
Defensive pressure/interception 15 9
Successfully defensive pressure/interception 9 5
percentage 60% 55,56%
Amount of passes 11 10
Amount of passes correct 7 5
Percentage 63,64% 50%
Amount of passes forward 8 5
Amount of passes forward correct 4 1
Percentage 50% 20%
Total percentage 273,64% 192.23%
Total average percentage 232.94% Table 6: Result 11 vs 11 Player A
Player Score Rank Player Score Rank
J 1,0 1 J 352,08 4
I 1,1 2 I 368,33 1
AA 1,2 3 AA 352,44 3
DD 1,3 4 DD 358,44 2
FF 1,4 5 FF 285,82 8
G 1,5 6 G 306,39 6
Q 2,2 7 Q 320,12 5
A 2,8 8 A 267,27 9
S 2,9 9 S 286,55 7
B 3,0 10 B 262,44 10
Table 7: Overview results Trainers Table 8: Overview results 4 vs 4
13
Player Score Rank
J 309,59 6
I 366,88 2
AA 355,30 3
DD 378,41 1
FF 343,42 4
G 341,67 5
Q 308,50 7
A 232,94 10
S 246,29 9
B 247,03 8
Table 9: Overview results 11 vs 11

14
Discussion
The purpose of this study was to investigate the difference in performance of young soccer players
between small-sided games and competition matches. This performance output represents the skill
in perception and the accurate and efficient use of motor skill from the young soccer player. The
results showed a very strong correlation between the results of the small sided games and
competition matches. The results show that there are no differences in performance between 4 vs 4
and 11 vs 11.
The results of this study are conforming to the vision of the Royal Dutch Soccer Federation (KNVB).
According to the KNVB 4 vs 4 is the smallest way of playing the game without losing any of the
ingredients that makes soccer what it is (Dokter, 1993). This includes skilled perception.
Savelsbergh et al.(2010) suggested that skilled perception could be an important parameter in soccer
for talent identification. The way a soccer player uses visual information could be a good indicator to
predict talent (Savelsbergh et al., 2010 According to Savelsbergh et al. (2010) differences in visual
search and locomotion behaviour can be a good and usable indicator to Identify young talented
soccer players. This study confirms that skilled perception is an usable parameter for identifying
talent
Scouting tool and analysing tool
It’s exceptional that eight expert trainers were willing to assist in this research. In this way the
players who participated were ranked by four different trainers. All trainers completed the form
separately from each other. Hence we think it’s very notable that the results of all the eight trainers
are very unambiguously. The results from the trainers are considered as a standard. The eight soccer
trainers of the Feyenoord Youth Academy are professionals and are considered to be an expert in
evaluating skilled perception. The results of this analysis show that the score list of skilled perception
for 4 vs 4 and 11 vs 11 correlates with the results of the trainers. The analysis of the results of
trainers rank and the 4 vs 4 skilled perception rank show a very strong significant relationship. This
rank score system which the trainers used could be a useful tool to scout and judge young soccer
players.
The score list which was used to analyse 4 vs 4 and 11 vs 11 is established with assistant of different
expert soccer trainers including the head of youth development of Feyenoord. A hand notational
system was used to evaluate the score list. To ensure the validity of the data the video recordings
were played back several times. Special attention was applied in order to ensure the reliability of
technical observations. Elferink-Gemser, Visscher, Richart and Lemmink(2004) used a questionnaire
to investigate the tactical performance of young soccer players. Elferink-Gemser et al.,(2004) based

15
their questionnaire about tactical performance TACSIS within the framework of McPherson(1994).
McPherson(1994) suggested that protocols which are verbalised permit a reliable measurement
method to measure tactical behaviour. (North, Ward, Ericsson and Williams, 2011). In the study of
Nortje, Dicks, Coopoo and Savelsbergh(2014) the main goal was to examine the relationship between
self-reported tactical decisions and in situ tactical decision making. These dissensions were action in
small-sided soccer games, 4 vs 4 and 8 vs 8. They found no significant correlation between the
tactical questionnaire TACSIS (Elferink-Gemser et al., 2004) and the soccer performance in small
sided games. These results support our decision to choose a score list instant of a questionnaire. The
results of 4 vs 4 and 11 vs 11 highly correlates with the results of the trainers. It seems very likely that
the scoring list did measure the performance and indirectly skilled perception. The analysis between
4 vs 4 and 11 vs 11 shows a very strong significant relationship. This means that the ranks based on
skilled perception in 4 vs 4 and 11 vs 11 are highly correlated. Therefore we conclude that this
scoring list could be a valid method to analyse young soccer players.
Future research should investigate the validity of the rank score system and the score list used in this
study. This can be done with groups of soccer player with other characteristics. For instance another
age group or players who play at a lower level. Also a study with more participants should improve
the reliability and validity of the score list and rank score system.
Evaluating the results it’s important to bear in mind that the 4 vs 4 small sided games filmed at one
day so the trainers ranked the players based on one training moment. Young players are known to
perform differently day by day. An improvement would be three or more training moments. The
trainers ranked the players based on skilled perception. These trainers are professionals and expert
in evaluating players. But it is also a subjective measurement because every trainer has his own
definition of what skilled perception is in soccer situations. The strength of the opponent in the
competition match 11 vs 11 could also have influence on the results in the analysis of the players
because with a better appointment it’s more difficult for a player to perform well in a game. The
present study provides evidence that there are no differences between 4 vs 4 and 11 vs 11 in
performance and indirectly in skilled perception. This is in line with the vision of the KNVB and this
study provides a scouting tool and an analysing tool, the rank score system used by the trainers could
be a useful scouting tool and the scoring list a method to analyse young soccer players.