sketch modeling of seismic horizons from uncertainty · r. amorim et al. / sketch modeling of...
TRANSCRIPT
EUROGRAPHICS Symposium on Sketch-Based Interfaces and Modeling (2012)L. B. Kara and K. Singh (Editors)
Sketch Modeling of Seismic Horizons from Uncertainty
Ronan Amorim1 Emilio Vital Brazil1 Daniel Patel2 Mario Costa Sousa1
1University of Calgary, Canada 2University of Bergen, Norway
AbstractPetroleum reservoir model building is a fundamental but complex task present in all stages of oil/gas explorationand production (E&P). Reservoir models are built incrementally using multi-disciplinary data (e.g. from geo-physics, geology, reservoir engineering) and the domain expert interpretation of that data. The first reservoirmodels are constructed at the appraisal stage, where the available data presents inaccuracies and a high degreeof uncertainty. In this paper we present a set of sketch-based interface and modeling operators integrated in asystem for the early appraisal stage in oil/gas E&P for the tasks of seismic interpretation and reservoir modelbuilding. Our system allows the user to sketch directly over the raw seismic reflection volume and its derived data.These data guide the expert in the key tasks of seismic interpretation and building the structural framework ofthe reservoir. We propose a novel set of sketch-based modeling operators designed by specific domain require-ments from geophysics and geology. A novel architecture using adaptive meshes is also developed to create a moreflexible sketch-based system.
Categories and Subject Descriptors (according to ACM CCS): I.3.5 [Computer Graphics]: Computational Geometryand Object Modeling—Modeling packages
1. Introduction
A petroleum reservoir, or oil and gas reservoir, is a sub-surface accumulation of hydrocarbons contained in porousor fractured rock formations. Most easily identifiablepetroleum reservoirs in the subsurface have been discovered.New oil reserves are increasingly more complex and difficultto find. Therefore, improved technology is needed to findnew reservoirs and to increase the recovery rate for the ex-isting ones that are in production. Historically, many effortshave been made to improve the prediction accuracy of reser-voir behaviors. The accuracy of the prediction is closely re-lated to the quality of the reservoir model being simulated.The first stage of the oil and gas field development is basi-cally to construct the geological 3D structural model. Thismodel will later be used by engineers to simulate and pre-dict the reservoir behavior helping making decisions. Seis-mic reflection data is used as a volumetric snapshot of thesubsurface. The data is of low resolution and often noisy.The separations between rock layers inside the seismic vol-ume are called geological horizons which are a key infor-mation to construct the 3D reservoir model. The extrac-tion of this structure is one of the main goals in the seis-mic analysis process at the early stages of reservoir modelbuilding. At this early stage in reservoir model building,
the available data (primarily the seismic volume) presentsinaccuracies, sparseness, a high degree of uncertainty andthey are prone to different interpretations from domain ex-perts [PGT∗08, BGSJ07].
A fundamental problem at this appraisal stage is the lackof computational tools to support interactive, intuitive visualinterpretation and integration of geophysical data leading torobust conceptual, prototype structural model of the reser-voir [PSH∗09, GMNH09]. At this early stage in oil/gas field
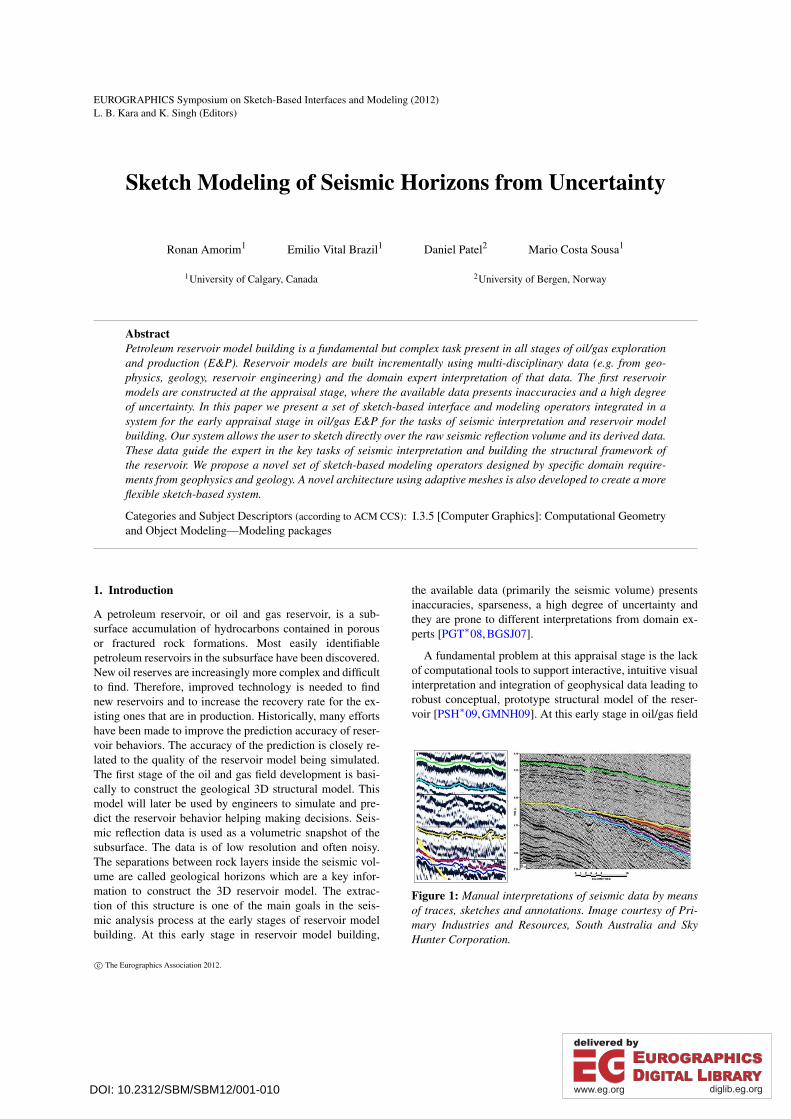
Figure 1: Manual interpretations of seismic data by meansof traces, sketches and annotations. Image courtesy of Pri-mary Industries and Resources, South Australia and SkyHunter Corporation.
c© The Eurographics Association 2012.
DOI: 10.2312/SBM/SBM12/001-010
R. Amorim et al. / Sketch Modeling of Seismic Horizons from Uncertainty
development, modeling the conceptual reservoir frameworkfrom seismic data involve various software and numerousmanual steps, creating a clumsy intensive workflow. Variousimportant decisions at this early modeling stage require ex-pert domain intepretations where manual intepretations areused by means of sketches, annotations, and hand-drawingtraces [PGT∗08, PSH∗09, Gie09, BGSJ07]. Figure 1 illus-trates conventional hand-drawing traces and sketches as partof the seismic interpretation process.
Sketch-based modeling (SBM) tools are a very suitableapproach to the problem of how to create, edit or augmentgeological horizons in the early stages of reservoir model-ing. The first version of a reservoir model is constructed atthe appraisal stage by interpreting seismic data. Often, thefirst step is to use automatic or semi-automatic algorithmsfor extracting horizons [SBMS03,PB05]. These rock bound-aries are approximate and come with several topological andgeometrical errors. As pointed out by Evans [Eva03], toolsare lacking for fast and simple interpretation and creationof reservoir models. Reservoir modeling can be considereda more detailed stage of the interpretation process dealingwith accurate positioning of horizons. Reservoir modeling isa domain expert-focused process practiced by only hundredsof specialists worldwide due to non-integrated, complicatedsoftware packages having limited concept of model manage-ment. This causes a break in productivity and limits interpre-tation teams to only model the most likely case. As a result,uncertainty around the model is masked and the ability tosee the effects of different interpretations on reservoir flowis limited [Eva03]. We attempt to address this problem by of-fering fast and simple editing of models using sketch-basedtechniques.
We present a SBM system built based on the petroleumindustry requirements and needs for modeling reservoirs atearly stages of oil/gas exploration and production (E&P); inaddition, this work brings novel computational approachesto SBM issues. The domain was an important motivationfor this work, and it guided our designs decisions, but itis not a straightforward implementation of common SBMtools. Indeed, the challenges imposed by the domain guidedand inspired us to create a new set of operators (based onexperts requirements) as well as a flexible representationstructure for these operators. One important requirement ofthe domain is to be able to control the scales of operations,i.e., local and global manipulations of the model. To allowthese different scales of operations we shall use one adap-tive mesh [Vel04]. In summary, the main contributions ofthis work are:
• The use of Sketch-Based Modeling tools to create, aug-ment and edit geological horizons from raw seismic vol-ume data;
• A novel set of SBM operators suitable for geological do-main;
• A novel architecture to develop flexible SBM tools usingadaptive mesh;
2. Related Work
In this section we present the most related SBM works aswell as recent horizon extraction methods.
Igarashi et al. [IMT99] and Nealen et al. [NISA07] devel-oped modeling systems which use curves to create and edit3D models. Similarly, some of our operators are based oncurves but we filter the mouse input using the technique pro-posed by Vital Brazil et al. [VMC∗10]. In contrast with thesethree systems inflating the model does not make sense be-cause we are working with horizons. Paiva et al. [PAVCS11]present tools to edit and manipulate 4− 8 adaptive meshes.However, the domain obligate us to create a different set ofoperators. We use parametric surfaces in our system to guidethe modeling sections, conversely, Cherlin et al. [CSCSJ05]only used this representation in their SBM system. For amore general classification and taxonomy for SBIM systemsconsult the work of Olsen et al. [OSCSJ09].
Many works have successfully used SBM techniques tocreate intuitive work flows and tools for specific tasks anddomains. For instance, Anastacio et al. [ASSJ06] proposeda sketch-based interface for modeling plant structures withphyllotactic arrangements. Kara and Shimada [KS07] pre-sented a system for the styling design of 3D objects. Thesame authors present, one year later [KS08], a method tohelp car designers to create their final model starting from2D concepts sketches. Wither et al. [WBCG09] approacha botanic problem of modeling trees using sketches of fo-liage silhouettes. Lin et al. [LIMS10] create a sketch-basedsystem for the design of sitting posses. Finally, Applegateet al. [ALD11] presented a SBM tool to design realisticroad networks for virtual environments. Overall, differentdomains and specific tasks have had a great impact in thesketch-based research community, they bring motivationsand challenges to create new set of intuitive modeling tools.
Although our domain is geological, the application con-straints impose us a different set of solutions that have beendeveloped by recent works in terrain sketch-based modeling.These systems usually have as a main target the creation ofmountains and valleys [BMV∗11,HGA∗10,GMS09]. On theother hand, we should follow the seismic volume constraints.So then, some of our operators where designed to allow theexpert to use the geological information as a guide.
Most horizon extraction methods are tightly bound to theunderlying seismic data due to autotracking (e.g., [FP04]).These automatic methods for extracting horizons from seis-mic data do not achieve reasonable results due to high noiselevel and uncertainty. Some semi-automatic methods havebeen introduced recently. Patel et al. [PBVG10] pre-segmentthe seismic volume using each voxel as a seed to a growingsurface method. The preprocessing is time consuming, but
c© The Eurographics Association 2012.
2
R. Amorim et al. / Sketch Modeling of Seismic Horizons from Uncertainty
results in that afterwards, the user can interactively chooseand assemble pre grown horizon parts for creating horizons.Hölt et al. [HBG∗11] propose an interactive system thatcombines 2D and 3D cost minimization techniques to guidethe user through the interpretation horizons process. How-ever, the interactivity is restricted to planes unfolded fromprisms created between wells. Engelsma and Hale [EH10]use paint metaphor to select voxels on the seismic volume,this technique allows a level of interactivity and automation.By the same token, changing already interpreted horizons isalso not straightforward. To the best of our knowledge thiswork is the first to present a large number of specific geolog-ical SBM operators to edit, augment and create horizons.
3. Seismic Background
Interpreting the subsurface is being performed for findingoil and gas. This is typically done by investigating 3D seis-mic reflection volumes which are collected by sending soundwaves into the ground and analyzing the echoes. The soundwaves travel in homogeneous material. When entering a newmaterial with a different impedance, some of the energy isreflected, while the rest continue into the new material. Theamount of energy reflected, increases with the impedancedifference between the layers. The result is that in seismicreflection volumes, various reflecting layer boundaries ofdifferent strength are visible in the seismic data as lineartrends. The task of an interpreter is to identify promisinglayers which may contain oil or gas, based on factors suchas the layer shape, findings in neighboring or similar areas,or based on drilled well samples coregistered with the seis-mic data.
Commercial software for geophysical/geological model-ing used by oil companies includes Petrel [Pet] and Hy-droVR [LLG∗07]. In existing tools, the user can extract sur-faces by selecting a seed point on a strong reflector. The seedpoint is then automatically grown into a surface by followingthe strong reflector through out the volume. These methodsare inaccurate, they can give wrong suggestions and can con-tain holes in noisy areas. In areas where automatic growingfails, the user can draw in horizon lines on vertical equallyspaced cross sections to create a coarse grid of the surface.This grid can be fed as input to a growing method to com-plete it according to the seismic data, or can be given to aninterpolation method for creating a minimum energy surfacethat interpolates the grid independent of the seismic data.The interpreter must use a mix of these methods dependingon the quality of the seismic data. Thus, creating a horizonis detail oriented and time consuming. When new data hasbeen collected, such as a well log, an interpreted horizonmight need to be altered to match the new data. Fast editingof existing horizons according to new hypotheses is not wellsupported with existing tools. It is often easier to recreateparts of a horizon that must be changed rather than alteringit. We introduce sketch-based modelling and editing of hori-
zons for quickly creating them as an alternative to existingdetail oriented and slow methods.
4. System Overview
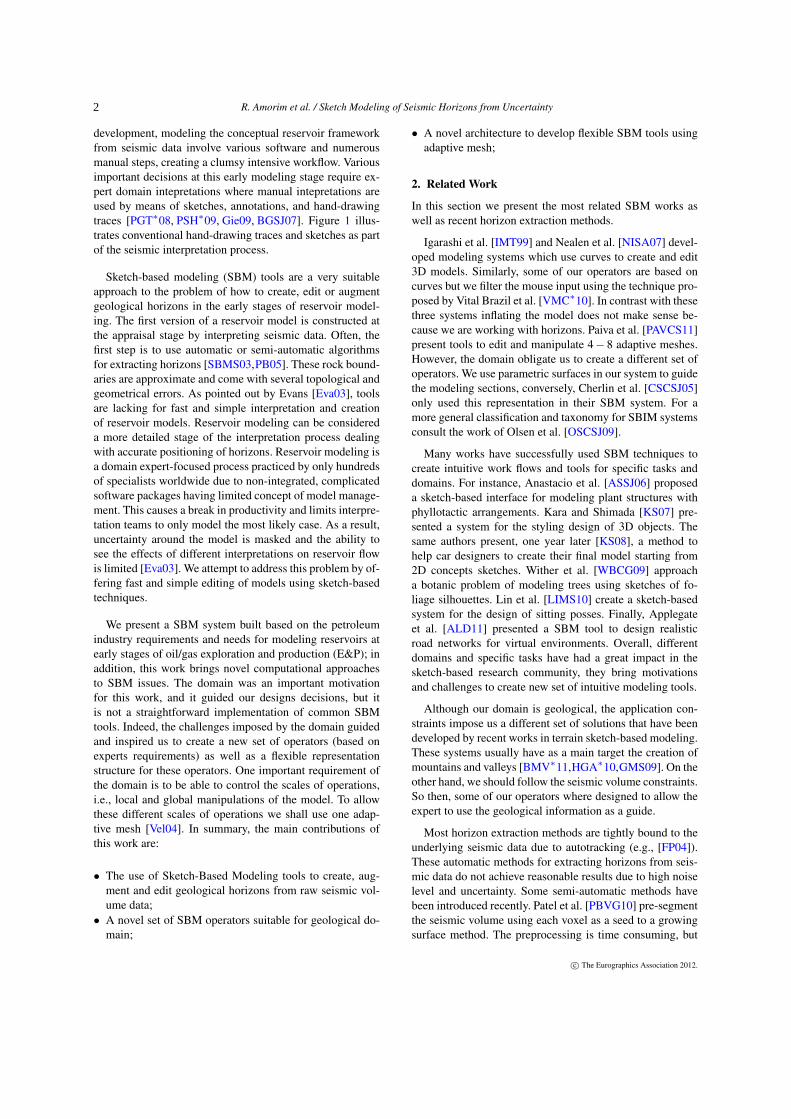
We have created a flexible architecture to develop sketch-based operators to help the user to model and edit horizons ina rapid and intuitive way (Figure 2). Our system has as inputseismic data (reflection volume, distance volume and pre-extracted horizons as shown in Figure 3(a,b,c)), which con-tains information to guide the experts. The seismic reflectionvolume data was described in Section 3. The distance vol-ume data and the pre-extracted horizons are pre-computedusing the method introduced by Patel et al. [PBVG10]. De-tails about the input data can be found in Section 4.1. Afterloading the input data the user can select between differentoperators designed specifically to meet the experts needs inediting horizons. Each operator has its own types of interac-tion, including drawing free-form strokes on the actual hori-zon surface and/or a seismic volume surface.
Figure 2: System interface. Visualization tools on the left,viewer and sketch area in the middle and the operators listand its parameters on the right.
Due to the locality of some operators and the different res-olutions they work, we decided to use an adaptive mesh topermit such different types of interaction. Our choice for the4− 8 adaptive mesh [Vel04] allows us to introduce a newarchitecture where the operators are not forced to work withthe same surface representation. Instead, each operator canwork with its own surface representation, e.g., heightmap,Coons, triangle soup. In addition, these operators can be im-plemented as separated modules. This approach helps to dealwith the restrictions or difficulties of working with a singlerepresentation. Details about the adaptive mesh used will bepresented in Section 4.2. The operators implemented will bepresented in Section 5.
c© The Eurographics Association 2012.
3
R. Amorim et al. / Sketch Modeling of Seismic Horizons from Uncertainty
4.1. Workflow
Our system starts modeling horizons from pre-extractedhorizons (Figure 3(c)). Even though it is possible to modelone or more horizons from scratch. The complete work-flow includes the automatically extracted horizons and a dis-tance volume that permits the creation of important model-ing and editing operations. Figure 3 presents the completeinput dataset.
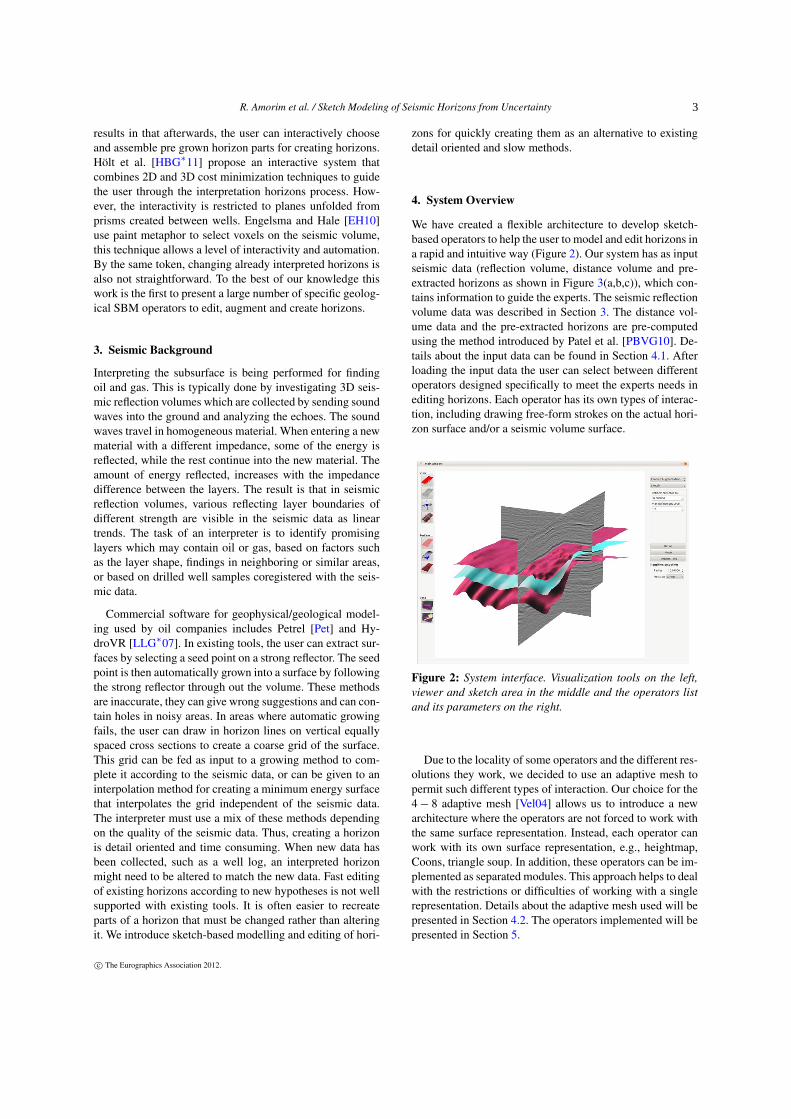
Figure 3: Input data: (a) seismic volume, (b) distance vol-ume and (c) pre-extracted horizon. Horizon map consistingof (d) height map and (e) hole map.
The seismic volume (Figure 3(a)) has in each voxel thevalue of the seismic reflection where lighter gray representsmore reflection and indicates the presence of a horizon. Thedistance volume (Figure 3(b)) is pre-computed using theseismic reflection volume. Each voxel of the seismic reflec-tion volume is used as a seed for a segmentation using asurface growing method [PBVG10]. This method results ina set of horizon patches that are stored in the distance vol-ume. That means, the distance-volume voxel stores the dis-tance to the closest horizon patch segmented. In Figure 3(b)we depicted the distance volume with light gray voxels rep-resenting voxels that are farther from a horizon patch thandarker voxels.
The pre-extracted horizons (Figure 3(c)) are assembledusing the distance volume by combining different hori-zon patches in an interactive session as described by Patelet al. [PBVG10]. These pre-extracted horizons need to betransformed to a surface representation suitable to our sys-tem. This data comes as a triangle soup and is transformedinto a horizon map, filtering some noise from the originaldata. This horizon map data is a combination of two differ-ent maps: a height map and a hole map (Figure 3(d,e)). Itis important to notice that the input horizons usually comewith holes that have to be filled in order to create a heightmap. The holes are filled using a bilinear interpolation of theclosest non-hole parts on the right, left, up and down of the
interpolated point. Besides that, a hole map keeps the origi-nal holes of the extracted data. We adapt a 4−8 mesh to theheight map and then the horizon is now ready to be editedand augmented using the set of operators.
We propose a simple and flexible architecture. The systemis divided in two modules the main program and operators.The main program is responsible for: managing the horizons(4− 8 meshes), loading input data, switching the operators,and visualizing. The operators are responsible for modifyingthe horizons. They have access to input data and also createthe policies to change the geometry and/or parameters of thesurface. The proposed architecture allows the incorporationof new operators without any changes in other parts of thesystem. Operators will be described in more details in Sec-tion 5.
4.2. Adaptive Mesh
It is very important in the context of this work to use adaptivemeshes. Adaptive meshes provide means of having differentlevels of details within the same mesh. The sketch operationspresented in this work are in general local and require differ-ent resolutions of the mesh. Usually when we think about ahorizon it is a piecewise smooth surface, thus, triangles meshis an approximation of this surface. Furthermore, there is anerror associated with this mesh and a refinement process isdone to reduce this error. The use of adaptive meshes avoidsthe need of a highly refined mesh in areas where the refine-ment is not necessary. The 4− 8 mesh deals with the adap-tive refinement in a transparent way refining the surround-ing areas the minimum necessary without the use of differ-ent templates and preserving its original structure (Figure 9).Overall, the qualities of the 4− 8 mesh allow us to create avariety of different kinds of operators, each one may haveits own surface representation, e.g., height map, parametricsurfaces, implicit surfaces, among others.
The 4− 8 mesh always begins from a base mesh that hasthe desired topology and overall shape needed. This basemesh will be our first approximation, after that, it will beadapted to the desired shape. For our domain application theconstruction of the base mesh is simple because a plane ap-proximates well the horizon. The adaptation stage is split intwo steps. First we move the vertices on the surface and thenwe refine to decrease the mesh approximation error. Bothsteps are performed by policies that will be defined by theoperators.
We extended the triangle mesh to support different flavorsof information. This information allows the operators to per-form complex tasks efficiently, moreover, it guarantees thecoherence between operators. Each vertex encodes paramet-ric coordinates u and v and the signed distance to the actualsketch, where this distance is calculated in the parametricspace. The horizon map is also part of our surface providingmeans of performing some specific operations.
c© The Eurographics Association 2012.
4
R. Amorim et al. / Sketch Modeling of Seismic Horizons from Uncertainty
5. Operators
One of the main challenges creating SBM systems is to de-fine a flexible representation, which allows different formsto manipulate/create the models. Usually, the representationdefines the operators and limitations of the system. For in-stance, using implicit surfaces is hard/expensive to representdetails. On the other hand, height maps can represent de-tails but has others limitations, such as the model should bea function of a planar domain. In this work we present adifferent approach, where each operator can use a differentrepresentation, which fits the operation needs. This strategyavoids complications imposed by a single main surface rep-resentation.
The operators are an abstract entity to perform changesin the surface, as mentioned in Section 4.2, they implementadaptation to manipulate the 4− 8 meshes. The operatorsare also registered to receive the input from mouse and key-board in a filtered way with information of which surface andface (triangle) have been clicked. This information can beused by the operator to implement its sketch metaphors. Thissystem architecture allows the operators’ implementation tobe a module completely separate from the others. Addition-ally, the operators can be connected in a hierarchical model.Making it easier to implement different operations startingfrom basic ones while keeping the whole system manage-able and simple. For instance, the Topology Repair Opera-tor described in Section 5.1 is an example of connecting twooperators. The next sections will describe the operators im-plemented for this work.
5.1. Topology Repair
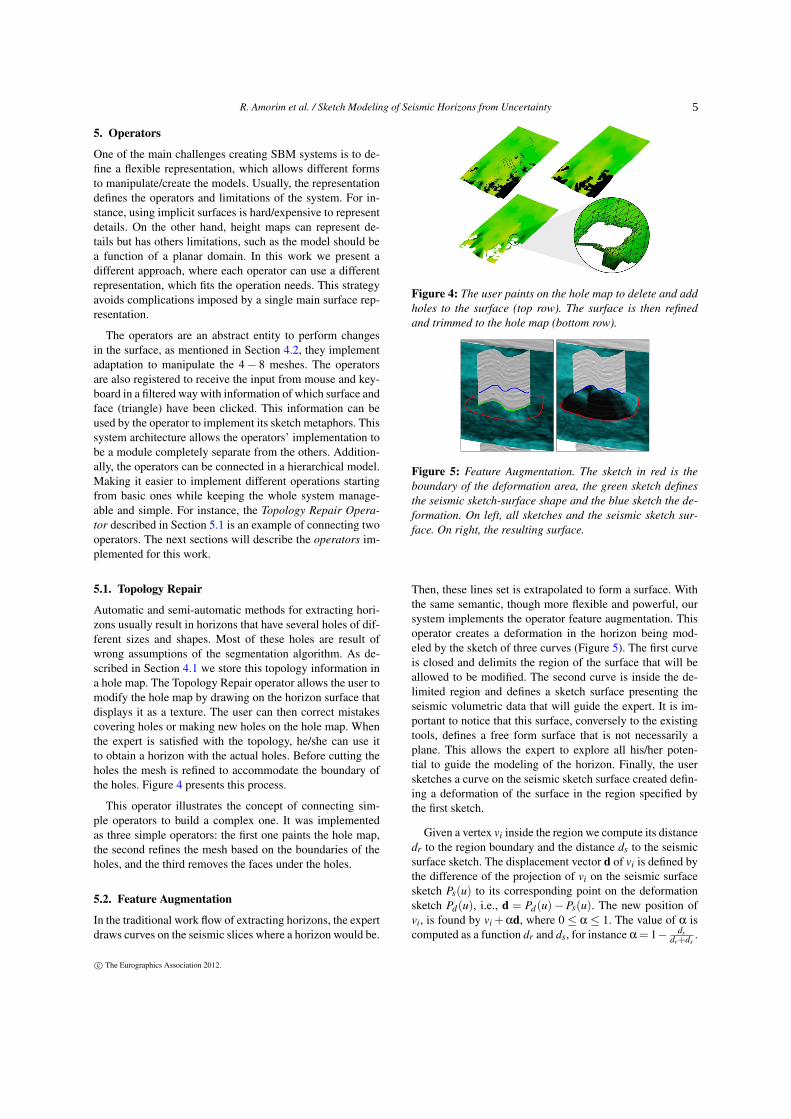
Automatic and semi-automatic methods for extracting hori-zons usually result in horizons that have several holes of dif-ferent sizes and shapes. Most of these holes are result ofwrong assumptions of the segmentation algorithm. As de-scribed in Section 4.1 we store this topology information ina hole map. The Topology Repair operator allows the user tomodify the hole map by drawing on the horizon surface thatdisplays it as a texture. The user can then correct mistakescovering holes or making new holes on the hole map. Whenthe expert is satisfied with the topology, he/she can use itto obtain a horizon with the actual holes. Before cutting theholes the mesh is refined to accommodate the boundary ofthe holes. Figure 4 presents this process.
This operator illustrates the concept of connecting sim-ple operators to build a complex one. It was implementedas three simple operators: the first one paints the hole map,the second refines the mesh based on the boundaries of theholes, and the third removes the faces under the holes.
5.2. Feature Augmentation
In the traditional work flow of extracting horizons, the expertdraws curves on the seismic slices where a horizon would be.
Figure 4: The user paints on the hole map to delete and addholes to the surface (top row). The surface is then refinedand trimmed to the hole map (bottom row).
Figure 5: Feature Augmentation. The sketch in red is theboundary of the deformation area, the green sketch definesthe seismic sketch-surface shape and the blue sketch the de-formation. On left, all sketches and the seismic sketch sur-face. On right, the resulting surface.
Then, these lines set is extrapolated to form a surface. Withthe same semantic, though more flexible and powerful, oursystem implements the operator feature augmentation. Thisoperator creates a deformation in the horizon being mod-eled by the sketch of three curves (Figure 5). The first curveis closed and delimits the region of the surface that will beallowed to be modified. The second curve is inside the de-limited region and defines a sketch surface presenting theseismic volumetric data that will guide the expert. It is im-portant to notice that this surface, conversely to the existingtools, defines a free form surface that is not necessarily aplane. This allows the expert to explore all his/her poten-tial to guide the modeling of the horizon. Finally, the usersketches a curve on the seismic sketch surface created defin-ing a deformation of the surface in the region specified bythe first sketch.
Given a vertex vi inside the region we compute its distancedr to the region boundary and the distance ds to the seismicsurface sketch. The displacement vector d of vi is defined bythe difference of the projection of vi on the seismic surfacesketch Ps(u) to its corresponding point on the deformationsketch Pd(u), i.e., d = Pd(u)−Ps(u). The new position ofvi, is found by vi +αd, where 0 ≤ α ≤ 1. The value of α iscomputed as a function dr and ds, for instance α= 1− ds
dr+ds.
c© The Eurographics Association 2012.
5
R. Amorim et al. / Sketch Modeling of Seismic Horizons from Uncertainty
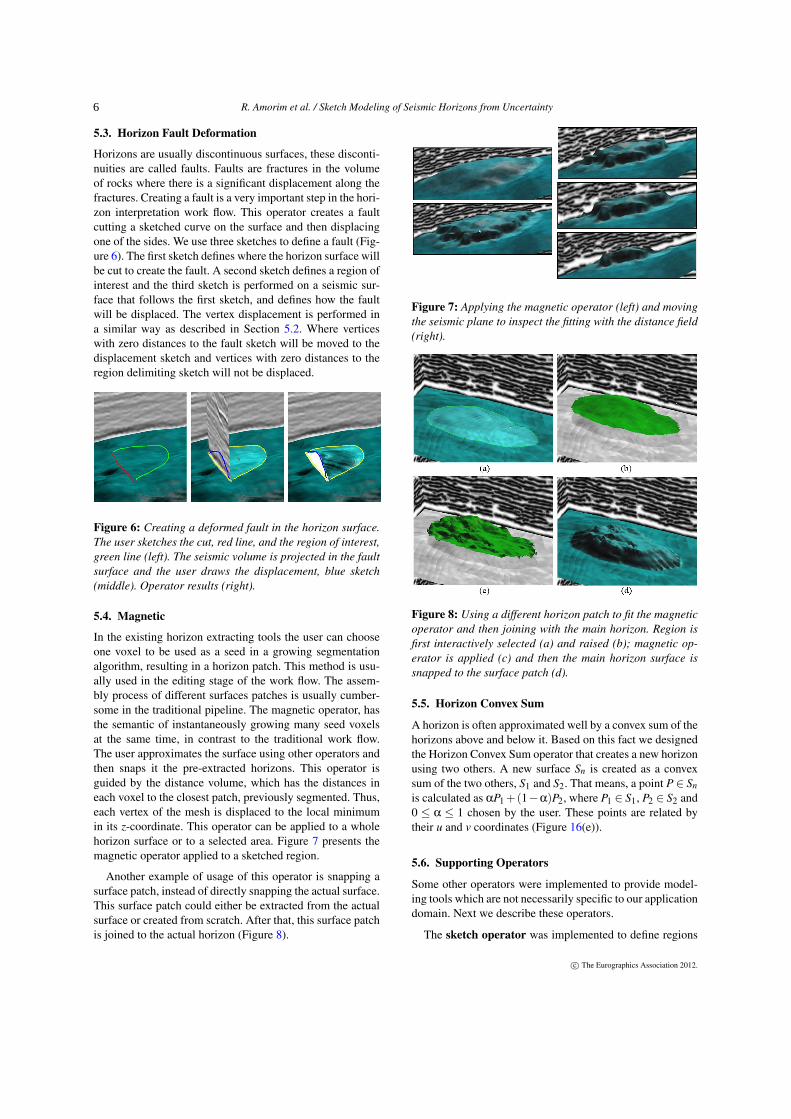
5.3. Horizon Fault Deformation
Horizons are usually discontinuous surfaces, these disconti-nuities are called faults. Faults are fractures in the volumeof rocks where there is a significant displacement along thefractures. Creating a fault is a very important step in the hori-zon interpretation work flow. This operator creates a faultcutting a sketched curve on the surface and then displacingone of the sides. We use three sketches to define a fault (Fig-ure 6). The first sketch defines where the horizon surface willbe cut to create the fault. A second sketch defines a region ofinterest and the third sketch is performed on a seismic sur-face that follows the first sketch, and defines how the faultwill be displaced. The vertex displacement is performed ina similar way as described in Section 5.2. Where verticeswith zero distances to the fault sketch will be moved to thedisplacement sketch and vertices with zero distances to theregion delimiting sketch will not be displaced.
Figure 6: Creating a deformed fault in the horizon surface.The user sketches the cut, red line, and the region of interest,green line (left). The seismic volume is projected in the faultsurface and the user draws the displacement, blue sketch(middle). Operator results (right).
5.4. Magnetic
In the existing horizon extracting tools the user can chooseone voxel to be used as a seed in a growing segmentationalgorithm, resulting in a horizon patch. This method is usu-ally used in the editing stage of the work flow. The assem-bly process of different surfaces patches is usually cumber-some in the traditional pipeline. The magnetic operator, hasthe semantic of instantaneously growing many seed voxelsat the same time, in contrast to the traditional work flow.The user approximates the surface using other operators andthen snaps it the pre-extracted horizons. This operator isguided by the distance volume, which has the distances ineach voxel to the closest patch, previously segmented. Thus,each vertex of the mesh is displaced to the local minimumin its z-coordinate. This operator can be applied to a wholehorizon surface or to a selected area. Figure 7 presents themagnetic operator applied to a sketched region.
Another example of usage of this operator is snapping asurface patch, instead of directly snapping the actual surface.This surface patch could either be extracted from the actualsurface or created from scratch. After that, this surface patchis joined to the actual horizon (Figure 8).
Figure 7: Applying the magnetic operator (left) and movingthe seismic plane to inspect the fitting with the distance field(right).
Figure 8: Using a different horizon patch to fit the magneticoperator and then joining with the main horizon. Region isfirst interactively selected (a) and raised (b); magnetic op-erator is applied (c) and then the main horizon surface issnapped to the surface patch (d).
5.5. Horizon Convex Sum
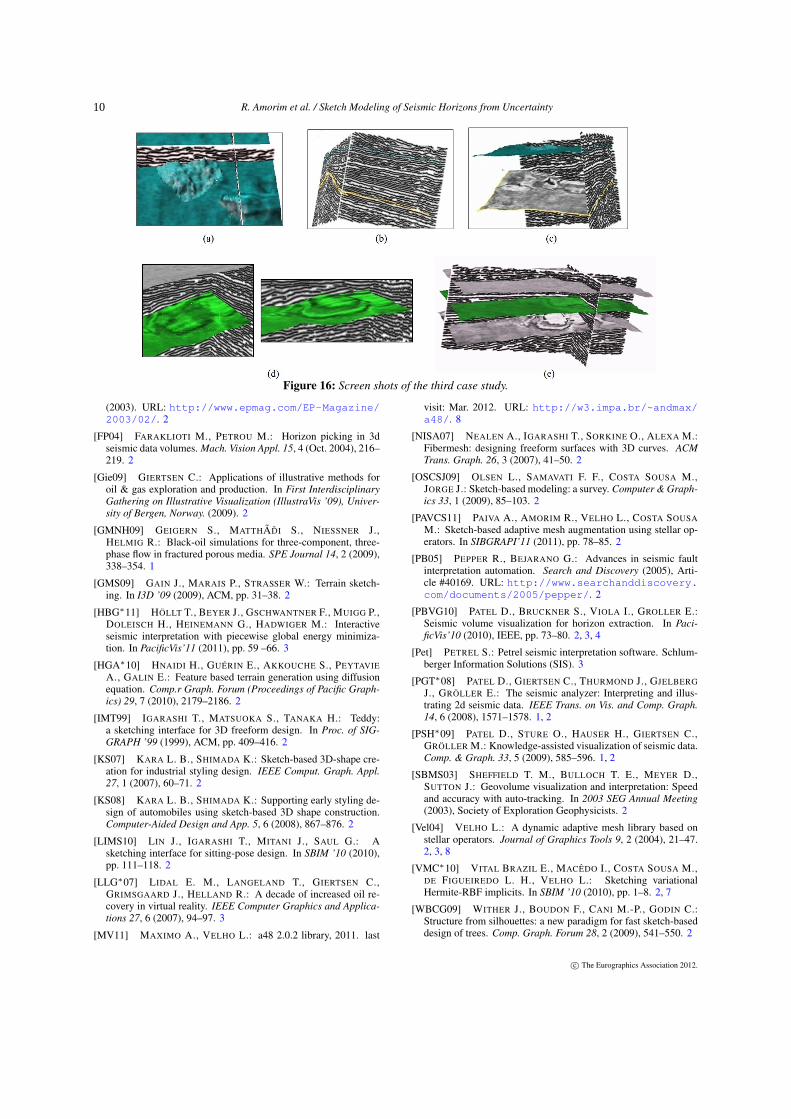
A horizon is often approximated well by a convex sum of thehorizons above and below it. Based on this fact we designedthe Horizon Convex Sum operator that creates a new horizonusing two others. A new surface Sn is created as a convexsum of the two others, S1 and S2. That means, a point P ∈ Snis calculated as αP1 +(1−α)P2, where P1 ∈ S1, P2 ∈ S2 and0 ≤ α ≤ 1 chosen by the user. These points are related bytheir u and v coordinates (Figure 16(e)).
5.6. Supporting Operators
Some other operators were implemented to provide model-ing tools which are not necessarily specific to our applicationdomain. Next we describe these operators.
The sketch operator was implemented to define regions
c© The Eurographics Association 2012.
6
R. Amorim et al. / Sketch Modeling of Seismic Horizons from Uncertainty
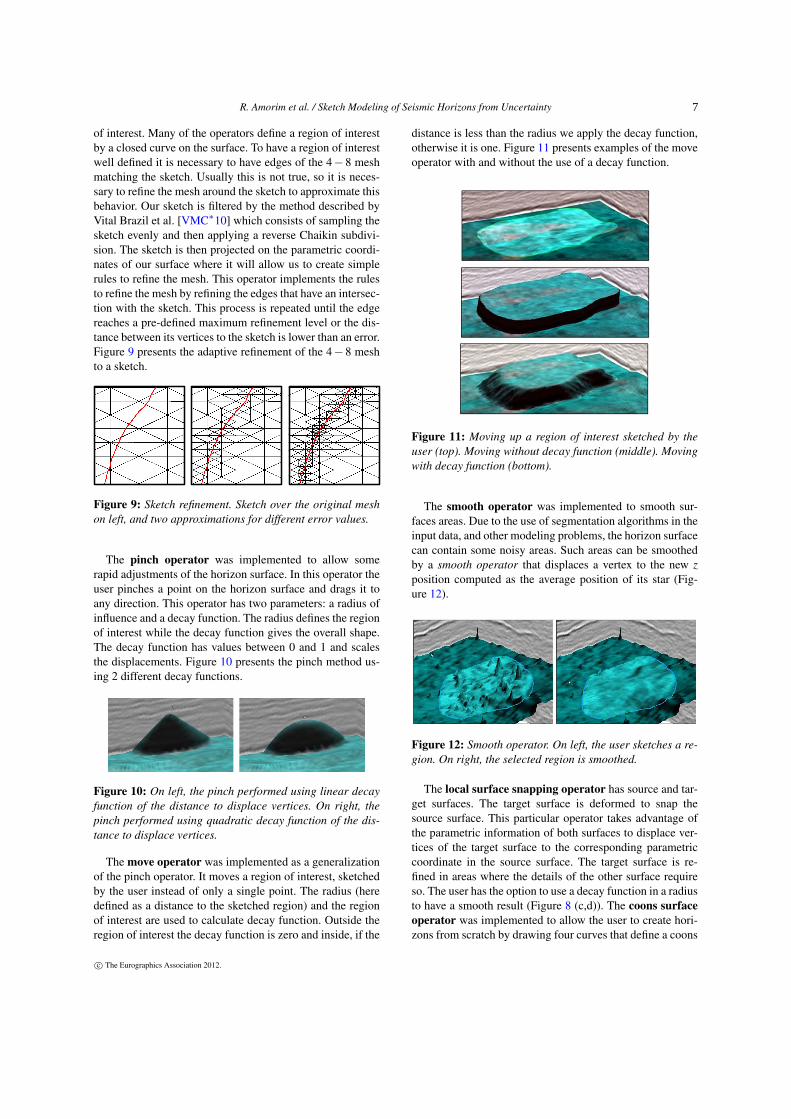
of interest. Many of the operators define a region of interestby a closed curve on the surface. To have a region of interestwell defined it is necessary to have edges of the 4− 8 meshmatching the sketch. Usually this is not true, so it is neces-sary to refine the mesh around the sketch to approximate thisbehavior. Our sketch is filtered by the method described byVital Brazil et al. [VMC∗10] which consists of sampling thesketch evenly and then applying a reverse Chaikin subdivi-sion. The sketch is then projected on the parametric coordi-nates of our surface where it will allow us to create simplerules to refine the mesh. This operator implements the rulesto refine the mesh by refining the edges that have an intersec-tion with the sketch. This process is repeated until the edgereaches a pre-defined maximum refinement level or the dis-tance between its vertices to the sketch is lower than an error.Figure 9 presents the adaptive refinement of the 4− 8 meshto a sketch.
Figure 9: Sketch refinement. Sketch over the original meshon left, and two approximations for different error values.
The pinch operator was implemented to allow somerapid adjustments of the horizon surface. In this operator theuser pinches a point on the horizon surface and drags it toany direction. This operator has two parameters: a radius ofinfluence and a decay function. The radius defines the regionof interest while the decay function gives the overall shape.The decay function has values between 0 and 1 and scalesthe displacements. Figure 10 presents the pinch method us-ing 2 different decay functions.
Figure 10: On left, the pinch performed using linear decayfunction of the distance to displace vertices. On right, thepinch performed using quadratic decay function of the dis-tance to displace vertices.
The move operator was implemented as a generalizationof the pinch operator. It moves a region of interest, sketchedby the user instead of only a single point. The radius (heredefined as a distance to the sketched region) and the regionof interest are used to calculate decay function. Outside theregion of interest the decay function is zero and inside, if the
distance is less than the radius we apply the decay function,otherwise it is one. Figure 11 presents examples of the moveoperator with and without the use of a decay function.
Figure 11: Moving up a region of interest sketched by theuser (top). Moving without decay function (middle). Movingwith decay function (bottom).
The smooth operator was implemented to smooth sur-faces areas. Due to the use of segmentation algorithms in theinput data, and other modeling problems, the horizon surfacecan contain some noisy areas. Such areas can be smoothedby a smooth operator that displaces a vertex to the new zposition computed as the average position of its star (Fig-ure 12).
Figure 12: Smooth operator. On left, the user sketches a re-gion. On right, the selected region is smoothed.
The local surface snapping operator has source and tar-get surfaces. The target surface is deformed to snap thesource surface. This particular operator takes advantage ofthe parametric information of both surfaces to displace ver-tices of the target surface to the corresponding parametriccoordinate in the source surface. The target surface is re-fined in areas where the details of the other surface requireso. The user has the option to use a decay function in a radiusto have a smooth result (Figure 8 (c,d)). The coons surfaceoperator was implemented to allow the user to create hori-zons from scratch by drawing four curves that define a coons
c© The Eurographics Association 2012.
7

R. Amorim et al. / Sketch Modeling of Seismic Horizons from Uncertainty
surface. Figure 16(b, c) present this operator and a horizoncreated.
The surface extractor operator duplicates one region ofa horizon as a new surface patch. The region is defined by aclosed curve sketched by the user (Figure 8).
6. Results and Discussions
In this section we present three case studies of usage of oursystem combining different operators. We also present pre-liminary user feedbacks and technical aspects of the imple-mentation. Finally, we discuss some limitations of our sys-tem.
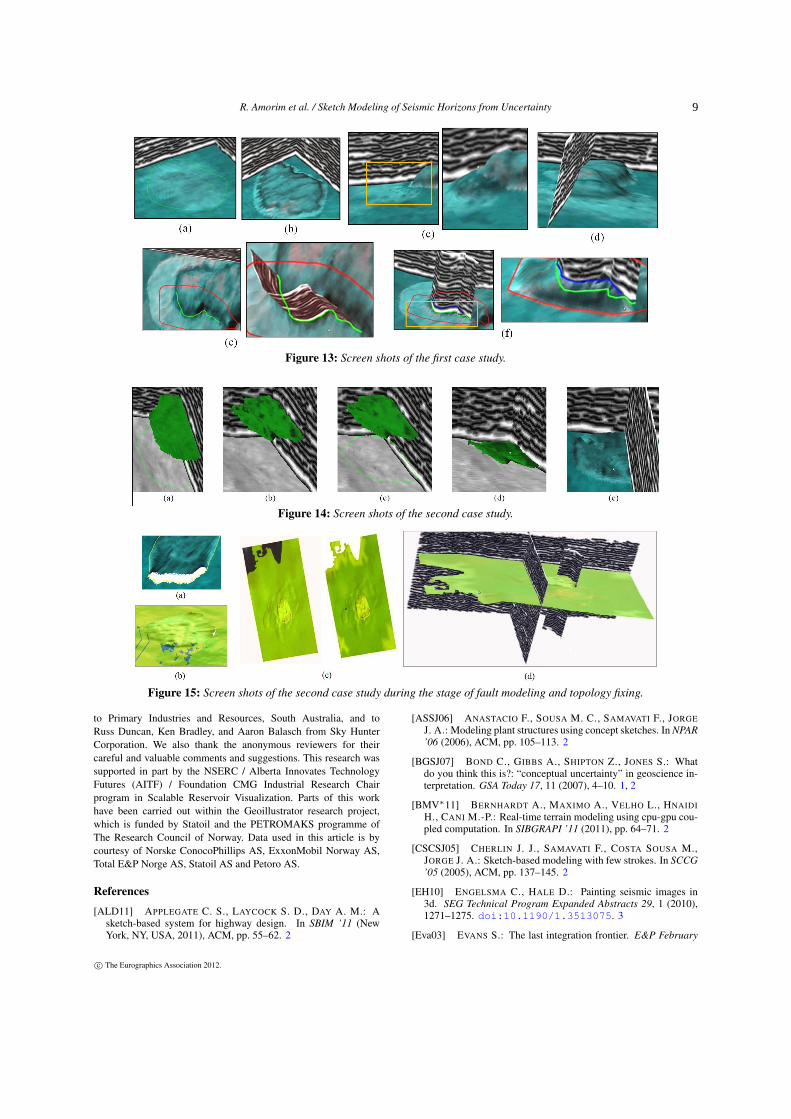
In our first case study (Figure 13) we deform a pre-extracted horizon in an area with potential problem. A re-gion of interest is sketched and is moved up guided by thedistance volume (a,b). The magnetic operator is then appliedto the same region to fit to the horizon candidates nearby(b). The magnetic operator yields a noisy surface that we ap-ply the smooth operator to have a more regular surface (b).The surface is then freely edited in areas around the previ-ous sketch by the pinch operator (c). Since we have the seis-mic reflection as a 3D texture in the horizon the user uses itto guide the pinch. Then the magnetic operator is applied inconjunction with the smooth operator again to fit the pinchedareas (d). The user then uses the feature augmentation oper-ator to perform the final horizon adjustments (e,f).
In the second case study, in the first stage (Figure 14), a re-gion is sketched and a surface patch is extracted from there.The surface patch is then moved to a desired region andsnapped to a candidate horizon with the magnetic operator(b). The smooth operator is applied resulting in a more regu-lar surface (c). The surface patch is now moved back to levelof the surface it was extracted from (d) and then snapped,copying characteristics of the horizon candidate above thehorizon being modeled (e). In the second stage (Figure 15),a fault is created and deformed based on the seismic data(a). Finally, the repair operator is applied and the hole mapis modified to fix wrong holes of the pre-extracted horizon (b,c). The horizon is then trimmed by the new hole map (c,d).
In our final case study (Figure 16) we start from one well-finished horizon (a). Then, a new horizon is created fromscratch by drawing four curves using as a guide the distancevolume slices (b, c). A region of the newly created horizonis adjusted by sketching a region that is moved up and thensnapped to a candidate horizon using the magnetic operator(d). Finally, a new horizon is created as a convex sum ofthe two existing horizons and then fitted with the magneticoperator (e).
Our system is still in process of evaluation by collabora-tors in the geological domain. Their evaluation so far havebeen positive, with some suggestions of new operators andadjustments. The magnetic operator was well received when
used in conjunction of the smooth operator. The horizonfault deformation operator was observed to be very usefulbecause one of the main drawbacks of the actual horizon ex-traction pipeline is to model faults. But some suggestionswere made to improve the system and operators, includingallowing more flexible ways of drawing faults and a betternavigation (compass and scale). Our system also has otherlimitations such as the lack of visual feedback for operatorslike pinch and repair, where a region of influence could guidethe user better. The fault deformation operator would benefitof an edge snapping operator allowing a more precise cut ofthe surface. Other operators could also benefit of the sameedge snapping although it is not a perfect solution becausethe snapping can modify the geometry in regions where theuser does not want to change.
The prototype of our system was implemented to test dif-ferent operators and how they can be combined to performmore complex tasks. The system was implemented using theC++ programming language, the visual interface was builtusing Qt and we used the 4− 8 adaptive mesh library de-scribed by Velho [Vel04] and available in [MV11]. All casestudies were generated on a 2.66 GHz Intel Xeon W3520,4GB RAM and OpenGL/nVidia GeForce GTX470 Graph-ics. All operators achieved interactive time. The most ex-pensive operation is deleting faces (used in topology repairand horizon fault deformation operators) depending on thenumber of faces being deleted it could take about 4 seconds(deleting 2.5k triangles from a 70k triangles mesh). The rea-son is the need to rebuilt the mesh connectivity. Finally, tospeed up the evaluation of surface properties given (u,v) co-ordinates we implement a simple quadtree.
7. Conclusion and Future Work
In this work we presented a SBM system to model geolog-ical horizons. This system provides a new set of operatorsdesigned with the geological domain in mind to help the ex-pert to edit, model and augment horizons. To develop thesystem we presented a novel architecture to create flexibleSBM tools using an adaptive mesh. The SBM tools devel-oped have shown promising results in terms of allowing amore intuitive and rapid modeling of horizons.
The tools we presented in this paper are part of a first pro-totype under joint research and development with partnersfrom the oil and gas industry. As future work we plan to ex-tend our system to have more operators and formal systemand usability evaluations following guidelines provided byexperts feedbacks and requirements from specific reservoirmodeling and geological scenario studies.
Acknowledgments
We would like to thank our colleagues for their useful dis-cussions and advice, in particular to Felipe Albuquerque Portellaand Camila Faria de Albuquerque from Petrobras SA. Many thanks
c© The Eurographics Association 2012.
8
R. Amorim et al. / Sketch Modeling of Seismic Horizons from Uncertainty
Figure 13: Screen shots of the first case study.
Figure 14: Screen shots of the second case study.
Figure 15: Screen shots of the second case study during the stage of fault modeling and topology fixing.
to Primary Industries and Resources, South Australia, and toRuss Duncan, Ken Bradley, and Aaron Balasch from Sky HunterCorporation. We also thank the anonymous reviewers for theircareful and valuable comments and suggestions. This research wassupported in part by the NSERC / Alberta Innovates TechnologyFutures (AITF) / Foundation CMG Industrial Research Chairprogram in Scalable Reservoir Visualization. Parts of this workhave been carried out within the Geoillustrator research project,which is funded by Statoil and the PETROMAKS programme ofThe Research Council of Norway. Data used in this article is bycourtesy of Norske ConocoPhillips AS, ExxonMobil Norway AS,Total E&P Norge AS, Statoil AS and Petoro AS.
References
[ALD11] APPLEGATE C. S., LAYCOCK S. D., DAY A. M.: Asketch-based system for highway design. In SBIM ’11 (NewYork, NY, USA, 2011), ACM, pp. 55–62. 2
[ASSJ06] ANASTACIO F., SOUSA M. C., SAMAVATI F., JORGEJ. A.: Modeling plant structures using concept sketches. In NPAR’06 (2006), ACM, pp. 105–113. 2
[BGSJ07] BOND C., GIBBS A., SHIPTON Z., JONES S.: Whatdo you think this is?: “conceptual uncertainty” in geoscience in-terpretation. GSA Today 17, 11 (2007), 4–10. 1, 2
[BMV∗11] BERNHARDT A., MAXIMO A., VELHO L., HNAIDIH., CANI M.-P.: Real-time terrain modeling using cpu-gpu cou-pled computation. In SIBGRAPI ’11 (2011), pp. 64–71. 2
[CSCSJ05] CHERLIN J. J., SAMAVATI F., COSTA SOUSA M.,JORGE J. A.: Sketch-based modeling with few strokes. In SCCG’05 (2005), ACM, pp. 137–145. 2
[EH10] ENGELSMA C., HALE D.: Painting seismic images in3d. SEG Technical Program Expanded Abstracts 29, 1 (2010),1271–1275. doi:10.1190/1.3513075. 3
[Eva03] EVANS S.: The last integration frontier. E&P February
c© The Eurographics Association 2012.
9
R. Amorim et al. / Sketch Modeling of Seismic Horizons from Uncertainty
Figure 16: Screen shots of the third case study.
(2003). URL: http://www.epmag.com/EP-Magazine/2003/02/. 2
[FP04] FARAKLIOTI M., PETROU M.: Horizon picking in 3dseismic data volumes. Mach. Vision Appl. 15, 4 (Oct. 2004), 216–219. 2
[Gie09] GIERTSEN C.: Applications of illustrative methods foroil & gas exploration and production. In First InterdisciplinaryGathering on Illustrative Visualization (IllustraVis ’09), Univer-sity of Bergen, Norway. (2009). 2
[GMNH09] GEIGERN S., MATTHÃDI S., NIESSNER J.,HELMIG R.: Black-oil simulations for three-component, three-phase flow in fractured porous media. SPE Journal 14, 2 (2009),338–354. 1
[GMS09] GAIN J., MARAIS P., STRASSER W.: Terrain sketch-ing. In I3D ’09 (2009), ACM, pp. 31–38. 2
[HBG∗11] HÖLLT T., BEYER J., GSCHWANTNER F., MUIGG P.,DOLEISCH H., HEINEMANN G., HADWIGER M.: Interactiveseismic interpretation with piecewise global energy minimiza-tion. In PacificVis’11 (2011), pp. 59 –66. 3
[HGA∗10] HNAIDI H., GUÉRIN E., AKKOUCHE S., PEYTAVIEA., GALIN E.: Feature based terrain generation using diffusionequation. Comp.r Graph. Forum (Proceedings of Pacific Graph-ics) 29, 7 (2010), 2179–2186. 2
[IMT99] IGARASHI T., MATSUOKA S., TANAKA H.: Teddy:a sketching interface for 3D freeform design. In Proc. of SIG-GRAPH ’99 (1999), ACM, pp. 409–416. 2
[KS07] KARA L. B., SHIMADA K.: Sketch-based 3D-shape cre-ation for industrial styling design. IEEE Comput. Graph. Appl.27, 1 (2007), 60–71. 2
[KS08] KARA L. B., SHIMADA K.: Supporting early styling de-sign of automobiles using sketch-based 3D shape construction.Computer-Aided Design and App. 5, 6 (2008), 867–876. 2
[LIMS10] LIN J., IGARASHI T., MITANI J., SAUL G.: Asketching interface for sitting-pose design. In SBIM ’10 (2010),pp. 111–118. 2
[LLG∗07] LIDAL E. M., LANGELAND T., GIERTSEN C.,GRIMSGAARD J., HELLAND R.: A decade of increased oil re-covery in virtual reality. IEEE Computer Graphics and Applica-tions 27, 6 (2007), 94–97. 3
[MV11] MAXIMO A., VELHO L.: a48 2.0.2 library, 2011. last
visit: Mar. 2012. URL: http://w3.impa.br/~andmax/a48/. 8
[NISA07] NEALEN A., IGARASHI T., SORKINE O., ALEXA M.:Fibermesh: designing freeform surfaces with 3D curves. ACMTrans. Graph. 26, 3 (2007), 41–50. 2
[OSCSJ09] OLSEN L., SAMAVATI F. F., COSTA SOUSA M.,JORGE J.: Sketch-based modeling: a survey. Computer & Graph-ics 33, 1 (2009), 85–103. 2
[PAVCS11] PAIVA A., AMORIM R., VELHO L., COSTA SOUSAM.: Sketch-based adaptive mesh augmentation using stellar op-erators. In SIBGRAPI’11 (2011), pp. 78–85. 2
[PB05] PEPPER R., BEJARANO G.: Advances in seismic faultinterpretation automation. Search and Discovery (2005), Arti-cle #40169. URL: http://www.searchanddiscovery.com/documents/2005/pepper/. 2
[PBVG10] PATEL D., BRUCKNER S., VIOLA I., GROLLER E.:Seismic volume visualization for horizon extraction. In Paci-ficVis’10 (2010), IEEE, pp. 73–80. 2, 3, 4
[Pet] PETREL S.: Petrel seismic interpretation software. Schlum-berger Information Solutions (SIS). 3
[PGT∗08] PATEL D., GIERTSEN C., THURMOND J., GJELBERGJ., GRÖLLER E.: The seismic analyzer: Interpreting and illus-trating 2d seismic data. IEEE Trans. on Vis. and Comp. Graph.14, 6 (2008), 1571–1578. 1, 2
[PSH∗09] PATEL D., STURE O., HAUSER H., GIERTSEN C.,GRÖLLER M.: Knowledge-assisted visualization of seismic data.Comp. & Graph. 33, 5 (2009), 585–596. 1, 2
[SBMS03] SHEFFIELD T. M., BULLOCH T. E., MEYER D.,SUTTON J.: Geovolume visualization and interpretation: Speedand accuracy with auto-tracking. In 2003 SEG Annual Meeting(2003), Society of Exploration Geophysicists. 2
[Vel04] VELHO L.: A dynamic adaptive mesh library based onstellar operators. Journal of Graphics Tools 9, 2 (2004), 21–47.2, 3, 8
[VMC∗10] VITAL BRAZIL E., MACÊDO I., COSTA SOUSA M.,DE FIGUEIREDO L. H., VELHO L.: Sketching variationalHermite-RBF implicits. In SBIM ’10 (2010), pp. 1–8. 2, 7
[WBCG09] WITHER J., BOUDON F., CANI M.-P., GODIN C.:Structure from silhouettes: a new paradigm for fast sketch-baseddesign of trees. Comp. Graph. Forum 28, 2 (2009), 541–550. 2
c© The Eurographics Association 2012.
10