six sigma project six sigma - institute of industrial and ...€¦ · 3 six sigma d m a i c t...
TRANSCRIPT
1
S I X S I G M A
IAMD C T
Reduce “Dimensional” Rejections Related toGrinding Process on
Precision Aerospace Fasteners
Six Sigma Project
Son D Tran, Director of QA,AFS - Industry Operations

2
S I X S I G M A
IAMD C T
DMAIC REVIEW
DEFINE
MEASURE
ANALYZE
IMPROVE
CONTROL
Develop charterMap the processUnderstand the voice of the customer
Reduce Dimensional Variation - Define

3
S I X S I G M A
IAMD C T
Project Overview :Business CaseInternal rejections of Titanium products cause significant scrap, rework and customerreturns. This level of rejection has affected our Key Performance Indicators (KPI),customer backlogs, and Quality and Delivery Performance ratings to major OEM(Original Equipment Manufacturer). Reduction of Internal rejections will increasecustomer satisfaction and improve our KPI.
Problem StatementDimensional rejections related to the Grinding process(es) of Titanium Hi-Lok inCells 131, 132 and 133 attributed to about 2% rejections of total pieces completed-to-store the last seven months (Sep 01- Feb 02). This attributed to monthly scraploss, plus significant rejections at subsequent processes (i.e., Thread Roll), andincreased in rework and customer returns costs.
Goal StatementReduce dimensional rejections related to Grinding process(es) in Cell 131, 132 &133, by 50% from current FPY base-line plus annual reduction in scrap cost of 30%end of August fiscal year 2002..
Reduce Dimensional Variation - Define
4
S I X S I G M A
IAMD C T
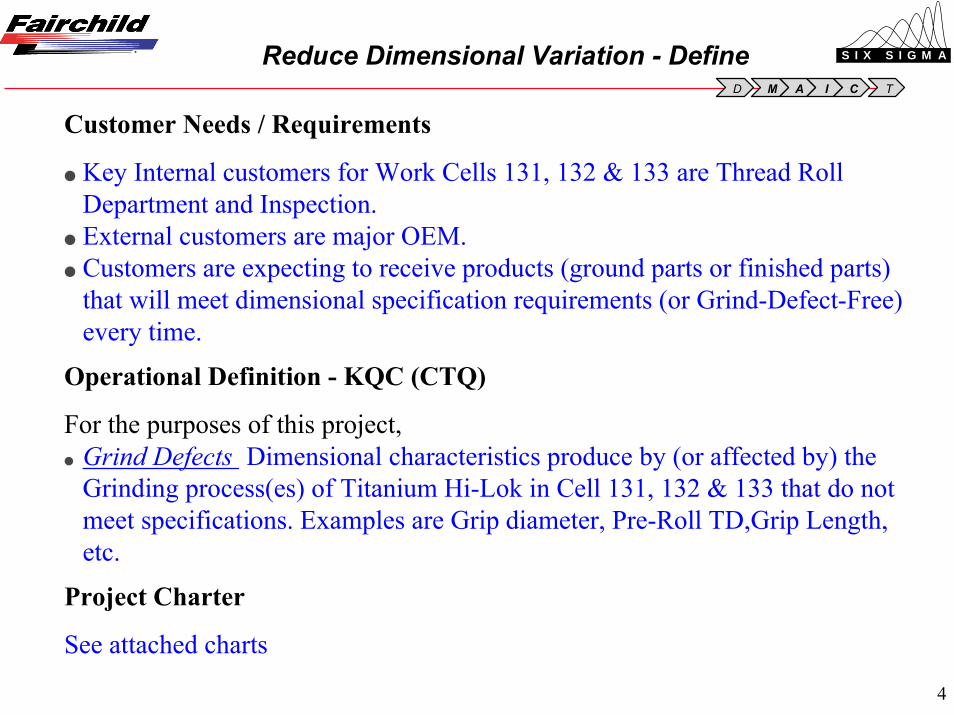
Customer Needs / Requirements
● Key Internal customers for Work Cells 131, 132 & 133 are Thread RollDepartment and Inspection.
● External customers are major OEM.● Customers are expecting to receive products (ground parts or finished parts)
that will meet dimensional specification requirements (or Grind-Defect-Free)every time.
Operational Definition - KQC (CTQ)
For the purposes of this project,● Grind Defects Dimensional characteristics produce by (or affected by) the
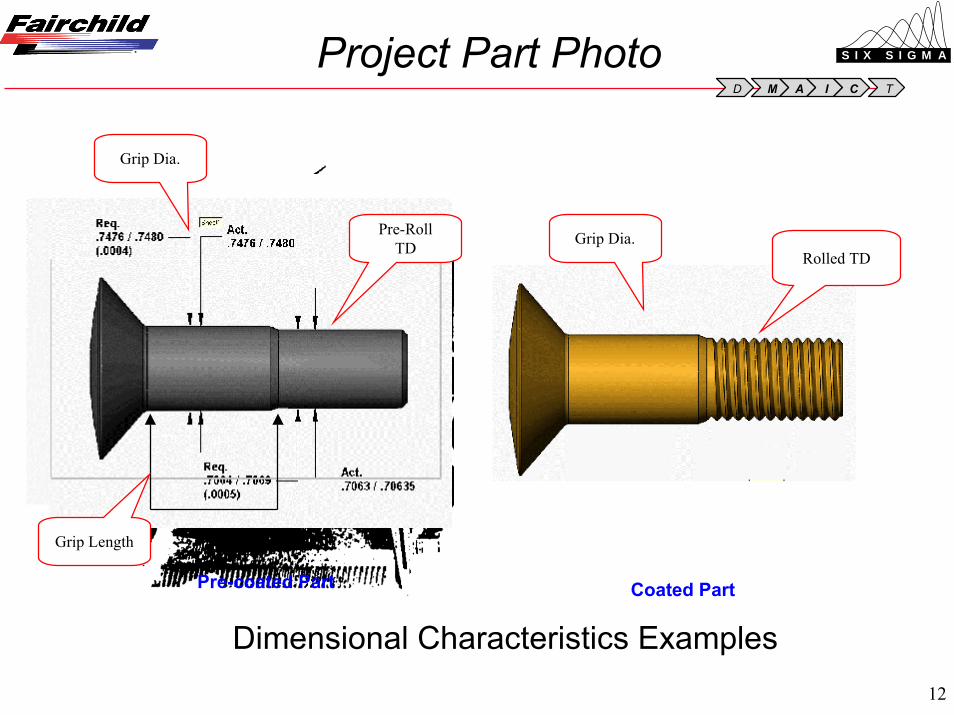
Grinding process(es) of Titanium Hi-Lok in Cell 131, 132 & 133 that do notmeet specifications. Examples are Grip diameter, Pre-Roll TD,Grip Length,etc.
Project Charter
See attached charts
Reduce Dimensional Variation - Define
5
S I X S I G M A
IAMD C T
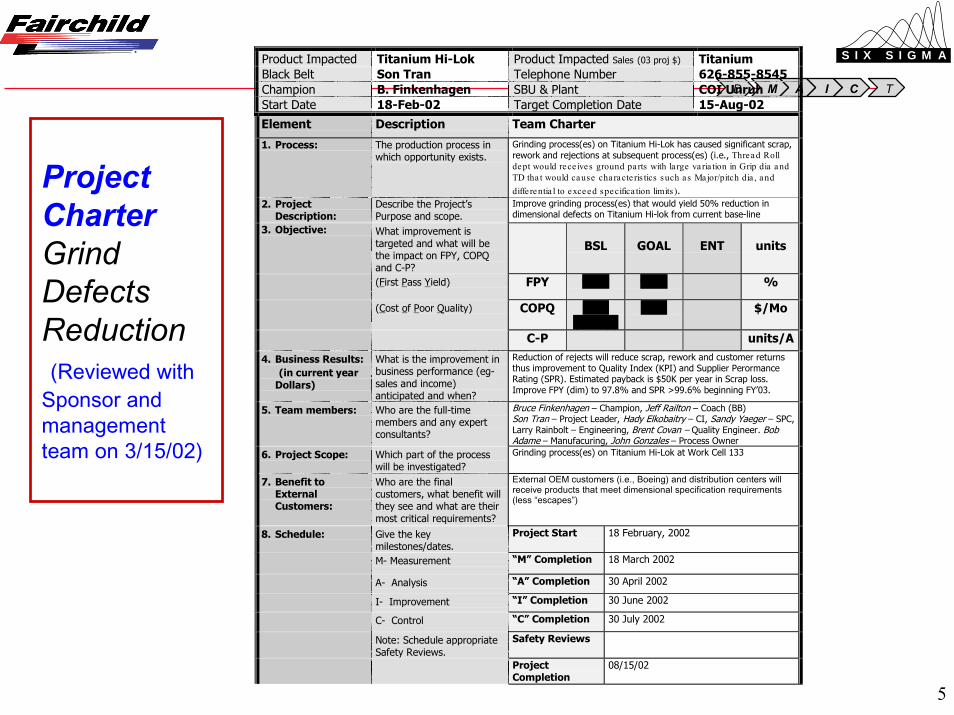
ProjectCharterGrindDefectsReduction (Reviewed withSponsor andmanagementteam on 3/15/02)
Product Impacted Titanium Hi-Lok Product Impacted Sales (03 proj $) TitaniumBlack Belt Son Tran Telephone Number 626-855-8545Champion B. Finkenhagen SBU & Plant COI UnruhStart Date 18-Feb-02 Target Completion Date 15-Aug-02Element Description Team Charter
1. Process: The production process inwhich opportunity exists.
Grinding process(es) on Titanium Hi-Lok has caused significant scrap,rework and rejections at subsequent process(es) (i.e., Thread Rolldept would rece ives ground pa rts with la rge va ria tion in Grip dia andTD tha t would cause cha racte ris tics such as Major/pitch dia , anddiffe rentia l to exceed specifica tion limits ).
2. ProjectDescription:
Describe the Project’sPurpose and scope.
Improve grinding process(es) that would yield 50% reduction indimensional defects on Titanium Hi-lok from current base-line
3. Objective: What improvement istargeted and what will bethe impact on FPY, COPQand C-P?
BSL GOAL ENT units
(First Pass Yield) FPY 95.6 97.8 %
(Cost of Poor Quality) COPQ 9K+(Scrap)
<5K $/Mo
C-P units/A
4. Business Results: (in current year
Dollars)
What is the improvement inbusiness performance (eg-sales and income)anticipated and when?
Reduction of rejects will reduce scrap, rework and customer returnsthus improvement to Quality Index (KPI) and Supplier PerormanceRating (SPR). Estimated payback is $50K per year in Scrap loss.Improve FPY (dim) to 97.8% and SPR >99.6% beginning FY’03.
5. Team members: Who are the full-timemembers and any expertconsultants?
Bruce Finkenhagen – Champion, Jeff Railton – Coach (BB)Son Tran – Project Leader, Hady Elkobaitry – CI, Sandy Yaeger – SPC,Larry Rainbolt – Engineering, Brent Covan – Quality Engineer. BobAdame – Manufacuring, John Gonzales – Process Owner
6. Project Scope: Which part of the processwill be investigated?
Grinding process(es) on Titanium Hi-Lok at Work Cell 133
7. Benefit toExternalCustomers:
Who are the finalcustomers, what benefit willthey see and what are theirmost critical requirements?
External OEM customers (i.e., Boeing) and distribution centers willreceive products that meet dimensional specification requirements(less “escapes”)
8. Schedule: Give the keymilestones/dates.
Project Start 18 February, 2002
M- Measurement “M” Completion 18 March 2002
A- Analysis “A” Completion 30 April 2002
I- Improvement “I” Completion 30 June 2002
C- Control “C” Completion 30 July 2002
Note: Schedule appropriateSafety Reviews.
Safety Reviews
ProjectCompletion
08/15/02

6
S I X S I G M A
IAMD C T
Project Summary• Purpose
Reduce “escapes” thus increase “Supplier Performance Rating” >99.6%Reduce scrap, rework and customer returns. Increase avenue hence job retention• Importance
• Scope
• Measure
• ResourcesBruce Finkenhagen - VP Operations - Team SponsorEd Johnson - Senior VP Quality Assurance - Team SponsorSon Tran - Team LeaderBrent Covan - Quality EngineerLarry Rainbolt - Manufacturing EngineerBob Adame - Grinding Team LeadHady Elkobaitry - Continuous Improvement Manager(BB)Sandy Yaeger - SPC Manager (BB)John Gonzales - Manufacturing Manager
Grinding Processes of Titanium Hi-Lock at Work Cell 133
Improve machine capability with no “major” capital investment expenditure
Defect = Dimensional characteristics that do not meet specificationsGoal = Reduce 50% dimensional defects at Grinding from current FPY base line
Improve machine capability by identifying the major process element(s) through datacollection and process analysis, then establish and maintain process parameters tocontrol the process. Complete in (6) month
• Deliverables
Reduce “Dimensional” Rejections Related to Grinding Process of Titanium Hi-Lok
7
S I X S I G M A
IAMD C T
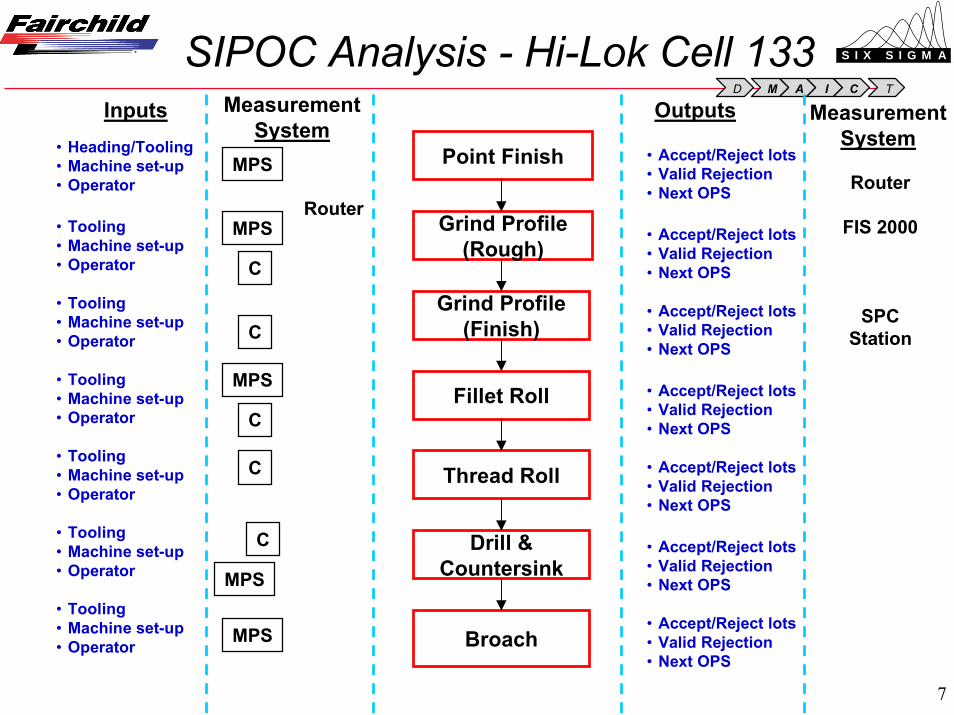
OutputsInputs MeasurementSystem
Router
MeasurementSystem
Router
FIS 2000
SPCStation
MPS
MPS
Point Finish
Grind Profile(Rough)
Grind Profile(Finish)
Fillet Roll
Thread Roll
Drill &Countersink
MPS
C
• Heading/Tooling• Machine set-up• Operator
• Tooling• Machine set-up• Operator
• Tooling• Machine set-up• Operator
• Tooling• Machine set-up• Operator
• Tooling• Machine set-up• Operator
• Tooling• Machine set-up• Operator
• Tooling• Machine set-up• Operator
• Accept/Reject lots• Valid Rejection• Next OPS
• Accept/Reject lots• Valid Rejection• Next OPS
• Accept/Reject lots• Valid Rejection• Next OPS
• Accept/Reject lots• Valid Rejection• Next OPS
• Accept/Reject lots• Valid Rejection• Next OPS
• Accept/Reject lots• Valid Rejection• Next OPS
• Accept/Reject lots• Valid Rejection• Next OPS
Broach
C
C
MPS
C
MPS
C
SIPOC Analysis - Hi-Lok Cell 133
8
S I X S I G M A
IAMD C T
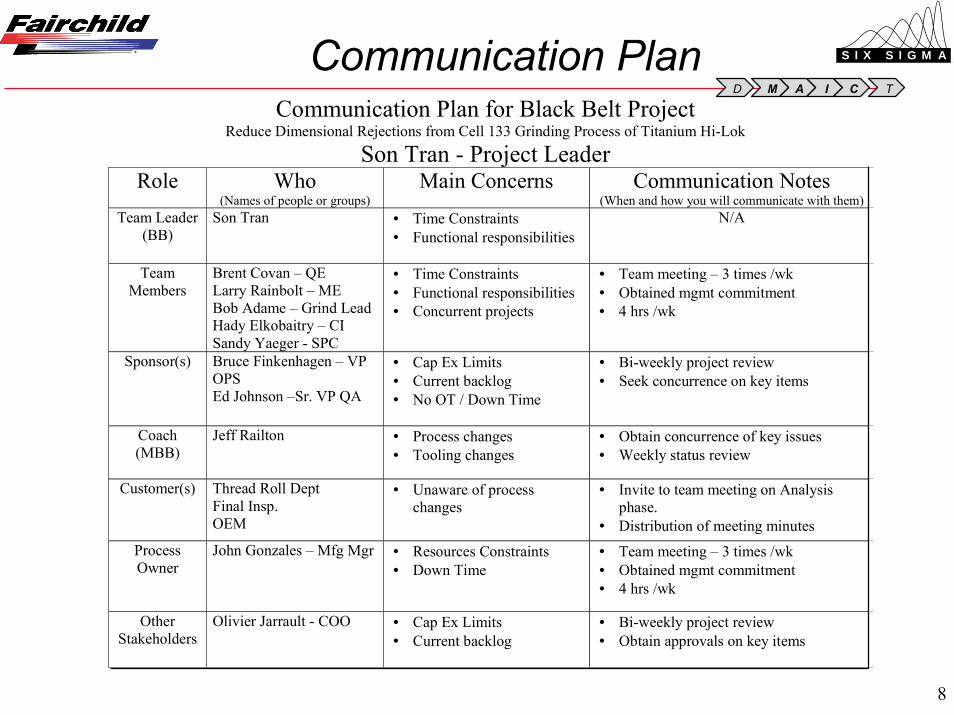
Communication Plan for Black Belt ProjectReduce Dimensional Rejections from Cell 133 Grinding Process of Titanium Hi-Lok
Son Tran - Project LeaderRole Who
(Names of people or groups)Main Concerns Communication Notes
(When and how you will communicate with them)Team Leader
(BB)Son Tran • Time Constraints
• Functional responsibilitiesN/A
TeamMembers
Brent Covan – QELarry Rainbolt – MEBob Adame – Grind LeadHady Elkobaitry – CISandy Yaeger - SPC
• Time Constraints• Functional responsibilities• Concurrent projects
• Team meeting – 3 times /wk• Obtained mgmt commitment• 4 hrs /wk
Sponsor(s) Bruce Finkenhagen – VPOPSEd Johnson –Sr. VP QA
• Cap Ex Limits• Current backlog• No OT / Down Time
• Bi-weekly project review• Seek concurrence on key items
Coach(MBB)
Jeff Railton • Process changes• Tooling changes
• Obtain concurrence of key issues• Weekly status review
Customer(s) Thread Roll DeptFinal Insp.OEM
• Unaware of processchanges
• Invite to team meeting on Analysisphase.
• Distribution of meeting minutesProcessOwner
John Gonzales – Mfg Mgr • Resources Constraints• Down Time
• Team meeting – 3 times /wk• Obtained mgmt commitment• 4 hrs /wk
OtherStakeholders
Olivier Jarrault - COO • Cap Ex Limits• Current backlog
• Bi-weekly project review• Obtain approvals on key items
Communication Plan
9
S I X S I G M A
IAMD C T
DMAIC REVIEW
DEFINE
MEASURE
ANALYZE
IMPROVE
CONTROL
Data Collection Data AnalysisProcess Sigma Process Map
Reduce Dimensional Variation - Measure
10
S I X S I G M A
IAMD C T
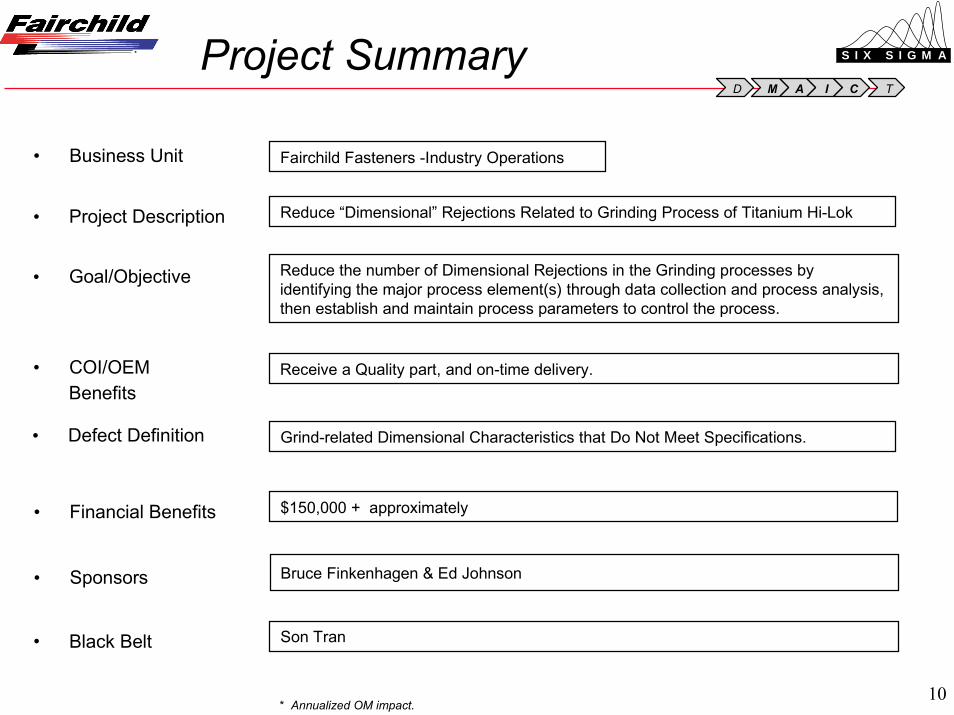
Project Summary
* Annualized OM impact.
• Business Unit Fairchild Fasteners -Industry Operations
Reduce “Dimensional” Rejections Related to Grinding Process of Titanium Hi-Lok• Project Description
• Goal/Objective
• COI/OEMBenefits
• Financial Benefits $150,000 + approximately
• Sponsors Bruce Finkenhagen & Ed Johnson
Reduce the number of Dimensional Rejections in the Grinding processes byidentifying the major process element(s) through data collection and process analysis,then establish and maintain process parameters to control the process.
Receive a Quality part, and on-time delivery.
• Black Belt Son Tran
Grind-related Dimensional Characteristics that Do Not Meet Specifications.• Defect Definition
11
S I X S I G M A
IAMD C T
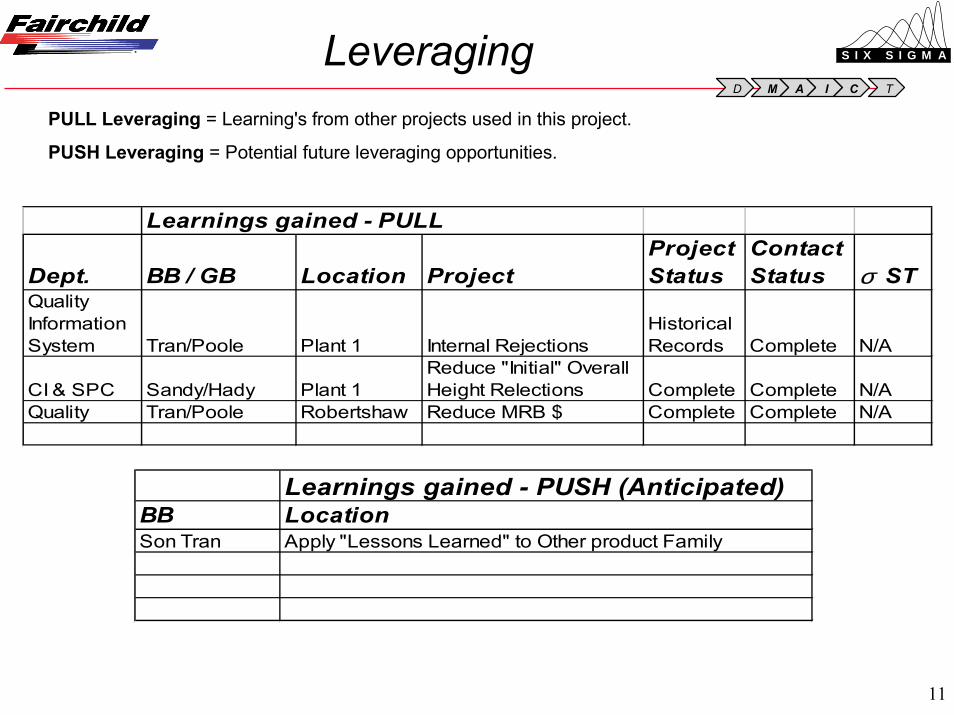
Leveraging
Learnings gained - PUSH (Anticipated)BB LocationSon Tran Apply "Lessons Learned" to Other product Family
Learnings gained - PULL
Dept. BB / GB Location ProjectProject Status
Contact Status σ ST
Quality Information System Tran/Poole Plant 1 Internal Rejections
Historical Records Complete N/A
CI & SPC Sandy/Hady Plant 1Reduce "Initial" Overall Height Relections Complete Complete N/A
Quality Tran/Poole Robertshaw Reduce MRB $ Complete Complete N/A
PULL Leveraging = Learning's from other projects used in this project.
PUSH Leveraging = Potential future leveraging opportunities.
12
S I X S I G M A
IAMD C T
Dimensional Characteristics Examples
Project Part Photo
Grip Dia.
Pre-RollTD Rolled TD
Grip Dia.
Coated PartPre-coated Part
Grip Length
13
S I X S I G M A
IAMD C T
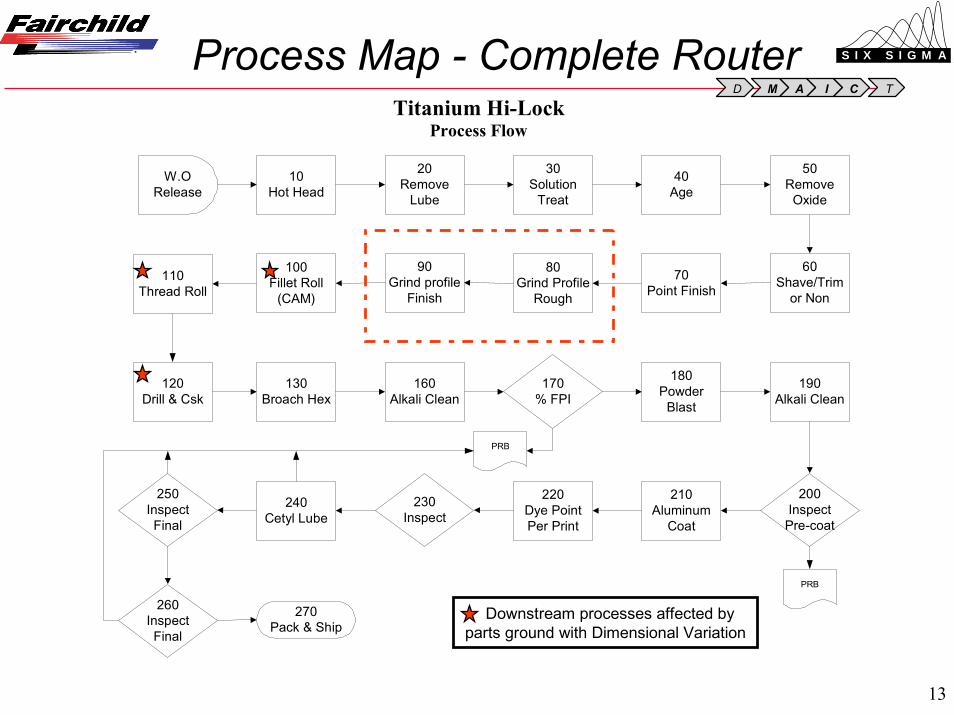
Process Map - Complete Router
Downstream processes affected byparts ground with Dimensional Variation
Titanium Hi-LockProcess Flow
W.ORelease
10Hot Head
60Shave/Trim
or Non
90Grind profile
Finish
100Fillet Roll
(CAM)
190Alkali Clean
20Remove
Lube
30Solution
Treat
40Age
50Remove
Oxide
70Point Finish
80Grind Profile
Rough
110Thread Roll
120Drill & Csk
130Broach Hex
160Alkali Clean
170% FPI
PRB
180Powder
Blast
240Cetyl Lube
210Aluminum
Coat
220Dye PointPer Print
200Inspect
Pre-coat
PRB
230Inspect
250InspectFinal
260InspectFinal
270Pack & Ship

14
S I X S I G M A
IAMD C T
What
Measure Type/ Data
Type How MeasureRelated Condition to
record Sampling notesHow/ where
recorded
1
Collect data to identify improvement area & to establish base-line
1a Internal rejection - # of occurrences Discrete
Run rejections report from FIS 2000 dbase - Jun-Feb
Monthly, By defect, Product Family, Material
Historical data from July 01 thru Feb 02
FIS 2000 Database - Download to Excel file
1bStratify rejections by Plant/ material type Discrete From Excel file
Plant 1 & Plant 2. Work Cells Same Excel
1cPareto analysis of rejection by categories
Counts/ Discrete
From Excel file, count frequency
Work Cell 131, 132 & 133 Same MiniTab
1dStratify dimensional rejections by defect types
Counts/ Discrete
From Excel file, count frequency
Work Cell 131, 132 & 133 Same MiniTab
1ePareto analysis of key dimensional rejects ("Trivial few") Count
From Excel file, count frequency
Work Cell 131, 132 & 134 Same MiniTab
1d Time Plot - Dimensional RejectionsCount/ Discrete
By month - count # of dimensional rejections in Hi-Lok Cells
Work Cell 131, 132 & 133 Same MiniTab
2X-Bar & R Chart - Grind Characteristics
2a Grip Dia ContinuousIn Inch - Using Digital mic at SPC station
P/N, W.O. Lot #, Operator
Sample (4) pcs per hour SPC station
2b Pre Roll TD Dia ContinuousIn Inch - Using Digital mic at SPC station
P/N, W.O. Lot #, Operator
Sample (4) pcs per hour SPC station
NOTESThings to Do to ensure consistency & Stability Plan for Dtata Collection Start Date
1 Calibration up-to-date Historical data - Run report from Jun 01 thru February 02 2/24/022 Employees trained on data collection & recording X-Bar & R Chart Per SpC plan 3/18/023 Periodical audits Train Operators to collect data 3/4/02
DATA OPERATIONAL DEFINITION & PROCEDURES
Data Collection Plan

15
S I X S I G M A
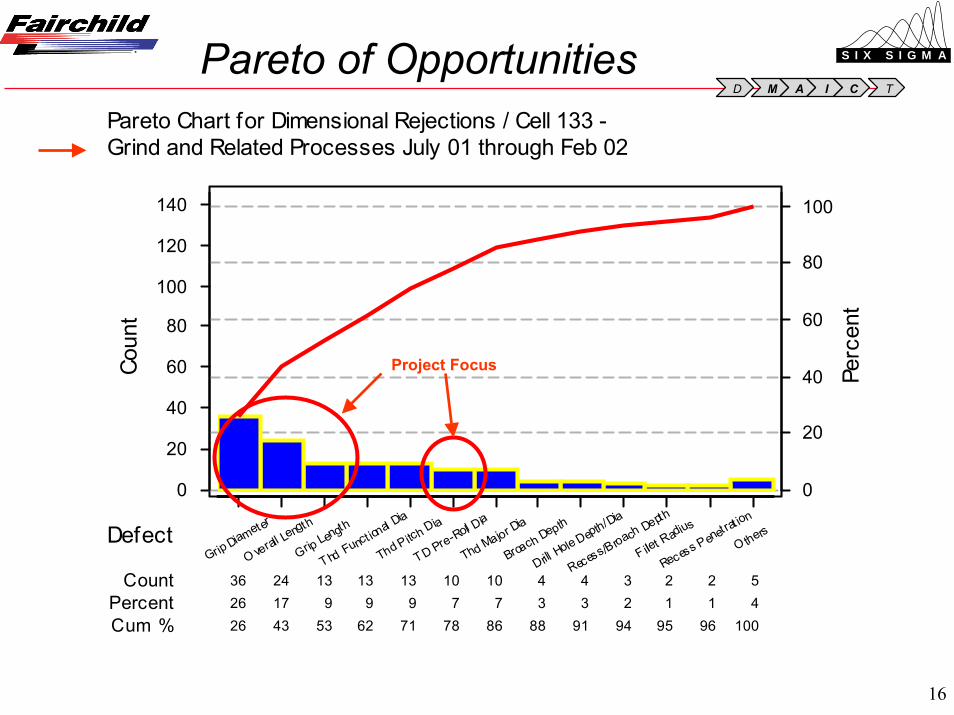
IAMD C TPareto of Opportunities
O thersTool M
arkCracked
Part Bent
Part Damaged
Mechanical Lab
OtherCoat ing
Metalurgical Lab
Dimensional
13 6 7 9 10 11 12 26 92139 4.0 1.8 2.2 2.8 3.1 3.4 3.7 8.028.342.8
100.0 96.0 94.2 92.0 89.2 86.2 82.8 79.1 71.1 42.8
300
200
100
0
100
80
60
40
20
0
DefectCount
PercentCum %
Perc
ent
Coun
tCell 133 - July 01 Through Feb 02Pareto Chart for Internal Rejections /
Project Focus
16
S I X S I G M A
IAMD C T
O thers
Recess Penetrat ion
F illet Radius
Recess/Broach Depth
Drill Hole D
epth/Dia
Broach Depth
Thd Major Dia
TD Pre-Roll Dia
Thd Pitch Dia
Thd Funct ional D
ia
Grip Length
O verall Length
Grip Diameter
5 2 2 3 4 410101313132436 4 1 1 2 3 3 7 7 9 9 91726
100 96 95 94 91 88 86 78 71 62 53 43 26
140
120
100
80
60
40
20
0
100
80
60
40
20
0
Defect
CountPercentCum %
Perc
ent
Coun
tGrind and Related Processes July 01 through Feb 02Pareto Chart for Dimensional Rejections / Cell 133 -
Project Focus
Pareto of Opportunities
17
S I X S I G M A
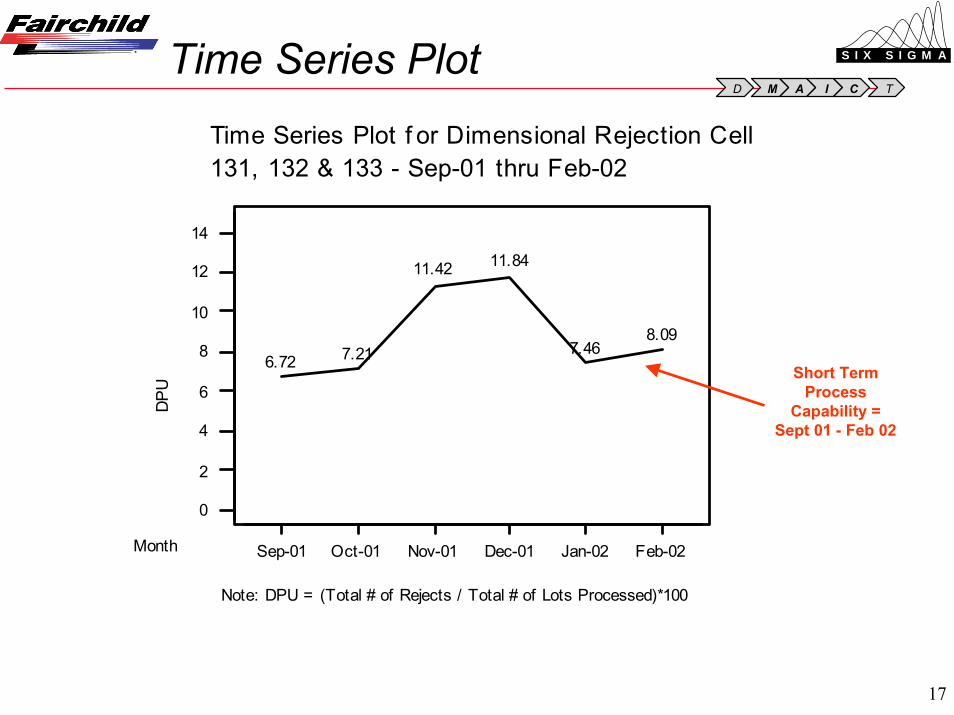
IAMD C TTime Series Plot
14
12
10
8
6
4
2
0
Feb-02Jan-02Dec-01Nov-01Oct-01Sep-01
DPU
Month
8.097.46
11.8411.42
7.216.72
131, 132 & 133 - Sep-01 thru Feb-02Time Series Plot f or Dimensional Rejection Cell
Note: DPU = (Total # of Rejects / Total # of Lots Processed)*100
Short TermProcess
Capability =Sept 01 - Feb 02
18
S I X S I G M A
IAMD C T
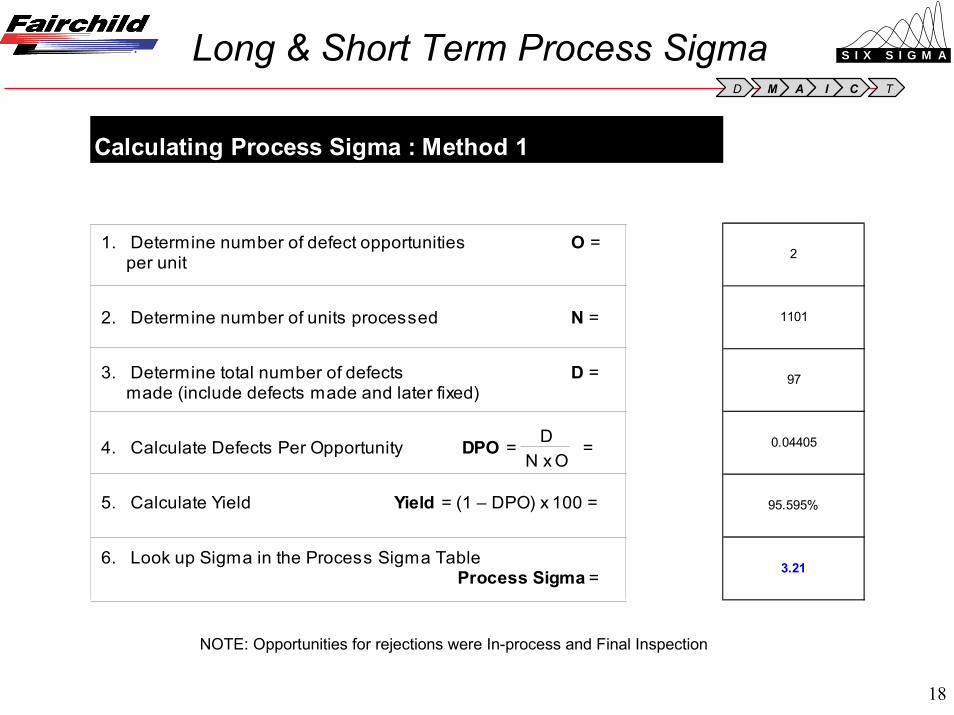
Long & Short Term Process Sigma
Calculating Process Sigma : Method 1
2
1101
97
0.04405
95.595%
3.21
1. Determine number of defect opportunities O = per unit
2. Determine number of units processed N =
3. Determine total number of defects D = made (include defects made and later fixed)
4. Calculate Defects Per Opportunity DPO = =
5. Calculate Yield Yield = (1 – DPO) x 100 =
6. Look up Sigma in the Process Sigma Table Process Sigma =
DN x O
NOTE: Opportunities for rejections were In-process and Final Inspection

19
S I X S I G M A
IAMD C T
CURRENT (Long Term) POTENTIAL (Short Term)
Long & Short Term Process Sigma
Based on Work Orders ran from 09/14/01 Thru 02/28/02
Cell 131, 132 & 133 / Dimensional Rejections
defectstotal opprotunities ) x 100%FPY =First Pass Yield = (1 -
971101 Total Units x 2 Opp
= 0.9559 x 100 = 95.6%
= 3.2
) x 100%
Process Sigma From Table
FPY = (1 -971101 Total Units x 2 Opp
= 0.9559 x 100 = 95.6%
= 3.2 - 1.5
= 1.7
) x 100%
Process Sigma From Table
FPY = (1 -
20
S I X S I G M A
IAMD C T
Gage R&R - Grip DiameterS/N 0162929.00005Yaeger04/16/02Mitutoyo Micrometer
Misc:Tolerance:Reported by:Date of s tudy:Gage name:
0
0.1888
0.1887
0.1886
0.1885
VickyJay H.Dave V.
Xbar Chart by Operator
Sam
ple M
ean
Mean=0.1886
UCL=0.1887
LCL=0.1886
0
0.0002
0.0001
0.0000
VickyJay H.Dave V.
R Chart by Operator
Sam
ple R
ange
R=6.83E-05
UCL=1.76E-04
LCL=0
10 9 8 7 6 5 4 3 2 1
0.1888
0.1887
0.1886
0.1885Piece
OperatorOperator*Piece Interaction
Aver
age
Dave V. Jay H. Vicky
VickyJay H.Dave V.
0.1888
0.1887
0.1886
0.1885
Operator
By Operator10 9 8 7 6 5 4 3 2 1
0.1888
0.1887
0.1886
0.1885
Piece
By Piece
%Contribution %Study Var %Tolerance
Part-to-PartReprodRepeatGage R&R
100
50
0
Components of Variation
Perc
ent
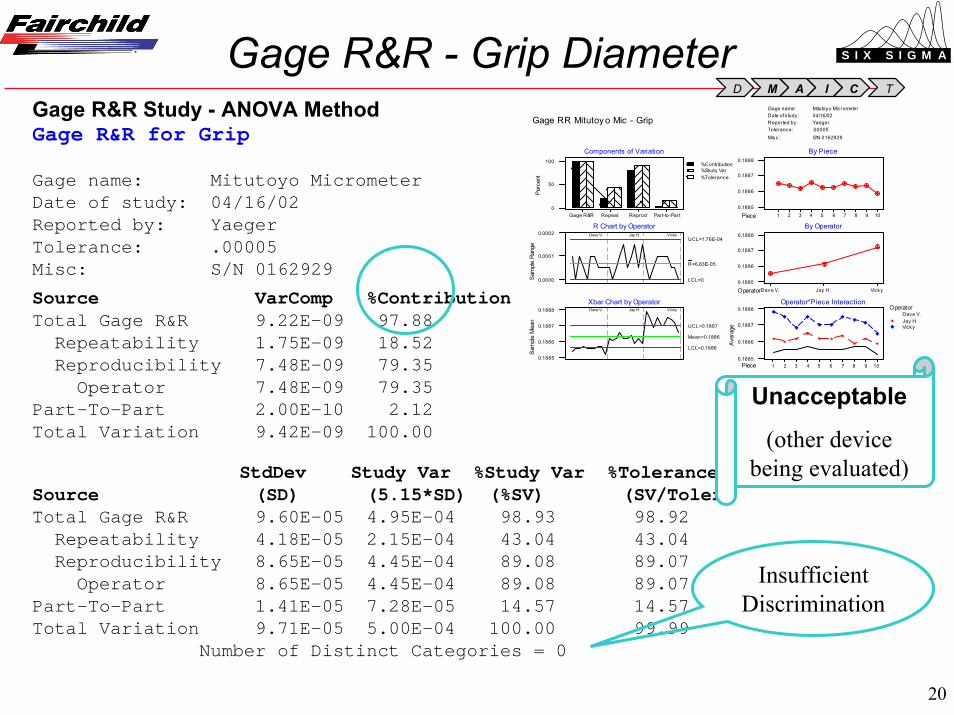
Gage RR Mitutoy o Mic - GripGage R&R Study - ANOVA MethodGage R&R for Grip
Gage name: Mitutoyo MicrometerDate of study: 04/16/02 Reported by: Yaeger Tolerance: .00005 Misc: S/N 0162929
Source VarComp %Contribution Total Gage R&R 9.22E-09 97.88 Repeatability 1.75E-09 18.52 Reproducibility 7.48E-09 79.35 Operator 7.48E-09 79.35 Part-To-Part 2.00E-10 2.12 Total Variation 9.42E-09 100.00 StdDev Study Var %Study Var %Tolerance
Source (SD) (5.15*SD) (%SV) (SV/Toler)Total Gage R&R 9.60E-05 4.95E-04 98.93 98.92 Repeatability 4.18E-05 2.15E-04 43.04 43.04 Reproducibility 8.65E-05 4.45E-04 89.08 89.07 Operator 8.65E-05 4.45E-04 89.08 89.07 Part-To-Part 1.41E-05 7.28E-05 14.57 14.57 Total Variation 9.71E-05 5.00E-04 100.00 99.99
Number of Distinct Categories = 0
InsufficientDiscrimination
Unacceptable
(other devicebeing evaluated)

21
S I X S I G M A
IAMD C T
Gage R&R - Grind TD
S/N 0162929.00005Yaeger04/16/02Mitutoyo Micrometer
Misc:Tolerance:Reported by:Date of s tudy:Gage name:
0
0.1680
0.1679
0.1678
0.1677
VickyJay H.Dave V.
Xbar Chart by Operator
Sam
ple M
ean
Mean=0.1678
UCL=0.1679
LCL=0.1678
0
0.0002
0.0001
0.0000
VickyJay H.Dave V.
R Chart by Operator
Sam
ple R
ange
R=0.00007
UCL=1.80E-04
LCL=0
10 9 8 7 6 5 4 3 2 1
0.1680
0.1679
0.1678
0.1677Piece
OperatorOperator*Piece Interaction
Aver
age
Dave V. Jay H. Vicky
VickyJay H.Dave V.
0.1680
0.1679
0.1678
0.1677
Operator
By Operator10 9 8 7 6 5 4 3 2 1
0.1680
0.1679
0.1678
0.1677
Piece
By Piece
%Contribution %Study Var %Tolerance
Part-to-PartReprodRepeatGage R&R
100
50
0
Components of Variation
Perc
ent
Gage RR Mitutoy o Mic - TDGage R&R Study - ANOVA MethodGage R&R for TDGage name: Mitutoyo MicrometerDate of study: 04/16/02Reported by: YaegerTolerance: .00005Misc: S/N 0162929
Source VarComp %ContributionTotal Gage R&R 1.08E-08 97.90 Repeatability 1.51E-09 13.67 Reproducibility 9.30E-09 84.23 Operator 9.30E-09 84.23Part-To-Part 2.32E-10 2.10Total Variation 1.10E-08 100.00
StdDev Study Var %Study Var %ToleranceSource (SD) (5.15*SD) (%SV) (SV/Toler)Total Gage R&R 1.04E-04 5.35E-04 98.94 107.10 Repeatability 3.88E-05 2.00E-04 36.97 40.01 Reproducibility 9.64E-05 4.97E-04 91.78 99.34 Operator 9.64E-05 4.97E-04 91.78 99.34Part-To-Part 1.52E-05 7.84E-05 14.49 15.68Total Variation 1.05E-04 5.41E-04 100.00 108.24
Number of Distinct Categories = 0
InsufficientDiscrimination
Unacceptable
(other devicebeing evaluated)

22
S I X S I G M A
IAMD C T
50403020100
0.0002
0.0001
0.0000
-0.0001
Xbar and R Chart
Subgr
Mea
n
1
11
Mean=0.000031
UCL=1.44E-04
LCL=-8.2E-05
0.0003
0.0002
0.0001
0.0000
Rang
e
R=1.55E-04
UCL=3.54E-04
LCL=0
50403020
Last 30 Subgroups0.00025
0.00010
-0.00005
-0.00020
Subgroup Number
Value
s
0.0002-0.0002
Capability PlotProcess Tolerance
III
III
IISpecifications
Within
Overall
0.00020.0000-0.0002
Normal Prob Plot0.00020.0000-0.0002
Capability Histogram
WithinStDev:Cp:Cpk:
0.00007530.880.75
OverallStDev:Pp:Ppk:
0.00008820.760.64
Process Capability For Grip Dia. (<.005 Stk) - TG112
Initial Capability - Output VariableIAMD C T

23
S I X S I G M A
IAMD C T
0 10 20 30 40 50
-0.0001
0.0000
0.0001
0.0002Xbar and R Chart
Subgr
Mea
n
1 1
11 1
1
1
Mean=1.82E-05
UCL=1.30E-04
LCL=-9.3E-05
0.0000
0.0001
0.0002
0.0003
Rang
e
1
R=1.53E-04
UCL=3.50E-04
LCL=0
20 30 40 50
Last 30 Subgroups
-0.00020
-0.00005
0.00010
0.00025
Subgroup Number
Value
s
-0.0002 0.0002
Capability PlotProcess Tolerance
I I I
I I I
I ISpecifications
Within
Overall
-0.0002 0.0000 0.0002
Normal Prob Plot-0.0002 0.0000 0.0002
Capability Histogram
WithinStDev:Cp:Cpk:
0.00007450.900.81
OverallStDev:Pp:Ppk:
0.00009850.680.62
Process Capability For TD (<.005 Stk) - TG112
Initial Capability - Output Variable

24
S I X S I G M A
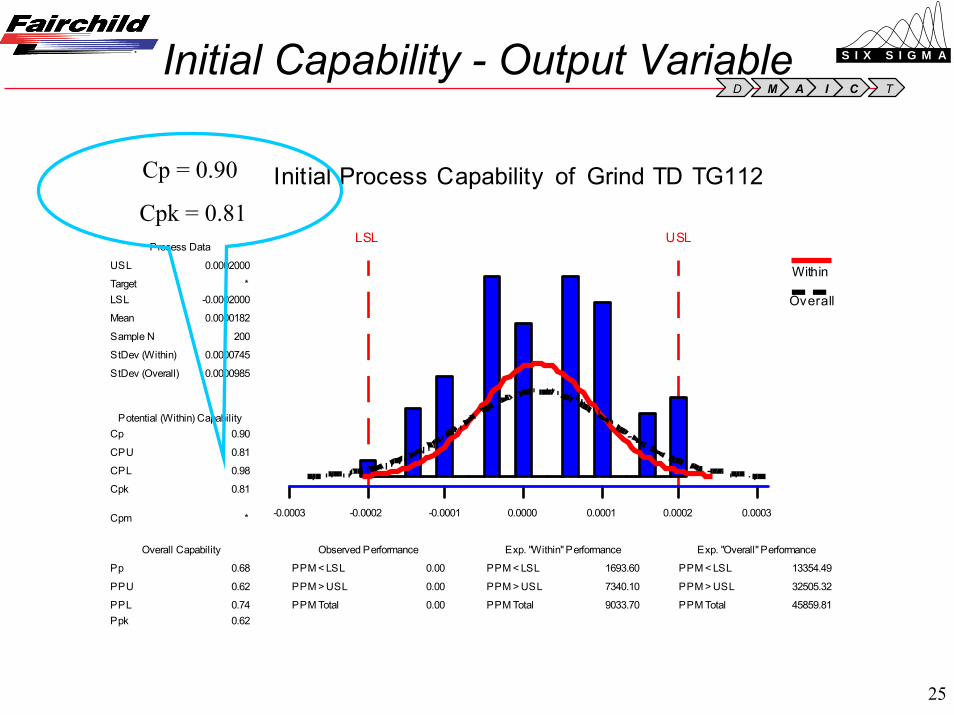
IAMD C TInitial Capability - Output Variable
0.00030.00020.00010.0000-0.0001-0.0002
USLLSL
Initial Process Capability of Grip TG112
PPM Total
PPM > USL
PPM < LSL
PPM Total
PPM > USL
PPM < LSL
PPM Total
PPM > USL
PPM < LSL
PpkPPL
PPU
Pp
Cpm
Cpk
CPL
CPU
Cp
StDev (Overall)
StDev (Within)
Sample N
Mean
LSLTarget
USL
32015.19
27621.57
4393.63
13535.62
12450.18
1085.44
0.00
0.00
0.00
0.640.87
0.64
0.76
*
0.75
1.02
0.75
0.88
0.0000882
0.0000753
200
0.000031
-0.000200 *
0.000200
Exp. "Overall" PerformanceExp. "Within" PerformanceObserved PerformanceOverall Capability
Potential (Within) Capability
Process Data
Within
Overall
Cp = 0.88
Cpk = 0.75
25
S I X S I G M A
IAMD C TInitial Capability - Output Variable
0.00030.00020.00010.0000-0.0001-0.0002-0.0003
USLLSL
Initial Process Capability of Grind TD TG112
PPM Total
PPM > USL
PPM < LSL
PPM Total
PPM > USL
PPM < LSL
PPM Total
PPM > USL
PPM < LSL
PpkPPL
PPU
Pp
Cpm
Cpk
CPL
CPU
Cp
StDev (Overall)
StDev (Within)
Sample N
Mean
LSLTarget
USL
45859.81
32505.32
13354.49
9033.70
7340.10
1693.60
0.00
0.00
0.00
0.620.74
0.62
0.68
*
0.81
0.98
0.81
0.90
0.0000985
0.0000745
200
0.0000182
-0.0002000 *
0.0002000
Exp. "Overall" PerformanceExp. "Within" PerformanceObserved PerformanceOverall Capability
Potential (Within) Capability
Process Data
Within
Overall
Cp = 0.90
Cpk = 0.81

26
S I X S I G M A
IAMD C T
Measure Conclusion:• Initial process capability study results indicated grinding
process is not capable of producing Grip & Grind TD thatmeet specification requirements.
• Grinding operators do not have a set of standardparameters (i.e., Grind wheel or regulating wheel speed) torun the machine.
• No standard measurement method. Operators allowed touse personal gage to check the part. Gages being used thathave poor “Repeatability and Reproducibility”.
Reduce Dimensional Variation - Measure

27
S I X S I G M A
IAMD C T
DMAIC REVIEW
DEFINE
MEASURE
ANALYZE
IMPROVE
CONTROL
Identifying Causes Verifying Causes
Reduce Dimensional Variation - Analyze

28
S I X S I G M A
IAMD C T
Analyze Objectives:• Determine the variables that impact the Grind output.
• Collect and analyze data to verify which of potential causeactually contribute to problems.
Reduce Dimensional Variation - Analyze
Grip Dia.GrindTD
29
S I X S I G M A
IAMD C T
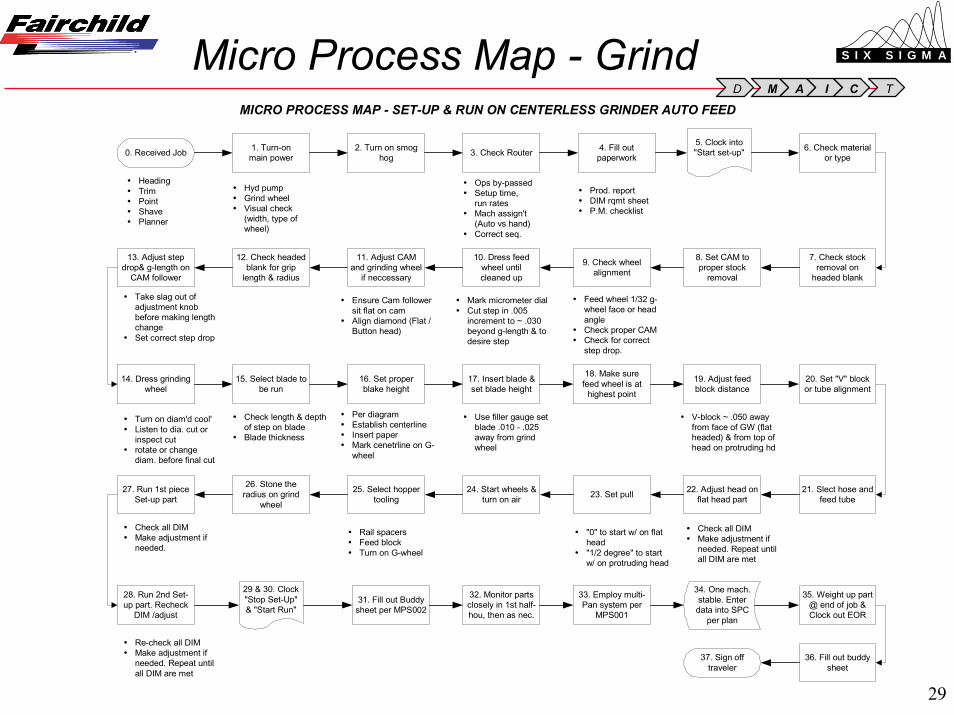
Micro Process Map - Grind
1. Turn-onmain power
2. Turn on smoghog 3. Check Router 4. Fill out
paperwork6. Check material
or type
5. Clock into"Start set-up"
12. Check headedblank for grip
length & radius
11. Adjust CAMand grinding wheel
if neccessary
10. Dress feedwheel untilcleaned up
8. Set CAM toproper stock
removal
7. Check stockremoval on
headed blank
9. Check wheelalignment
13. Adjust stepdrop& g-length on
CAM follower
15. Select blade tobe run
16. Set properblake height
17. Insert blade &set blade height
19. Adjust feedblock distance
20. Set "V" blockor tube alignment
31. Fill out Buddysheet per MPS002
22. Adjust head onflat head part
21. Slect hose andfeed tube23. Set pull
32. Monitor partsclosely in 1st half-hou, then as nec.
14. Dress grindingwheel
18. Make surefeed wheel is at
highest point
29 & 30. Clock"Stop Set-Up"& "Start Run"
33. Employ multi-Pan system per
MPS001
35. Weight up part@ end of job &Clock out EOR
36. Fill out buddysheet
34. One mach.stable. Enterdata into SPC
per plan
� Hyd pump� Grind wheel� Visual check
(width, type ofwheel)
� Ops by-passed� Setup time,
run rates� Mach assign't
(Auto vs hand)� Correct seq.
� Prod. report� DIM rqmt sheet� P.M. checklist
� Feed wheel 1/32 g-wheel face or headangle
� Check proper CAM� Check for correct
step drop.
� Mark micrometer dial� Cut step in .005
increment to ~ .030beyond g-length & todesire step
� Ensure Cam followersit flat on cam
� Align diamond (Flat /Button head)
� Turn on diam'd cool'� Listen to dia. cut or
inspect cut� rotate or change
diam. before final cut
� Check length & depthof step on blade
� Blade thickness
� Per diagram� Establish centerline� Insert paper� Mark cenetrline on G-
wheel
� Use filler gauge setblade .010 - .025away from grindwheel
� V-block ~ .050 awayfrom face of GW (flatheaded) & from top ofhead on protruding hd
� Check all DIM� Make adjustment if
needed. Repeat untilall DIM are met
37. Sign offtraveler
MICRO PROCESS MAP - SET-UP & RUN ON CENTERLESS GRINDER AUTO FEED
� Heading� Trim� Point� Shave� Planner
0. Received Job
� Take slag out ofadjustment knobbefore making lengthchange
� Set correct step drop
� "0" to start w/ on flathead
� "1/2 degree" to startw/ on protruding head
24. Start wheels &turn on air
25. Select hoppertooling
26. Stone theradius on grind
wheel
� Rail spacers� Feed block� Turn on G-wheel
27. Run 1st pieceSet-up part
28. Run 2nd Set-up part. Recheck
DIM /adjust
� Check all DIM� Make adjustment if
needed.
� Re-check all DIM� Make adjustment if
needed. Repeat untilall DIM are met

30
S I X S I G M A
IAMD C T
Tree Diagram - Grind
Grip Dia & Pre-Roll TD
O/S or U/S
Mat'l Receivedfrom Heading
Operations
Header Die/Tooling
Mach. Set-up Frequency not followed
Grind WheelBread-down
Measurementerrors
Dressing notadjust frequently
Inconsistencydressing
Bad diamond(Profile)
Mechanical diamond
Discipline (frequency notfollowed
No standards /Rqmts
Diameter not followedCAM
Bad CAM
Diamond burned Frequency ofdressing not followed
Bad Stylus
Operator notcheck
Incorrect gage formeasuring intend
Poor Gage R&R
Environment on Gage
No budgetavailable to buy
Operatorpreferences
Operators used alltolerance width
Target set-up differ fromOperator-to-operator
Machine complement(run multi machine
To achieveproduction target
Lack of customer-focused
� O/S or U/S� Lube� Relative variation
btwn grip & TD Dia
ContaminationOil
In-frequent check
No PM Resources constraint
No establishedschedules
No allowmachine warm-
up Not enough basket/pan
Productiontarget Resources constraint
Not available
Machine Set-upparameters
TREE DIAGRAM
Management goal
Unknown of impacts(due to large variation)
RegulatingMotor Speed
Grinding wheelSpeed
WHY? WHY? WHY? WHY? WHY?

31
S I X S I G M A
IAMD C TCause and Effect Analysis
Dimensional Variation(i.e., O/S or U/S Grip
Length or Pre-Roll TD)
MANMATERIALMEASUREMENT
MOTHER NATURE MACHINEMETHOD
Part ran during warm-up(Not separate)
Operator preferences(set target - min/max)
Not enough basket
Rqmt not enforced
Effect of downstream process
Differ. btwn shift
Using personal gaging
Under/over adjusting wheel
Skill level
Different techniques
Grip Dia blow-up
Relative variationbtwn Grip dia & TD
Bad Diamond
Worn out
Don't change
Wrong MaterialIncapable gage(Poor gage
R&R)Wrong type of
gage
Bad/worn dressing unit
Bad stylus
Out-dated machineMachine condition
Type of wheel(grind/regulating)
Oil(cleanliness,
type)
Poor set-up *
Dressing frequency *inconsistent
Procedure not follow
Procedure notspecific
MPS not followNo detailedProcedure
Under/overadjusting (size)
Multiple machine
Large lot size
Climate
Operatorvariability
NOTE: Bold Fonts are majorvariables/Potential failure modes
* DOE Performed
CENTERLESS GRINDER
Regulating wheel SpeedGrinding
wheel speed
Lack of Cams
Lack of feeder tooling
Lack of gages
Excess grindstock
Poor condition ofcomparator
Measurementlocation
No roving auditorsTrim burrs
V-block postmodification
Heading-Underfill
Bent parts
Inspect beforesetup
Delay in Overlay
Set-up

32
S I X S I G M A
IAMD C T
0.00010.0000-0.0001
XBar Grip
Boxplot of XBar Grip(with Ho and 95% t-confidence interval for the mean)
[ ]X_
Ho
One-Sample T: XBar GripTest of mu = 0 vs mu not = 0
Variable N Mean StDev SE Mean
XBar Grip 50 0.000031 0.000060 0.000008
Variable 95.0% CI T P
XBar Grip (0.000014,0.000048) 3.68 0.001
Hypothesis Test1-sample t-test
Compare Mean to a Target ValueGrip TG112
Because the P-value < 0.05,we found a statisticaldifference in the Gripaveraged value and the targetvalue

33
S I X S I G M A
IAMD C T
Because the P-value > 0.05,we have not found a statisticaldifference in the TD averagedvalue and the target value
One-Sample T: XBar TDTest of mu = 0 vs mu not = 0
Variable N Mean StDev SE Mean
XBar TD 50 0.000018 0.000075 0.000011
Variable 95.0% CI T P
XBar TD (-3.0E-06,0.000040) 1.73 0.091
Hypothesis Test1-sample t-test
Compare Mean to a Target ValueTD - TG112
0.00020.00010.0000-0.0001
XBar TD
Boxplot of XBar TD(with Ho and 95% t-confidence interval for the mean)
[ ]X_
Ho
34
S I X S I G M A
IAMD C T
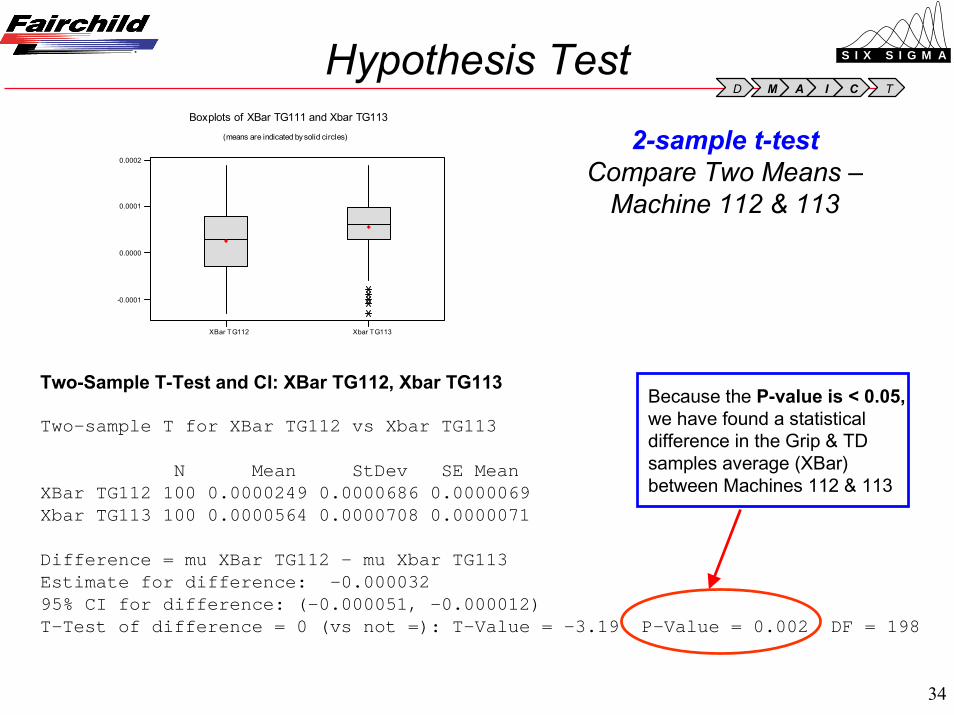
2-sample t-testCompare Two Means –
Machine 112 & 113
Hypothesis Test
Two-Sample T-Test and CI: XBar TG112, Xbar TG113
Two-sample T for XBar TG112 vs Xbar TG113
N Mean StDev SE MeanXBar TG112 100 0.0000249 0.0000686 0.0000069Xbar TG113 100 0.0000564 0.0000708 0.0000071
Difference = mu XBar TG112 - mu Xbar TG113Estimate for difference: -0.00003295% CI for difference: (-0.000051, -0.000012)T-Test of difference = 0 (vs not =): T-Value = -3.19 P-Value = 0.002 DF = 198
Xbar TG113XBar TG112
0.0002
0.0001
0.0000
-0.0001
Boxplots of XBar TG111 and Xbar TG113(means are indicated by solid circles)
Because the P-value is < 0.05,we have found a statisticaldifference in the Grip & TDsamples average (XBar)between Machines 112 & 113

35
S I X S I G M A
IAMD C T
2-sample t-testCompare Two Means –Grip & TD
Machine TG112
Hypothesis Test
T.D. (Less than .005 Stk.)Grip Dia. (Less than .005 Stk.)
0.0002
0.0001
0.0000
-0.0001
Characteristic
XB
ar
Boxplots of XBar by Characteristics (Grip vs. TD)(means are indicated by solid circles)
Two-Sample T-Test and CI: XBar, Characteristic
Two-sample T for XBar
Characte N Mean StDev SE MeanGrip (<.005)50 0.0000310 0.0000595 0.0000084T.D. (<.005)50 0.0000183 0.0000748 0.000011
Difference = mu (Grip Dia. ) - mu (T.D. (Less)Estimate for difference: 0.00001395% CI for difference: (-0.000014, 0.000040)T-Test of difference = 0 (vs not =): T-Value = 0.94 P-Value = 0.348 DF = 98Both use Pooled StDev = 0.0000676
Because the P-value is > 0.05,we have not found a statisticaldifference in the samplesaverage (XBar) between Gripand TD

36
S I X S I G M A
IAMD C T
2-sample t-testCompare Two XBar & Shift
for Grip & TD
Hypothesis Test
21
0.0002
0.0001
0.0000
-0.0001
Shift
XB
ar
Boxplots of XBar by Shift(means are indicated by solid circles)
Two-Sample T-Test and CI: XBar, Shift
Two-sample T for XBar
Shift N Mean StDev SE Mean1 46-0.0000135 0.0000505 0.00000742 54 0.0000576 0.0000652 0.0000089
Difference = mu (1) - mu (2)Estimate for difference: -0.00007195% CI for difference: (-0.000095, -0.000048)T-Test of difference = 0 (vs not =): T-Value = -6.01 P-Value = 0.000 DF = 98
Because the P-value is <0.05, we found a statisticaldifference in the Grip & TDaverage values between thetwo shifts (Or, “the XBar ofGrip & TD is not the samebetween 1st & 2nd shift)

37
S I X S I G M A
IAMD C T
One-Way ANOVAXbar Grip Diameter by Machine
Hypothesis Test
One-way ANOVA: XBar Grip versus Machine
Analysis of Variance for XBar GriSource DF SS MS F PMachine 4 0.0000001 0.0000000 4.25 0.002Error 245 0.0000008 0.0000000Total 249 0.0000008 Individual 95% CIs For Mean Based on Pooled StDevLevel N Mean StDev ------+---------+---------+---------+TG112 50 3.18E-05 6.08E-05 (-------*-------) TG113 50 2.52E-05 6.63E-05 (-------*------) TG114 50 2.58E-05 4.69E-05 (-------*-------) TG15 50 6.48E-05 5.55E-05 (------*-------) TG18 50 3.70E-05 4.78E-05 (-------*------) ------+---------+---------+---------+Pooled StDev = 5.59E-05 0.000020 0.000040 0.000060 0.000080
Because the P-value is < 0.05, wefound at least one mean (XBar Grip)is different
TG18
TG15
TG11
4
TG11
3
TG11
2
0.0002
0.0001
0.0000
-0.0001
Characteristic
XB
ar G
ripBoxplots of XBar Grip by Machine
(means are indicated by solid c ircles )
38
S I X S I G M A
IAMD C T
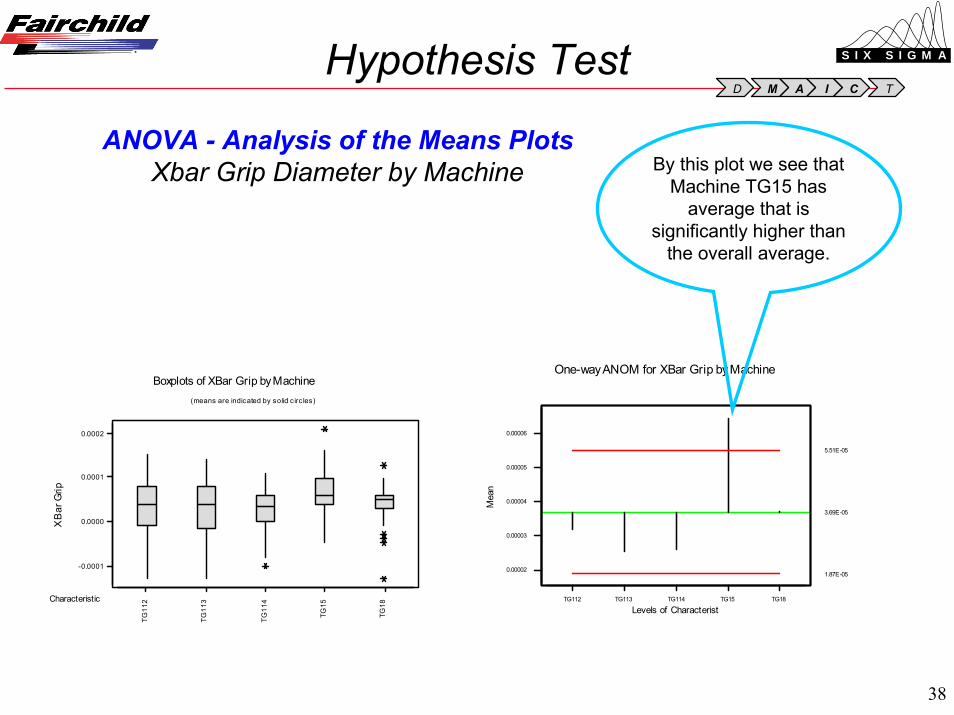
ANOVA - Analysis of the Means PlotsXbar Grip Diameter by Machine
Hypothesis Test
TG18
TG15
TG11
4
TG11
3
TG11
2
0.0002
0.0001
0.0000
-0.0001
Characteristic
XB
ar G
rip
Boxplots of XBar Grip by Machine(means are indicated by solid c irc les)
TG18TG15TG114TG113TG112
0.00006
0.00005
0.00004
0.00003
0.00002
5.51E-05
1.87E-05
3.69E-05
Levels of Characterist
Mea
n
One-way ANOM for XBar Grip by Machine
By this plot we see thatMachine TG15 has
average that issignificantly higher than
the overall average.

39
S I X S I G M A
IAMD C T
One-Way ANOVAXbar Grip Diameter by Employee
Hypothesis Test
One-way ANOVA: XBar versus Empl Number
Analysis of Variance for XBar Source DF SS MS F PEmpl Num 3 0.0000001 0.0000000 7.31 0.000Error 46 0.0000001 0.0000000Total 49 0.0000002 Individual 95% CIs For Mean Based on Pooled StDevLevel N Mean StDev --------+---------+---------+-------- 5617 13 -6.2E-06 2.93E-05 (-----*-----) 7900 25 6.36E-05 5.46E-05 (---*---) 54761 2 6.00E-05 2.83E-05 (--------------*--------------) 56610 10 -4.0E-06 6.65E-05 (-----*------) --------+---------+---------+--------Pooled StDev = 5.16E-05 0.000000 0.000050 0.000100
5617
7900
5476
1
5661
0
-0.0001
0.0000
0.0001
Empl Number
XB
ar
Boxplots of XBar by Employee(means are indicated by solid circles)
Because the P-value is < 0.05, wefound at least one mean (XBar Grip)from an employee is different fromanother

40
S I X S I G M A
IAMD C T
ANOVA - Analysis of the Means PlotsXbar Grip Diameter by Machine
Hypothesis Test
5617
7900
5476
1
5661
0
-0.0001
0.0000
0.0001
Empl Number
XB
ar
Boxplots of XBar by Employee(means are indicated by solid c irc les)
5661054761 7900 5617
0.00010
0.00005
0.00000
-0.00005
6.96E-05
-6.0E-06
3.18E-05
Levels of Empl Number
Mea
n
One-way ANOM for XBar by Employee
By this plot we see thatEmployee 7900 has average
that is significantly higher thanthe overall average, and
Employee 5617 is significantlower than the overall average
41
S I X S I G M A
IAMD C T
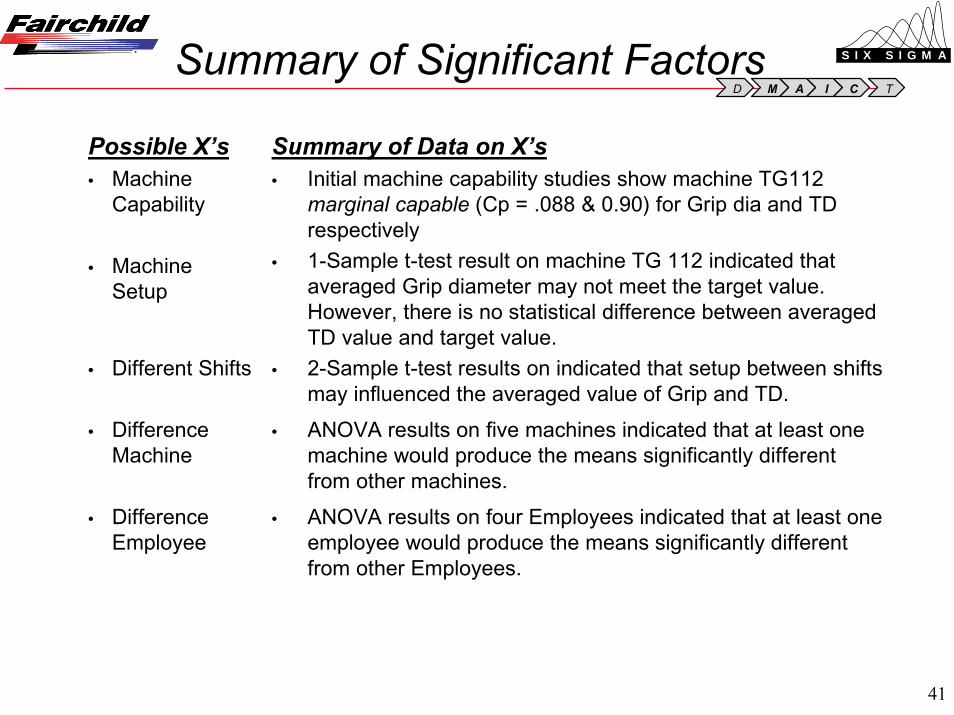
Possible X’s• Machine
Capability
• MachineSetup
• Different Shifts
• DifferenceMachine
• DifferenceEmployee
Summary of Data on X’s• Initial machine capability studies show machine TG112
marginal capable (Cp = .088 & 0.90) for Grip dia and TDrespectively
• 1-Sample t-test result on machine TG 112 indicated thataveraged Grip diameter may not meet the target value.However, there is no statistical difference between averagedTD value and target value.
• 2-Sample t-test results on indicated that setup between shiftsmay influenced the averaged value of Grip and TD.
• ANOVA results on five machines indicated that at least onemachine would produce the means significantly differentfrom other machines.
• ANOVA results on four Employees indicated that at least oneemployee would produce the means significantly differentfrom other Employees.
Summary of Significant Factors

42
S I X S I G M A
IAMD C T
QC Tool Matrix
Cause of Variation
Variation between Grip & TD
Headed Grip &b TD
Box
& W
hisk
er
Run
Cha
rt
Scat
ter P
lot
Dot
Plo
t
His
togr
am
Mul
ti Va
ri
Krus
kal-W
allis
Two
Sam
ple
t-tes
t
One
-way
AN
OVA
One
Sam
ple
t-tes
t
Hom
ogen
eity
of V
aria
nce
Reg
ress
ion
Anal
ysis
Gen
eral
Lin
ear M
odel
Chi
-squ
are
Anal
ysis
Logi
stic
Reg
ress
ion
Tool Used
Machine
43
S I X S I G M A
IAMD C T
DMAIC REVIEW
DEFINE
MEASURE
ANALYZE
IMPROVE
CONTROL
Generating and Selecting SolutionsImplement Solutions Evaluating Results
Reduce Dimensional Variation - Improve
44
S I X S I G M A
IAMD C T
Improve Objectives:• Developing and Selecting creative solutions
• Developing and testing implementation plans and puttingthem into actions
• Evaluating and quantifying the results of implementation
Reduce Dimensional Variation - Improve

45
S I X S I G M A
IAMD C TCause and Effect Matrix
Rating of Importance to Customer 7 10 9 10 7 7 9 10 1 8 10
Key Customers: 1 2 3 4 5 6 7 8 9 10 11
Thread Roll, Coating, Fillet Roll
Grin
d G
rip D
ia.
Grin
d TD
Grip
Len
gth
Grin
d R
adiu
s
Grin
d H
ead
Pro
trusi
on
Hea
d A
ngle
Tape
r
Out
-of-r
ound
Stra
ight
ness
Tran
sitio
n ra
dius
Var
iatio
n B
twn
grip
dia
& T
D
Total
Process Step Process Input
1 Grind Skill level 9 9 9 9 9 9 9 9 9 9 9 4142 Grind Poor machine condition 9 9 9 9 9 9 9 9 9 9 9 4143 Grind Inspect parts before set-up 9 9 9 9 9 9 9 9 9 9 9 4144 Grind Poor Gage R&R 9 9 9 9 9 9 9 9 9 9 9 4145 Grind Machine compliment 9 9 9 9 9 9 9 9 9 9 9 4146 Grind Grinding wheel speed 9 9 9 9 9 9 9 9 9 9 9 4147 Grind Operator preferences 9 9 9 9 9 9 9 9 9 9 9 4148 Grind Relative variation of headed grip dia & 9 9 9 9 9 9 9 9 9 9 9 4149 Heading & HT Bent parts 9 9 3 9 9 9 9 9 9 3 1 36010 Grind Regulating wheel motor speed 9 9 3 9 9 9 9 9 3 9 9 36011 Heading Underfill 9 9 9 3 9 9 1 9 1 9 9 35412 Grind Poor dresser condition 9 9 9 3 9 9 9 9 9 9 9 35413 Grind V-Block Post Modification 1 9 9 1 1 1 9 9 1 9 1 27814 Grind Clean-up properly after 1st Rough (w/o) 3 3 3 9 9 9 3 9 3 9 3 25815 Grind Poor condition of loaders/feeders 3 3 9 9 9 9 3 3 3 9 3 25216 Grind Poor condition of comparator 1 1 9 9 1 9 1 1 1 9 1 19817 Heading Grip dia blow-up 9 1 1 9 3 3 9 1 1 1 9 18218 Heading Grip length at min 3 3 9 1 1 1 1 1 1 9 3 15219 Grind Excess grind stock 3 3 3 3 3 3 3 3 3 3 9 13820 Grind lack of tooling (general) 3 3 3 3 3 3 3 3 3 3 3 13821 Grind lack of cams 1 1 1 9 1 9 1 1 1 9 9 12622 Grind Measurement location 1 1 3 3 3 3 3 3 3 3 3 10423 Trim Reduce trim burrs 1 1 1 1 9 9 3 3 3 1 1 6624 Heading Head protrusion in grind tolerance 1 1 3 1 9 9 3 1 1 1 1 6425 Grind Other job break-ins 1 1 1 1 1 1 1 1 1 1 1 46
8% 19%
29%
41%
49%
57%
67%
79%
80%
89%
100%
8% 11%
10%
12%
8% 8% 10%
12%
1% 10%
11% 100%
Total
1064
1520
1386
1600
1106
1162
1368
1580
130
1328
1440 13684
Cause and Effect Matrix
ProjectFocus
46
S I X S I G M A
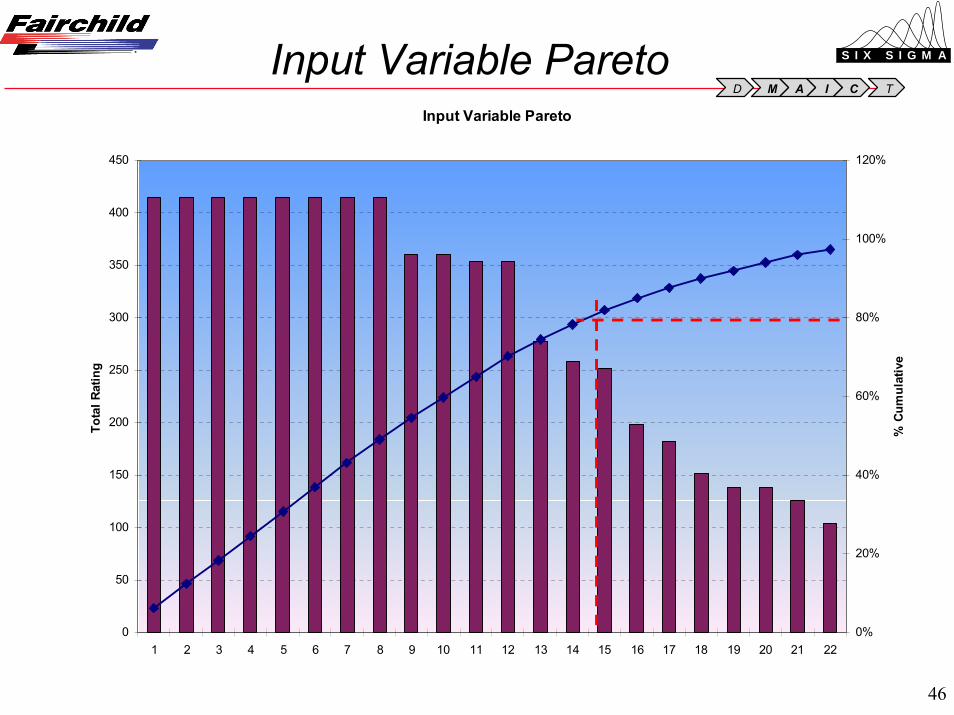
IAMD C TInput Variable Pareto
Input Variable Pareto
0
50
100
150
200
250
300
350
400
450
1 2 3 4 5 6 7 8 9 10 11 12 13 14 15 16 17 18 19 20 21 22
Tota
l Rat
ing
0%
20%
40%
60%
80%
100%
120%
% C
umul
ativ
e
47
S I X S I G M A
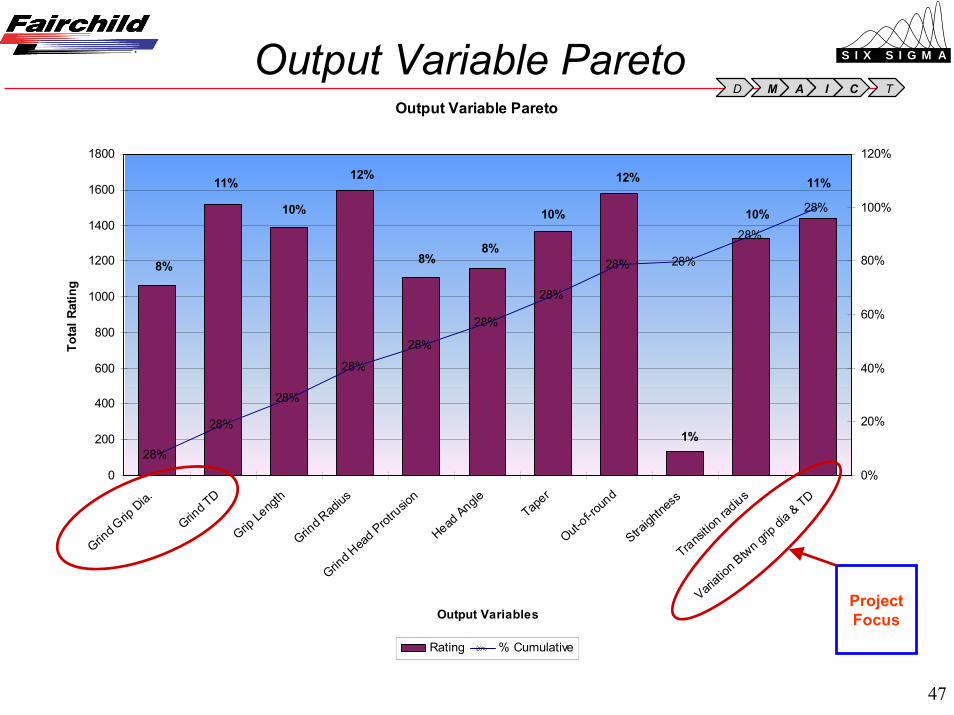
IAMD C TOutput Variable Pareto
28%
28%
28%
28%
28%
28%
28%
28% 28%
28%
28%
Output Variable Pareto
0
200
400
600
800
1000
1200
1400
1600
1800
Grind G
rip Dia.
Grind T
D
Grip Le
ngth
Grind R
adius
Grind H
ead Prot
rusion
Head Angle
Taper
Out-of-ro
und
Straigh
tness
Transitio
n rad
ius
Variati
on Btwn g
rip di
a & TD
Output Variables
Tota
l Rat
ing
0%
20%
40%
60%
80%
100%
120%
Rating 28% % Cumulative
8%
11%
10%
12%
8%8%
10%
12%
1%
11%
10%
ProjectFocus
48
S I X S I G M A
IAMD C T
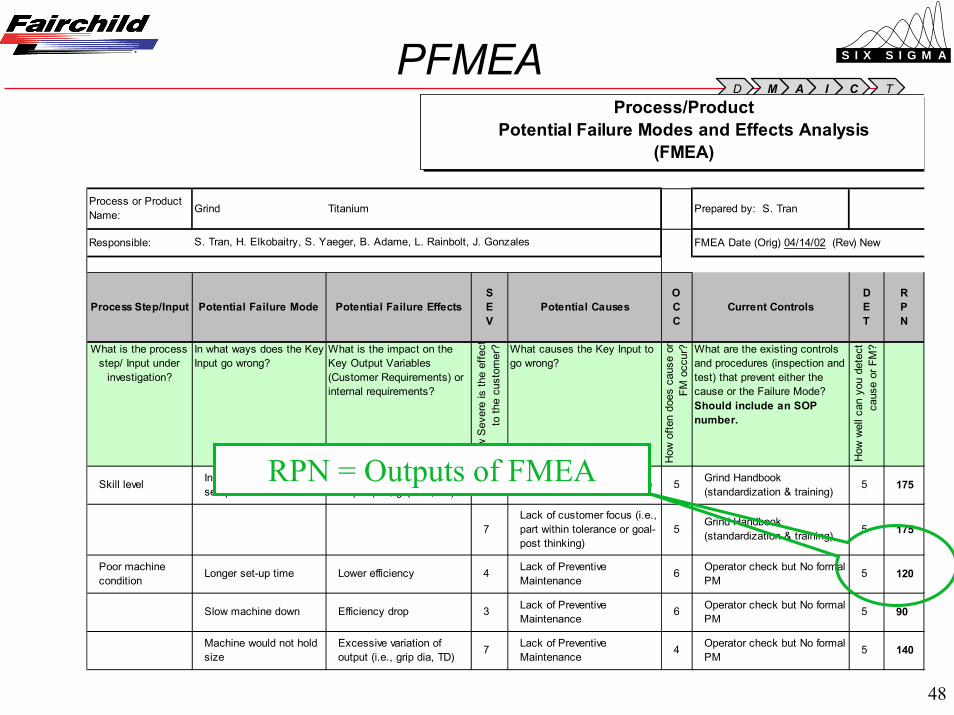
Process or Product Name: Grind Titanium Prepared by: S. Tran
Responsible: FMEA Date (Orig) 04/14/02 (Rev) New
Process Step/Input Potential Failure Mode Potential Failure EffectsSEV
Potential CausesOCC
Current ControlsDET
RPN
What is the process step/ Input under
investigation?
In what ways does the Key Input go wrong?
What is the impact on the Key Output Variables (Customer Requirements) or internal requirements?
How
Sev
ere
is th
e ef
fect
to th
e cu
stom
er? What causes the Key Input to
go wrong?
How
ofte
n do
es c
ause
or
FM o
ccur
? What are the existing controls and procedures (inspection and test) that prevent either the cause or the Failure Mode? Should include an SOP number.
How
wel
l can
you
det
ect
caus
e or
FM
?
Skill level Inconsistence target setup
Excessive variation of output (i.e., grip dia, TD)
7 Lack of training, experience 5 Grind Handbook (standardization & training)
5 175
7Lack of customer focus (i.e., part within tolerance or goal-post thinking)
5Grind Handbook (standardization & training) 5 175
Poor machine condition
Longer set-up time Lower efficiency 4 Lack of Preventive Maintenance
6 Operator check but No formal PM
5 120
Slow machine down Efficiency drop 3 Lack of Preventive Maintenance
6 Operator check but No formal PM
5 90
Machine would not hold size
Excessive variation of output (i.e., grip dia, TD) 7 Lack of Preventive
Maintenance 4 Operator check but No formal PM 5 140
S. Tran, H. Elkobaitry, S. Yaeger, B. Adame, L. Rainbolt, J. Gonzales
Process/Product Potential Failure Modes and Effects Analysis
(FMEA)
RPN = Outputs of FMEA
PFMEA

49
S I X S I G M A
IAMD C T
Process Step/Input Max RPN Action RespPoor Gage R&R 384 Evaluate / Procure gage S. Yaeger
Grinding/Regulating Wheel Speed 240 Run DOE
Tran/ Elkobaitry
Poor Dresser condition 228 PM Program/TPM Workshop J. Railton
Poor Machine Condition 228 PM Program/TPM Workshop J. Railton
Bad Materials (Bent Dim. Variation)
192 Improve Heading process / Heading Team
H. Elkobaitry
Skill Level 175 Reinforce Training J. Gonzales
Operator Preferences 168 Reinforce Training J. Gonzales
Machine Compliment 144 Improve Scheduling J. Gonzales
Summary of Significant OutputsPFMEA

50
S I X S I G M A
IAMD C T
Identify Large Effects of Grip Range
DOE Results
Grip Range• RWS produced
stronger MainEffect on GripRange thanGWS.
• Grip Rangeincreasedsignificantlywhen RWSmoved from L2to L3.
RWSGWS
L3L2L1L3L2L1
0.00027
0.00025
0.00023
0.00021
0.00019
SPC
Grip
Ran
ge
Main Effect Plot - Data Means for Grip Range BACB30NM3K6
Optimum setting to improve productivity & minimize Grip Range• GWS: L2• RWS: L2

51
S I X S I G M A
IAMD C T
Grip Range
• Strongerinteractionoccurred whenRWS is ran atL1 - L2
• No interactionwhen RWS isran between L2- L3 and GWSis at L2 and L3.
Optimum setting to improve productivity & minimize Grip Range• GWS: L2• RWS: L2 (cannot run pass L2 because of main effects)
L1L2L3
L3L2L1
0.00030
0.00025
0.00020
RWS
GWS
Mea
n
Interaction Plot - Data Means for Grip Range BACB30NM3K6
Identify Interactions of Grip Range
DOE Results (cont’d)

52
S I X S I G M A
IAMD C T
Grip SD
• RWS producedstronger MainEffect on GripSD than GWS.
• Grip SDincreasedsignificantlywhen RWSmoved from L2to L3.
RWSGWS
L3L2L1L3L2L1
0.000079
0.000073
0.000067
0.000061
0.000055
SPC
Grip
SD
Main Effect Plot - Data Means for Grip SD BACB30NM3K6
Optimum setting to improve productivity & minimize Grip SD• GWS: L2• RWS: L2
Identify Large Effects of Grip SD
DOE Results (cont’d)

53
S I X S I G M A
IAMD C T
Grip SDL1L2L3
L1 L2 L3
0.00005
0.00006
0.00007
0.00008
0.00009
RWS
GWS
Mea
n
Interaction Plot - Data Means for Grip SD BACB30NM3K6
Optimum setting to improve productivity & minimize Grip SD• GWS: L2• RWS: L2 (cannot run pass L2 because of main effects)
• Strongerinteractionoccurred whenRWS is ran atL1 - L2
• No interactionwhen RWS isran between L2- L3 and GWSis at L2 and L3.
DOE Results (cont’d)Identify Interactions of Grip SD
54
S I X S I G M A
IAMD C T
TD Range
GWS RWS
L1 L2 L3L1 L2 L3
0.000220
0.000235
0.000250
0.000265
0.000280
SPC
TD
Ran
ge
Main Effect Plot - Data Means for TD Range BACB30NM3K6
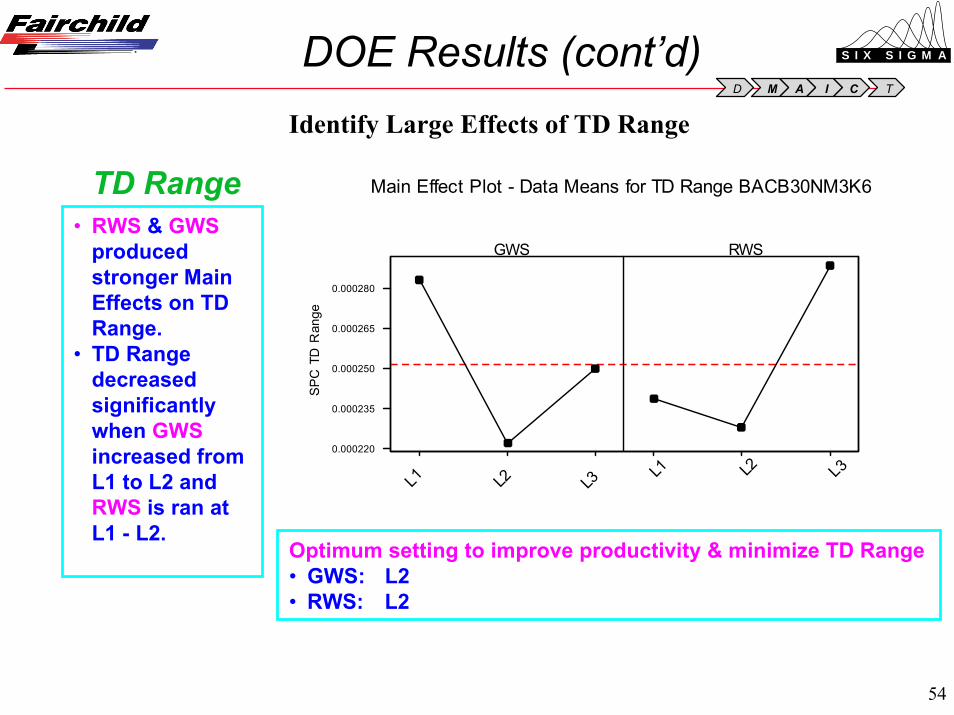
• RWS & GWSproducedstronger MainEffects on TDRange.
• TD Rangedecreasedsignificantlywhen GWSincreased fromL1 to L2 andRWS is ran atL1 - L2.
Optimum setting to improve productivity & minimize TD Range• GWS: L2• RWS: L2
DOE Results (cont’d)Identify Large Effects of TD Range
55
S I X S I G M A
IAMD C T
TD RangeL1L2L3
L1 L2 L3
0.00005
0.00006
0.00007
0.00008
0.00009
RWS
GWS
Mea
n
Interaction Plot - Data Means for TD Range BACB30NM3K6
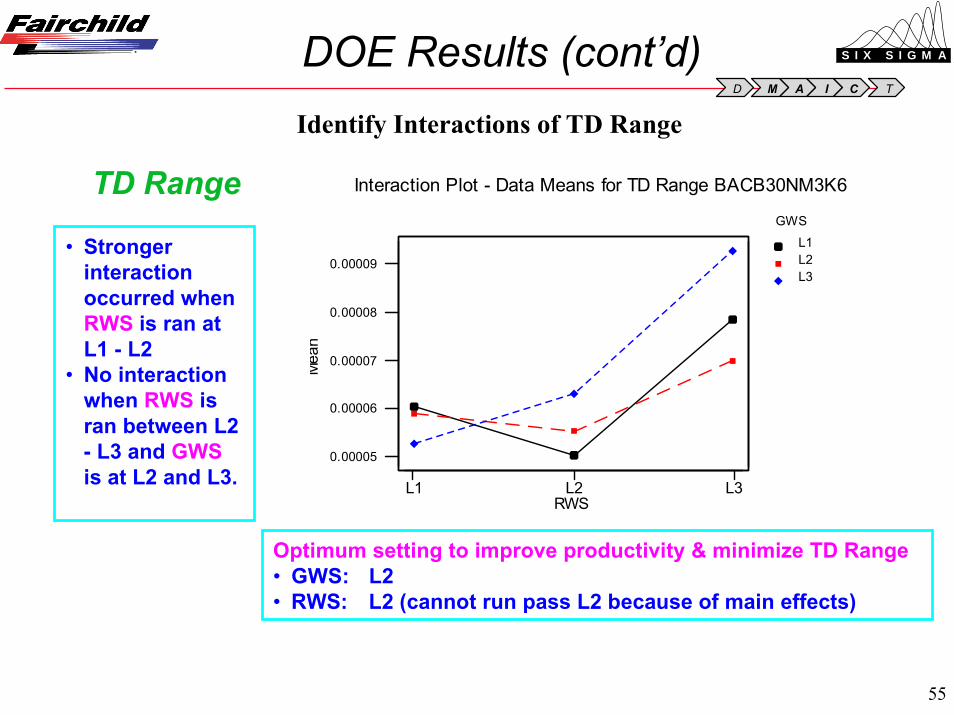
• Strongerinteractionoccurred whenRWS is ran atL1 - L2
• No interactionwhen RWS isran between L2- L3 and GWSis at L2 and L3.
Optimum setting to improve productivity & minimize TD Range• GWS: L2• RWS: L2 (cannot run pass L2 because of main effects)
DOE Results (cont’d)Identify Interactions of TD Range
56
S I X S I G M A
IAMD C T
TD SD
GWS RWS
L1 L2 L3 L1 L2 L30.000065
0.000071
0.000077
0.000083
0.000089
SPC
TD
SD
Main Effect Plot - Data Means for TD SD BACB30NM3K6
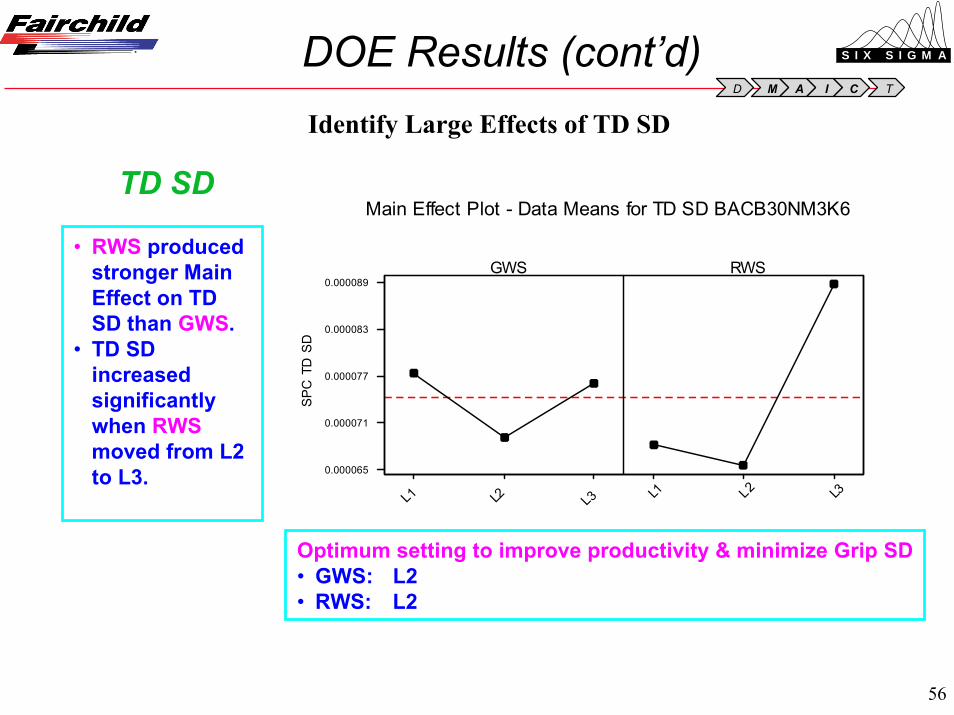
• RWS producedstronger MainEffect on TDSD than GWS.
• TD SDincreasedsignificantlywhen RWSmoved from L2to L3.
Optimum setting to improve productivity & minimize Grip SD• GWS: L2• RWS: L2
DOE Results (cont’d)Identify Large Effects of TD SD
57
S I X S I G M A
IAMD C T
TD SDL1L2L3
L1 L2 L3
0.00006
0.00007
0.00008
0.00009
0.00010
0.00011
RWS
GWS
Mea
n
Interaction Plot - Data Means for TD SD BACB30NM3K6
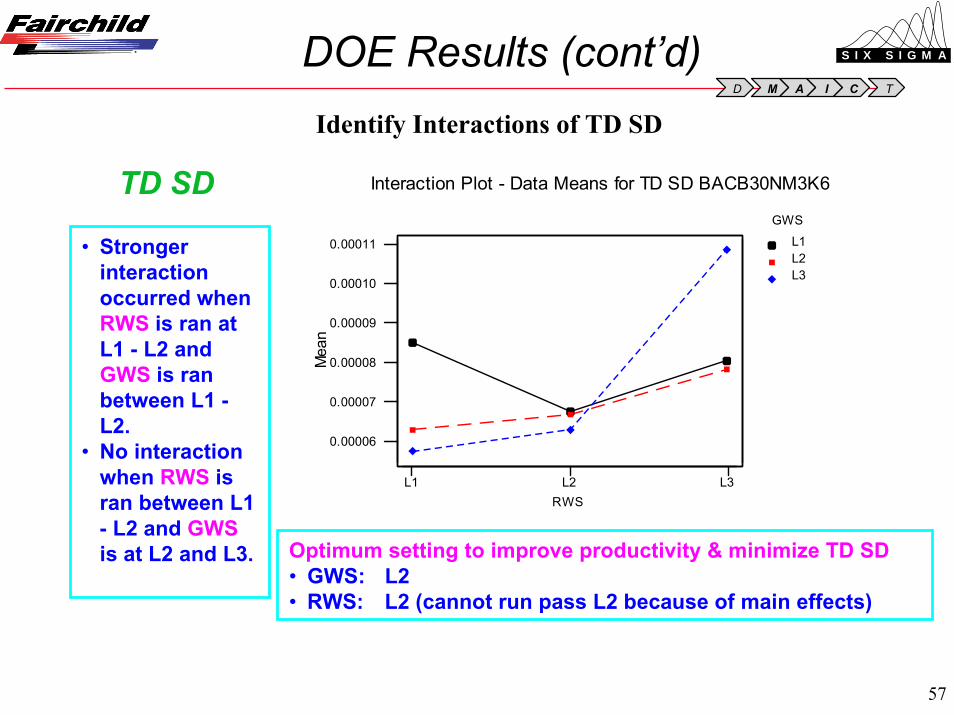
• Strongerinteractionoccurred whenRWS is ran atL1 - L2 andGWS is ranbetween L1 -L2.
• No interactionwhen RWS isran between L1- L2 and GWSis at L2 and L3. Optimum setting to improve productivity & minimize TD SD
• GWS: L2• RWS: L2 (cannot run pass L2 because of main effects)
DOE Results (cont’d)Identify Interactions of TD SD
58
S I X S I G M A
IAMD C T
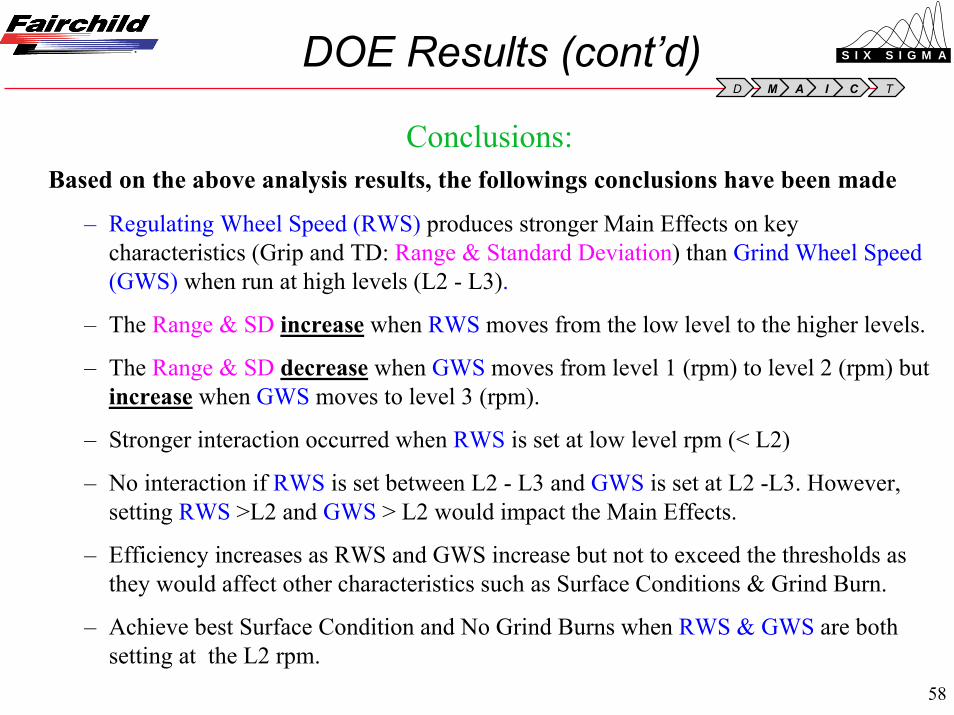
Conclusions:Based on the above analysis results, the followings conclusions have been made
– Regulating Wheel Speed (RWS) produces stronger Main Effects on keycharacteristics (Grip and TD: Range & Standard Deviation) than Grind Wheel Speed(GWS) when run at high levels (L2 - L3).
– The Range & SD increase when RWS moves from the low level to the higher levels.
– The Range & SD decrease when GWS moves from level 1 (rpm) to level 2 (rpm) butincrease when GWS moves to level 3 (rpm).
– Stronger interaction occurred when RWS is set at low level rpm (< L2)
– No interaction if RWS is set between L2 - L3 and GWS is set at L2 -L3. However,setting RWS >L2 and GWS > L2 would impact the Main Effects.
– Efficiency increases as RWS and GWS increase but not to exceed the thresholds asthey would affect other characteristics such as Surface Conditions & Grind Burn.
– Achieve best Surface Condition and No Grind Burns when RWS & GWS are bothsetting at the L2 rpm.
DOE Results (cont’d)

59
S I X S I G M A
IAMD C T
Recommendations:Based on the above conclusions, the followings settings were recommended
for confirmation run on the Grinding process parameters.
Run # Factor Setting
1 RWS L2GWS L2 (for full-size wheel)
There were three replications for each run
DOE Confirmation Runs
60
S I X S I G M A
IAMD C T
Key Improvements Summary:• Grind improvement Team reviewed, revised and released Grind
Handbook for standardization of Grind process between operators andwork shifts.
• Reinforcement training on Grind Handbook provided to Grind operatorson the week of April 2-5, 2002
• DOE completed on 02 August with subsequent confirmation runs thatvalidated initial findings. Implemented standard setup of machineparameters (Regulating Wheel Speed and Grind Wheel Speed)
• A Total Productive Maintenance (TPM) workshop conducted in the weekof July 9-12, 2002 to implement Autonomous Maintenance program.
• Continuous Improvement Team formed to improve Heading process.• Budget allocated to procure capable gage (Fowler gage to replace
Mitutoyo Micrometer).
Reduce Dimensional Variation - Improve
61
S I X S I G M A
IAMD C T
DMAIC REVIEW
DEFINE
MEASURE
ANALYZE
IMPROVE
CONTROL
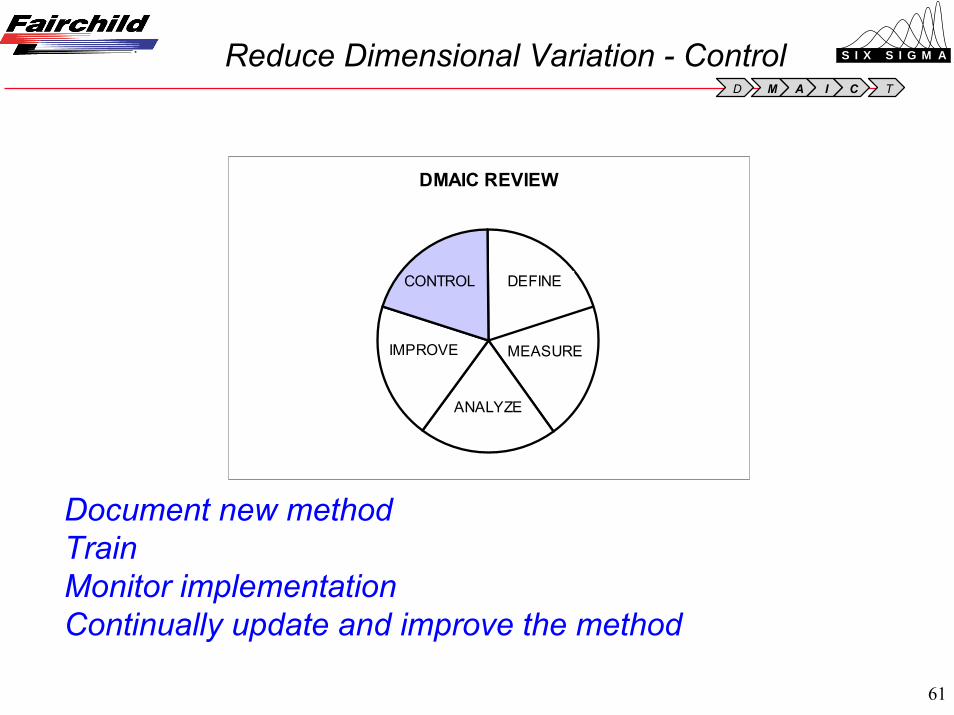
Document new method TrainMonitor implementationContinually update and improve the method
Reduce Dimensional Variation - Control

62
S I X S I G M A
IAMD C T
Control Summary
• Reinforcement training on Grind Handbook minimizedvariation machine setup among operators and different shifts
• Heading improvement team formed to reduce dimensionalvariation from heading components (input to Grind process)
• Operators to follow wheel dressing frequencies guidelines.
• Continue to use SPC to monitor the Grinding process.
• Internal audits scheduled to ensure effectiveness ofimplemented improvements.
Reduce Dimensional Variation - Control
63
S I X S I G M A
IAMD C T
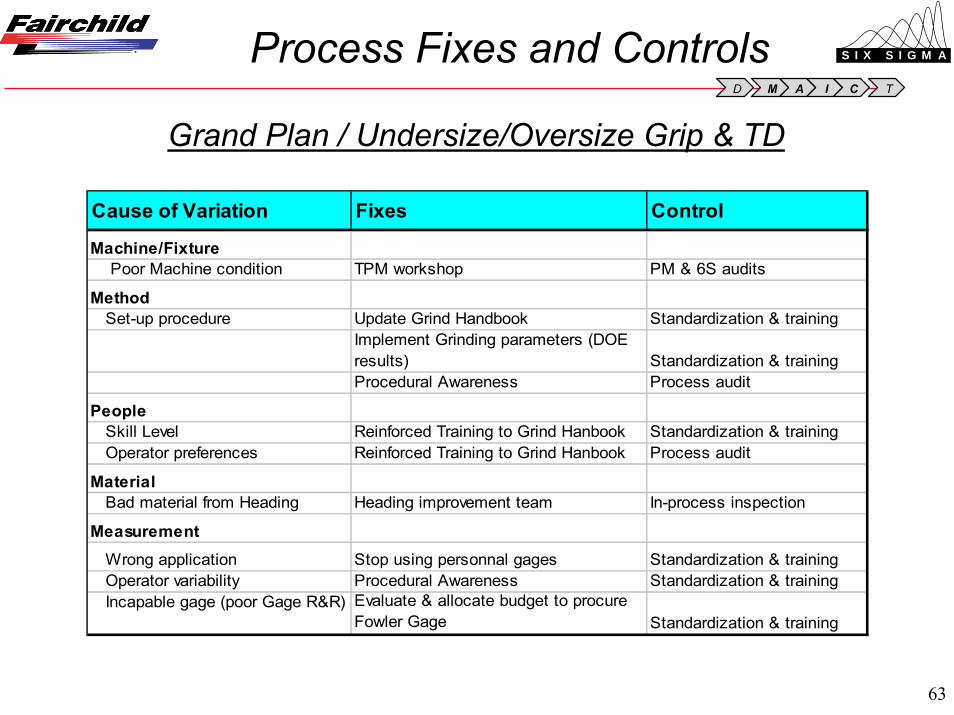
Cause of Variation Fixes Control
Machine/Fixture Poor Machine condition TPM workshop PM & 6S audits
Method Set-up procedure Update Grind Handbook Standardization & training
Implement Grinding parameters (DOE results) Standardization & trainingProcedural Awareness Process audit
People Skill Level Reinforced Training to Grind Hanbook Standardization & training Operator preferences Reinforced Training to Grind Hanbook Process audit
Material Bad material from Heading Heading improvement team In-process inspection
Measurement Wrong application Stop using personnal gages Standardization & training Operator variability Procedural Awareness Standardization & training Incapable gage (poor Gage R&R) Evaluate & allocate budget to procure
Fowler Gage Standardization & training
Process Fixes and Controls
Grand Plan / Undersize/Oversize Grip & TD

64
S I X S I G M A
IAMD C T
Causes of Variation Control
Machine/Fixture• Poor Machine Condition PM & 6S audit
Method• Set-up procedure Standardization & Training
Grind Handbook, AuditMeasurement • Poor Gage R&R Training, evaluate & procure new gage
What Xs to Control
Grand Plan / Undersize/Oversize Grip & TD

65
S I X S I G M A
IAMD C T
Risk AssessmentGrand Plan / Undersize/Oversize Grip & TD
Machine• Poor condition M M Volume of part Re-built Mach./TPM• Machine capability H H Grip & TD Undersize/oversize PM & standardized set-up
Method• Poor set-up/MPS not followed H H Grip & TD Undersize/oversize Grind Handbook
Reinforce TrainingManpower
• Operator Skill Level H H Non-conforming parts Training/awareness• Operator preferences H H Non-conforming parts Reinforce Training• Parts ran during warm-up M M Non-conforming parts Training/awareness
Measurement• Operator Variability M H Non-conforming Parts Parts are SPC• Poor Gage R&R H H Non-conforming Parts Training
Mother Nature• Measurement location L L Cycle time
Material• Pre-grind dim Variability M M Grip & TD Undersize/oversize In-process inspection
CI Heading Team
RiskH/M/L
Prob. Imp. Impact Abatement
66
S I X S I G M A
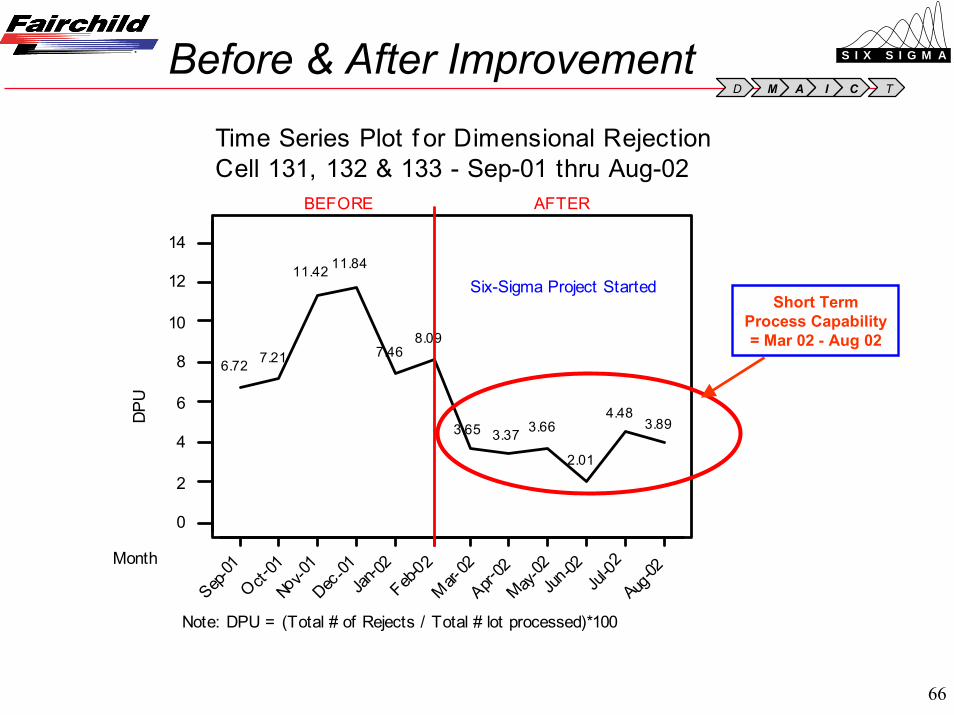
IAMD C TBefore & After Improvement
0
2
4
6
8
10
12
14
Sep-01
Oct-01
Nov-0
1
Dec -01Jan
-02Feb-
02
Mar-02
Apr-02
May-02
Jun-02
Jul-02
Aug-02
DPU
Month
6.72 7.21
11.42 11.84
7.468.09
3.65 3.37 3.66
2.01
4.483.89
Time Series Plot f or Dimensional RejectionCell 131, 132 & 133 - Sep-01 thru Aug-02
Six-Sigma Project Started
Note: DPU = (Total # of Rejects / Total # lot processed)*100
BEFORE AFTER
Short TermProcess Capability= Mar 02 - Aug 02

67
S I X S I G M A
IAMD C T
Short Term Process Sigma - After
Calculating Process Sigma : Method 1
2
1214
41
0.01689
98.311%
3.62
1. Determine number of defect opportunities O = per unit
2. Determine number of units processed N =
3. Determine total number of defects D = made (include defects made and later fixed)
4. Calculate Defects Per Opportunity DPO = =
5. Calculate Yield Yield = (1 – DPO) x 100 =
6. Look up Sigma in the Process Sigma Table Process Sigma =
DN x O
Improved from3.21 to 3.623.21 to 3.623.21 to 3.62

68
S I X S I G M A
IAMD C T
• Achieved and maintained team’s objectives– 50% reduction in dimensional reduction hence improved the Process
Sigma and First-Time-Yield.– 30% annual savings in scrap costs.
• Lesson Learned.– Using Six-Sigma methodology gave the team a systematic approach to
identifying and resolving root causes issues.– Senior management to review and approve team charter and allocate
resources upfront helped the team resolve work priority issues.– Involving operators in developing Grind Handbook sped-up training
and implementation of new method.
Reduce Dimensional Variation - Control
Improvements & Lesson Learned

69
S I X S I G M A
IAMD C T
Appendix 1
DOE Grind
70
S I X S I G M A
IAMD C T
Appendix 2
TPM Workshop