site suitability assessment
TRANSCRIPT
1
Site Suitability Assessment for Particular Wind Turbines in Furillen, Gotland Island, Sweden
Submitted to Bahri Uzunoglu
as part Wind Turbine Concepts and Applications course
Uppsala University
Dept. of Earth Sciences, Campus Gotland
Orkhan Baghirli
11/14/2014
2
Project Summary
In this assignment, site suitability checks are performed for the given wind turbines in Gotland
Island, Sweden. For this purpose, several procedures are followed:
1. Downloading wind statistics data from available online sources throughout the whole
island.
2. Performing correlation between these wind resources and defining those which show
decent linear relationship and generating Wind Rose Map.
3. Defining borders of Gotland pertaining to roughness and height contour coverages.
4. Pairing downloaded wind resources as long-term reference sources and short-term mast
data all over the island
5. Performing “Measure/Correlate/Predict” (MCP) for each of these pairs to correct the
shot-term site data to long-term reference data using Linear Regression method and Wind
Index method.
6. Performing site compliance checks for the given turbines using the best pair of wind
statistics data that represent the similar climatic properties with that of wind turbine
locations.
7. Delivering WindPro project file together with supplementing reports.
All of these points mentioned above are completed and delivered as a single file upon request.
1.0 Introduction
Main objective of this report is to assess the site suitability for the given wind turbines. WindPro
coupled with WAsP calculations are chosen as a working environment upon availability of the
software. During the different stages of the project, Google Earth became handy to define the
boundaries of Island, to convert between different coordinate systems and to verify the location
of wind turbines on their natural habitat. Rest of this paper will guide you step by step to the final
stage of the project. This project is a part of teamwork and individual work plan.
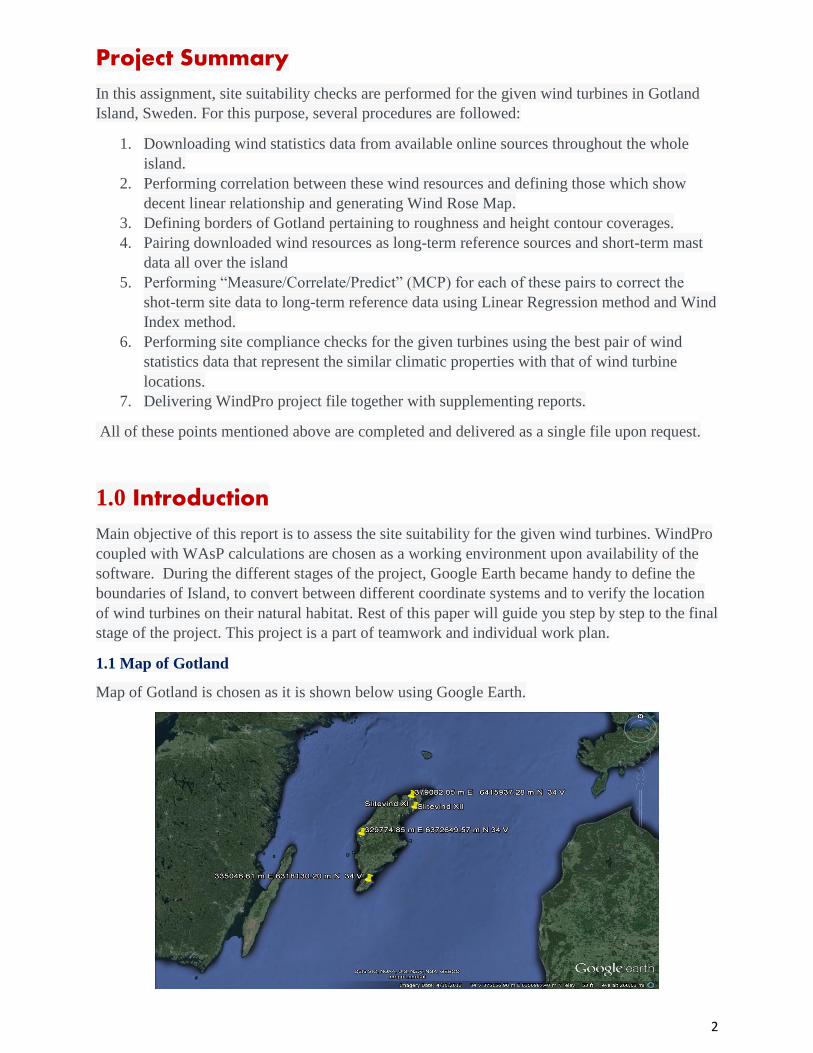
1.1 Map of Gotland
Map of Gotland is chosen as it is shown below using Google Earth.
3
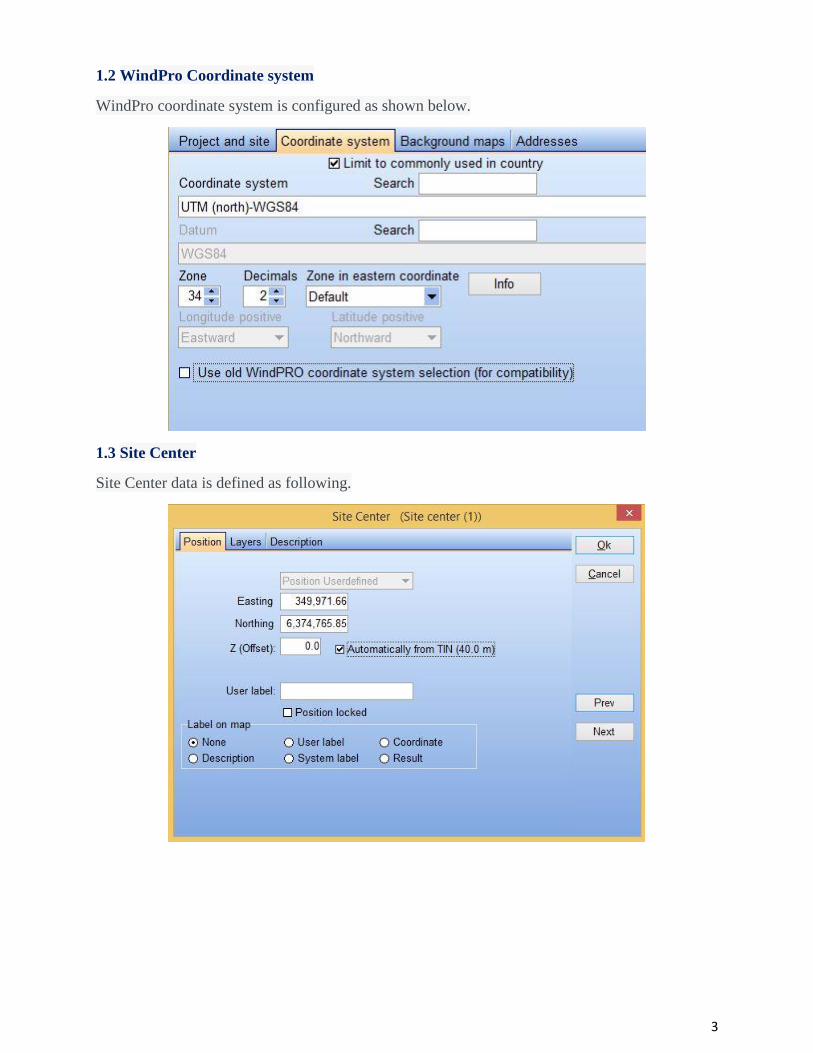
1.2 WindPro Coordinate system
WindPro coordinate system is configured as shown below.
1.3 Site Center
Site Center data is defined as following.
4
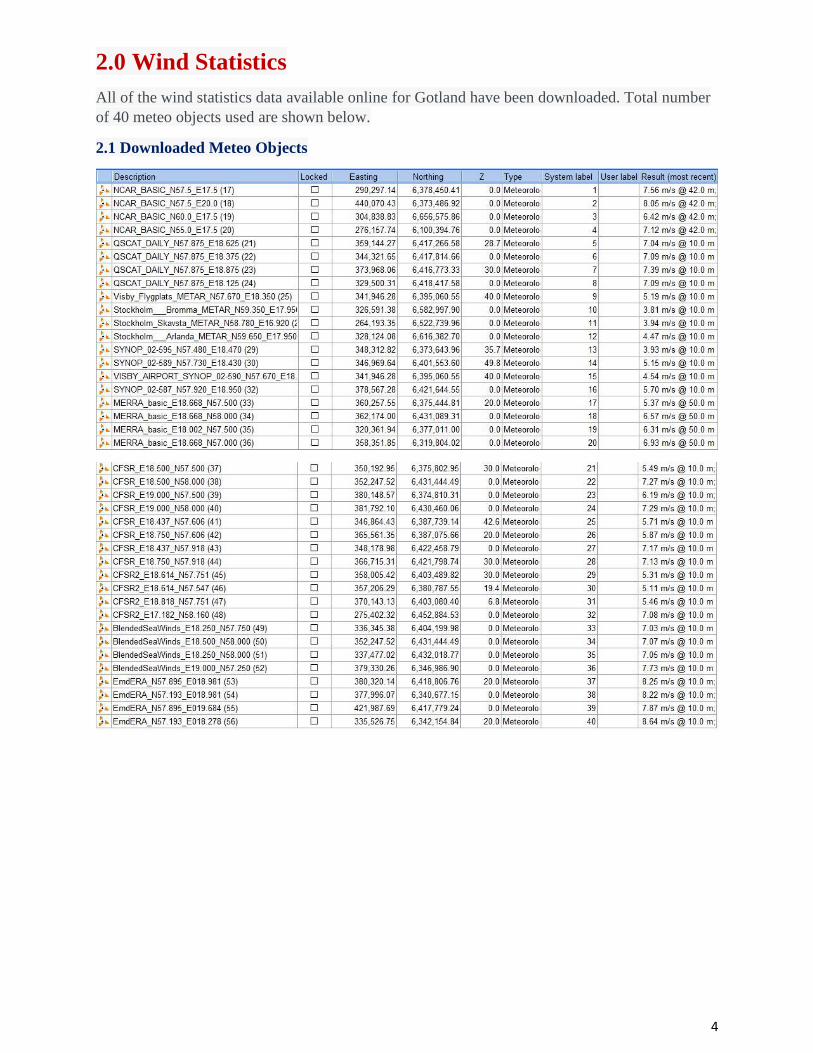
2.0 Wind Statistics
All of the wind statistics data available online for Gotland have been downloaded. Total number
of 40 meteo objects used are shown below.
2.1 Downloaded Meteo Objects
5
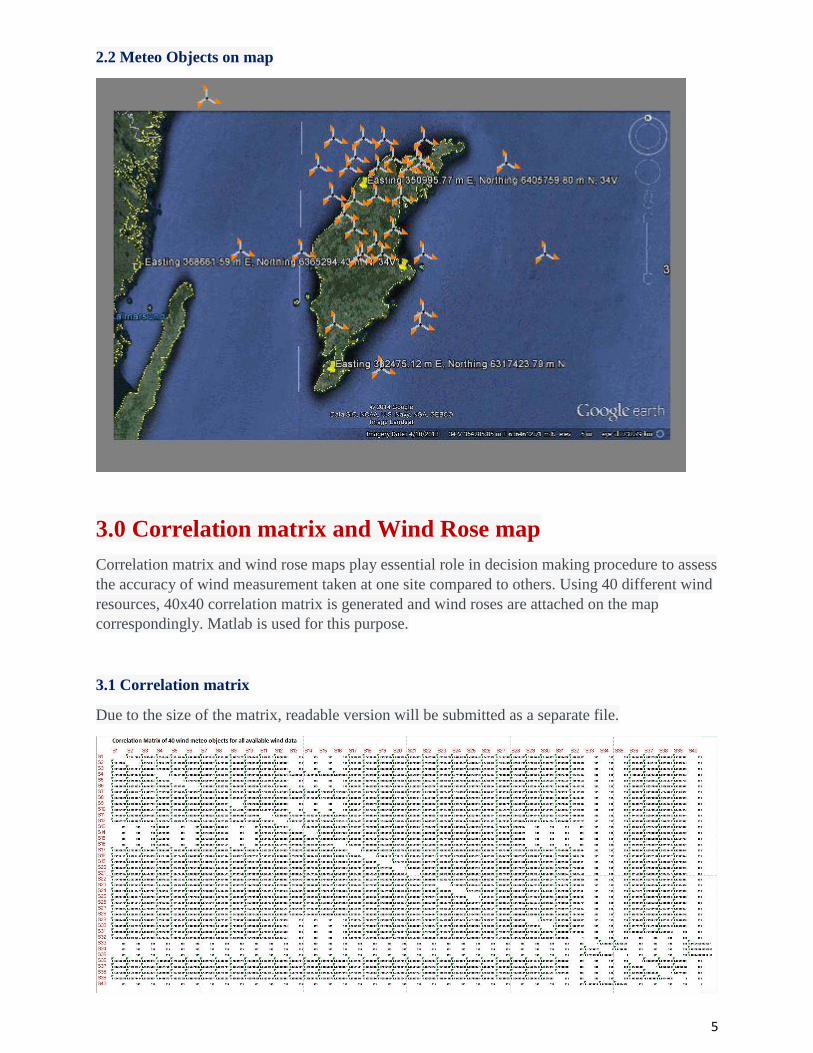
2.2 Meteo Objects on map
3.0 Correlation matrix and Wind Rose map
Correlation matrix and wind rose maps play essential role in decision making procedure to assess
the accuracy of wind measurement taken at one site compared to others. Using 40 different wind
resources, 40x40 correlation matrix is generated and wind roses are attached on the map
correspondingly. Matlab is used for this purpose.
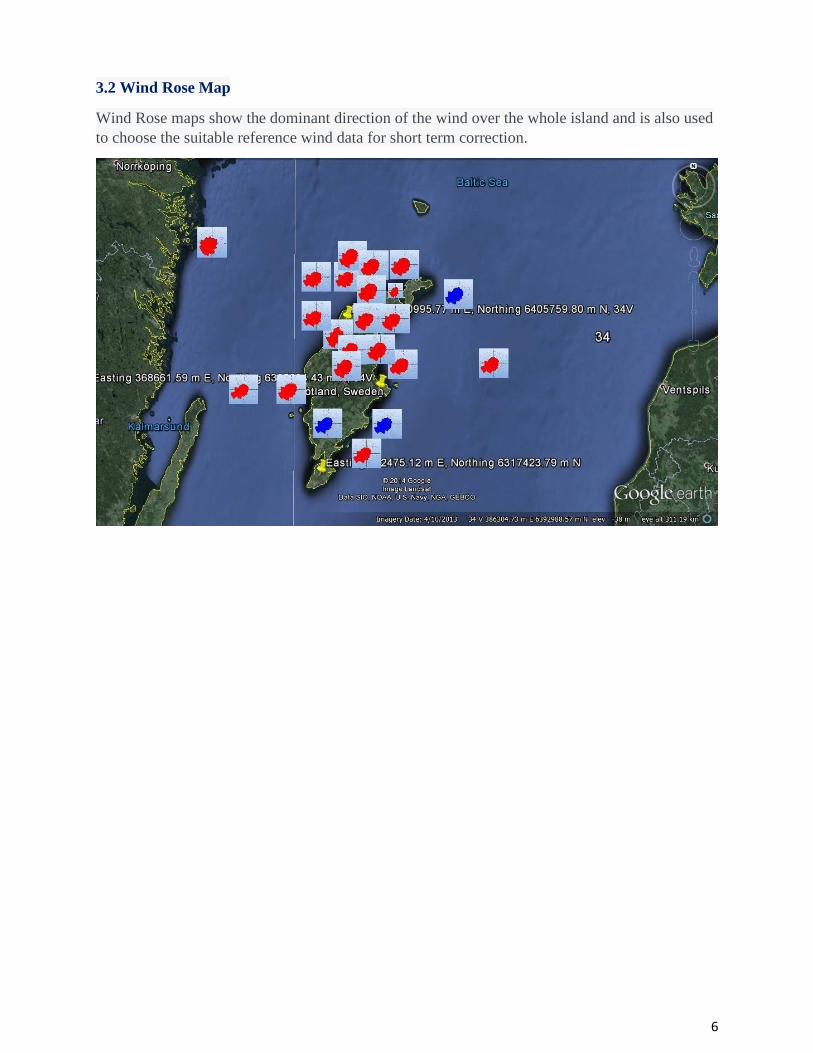
3.1 Correlation matrix
Due to the size of the matrix, readable version will be submitted as a separate file.
6
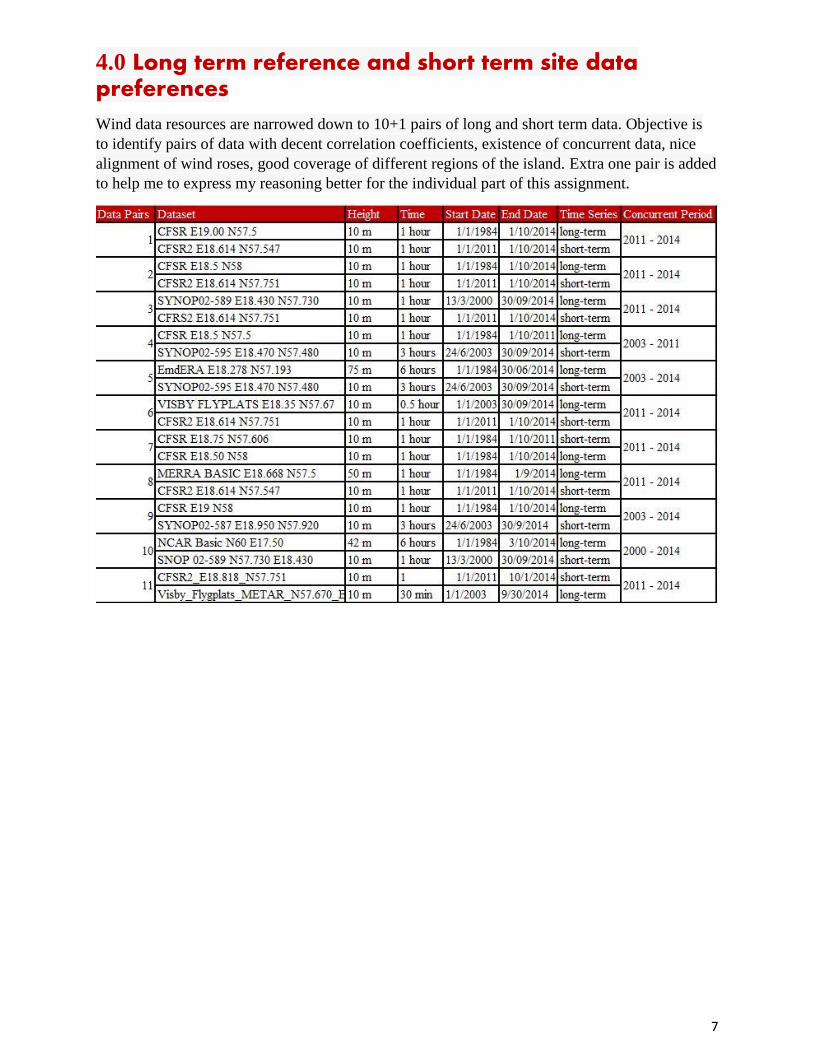
3.2 Wind Rose Map
Wind Rose maps show the dominant direction of the wind over the whole island and is also used
to choose the suitable reference wind data for short term correction.
7
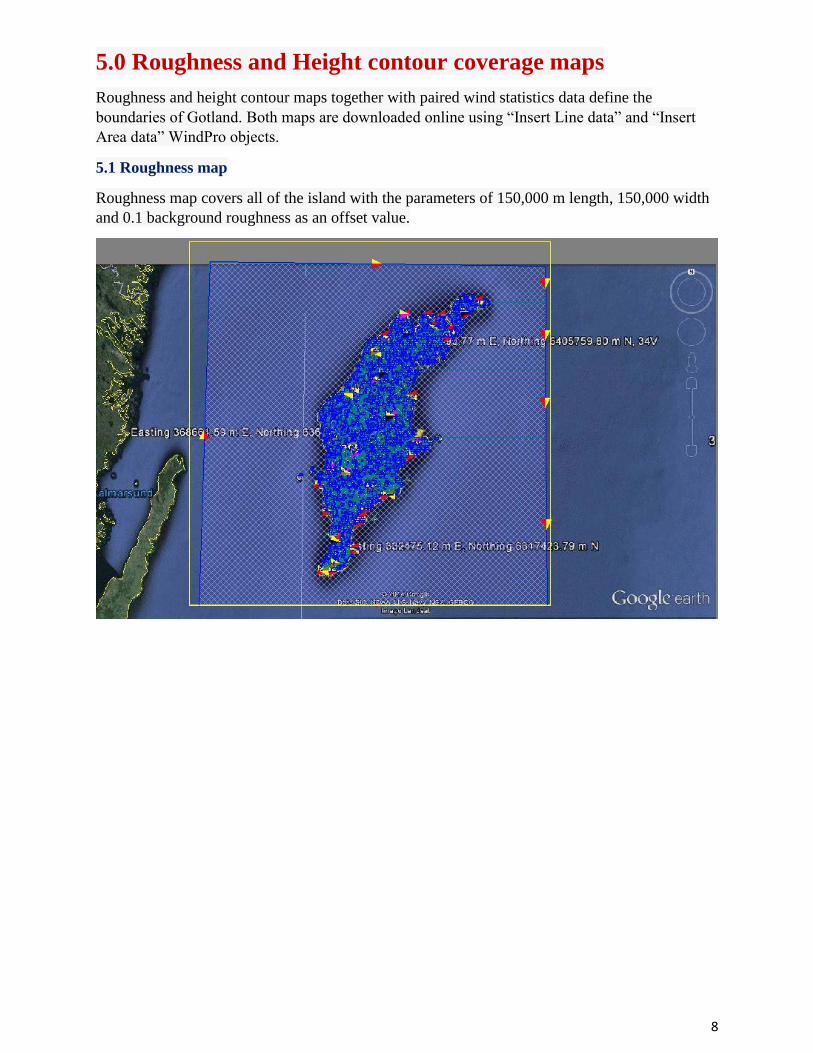
4.0 Long term reference and short term site data preferences
Wind data resources are narrowed down to 10+1 pairs of long and short term data. Objective is
to identify pairs of data with decent correlation coefficients, existence of concurrent data, nice
alignment of wind roses, good coverage of different regions of the island. Extra one pair is added
to help me to express my reasoning better for the individual part of this assignment.
8
5.0 Roughness and Height contour coverage maps
Roughness and height contour maps together with paired wind statistics data define the
boundaries of Gotland. Both maps are downloaded online using “Insert Line data” and “Insert
Area data” WindPro objects.
5.1 Roughness map
Roughness map covers all of the island with the parameters of 150,000 m length, 150,000 width
and 0.1 background roughness as an offset value.
9
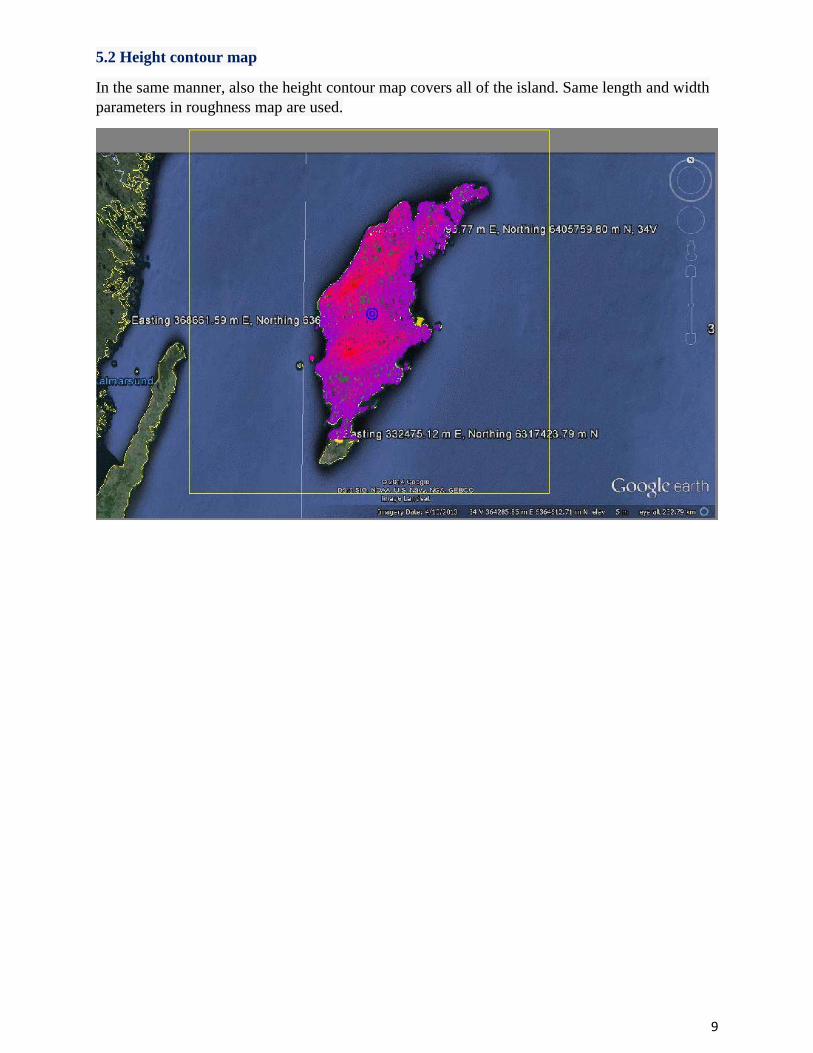
5.2 Height contour map
In the same manner, also the height contour map covers all of the island. Same length and width
parameters in roughness map are used.
10
6.0 MCP
MCP is the abbreviation for Measure-Correlate-Predict techniques, which is widely in use for
establishing a long-term wind statistic using limited wind data from the local site and long-term
data from a nearby site. The task of any estimation of a long-term wind statistic is to establish a
transfer model between the available short-term local data and the concurrent data from a long-
term reference data set (WindPRO Manual, 2013).
6.1 Linear Regression method
The Linear Regression tool enables the user to inspect the fit directly through an animated graph.
If the fit is not satisfactory, a wide range of parameters may be fine-tuned to provide a better fit.
The regression tool is not limited to linear regression, but also higher order polynomials may be
used in modeling wind speeds and wind veer (WindPRO Manual, 2013).
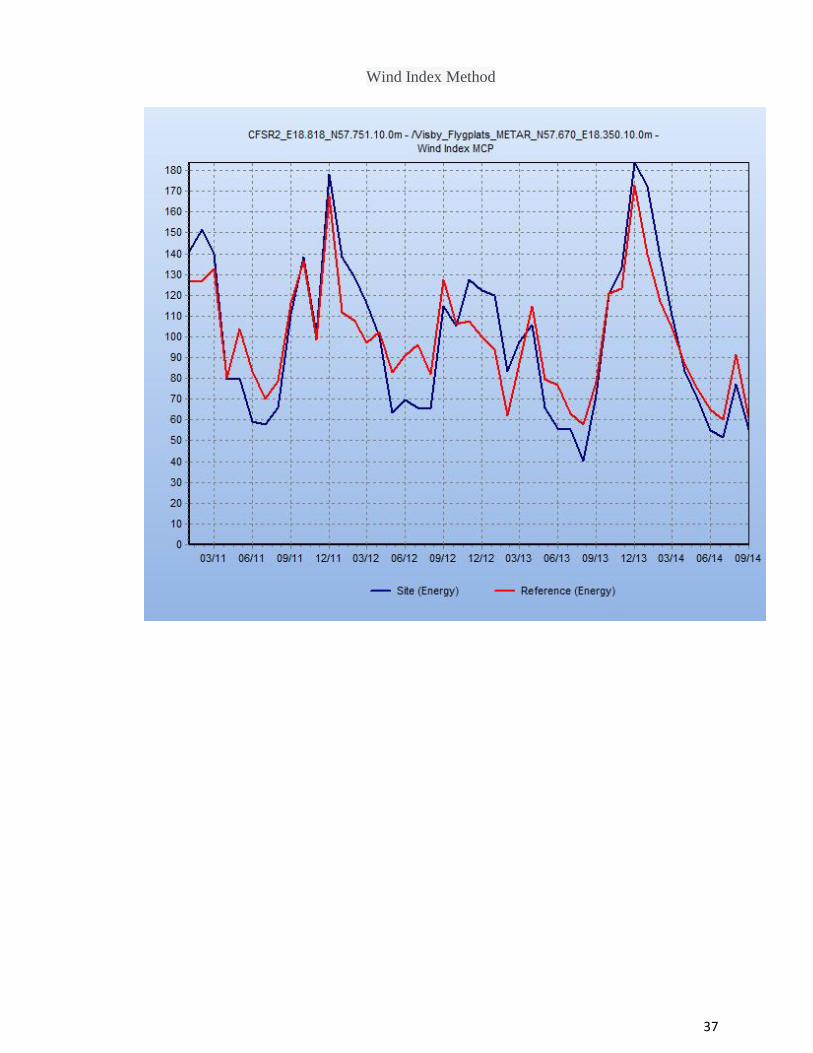
6.2 Wind Index Method
The index correlation method is a method typically making the MCP analysis by using monthly
averages of the energy yield, thus disregarding the directional distribution of the winds. Even
though this method may seem rather crude and primitive when comparing to other more
advanced MCP methods, it has its advantages in stability and performance even in the cases
where other MCP methods seem to fail. The Wind Index MCP method in WindPRO offers the
opportunity to calculate the wind indexes using real power curves from the wind turbines
included in the wind turbine catalogue in WindPRO (WindPRO Manual, 2013).
6.3 Best Qualified Pair
MCP is performed for all of the 11 pre-identified long-term and short-term data. For the
convenience, figures only for the best qualified set of data are presented here. For the rest of
MCP calculations refer to Appendix A: MCP.
Selection of the best qualified pair out of 11 different combinations are done based on the criteria
such as correlation coefficients, wind roses, proximity of the met masts. Best correlation is
observed in the 7th pair: CFSR E18.75 N57.606 and CFSR E18.50 N58. Corresponding cofactors
are: Linear Regression Method: 0.9918, Wind Index Method: 0.9914. However, there is another
pair that represents the strategic location of wind turbines better than this option. Therefore, best
qualified option used in this project is the 11th pair: VisbyFlygplats_METAR_N57.670_E18.350
(long term)/ CFSR2_E18.818_N57.751 (short term) with the correlation coefficient parameters
of: Linear Regression Method: 0.9386, Wind Index Method: 0.9207.
11
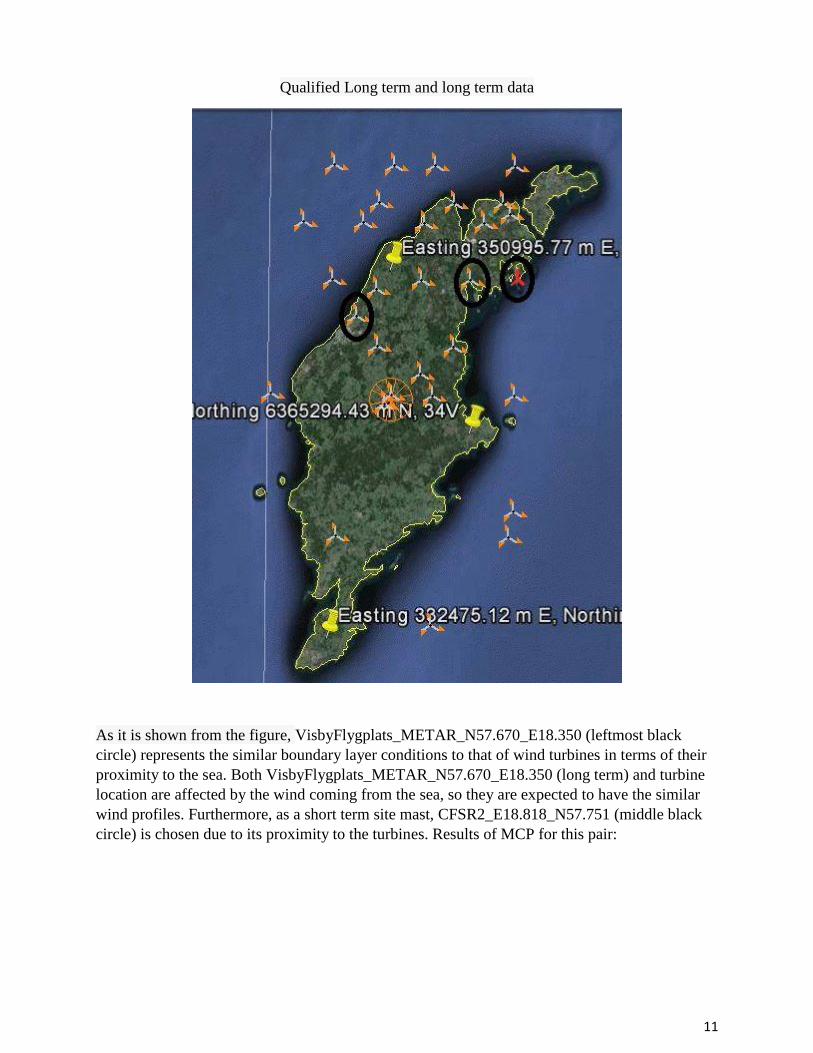
Qualified Long term and long term data
As it is shown from the figure, VisbyFlygplats_METAR_N57.670_E18.350 (leftmost black
circle) represents the similar boundary layer conditions to that of wind turbines in terms of their
proximity to the sea. Both VisbyFlygplats_METAR_N57.670_E18.350 (long term) and turbine
location are affected by the wind coming from the sea, so they are expected to have the similar
wind profiles. Furthermore, as a short term site mast, CFSR2_E18.818_N57.751 (middle black
circle) is chosen due to its proximity to the turbines. Results of MCP for this pair:
12
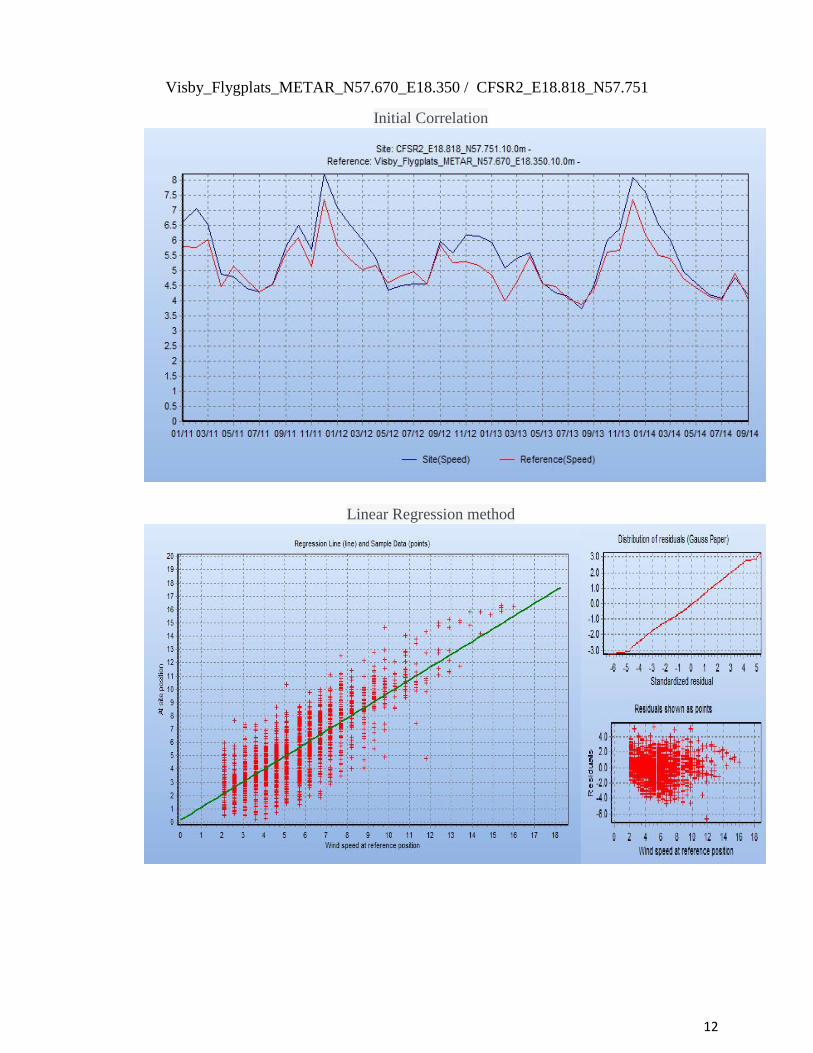
Visby_Flygplats_METAR_N57.670_E18.350 / CFSR2_E18.818_N57.751
Initial Correlation
Linear Regression method
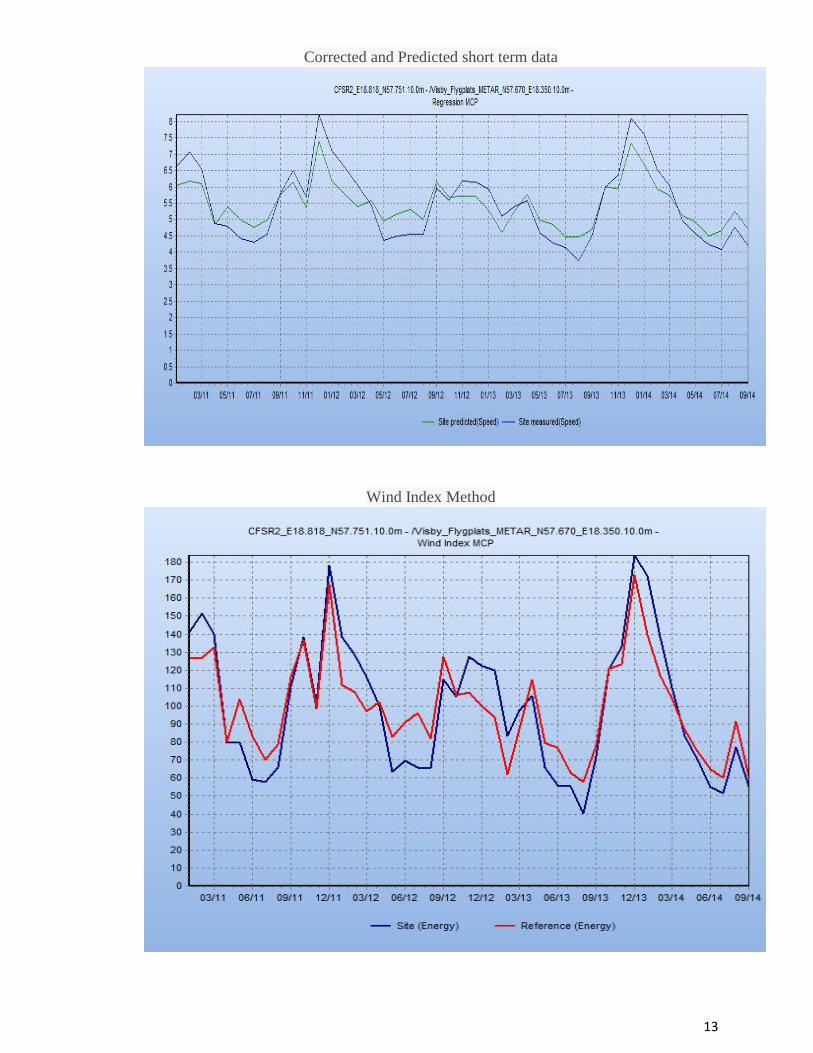
13
Corrected and Predicted short term data
Wind Index Method
14
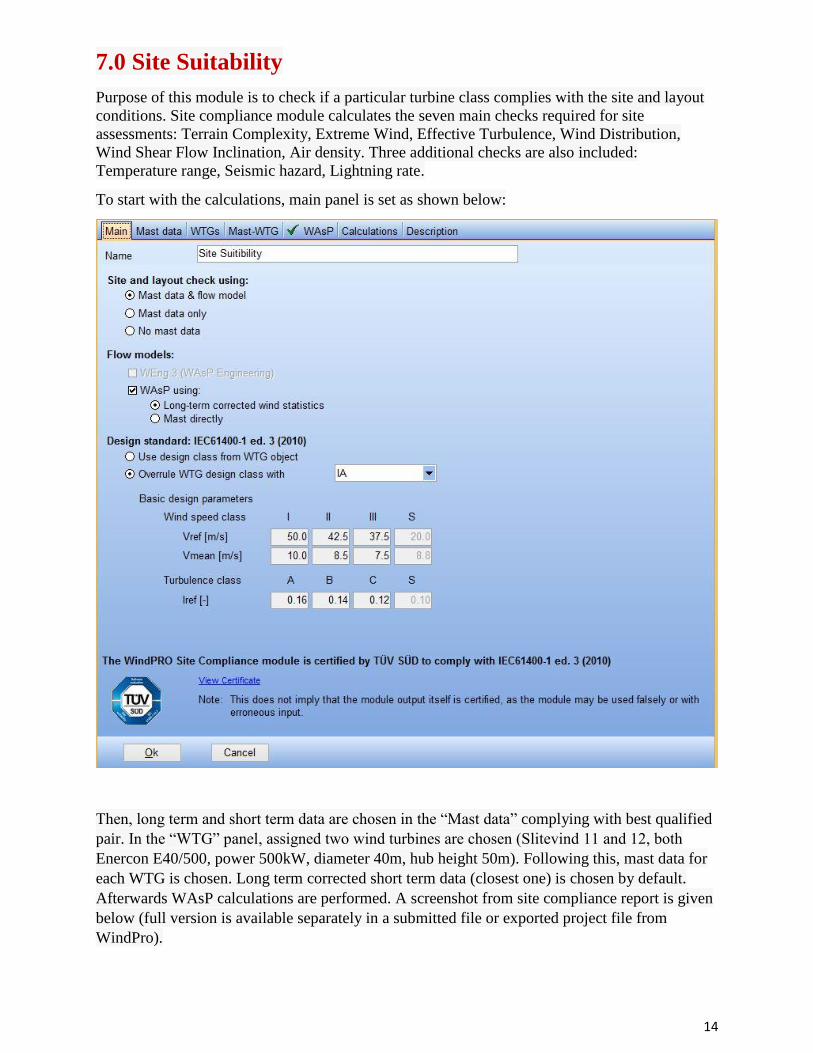
7.0 Site Suitability
Purpose of this module is to check if a particular turbine class complies with the site and layout
conditions. Site compliance module calculates the seven main checks required for site
assessments: Terrain Complexity, Extreme Wind, Effective Turbulence, Wind Distribution,
Wind Shear Flow Inclination, Air density. Three additional checks are also included:
Temperature range, Seismic hazard, Lightning rate.
To start with the calculations, main panel is set as shown below:
Then, long term and short term data are chosen in the “Mast data” complying with best qualified
pair. In the “WTG” panel, assigned two wind turbines are chosen (Slitevind 11 and 12, both
Enercon E40/500, power 500kW, diameter 40m, hub height 50m). Following this, mast data for
each WTG is chosen. Long term corrected short term data (closest one) is chosen by default.
Afterwards WAsP calculations are performed. A screenshot from site compliance report is given
below (full version is available separately in a submitted file or exported project file from
WindPro).
15
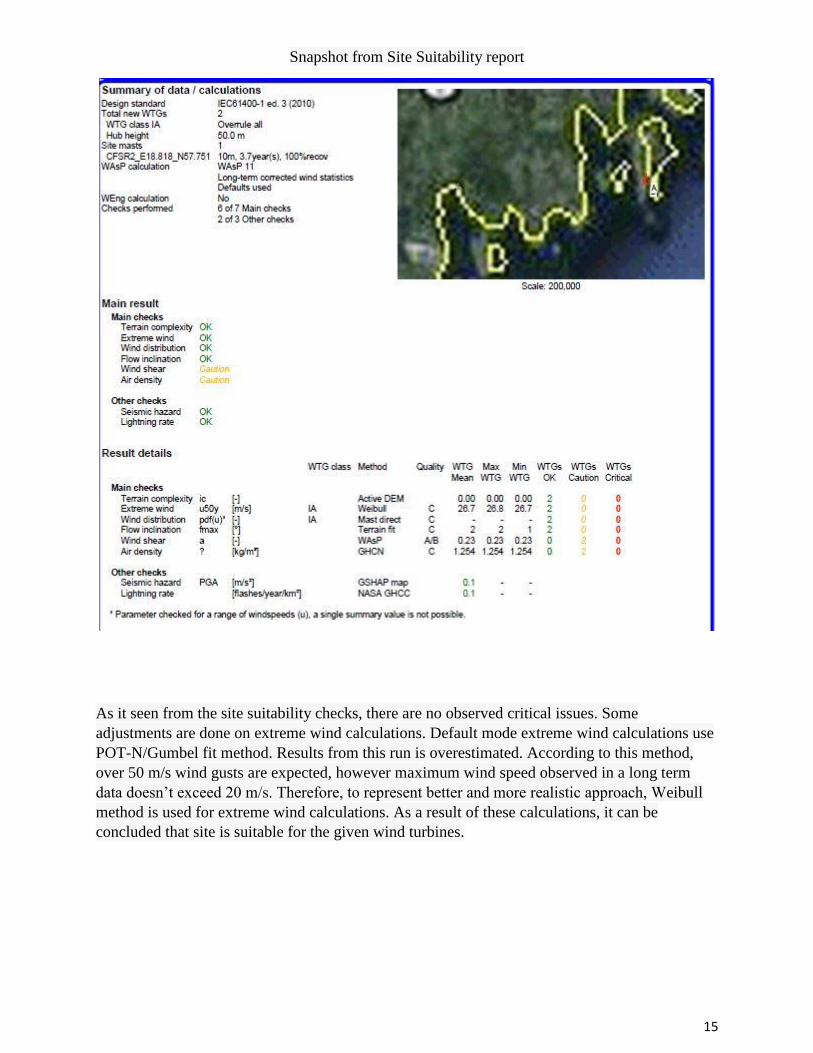
Snapshot from Site Suitability report
As it seen from the site suitability checks, there are no observed critical issues. Some
adjustments are done on extreme wind calculations. Default mode extreme wind calculations use
POT-N/Gumbel fit method. Results from this run is overestimated. According to this method,
over 50 m/s wind gusts are expected, however maximum wind speed observed in a long term
data doesn’t exceed 20 m/s. Therefore, to represent better and more realistic approach, Weibull
method is used for extreme wind calculations. As a result of these calculations, it can be
concluded that site is suitable for the given wind turbines.
16
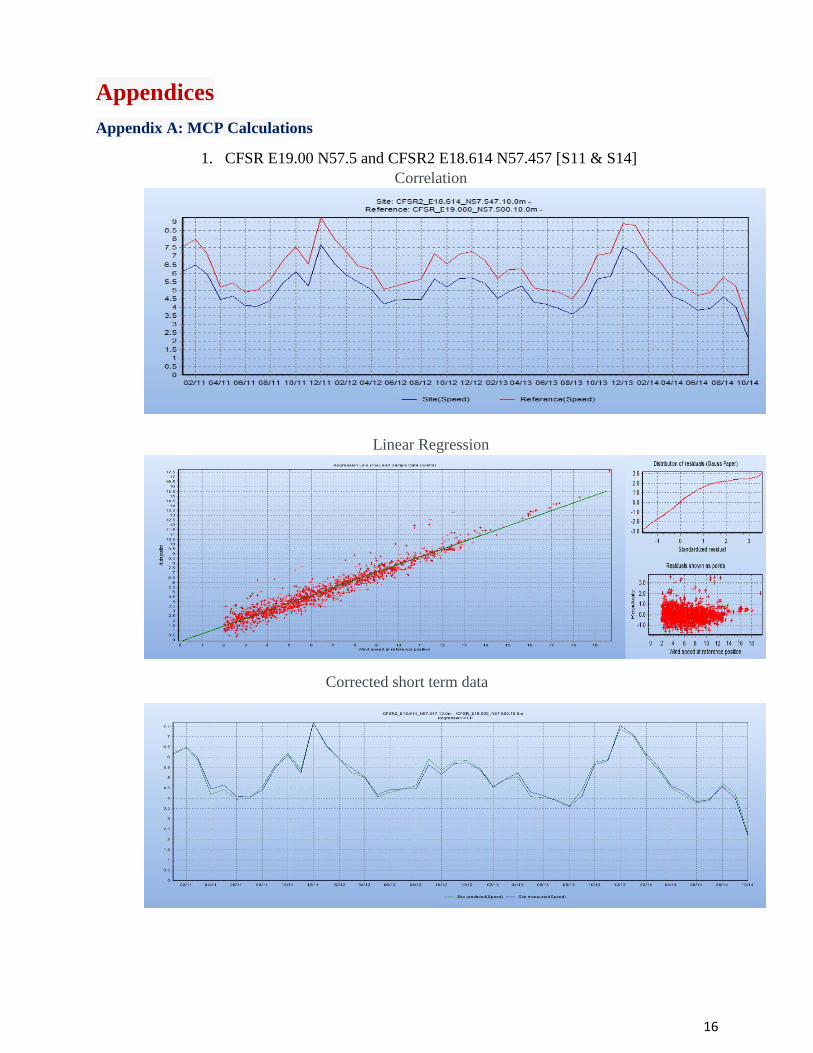
Appendices
Appendix A: MCP Calculations
1. CFSR E19.00 N57.5 and CFSR2 E18.614 N57.457 [S11 & S14]
Correlation
Linear Regression
Corrected short term data

17
Wind Index method
18
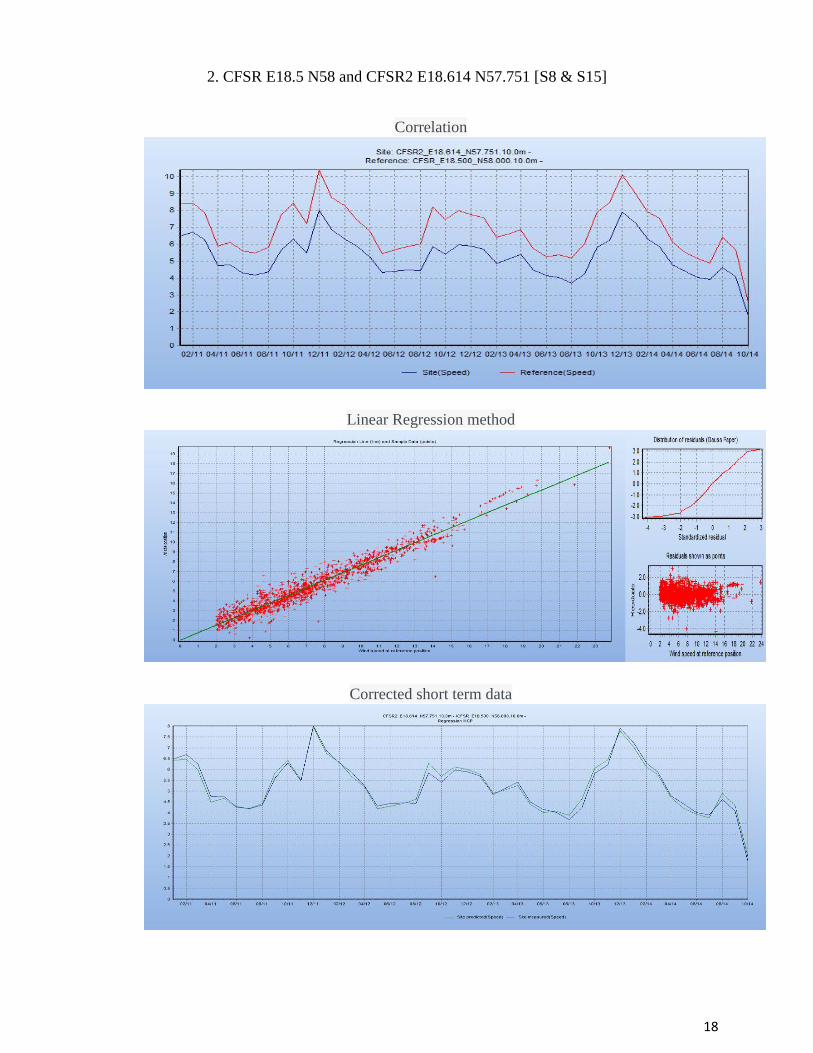
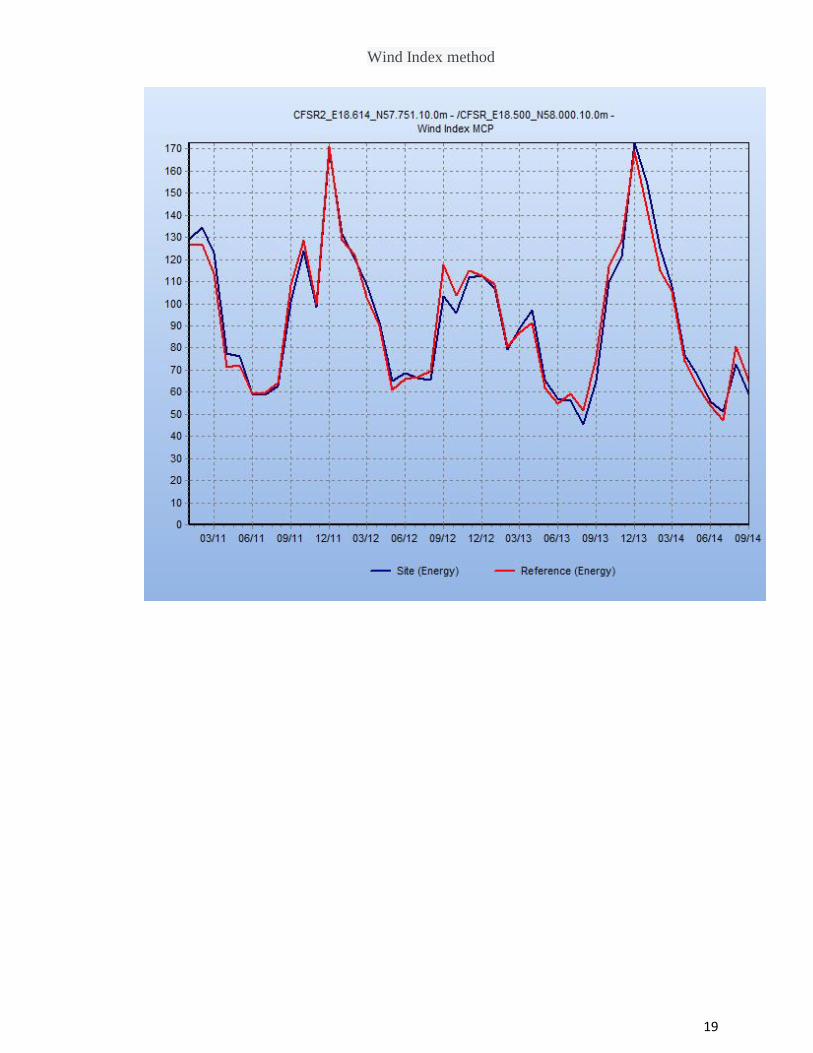
2. CFSR E18.5 N58 and CFSR2 E18.614 N57.751 [S8 & S15]
Correlation
Linear Regression method
Corrected short term data
19
Wind Index method
20
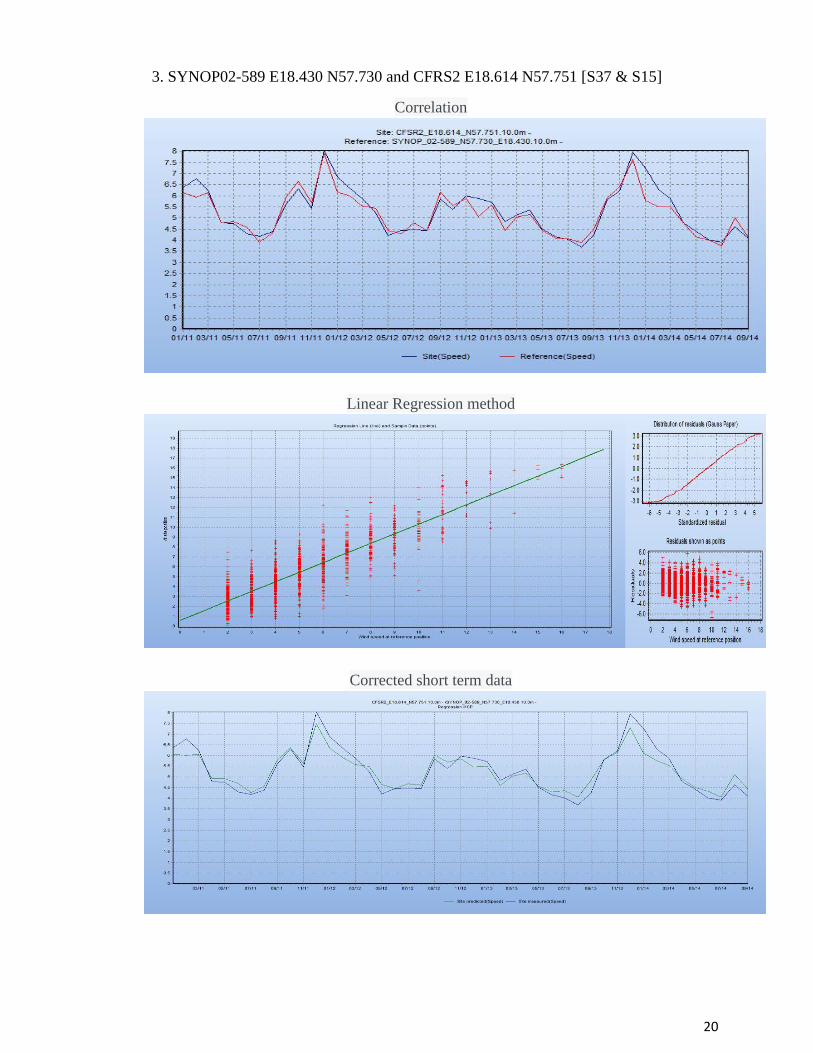
3. SYNOP02-589 E18.430 N57.730 and CFRS2 E18.614 N57.751 [S37 & S15]
Correlation
Linear Regression method
Corrected short term data

21
Wind Index method
22
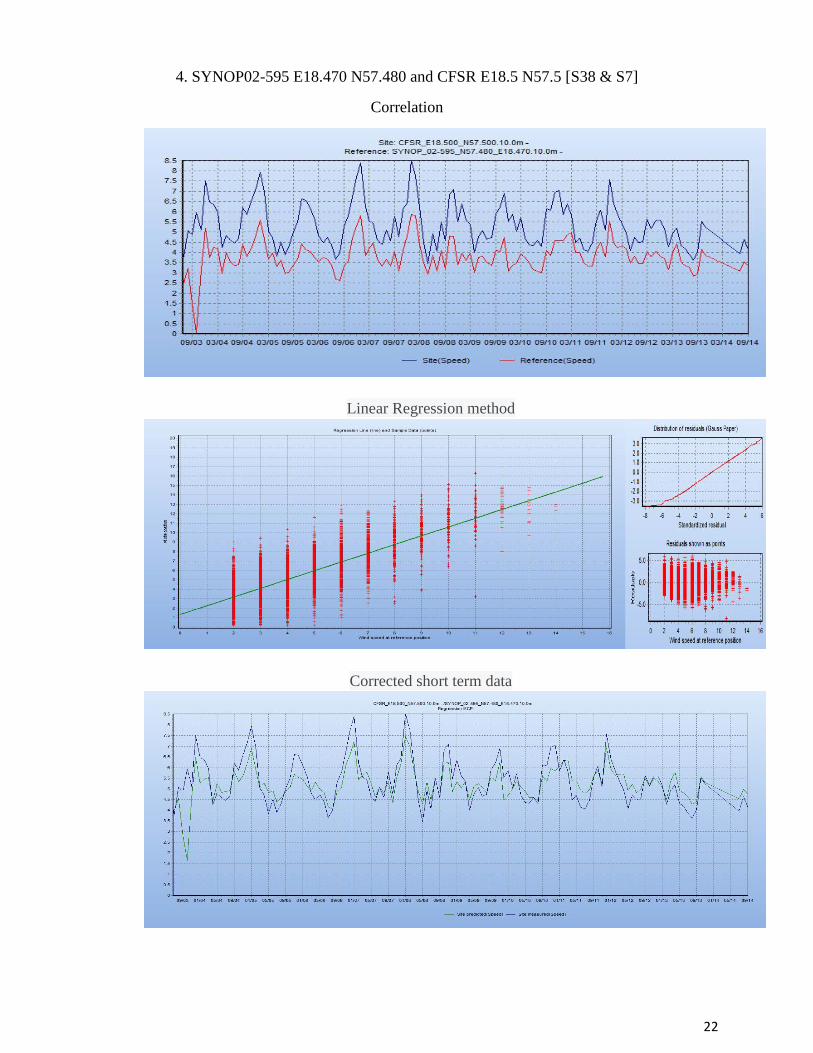
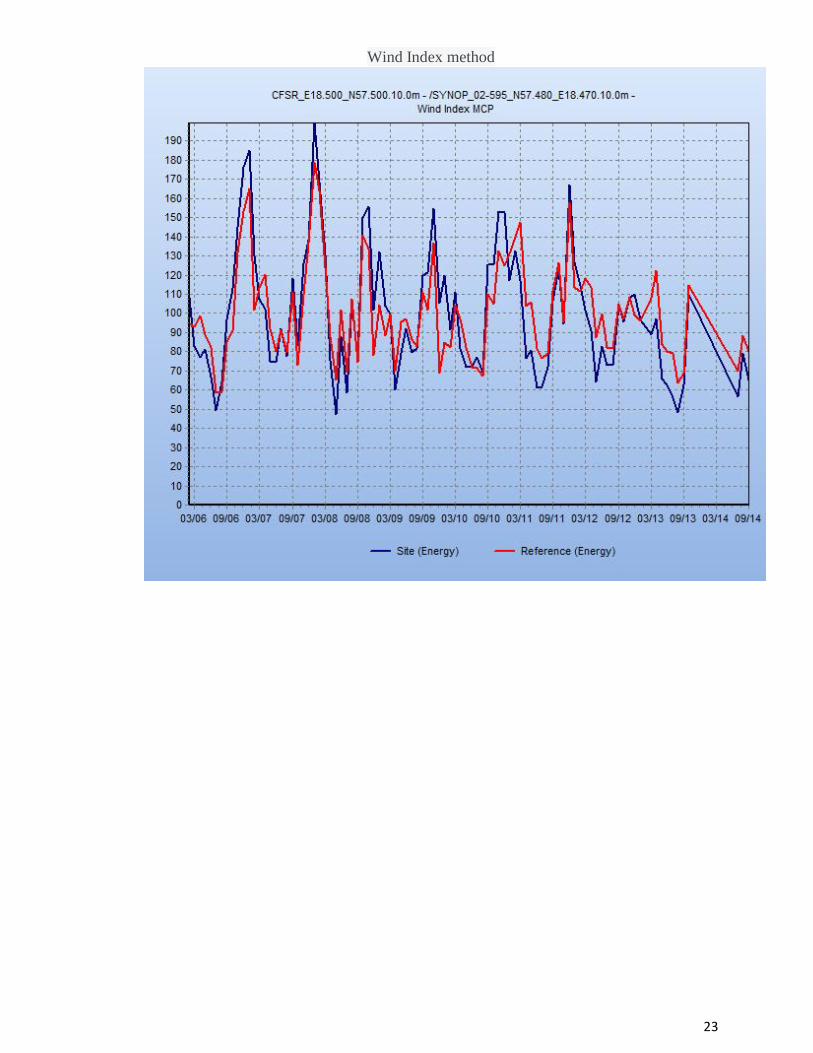
4. SYNOP02-595 E18.470 N57.480 and CFSR E18.5 N57.5 [S38 & S7]
Correlation
Linear Regression method
Corrected short term data
23
Wind Index method
24
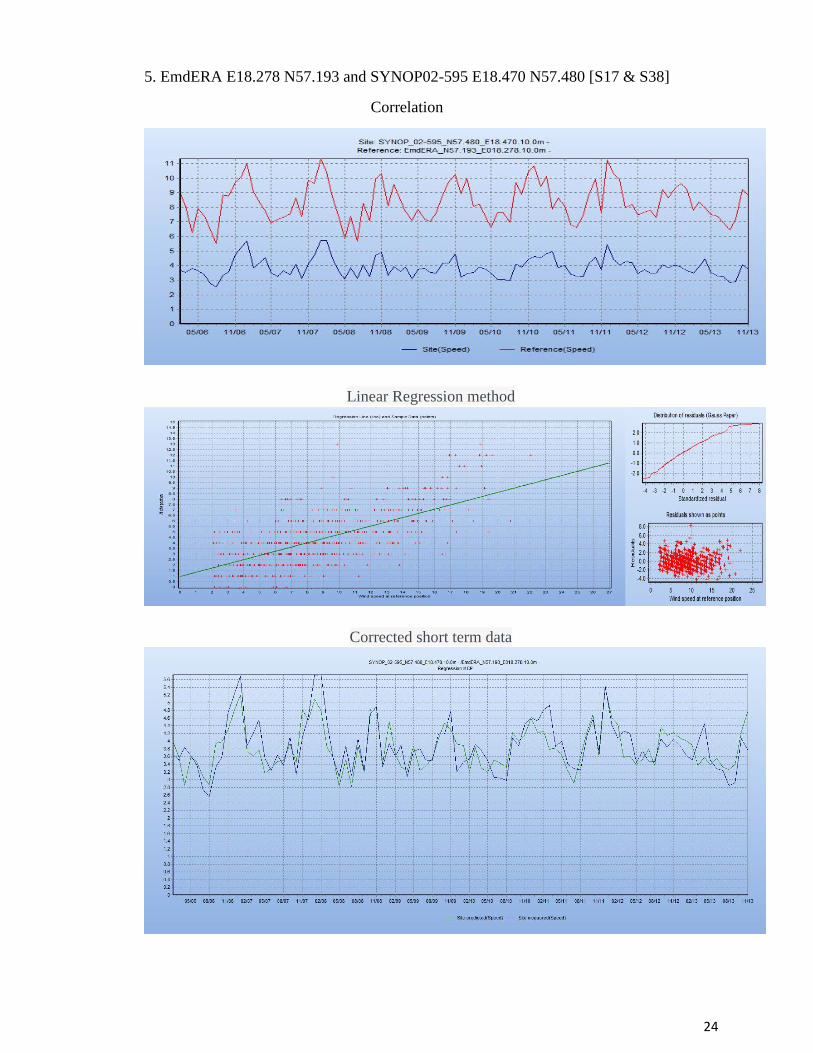
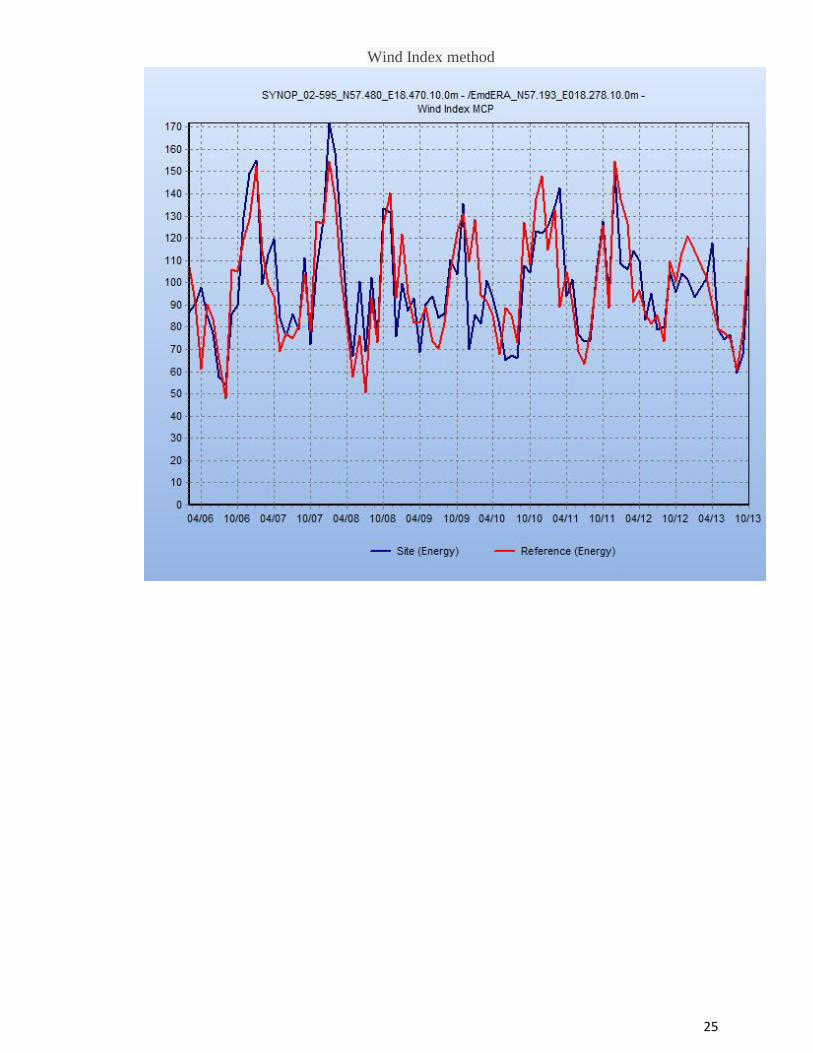
5. EmdERA E18.278 N57.193 and SYNOP02-595 E18.470 N57.480 [S17 & S38]
Correlation
Linear Regression method
Corrected short term data
25
Wind Index method
26
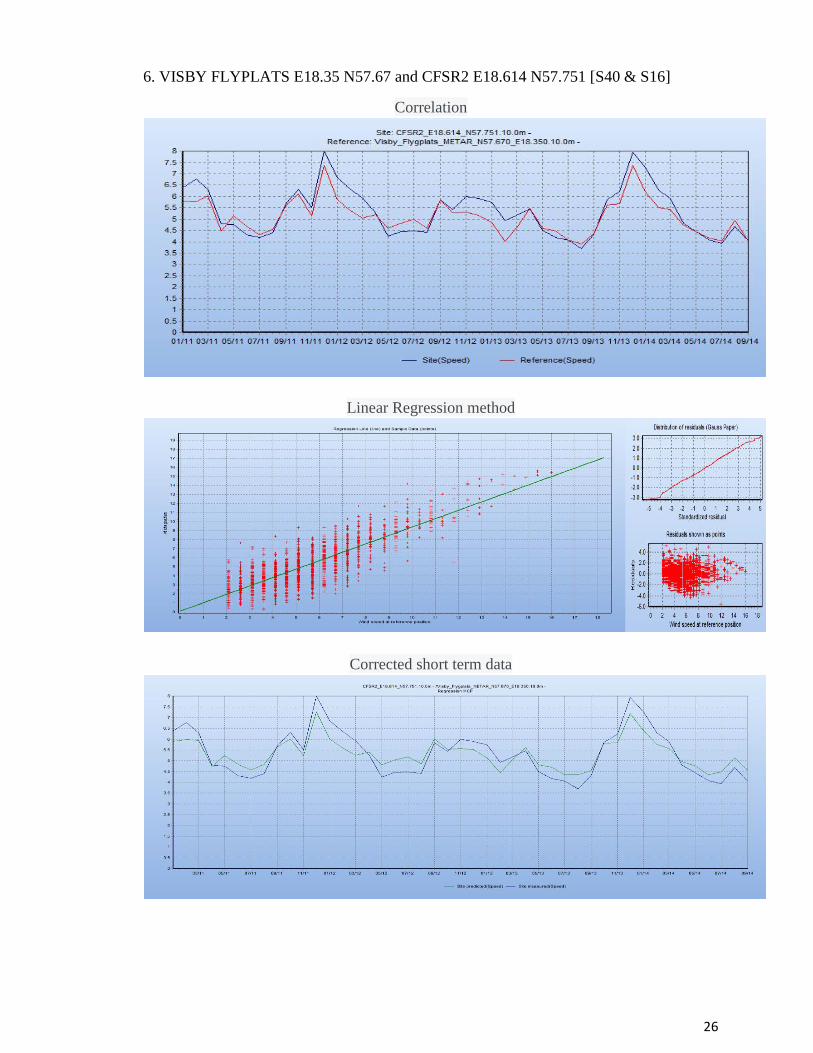
6. VISBY FLYPLATS E18.35 N57.67 and CFSR2 E18.614 N57.751 [S40 & S16]
Correlation
Linear Regression method
Corrected short term data
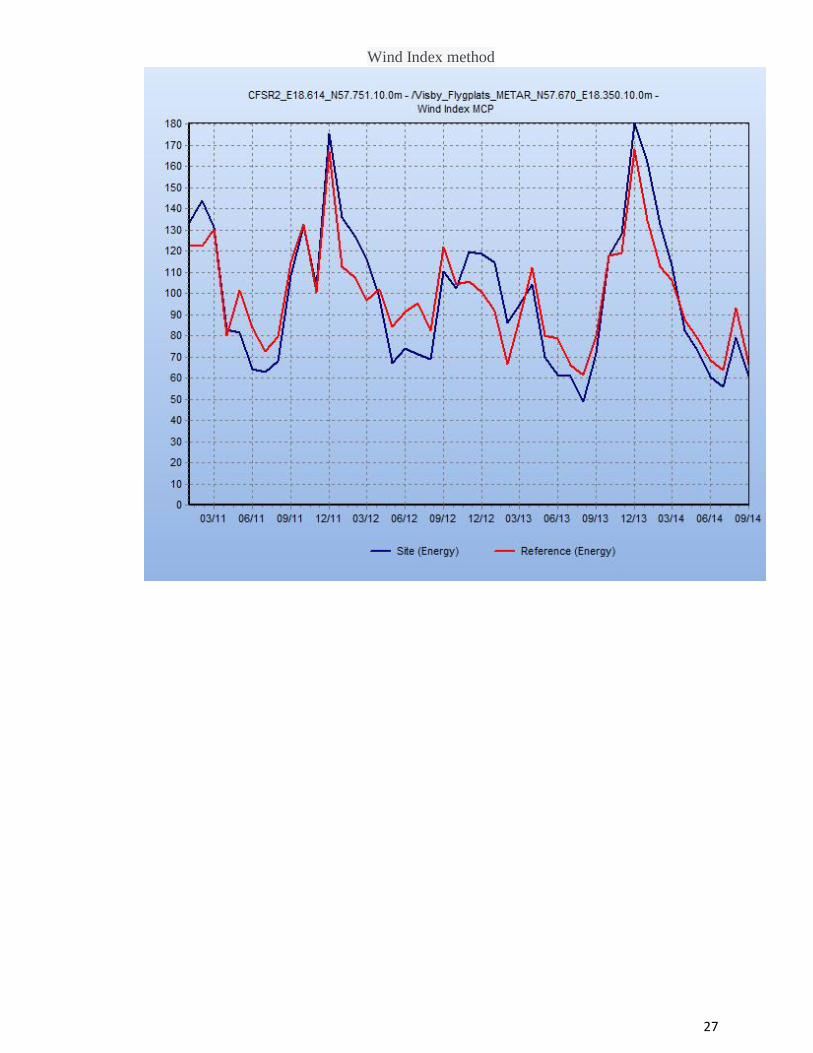
27
Wind Index method
28
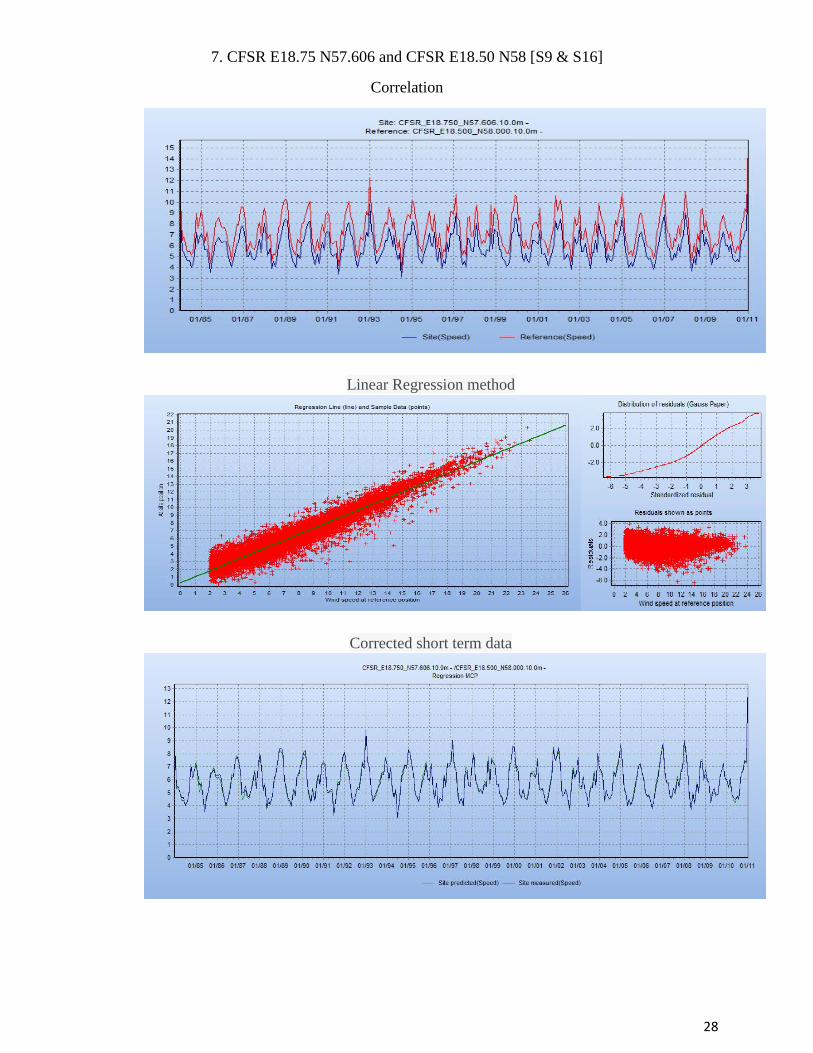
7. CFSR E18.75 N57.606 and CFSR E18.50 N58 [S9 & S16]
Correlation
Linear Regression method
Corrected short term data
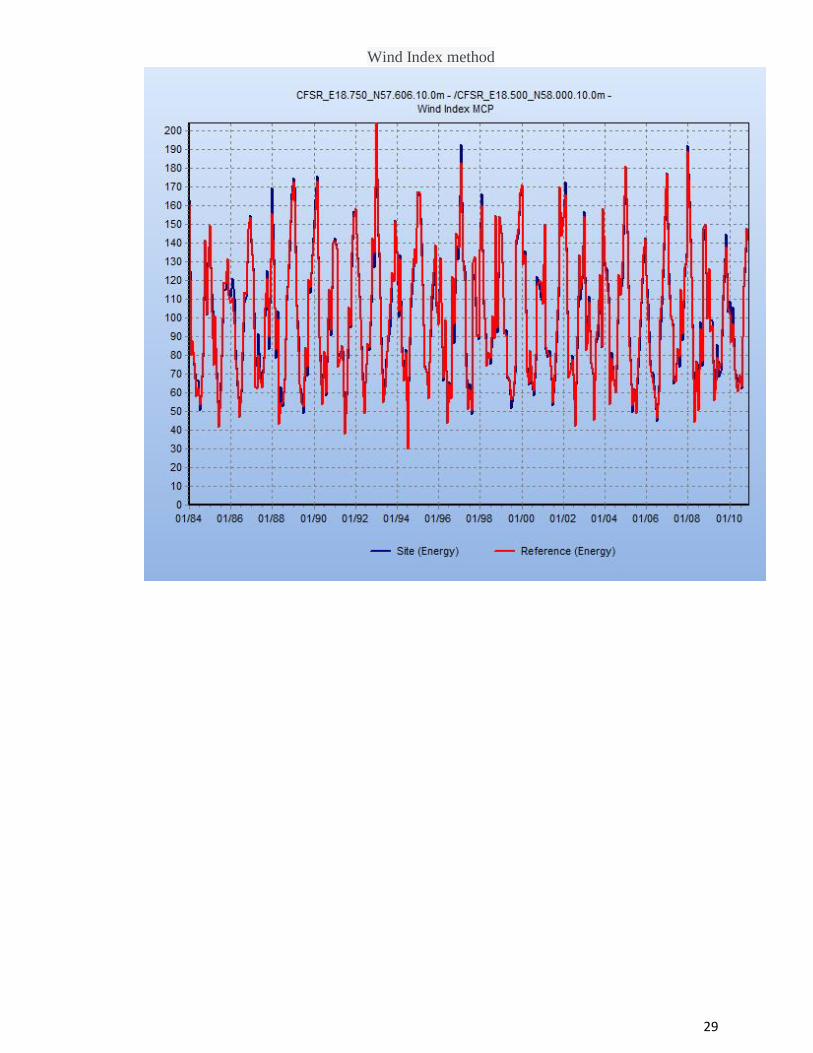
29
Wind Index method
30
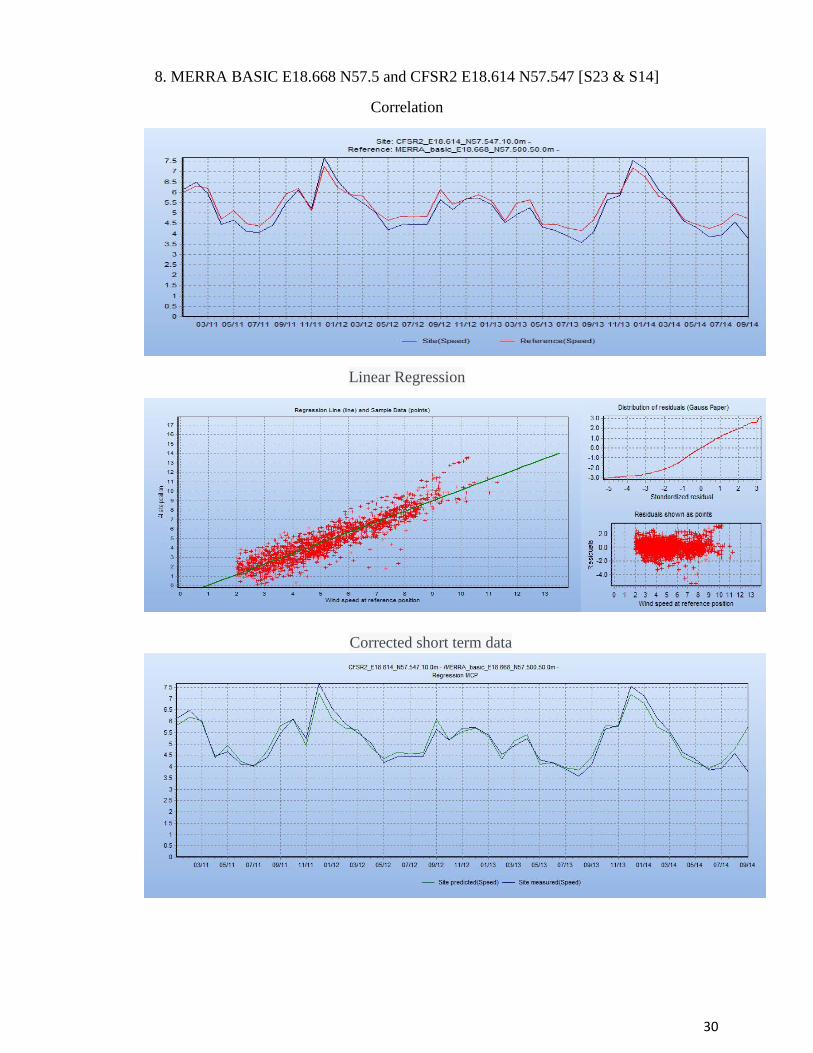
8. MERRA BASIC E18.668 N57.5 and CFSR2 E18.614 N57.547 [S23 & S14]
Correlation
Linear Regression
Corrected short term data

31
Wind Index method
32
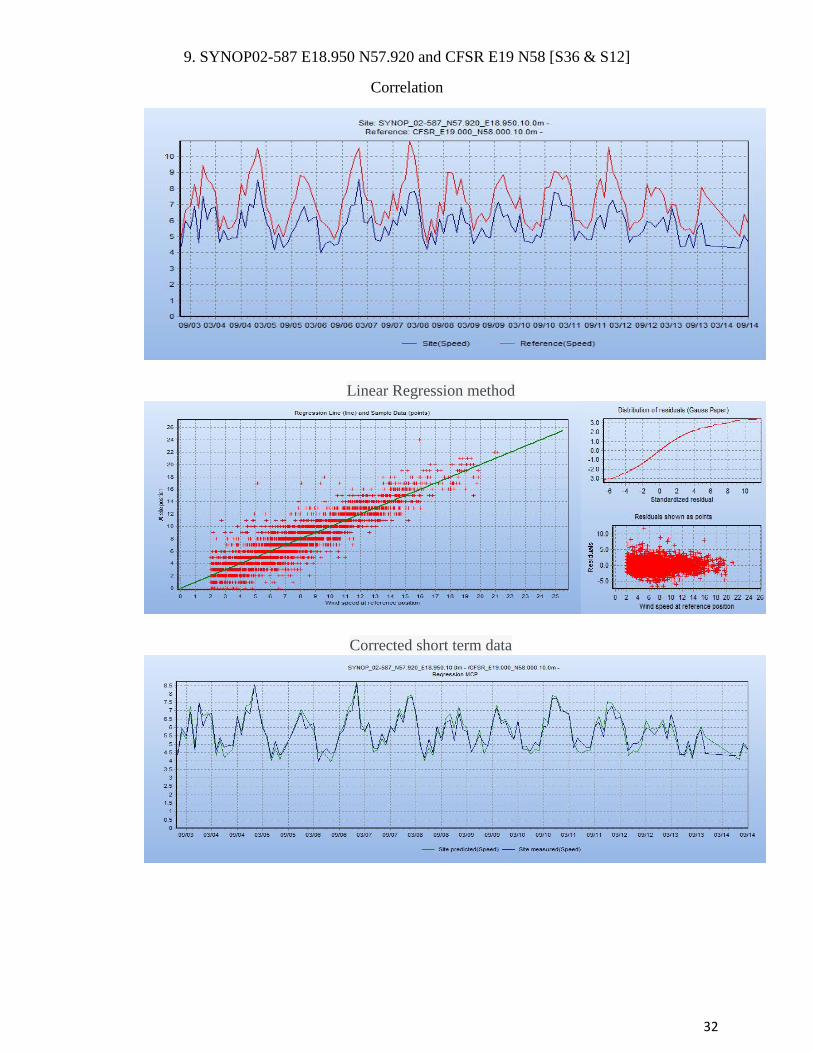
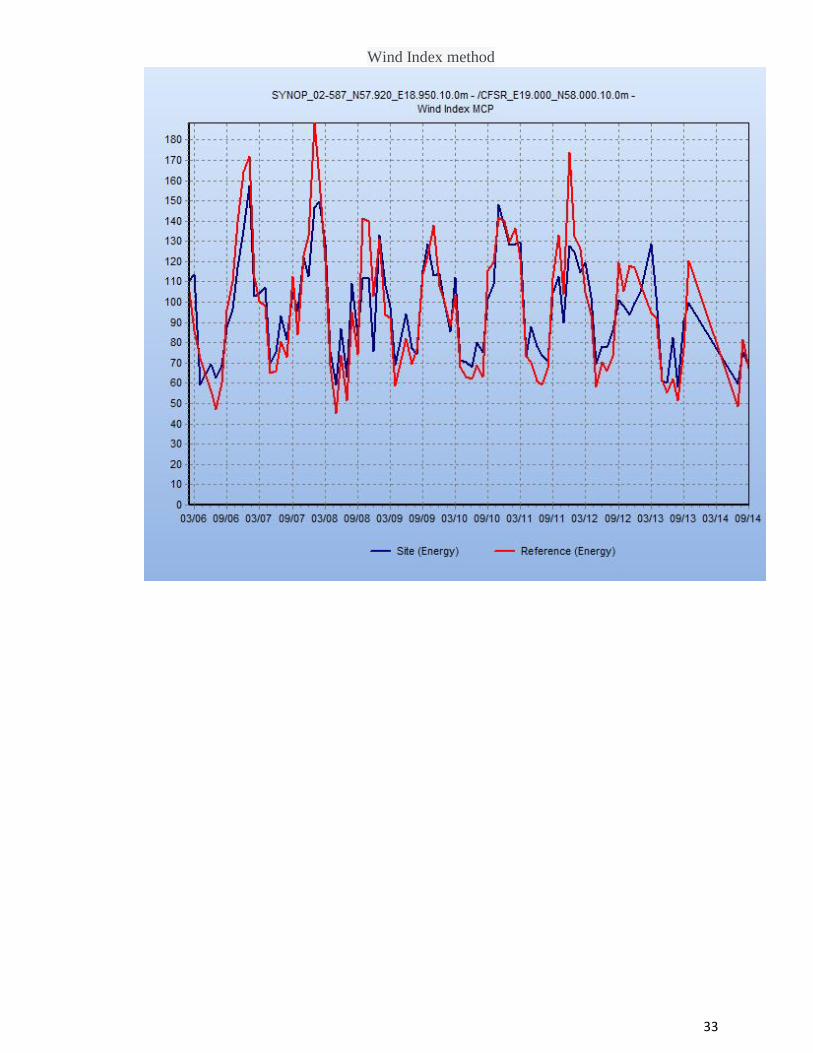
9. SYNOP02-587 E18.950 N57.920 and CFSR E19 N58 [S36 & S12]
Correlation
Linear Regression method
Corrected short term data
33
Wind Index method
34
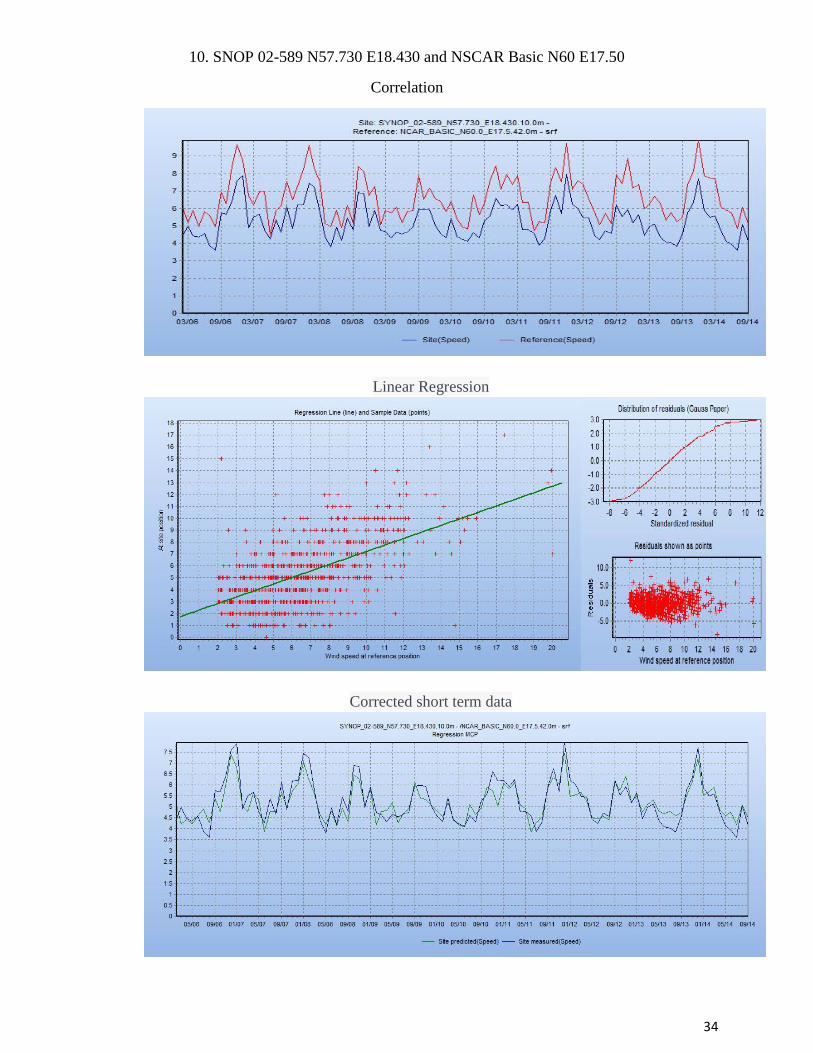
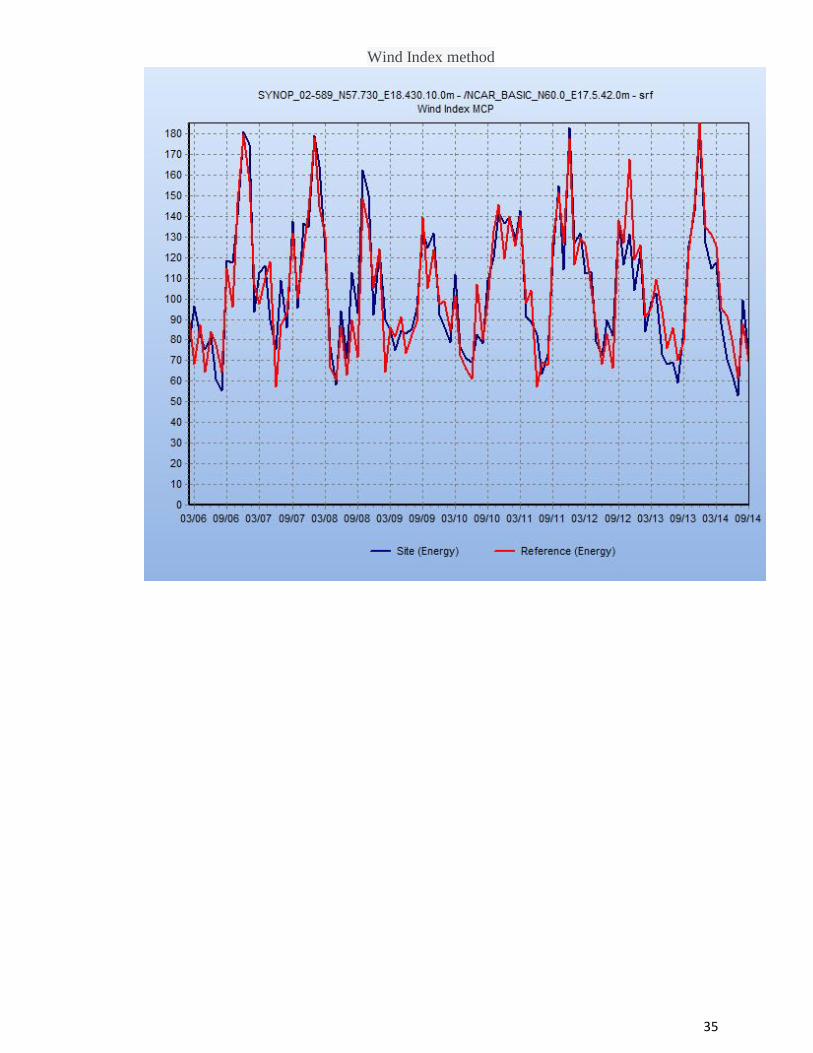
10. SNOP 02-589 N57.730 E18.430 and NSCAR Basic N60 E17.50
Correlation
Linear Regression
Corrected short term data
35
Wind Index method
36
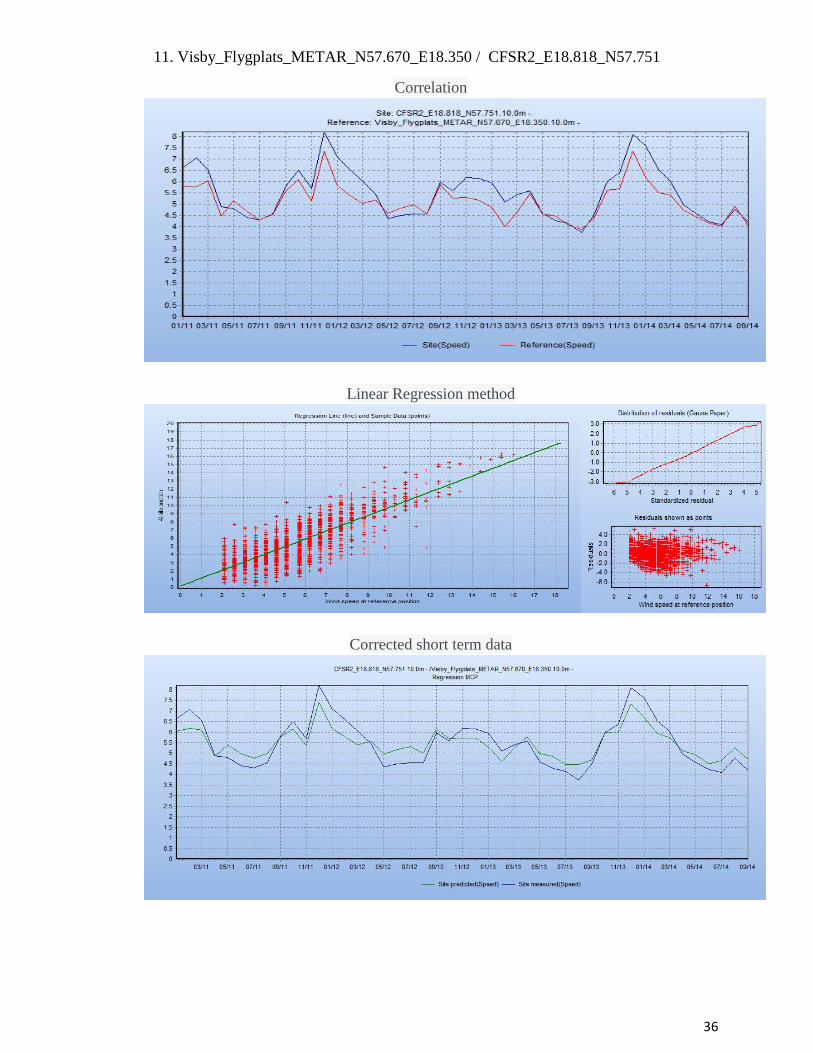
11. Visby_Flygplats_METAR_N57.670_E18.350 / CFSR2_E18.818_N57.751
Correlation
Linear Regression method
Corrected short term data
37
Wind Index Method