site inspection granite creek mines wallowa-whitman ... · list of acronyms ... oar oregon...
TRANSCRIPT
Site Inspection Granite Creek Mines
Wallowa-Whitman National Forest, Oregon
Prepared for
U.S. Department of Agriculture−Forest Service Wallowa-Whitman National Forest
Baker City, Oregon 97814
Prepared by
EA Engineering, Science, and Technology, Inc. 12011 Bellevue-Redmond Road, Suite 200
Bellevue, Washington 98005
January 2004 FINAL
Project No. 13890.13

EA Engineering, Science, and Technology Page ii
CONTENTS
Page
LIST OF FIGURES, TABLES, AND PLATES .......................................................................................iv LIST OF ACRONYMS ............................................................................................................................v EXECUTIVE SUMMARY ......................................................................................................................vii 1. INTRODUCTION ............................................................................................................................1 2. SITE DESCRIPTION, OPERATIONAL HISTORY, AND WASTE
CHARACTERISTICS ......................................................................................................................2 2.1 Description and Location .........................................................................................................2 2.2 Operational History and Waste Characteristics........................................................................5 2.3 Previous Investigations.............................................................................................................6 3. PATHWAY AND ENVIRONMENTAL HAZARD ASSESSMENT ..............................................7 3.1. Groundwater Pathway ...............................................................................................................7 3.1.1 Geology ........................................................................................................................7 3.1.2 Hydrogeology...............................................................................................................8 3.1.3 Groundwater Targets ....................................................................................................8
3.1.4 Groundwater Pathway Summary..................................................................................8
3.2 Surface Water Pathway .............................................................................................................8
3.2.1 Hydrologic Setting........................................................................................................8 3.2.2 Surface Water Targets ................................................................................................10 3.2.3 Stream/Surface Water Sampling Locations................................................................12 3.2.4 Aquatic Survey Results ..............................................................................................12 3.2.5 Analytical Results.......................................................................................................14 3.2.6 Surface Water Pathway Summary ..............................................................................18
3.3 Soil Exposure Pathway............................................................................................................19
3.3.1 Targets ........................................................................................................................19 3.3.2 Plant and Wildlife Surveys .........................................................................................20 3.3.3 Soil/Waste Rock and Plant Tissue Sample Locations ................................................21 3.3.4 Plant Tissue Collection...............................................................................................21 3.3.5 Analytical Results.......................................................................................................22 3.3.6 Soil Exposure Pathway Summary ..............................................................................25
EA Engineering, Science, and Technology Page iii
3.4 Air Pathway .............................................................................................................................26 3.4.1 Targets ........................................................................................................................26 3.4.2 Air Pathway Summary................................................................................................26
4. SUMMARY AND CONCLUSIONS ..............................................................................................27 5. REFERENCES ................................................................................................................................29 APPENDIX A: DEVIATIONS FROM THE PROJECT PLANS APPENDIX B: SITE PHOTOGRAPHS APPENDIX C: GENERAL INFORMATION FORM APPENDIX D: COPIES OF SUPPORTING INFORMATION APPENDIX E: AQUATIC AND TERRESTRIAL SPECIES TABLES APPENDIX F: DETAILED WETLANDS DESCRIPTION APPENDIX G: AQUATIC SURVEY RESULTS SUMMARY TABLES APPENDIX H: WASTE PILE CALCULATIONS APPENDIX I: SOIL SAMPLE DESCRIPTIONS APPENDIX J: LABORATORY ANALYTICAL REPORTS

EA Engineering, Science, and Technology Page iv
LIST OF FIGURES
Number Title
1a Upper Monumental Mine site map. 1b Lower Monumental Mine site map. 2 Cap Martin Mine site map. 3 Sheridan Mine site map. 4 Tillicum Mine site map. 5 Central Mine site map.
LIST OF TABLES
Number Title
1 Granite Creek Mines surface water analytical results. 2 Granite Creek Mines pore water analytical results.
3 Granite Creek Mines sediment analytical results. 4 Granite Creek Mines surface and subsurface soil analytical results. 5 Granite Creek Mines Plant Tissue Analytical Results.
LIST OF PLATES
Number Title
1 Site location with 1- and 4-mi radii. 2 Site location and 15 mi downstream reach.
EA Engineering, Science, and Technology Page v
LIST OF ACRONYMS ABA Acid Base Accounting AMD Acid mine drainage APA Abbreviated Preliminary Assessment bgs Below ground surface CERCLA Comprehensive Environmental Response, Compensation, and Liability Act EA EA Engineering, Science, and Technology, Inc. EE/CA Engineering Evaluation/Cost Analysis EIS Environmental Impact Statement ER-L Effects Range-Low ER-M Effects Range-Medium ft/s Feet per second NF National Forest NOAA National Oceanic and Atmospheric Administration NVCS National Vegetation Classification Standards NWI National Wetlands Inventory OAR Oregon Administrative Rules ODEQ Oregon Department of Environmental Quality ODFW Oregon Department of Fish and Wildlife ONHIC Oregon Natural Heritage Information Center OSC On-Scene Coordinator OWRD Oregon Water Resources Department database PEL Probable Effects Level PRG Preliminary Remediation Goal SARA Superfund Amendments and Reauthorization Act SI Site Inspection SOC Species of Concern SPLP Synthetic Precipitation Leaching Procedure T&E Threatened and Endangered TAL Target Analyte List TDL Target distance limit TDS Total dissolved solids TEL Threshold Effects Level TMS Timed Meander Search TOC Total Organic Carbon TSS Total suspended solids

EA Engineering, Science, and Technology Page vi
USEPA U.S. Environmental Protection Agency USGS U.S. Geological Survey XRF X-Ray Fluorescence
Yds3 cubic yards
EA Engineering, Science, and Technology Page vii
EXECUTIVE SUMMARY
A Site Inspection (SI) was performed at 5 mine sites located in the Wallowa-Whitman National Forest (NF), near Granite, Oregon. The mine sites are Monumental, Cap Martin, Sheridan, Tillicum, and Central. The SI was performed to determine if wastes at the sites pose an immediate or potential threat to human health and the environment, and to collect information to support a decision regarding the need for further action. The abandoned mine sites are located within 2 mi of each other in the upper portion of the Granite Creek watershed in Grant County. Four of the mine sites are located adjacent to the creek and one, Monumental Mine, is located near a tributary that forms part of the headwaters of Granite Creek. Monumental Mine is the largest of the 5 mines sites and contains the remnants of a former mill. Tasks performed during the SI included background research and file review, onsite and offsite reconnaissance, and collection and analysis of soil, waste rock material, surface water, pore water, sediment, plant tissue, and benthic macroinvertebrate samples. Field activities were performed during July 2003. Results of the SI indicated the following:
• The analytical results indicate that metals from the sites are not notably impacting surface water, pore water, or sediments in Granite Creek in the area of the sites. Although there were a number of metals that were detected above the screening criteria, none were notably above upstream reference sample concentrations.
• A number of metals were detected at levels above the comparison criteria in surface water
samples collected from the seeps and upper settling pond at the Monumental Mine. According to the analytical results, these metals are not impacting surface water in Granite Creek.
• There does not appear to be significant benthic habitat impairment or decreased benthic
macroinvertebrate diversity and abundance along Granite Creek within the project area. • Numerous metals were detected at levels above applicable screening criteria in surface and
subsurface soil and waste material at the sites; many of these metals also exceeded the concentrations detected in background soil samples.
• Bull trout (Salvelinus confluents) were observed in small numbers throughout the study area.
Bull trout are listed as threatened under the Endangered Species Act (ESA) and are listed as critical by the state of Oregon. Two small Oncorhychus spp., either west slope cutthroat trout (Oncorhynchus clarki lewisi) or redband trout (O. mykiss gardneri), were also observed at locations along Granite Creek. Both species are federally listed as Species of Concern (SOC) and identified as vulnerable by the Oregon Fish and Wildlife Commission.
Based on the elevated concentrations of metals detected in onsite soil and waste rock samples at all 5 mine sites, as well as onsite surface water samples collected at the Monumental Mine, EA recommends performance of an Engineering Evaluation/Cost Analysis (EE/CA) at the Granite Creek sites. As part of the EE/CA, a risk assessment should be performed to assess the human and ecological impacts, establish site removal cleanup standards, and evaluate remediation technologies.

EA Engineering, Science, and Technology Page 1 of 31
1. INTRODUCTION EA Engineering, Science, and Technology, Inc. (EA) performed a site inspection (SI) for the U.S. Department of Agriculture, Forest Service (Forest Service) at the Granite Creek Mine sites, located in the Wallowa-Whitman NF near Granite, Oregon. The work was performed under Contract Number 10181-1-D010, Delivery Order R6-14-03-16. The SI was performed in general accordance with U.S. Environmental Protection Agency (USEPA) guidance for performing Site Inspections under the Comprehensive Environmental Response, Compensation and Liability Act (CERCLA). The objectives of the SI were to (1) assess the immediate or potential threat that wastes at the site pose to human health and the environment, and (2) to collect information to support a decision regarding the need for further action under CERCLA and the Superfund Amendments and Reauthorization Act (SARA). Potential contaminant sources identified at the abandoned Granite Creek Mine sites included waste rock and discharges from mine adits. Tasks performed during the SI included background research and file review, onsite and offsite reconnaissance, and collection and analysis of soil, waste, surface water, pore water, sediment, plant tissue, and benthic macroinvertebrate samples. Fieldwork for the SI was performed from 8 to 16 July 2003. The SI was performed in accordance with the project plans including the Work Plan (EA 2003a) and Sampling and Analysis Plan (EA 2003b), Health and Safety Plan (EA 2003c), and Standard Operating Procedures (EA 2003d). A number of modifications to the sampling locations and techniques were made in the field, based on site observations and field conditions, and with concurrence of the Forest Service On-Scene Coordinator (OSC). These modifications are documented in Appendix A. This report is organized into the following sections:
• Descriptions of the sites, their operational history, wastes generated and previous investigations are provided in Section 2.
• The results of the SI, along with discussions of the groundwater, surface water, soil, and air
exposure pathways, are provided in Section 3. • A summary and conclusions are provided in Section 4. • References are provided in Section 5. • The appendixes include the following: a list of deviations from the project plans (Appendix A),
site photographs (Appendix B), a General Information Form (Appendix C), copies of supporting information (Appendix D), aquatic and terrestrial species tables (Appendix E), a detailed wetlands description (Appendix F), aquatic survey results summary tables (Appendix G), waste pile calculations (Appendix H), soil sample descriptions (Appendix I), and laboratory analytical reports (Appendix J).

EA Engineering, Science, and Technology Page 2 of 31
2. SITE DESCRIPTION, OPERATIONAL HISTORY, AND WASTE CHARACTERISTICS 2.1 DESCRIPTION AND LOCATION The locations of the 5 Granite Creek Mines are shown on Plate 1. All of the sites are within 5-8 mi (areal distance) from the town of Granite, in Grant County, Oregon. The sites, which are within the Granite Mining District, are accessed using Forest Service (FS) Road 7345. Waste pile volumes were calculated by Anderson Perry and Associates, Inc., La Grande, Oregon. Refer to Appendix H for details. Monumental Mine Monumental Mine is situated on moderate to steep hillsides at the headwaters of Granite Creek. The site location is included on the Mt. Ireland Quadrangle U.S. Geological Survey (USGS) 7.5-minute topographic map. The location description for the site is:
• Latitude 44° 51’ 37”N • Longitude 118° 21’ 04”W • Sections 18 and 19, Township 8 South, Range 36 East.
The site is currently inactive and covers approximately 10 acres. Maps showing existing site features are presented as Figures 1a and 1b. The site generally consists of the following:
• An upper adit with a collapsed portal and no water drainage (Figure 1a). • A second, lower adit that is partially stabilized and does have water drainage. The water drains
through a constructed ditch to the lower settling pond (Figure 1b). • A shaft located approximately 200 ft uphill of the upper adit. • Three settling ponds in series. All 3 ponds contained water during the SI field investigation.
The upper and middle ponds have largely been filled with depositional sediment and have become more marsh-like rather than ponded. The upper pond is the largest (approximately 100 by 60 ft) and at the time of the field investigation was dry at the upper end and wet at the lower. The middle pond is approximately 30 by 15 ft and had both an inlet from the upper pond and an outlet. Water from this outlet flowed to the most downgradient settling pond located near the lower adit. The most downgradient pond is approximately 50 by 25 ft and the water in the pond was approximately 6 in. deep at the time of the field investigation. This pond contained flow from both the upper settling ponds and the lower adit. No outlet from this pond was observed during the SI field investigation.
• One relatively small and 2 large waste rock piles. The upper pile is located below the upper adit
and is approximately 5,200 yds3 in size. The lower pile is located below the lower adit and is approximately 7,000 yds3 in size. The small pile (approximately 40 yds3) is located near the shaft in the upper portion of the site.
• An old mill site containing wood debris on moderate to steep slopes in the vicinity of the upper
adit. The mill site consists of the remains of a 20-stamp mill and a floater. The remains of a crusher were also identified near the lower adit.

EA Engineering, Science, and Technology Page 3 of 31
A small stream, referred to in this report as an unnamed tributary, forms in a marshy area below the lower waste pile. The unnamed tributary flows into Granite Creek as part of the headwaters; its confluence is located between the Sheridan and Cap Martin mines (Figure 3). Cap Martin Mine Cap Martin Mine is located on both sides of Granite Creek near the creek’s headwaters. The site is included on the Mt. Ireland Quadrangle USGS 7.5-minute topographic map. The location description for the site is:
• Latitude 44° 51’ 24”N • Longitude 118° 22’ 11”W • Section 24, Township 8 South, Range 35.5 East.
The site is currently inactive and covers an area of approximately 8 acres on moderately steep hillsides. A map showing existing site features is presented as Figure 2. The site generally consists of the following:
• Two adits, both collapsed at the portal. One adit is located on the south side of Granite Creek and the other is located on the north side of the creek. Water was not draining from either adit during the field investigation. A third adit reportedly exists; however, it could not be located during the field investigation.
• Three waste rock piles. The largest waste pile (approximately 200 yds3) is located in the southern
area of the site near the foot path. The third adit (unidentified) is expected to be located in this general area. An outwash fan from the waste rock pile emanates onto the flat area south of the creek. The second waste pile (approximately 130 yds3) is situated below the northern collapsed adit and the third waste pile (approximately 10 yds3) is situated near the collapsed adit located in the southwest area of the site.
Sheridan Mine Sheridan Mine is located on the south side of Granite Creek and the east bank of an unnamed tributary of Granite Creek. The mine is located approximately 0.25 mi downstream of the Cap Martin Mine. The site is included on the Mt. Ireland Quadrangle USGS 7.5-minute topographic map. The location description for the site is:
• Latitude 44° 51’ 25”N • Longitude 118° 22’ 30”W • Section 24, Township 8 South, Range 35.5 East.
The site is currently inactive and covers approximately 3 acres on moderately steep hillsides. A map showing existing site features is presented as Figure 3. The site generally consists of the following:
• One adit collapsed at the portal, with a seep emanating from it, and a second possible adit. No staining from acid mine drainage (AMD) was observed at either location. Discharge from the seep forms a marshy area uphill from the creek in a flat area.
EA Engineering, Science, and Technology Page 4 of 31
• One waste rock pile located downgradient of the identified collapsed adit. The dimensions of this pile has been calculated to contain approximately 125 yds3 of material.
Tillicum Mine Tillicum Mine is located on the north bank of Granite Creek. Approximately 0.25 mi downstream of Sheridan Mine. The site is included on the Granite Quadrangle USGS 7.5-minute topographic map. The location description for the site is:
• Latitude 44° 51’ 23”N • Longitude 118° 22’ 55”W • Section 23, Township 8 South, Range 35.5 East.
The site is currently inactive and covers approximately 3 acres on moderately steep hillsides. A map showing existing site features is presented as Figure 4. The site generally consists of the following:
• There are 2 primary adits, although it was reported that several more small adits and pits exist at the site (Brooks et al. 1982). The 2 primary adits were observed during the SI field investigation. These consist of an upper and a lower, which are approximately 75 ft apart vertically. Both adits are collapsed at the portal; no discharges were observed during the field investigation.
• Two small waste rock piles. The pile near the upper adit is approximately 50 yds3 in size, and the
pile below the lower adit is approximately 250 yds3. There is also some waste pile material east and west of the excavated area near the lower adit; the volume of this material was not determined.
Central Mine Central Mine is located on the north side of Granite Creek, southeast of the intersection of FS Road 73 (Elkhorn Drive Scenic Byway) and FS Road 7345. The site is located approximately 0.6 mi downstream of Tillicum Mine and is included on the Granite Quadrangle USGS 7.5-minute topographic map. The location description for the site is:
• Latitude 44° 51’ 19”N • Longitude 118° 23’ 29”W • Section 23, Township 8 South, Range 35.5 East.
The site is currently inactive and covers approximately 2 acres on moderately steep hillsides. A map showing existing site features is presented as Figure 5. The site generally consists of the following:
• Two adits, both of which are collapsed at the portal. Neither adit had water draining from it during the field investigation. A third adit reportedly exists; however, it could not be located during the field investigation.
• Three small waste rock piles. The smallest waste pile (approximately 20 yds3) is situated below
the upper adit. The second waste pile (approximately 300 yds3) is located below the lower adit at the foot of the slope, and the third waste pile (approximately 50 yds3) is situated on a bench above Granite Creek.

EA Engineering, Science, and Technology Page 5 of 31
• A waste rock berm which runs in an east-west direction along the slope approximately 75-100 ft above the creek (Figure 5). This berm was created as a result of hydraulic mining activities.
2.2 OPERATIONAL HISTORY AND WASTE CHARACTERISTICS Mining in the Granite Creek area began as early as the 1860s and was a significant part of Oregon’s mineral industry prior to World War II. Dredge mining was the primary form of mining in the region until the mineral production that could be achieved using hand-operated equipment began to decline. In the late 1880s, lode mining became the most profitable form of mining because of the advent of large-scale drilling and crushing equipment and chemical extraction methods (to extract the gold from its alloys). In the 1920s, dredging for gold in the rivers again became profitable using large-scale dredging equipment. Numerous dredge tailings piles are still visible along these creeks (USDA 2002). After many of the placer claims were abandoned (no date provided), hundreds of Chinese men, who were brought to Oregon from China by the China Company, leased the land in order to re-work the placer ground. They employed the hydraulic mining method, which involved working the ground using sluices and sorting the tailings by hand (Tabor 1988). Rows of hand-piled rocks still remain along the shoreline and within Granite Creek at many of the mine sites. Monumental Mine A list of known owners and operators of the Monumental Mine and mill site is provided in Appendix D. A brief history of the site follows, based on available references and a site summary provided by the Forest Service office located in Baker City:
• 1870 - The mine was discovered by Harvey Robbins, Isaac Nail, and Isaac Klopp (Tabor 1988), and operated intermittently until 1928.
• 1875 through 1906 - Several new claims were established and several of the original claims were
relocated. A claims map from 1902 indicates there were 11 claims at that time. They were named: Monumental #1, Monumental #2, Monumental #3, Monumental #3 Extension South, Commercial Ledge, S.W.R. Ledge, S.W.R. Ledge Extension, Mill Ledge, Mill Ledge Extension North, North Star, and Colorado. Development consisted of 2 tunnels, 2 shafts, several raises, and a stoop that daylights to the surface near one of the shafts, all totaling approximately 4,000 ft (Visconty 2003).
• 1875 - A ton of the ore, with a value of $1500, was shipped to San Francisco in order to attract
investors (Tabor 1988). With the added capital, a 20-stamp mill was constructed on the site. The Monumental Gold and Silver Mining Co. operated both the mine and the mill in the late 1880’s.
• 1902 - The mine and mill site were included in a report on the Portland Reduction and Mining
Co. The mill at that time included a chlorination plant, but records do not indicate if other mill processes were in use (Visconty 2003). The total output through 1928 has been estimated at $100,000 (Brooks and Ramp 1968).
Cap Martin Mine Very little historical information exists for this site. It is not known exactly what date the mine was established, nor are any production records available. It was discovered by Cap Martin (Tabor 1988) and consisted of 3 adits totaling approximately 300 ft (Ferns et. al. 1982).

EA Engineering, Science, and Technology Page 6 of 31
Sheridan Mine There is very little historical information for this site. It is not currently known when the mine was established or the amount of production that occurred. The amount and type of development is also not clear, though it is known the mine consists of 2 short adits (Ferns et. al. 1982). Tillicum Mine It is not currently known when this site was established. It is known that production was very small, and that development occurred in approximately 400 ft of 5 or more adits, 2 of which were the primary adits (Brooks et. al. 1982). Central Mine Historical information for this mine is limited. It is not known when the mine was established, but production was very small and development consisted of approximately 500 ft in 3 adits (Brooks et. al. 1982). 2.3 PREVIOUS INVESTIGATIONS Very few previous investigative activities have been conducted on these sites. In 2002, the Forest Service conducted an Environmental Impact Statement (EIS) on Granite Area Mining Projects, including the upper Granite Creek watershed. The Columbia River bull trout and Mid-Columbia steelhead, both of which occur in the Granite Creek watershed, are listed as threatened under the Federal Endangered Species Act. In addition, several of the streams within the watershed are on the State of Oregon 303(d) list of impaired waters, as described by the Clean Water Act. Given these facts, an EIS was necessary when the Forest Service proposed to approve Plans of Operation on 16 mining claims located within the watershed (USDA 2002). However, none of these claims was part of the 5 sites investigated as part of this SI. The Forest Service conducted Abbreviated Preliminary Assessments (APAs) on both Monumental and Tillicum Mines in order to determine whether the potential exists for a release of hazardous contaminants to the environment, and to further characterize the sites. Summaries of these APAs are provided below. Monumental Mine The Abbreviated Preliminary Assessment (APA) of Monumental Mine was performed in 2002, and included the use of a Niton 700 series X-Ray Fluorescence (XRF) spectrum analyzer to field analyze samples. Three samples from the waste rock piles and 2 of tailings from the ponds were analyzed. The results indicated that arsenic, lead, and mercury exceeded USEPA Region 9 Preliminary Remediation Goals (PRGs; USFS 2003a). Tillicum Mine The Forest Service also conducted the APA of Tillicum Mine in 2002, and again used an XRF meter to analyze samples collected in the field. One waste rock sample was collected and was found to exceed USEPA Region 9 PRGs for arsenic and lead (USFS 2003b).

EA Engineering, Science, and Technology Page 7 of 31
3. PATHWAY AND ENVIRONMENTAL HAZARD ASSESSMENT 3.1 GROUNDWATER PATHWAY 3.1.1 Geology The Granite Creek Mines occur in the Granite Mining District, within the Elkhorn Mountains area of the Blue Mountains geomorphic province. The lode mines of the Granite District lie along the southwestern edge of the Bald Mountain Batholith, a large granodiorite body with an outcrop area of more than 170 square miles. The principal lode mines occur in a northeast-trending belt of veins and mineralized shear zones about 2 mi wide and 5 mi long (Brooks and Ramp 1968). Within the district, the veins occur primarily in older argillite of the Elkhorn Ridge Argillite. However, of the 5 mines included in this report, 4 (Monumental, Cap Martin, Sheridan, and Tillicum) penetrate the Bald Mountain Batholith and only one (Central) occurs within the Elkhorn Ridge Argillite. The Bald Mountain Batholith is of Lower Cretaceous and Upper Jurassic age. It primarily consists of granodiorite and tonalite, with small amounts of norite and quart monzonite (Ferns et. al. 1982). Dikes and sills of similar compositions occur along the borders of the batholith. Monumental Mine Production at Monumental Mine was from quartz veins within the granodiorite of the Bald Mountain Batholith. According to Brooks and Ramp (1968), 12 narrow veins were explored in the mine, with most of the work done on four. The veins occur at a strike of North to 20o Northeast and a dip of 65o Northwest. Sulfides in the veins include pyrite, arsenopyrite, sphalerite, galena, and tetrahedrite. The ore lenses mined were a maximum of 18 in. wide and stope lengths were less than 100 ft. Approximately 4,000 ft of development took place, reaching a depth of about 700 ft below the outcrop. The gold-to-silver ratio in the ore was reported as 1:20. Cap Martin Mine The Cap Martin Mine penetrates the granodiorite of the Bald Mountain Batholith. Several northeast trending quartz veins with sulfides were accessed via 3 adits (Ferns et. al. 1982). Sheridan Mine The Sheridan Mine penetrates the granodiorite of the Bald Mountain Batholith. According to Ferns et. al. (1982), short adits at the mine accessed quartz veinlets containing pyrite, chalcopyrite, and tetrahedrite. Tillicum Mine The Tillicum Mine penetrated several narrow shear zones with quartz veinlets within the Bald Mountain Batholith. According to Brooks and Ramp (1968), the mine accessed 2 parallel veins 40-50 ft apart, with a strike of 30o Northeast and dip of 50o Southwest. Koch (1959) described the principal mine workings as 2 adits, 50 ft apart vertically, although the report states that there were other small adits and pits. Most of the work appears to have been done on short veins and stringers of less than a foot in thickness (Koch 1959). The ore consisted of quartz-impregnated limonitic gouge (Brooks and Ramp 1968), and the gold occurred primarily as free gold (Brooks et. al. 1982).
EA Engineering, Science, and Technology Page 8 of 31
Central Mine The Central Mine penetrates 2 parallel shear zones 90 ft apart within the “mixed rock terranes” unit of the Elkhorn Ridge Argillite (Brooks et. al. 1982). The Elkhorn Ridge Argillite (Triassic, Permian, and Pennsylvanian) is described as a mainly dark-colored argillite, siliceous argillite and chert, with small amounts of fine-grained felsic tuff, sandstone, and conglomerate. Brooks, et. al. (1982) described the mixed rock terranes as consisting of ultramafic and mafic rocks in structurally chaotic juxtaposition with a wide variety of other rocks, including diorite, quartz diorite, basalt, argillite, chert, volcaniclastic rocks, and limestone, all metamorphosed to the greenshist facies. 3.1.2 Hydrogeology No discussion or documentation of groundwater conditions at the site or in the site vicinity has been found. Shallow groundwater likely does not form a laterally continuous aquifer in the study area due to the presence of igneous intrusions and shallow bedrock. Localized shear zones and faults may also control groundwater flow to some extent. Shallow groundwater in the site area likely flows into Granite Creek. No groundwater samples were collected during the SI field investigation. However, water samples were collected from a groundwater spring and a settling pond which collects adit discharge from the lower adit at the Monumental Mine site. Because these discharges impact local surface water quality, analytical results for these samples are discussed with the surface water samples in Section 3.2.5. 3.1.3 Groundwater Targets The target distance for groundwater has been defined as a 4-mi radius from the sites (Plate 1). Potential receptors include drinking water wells and wellhead protection areas. Based on a search of the Oregon Water Resources Department (OWRD) database for water wells, one drinking water well is located within a 4-mi radius of the sites (OWRD 2003). The town of Granite obtains its drinking water from an improved spring in the area (USEPA 1997a). There are no wellhead protection areas within a 4-mi radius of the site. The groundwater well is located approximately 4 mi southwest of the sites in the town of Granite in Township 9 South, Range 35.3 East, Section 4. Completed in 1994 at a total depth of 340 ft, it is used for domestic drinking water purposes. The static water level was reported at 22 ft bgs. 3.1.4 Groundwater Pathway Summary Based on the available information, no release of hazardous substances from any of the mine sites to local groundwater systems is suspected. The closest drinking water well is approximately 4 mi from the nearest mine and is several hundred feet deep; no impacts from the mines would be expected. Therefore, the groundwater pathway appears to be incomplete. Groundwater that discharges from the adits may impact nearby surface water bodies; these sources are discussed in the following sections. 3.2 SURFACE WATER PATHWAY 3.2.1 Hydrologic Setting All 5 mine sites are situated along the upper reaches of Granite Creek, which empties into the North Fork John Day River approximately 13 mi downstream of Central Mine, the site located the furthest downstream.

EA Engineering, Science, and Technology Page 9 of 31
The Granite Creek watershed encompasses approximately 120-150 square miles (USEPA 1997a), with a portion of the headwaters originating at the Monumental Mine site. There are no stream gauging stations located in the study area (USGS 2003). Most of the total water yield in the area occurs as snowmelt in May and June, and, except for periodic and localized thunderstorms, rainfall is generally sparse from July to September. Therefore, summer base flows are relatively low compared to the spring snowmelt period. The average annual precipitation ranges from about 10 in. in the lower valleys to 45 in. in the mountains (Brooks et. al. 1968). In the study area, annual rainfall is roughly 30 in., about half of which falls as snow (Koch 1959). The hydrologic functioning of Granite Creek and many of its tributaries has been highly impacted by historical placer mining, including both dredge and hydraulic mining. This in turn has significantly altered stream channel morphology and hence floodplain functionality (USDA 2002). The following observations were made during the SI field investigation regarding the hydrology near the mine sites:
• Monumental Mine. Flow from the upper spring drains under FS Road 7345, through the upper
and middle settling ponds and eventually collects in the downstream pond, where flow from the lower adit also collects (Figures 1a and 1b). No outlet from the lower pond was observed during the field investigation. An unnamed tributary, which is part of the headwaters of the Granite Creek drainage, forms in a marshy area located downhill from the lower adit and waste pile. The tributary flows into Granite Creek between the Cap Martin and Sheridan mines (Figure 3).
• Cap Martin Mine. An unnamed stream flows through a wide ravine located in the northern
portion of the site. The creek flows from under the access road located north and upgradient of the site and eventually forms a marshy area near the collapsed cabin (Figure 2). The ravine has been altered significantly by placer mining, as evidenced by boulder piles located all the way up to the access road. There is also a large amount of downed timber in this area. Evidence of placer mining (i.e. piled stones) was also observed along Granite Creek. A small tributary, as well as flow from a spring, form part of the headwaters of Granite Creek immediately upstream of the site.
• Sheridan Mine. Granite Creek near the mine site has been significantly altered by placer
mining, as evidenced by large boulder piles and stone channels (Figure 3). Two tributaries enter Granite Creek in the area of the mine: one which flows from Monumental Mine on the north side of the creek and the other from the south side of the creek. There is also a seep near the collapsed portal that forms a marshy area upgradient of the waste pile. No staining or mineralization was observed in this area.
• Tillicum Mine. No overland flow was observed at the mine site during the field investigation.
Two erosion channels (dry during the field investigation) were observed coming from the collapsed adits and lower waste pile (Figure 4). No staining was observed along the channels. Water likely runs through these channels over the waste material during periods of high rainfall and snowmelt.
• Central Mine. No overland flow was observed at the mine site during the field investigation.
A runoff channel (dry during the field investigation) was observed coming from the waste pile near the lower adit (Figure 5). Water likely runs through this channel into Granite Creek during periods of high rainfall and snowmelt. A waste rock berm, the result of hydraulic mining activities, was observed along the slope above the creek. Immediately downstream of the mine, Granite Creek flows under the Scenic Highway through a large culvert.

EA Engineering, Science, and Technology Page 10 of 31
3.2.2 Surface Water Targets A target distance of 15 mi downstream has been identified for the surface water pathway. The surface water drainage route is shown on Plate 2. Potential targets include surface water intakes supplying drinking water, fisheries, sensitive environments (e.g., wetlands), and aquatic species of concern. The 15-mi target distance limit (TDL) for the mines extends downstream from the Central Mine 12.9 mi along Granite Creek to the confluence with the North Fork John Day River and then the remaining 2.1 mi on the river. The last approximately 4 mi of the TDL are within the North Fork John Day Wilderness Area; this includes reaches of both Granite Creek and the North Fork John Day River. The 2.1 mi of the TDL on the North Fork John Day River are also a part of the North Fork John Day Wild and Scenic River corridor. Because the TDL extends into a Designated Federal Wilderness Area, there appears to be few human targets. There are no designated, developed campsites within the TDL; however, there are numerous dispersed campsites located along open roads outside the Wilderness Area as well as primitive campsites inside the Wilderness Area. A dispersed campsite is one developed by the user, is typically located next to an open road, and often consists of a parking spot and a fire ring. Campers using either type of campsite, along with the occasional miner working a claim, may withdraw drinking water on an individual basis from one of the streams within the TDL. With the exception of tribal fishing, commercial fishing within the TDL is not allowed. In addition, the Oregon Department of Fish and Wildlife (ODFW) has prohibited all recreational fishing in Granite Creek and its tributaries since 1997 in order to protect Chinook salmon (USEPA 1997a). Sensitive Environments The sensitive environments present within the 15-mi TDL include:
• North Fork John Day Wilderness Area • North Fork John Day Wild and Scenic River • Migratory pathways and spawning areas critical to the maintenance of anadromous fish species • Habitat potentially used by federal-designated threatened species • Wetlands as defined by 40 Code of Federal Regulations (CFR) 230.3.
Prior to conducting the fieldwork, a list of Threatened and Endangered (T&E) aquatic wildlife species and SOC potentially occurring in Grant County was generated with data obtained from the Oregon Natural Heritage Program (Appendix E, Table E-1, ONHP 2001). In addition, the Oregon Natural Heritage Information Center (ONHIC) was contacted regarding any recorded observations of rare or T&E species within a 2-mi radius of the sites (the search range available [OHNIC 2003]). The aquatic species observed near the Granite Creek Mine sites during the field investigation are included in Table E-2 (Appendix E). The ONHIC reported the Columbia spotted frog (Rana luteiventris), a state-sensitive species (undetermined status), was observed within a 2-mi radius of the site (on the Boulder Creek drainage, approximately 1 mi upstream from the town of Granite). None were observed during SI field activities. In addition, the ONHIC noted 2 Federal-listed threatened aquatic species within a 2-mi radius of the sites. These are the bull trout (Salvelinus confluents) and steelhead (Oncorhynchus mykiss), which have been documented as being present in the North Fork John Day River and its tributaries. These species are
EA Engineering, Science, and Technology Page 11 of 31
designated by the State of Oregon as sensitive-critical (bulltrout) and sensitive-vulnerable (steelhead). The westslope cutthroat trout (Oncorhynchus clarki lewisi), designated as a federal SOC and a state sensitive-vulnerable species, was also reported as observed within 2 mi of the sites by the ONHIC. During seining activities in Granite Creek, bull trout (Salvelinus confluents) were observed at 5 stations. In addition, Oncorhynchus spp., which could have been either west slope cutthroat trout (Oncorhynchus clarki lewisi) or redband trout (O. mykiss gairdneri; they were too small to positively identify in the field), were observed at 2 stations. The fish species observed during the SI field investigation are discussed further in Section 3.2.4. Birds and Waterfowl Species of birds that are associated with streams and riparian areas are of concern due to their potential exposure to contaminants released from the mines. During the SI field investigation, no waterfowl were observed near the sites. The only bird species observed along Granite Creek were American robin (Turdus migratorius), northern flicker (Colaptes auratus), MacGillivray’s warbler (Oporornis tolmiei), and song sparrow (Melospiza melodia). Given the eating and foraging habits of these species they are likely common in both riparian and non-riparian areas. All the other bird species observed were in the forested hillsides surrounding the sites. Bird species observed during the field investigation are listed on Table E-2 (Appendix E). Other notable species observed near the sites include:
• American kestrel (Falco sparverius) • Olive-sided flycatcher (Contopus cooperi) • Hairy woodpecker (Picoides villosus) • Pine siskin (Carduelis pinus).
The olive-sided flycatcher (Contopus cooperi) is a federal SOC and a state sensitive-vulnerable species. During the field investigation it was heard calling in the area of the mine sites several times, but was never seen. These birds are associated with the tops of large snags from which they catch insects and build their nests. Exposure in these birds would be restricted to the ingestion of flying insects. Because it was past nesting season at the time of the field investigation, no such activity was observed. The time of the year and weather conditions also reduced the amount of songbird activity. All of the species observed could potentially be exposed to contamination from the mines through a variety of means, such as dermal contact with contaminated waste rock or tailings or the ingestion of contaminated water, sediment, or prey. Wetlands Assessment The National Wetlands Inventory (NWI) Database 7.5-minute topographic maps (USFWS 1994) were examined and compared to wetlands observed in the project area. For a detailed description of the wetlands, refer to Appendix F. The entire upper reach of Granite Creek is classified on the NWI map as Riverine, Upper Perennial, Unconsolidated Bottom, Permanently Flooded (R3UBH). This classification does not generally meet the federal definition of a wetland as stated in 40 CFR 230.3. Mapped units that do correspond to the federal wetland definition are located along the 15-mi TDL and consist mainly of ponds adjacent to Granite Creek, near the town of Granite. It is estimated that these are
EA Engineering, Science, and Technology Page 12 of 31
located along approximately 1.5 mi of the 15-mi TDL. These units were likely created through historical placer mining activities, and are mapped by the NWI as:
PSSC – Palustrine Scrub-Shrub Vegetation, Seasonally Flooded PSSCx – Palustrine Scrub-Shrub Vegetation, Seasonally Flooded, excavated PEMF – Palustrine Emergent Vegetation, Semi-permanently Flooded PEMFx – Palustrine Emergent Vegetation, Semi-permanently Flooded, excavated.
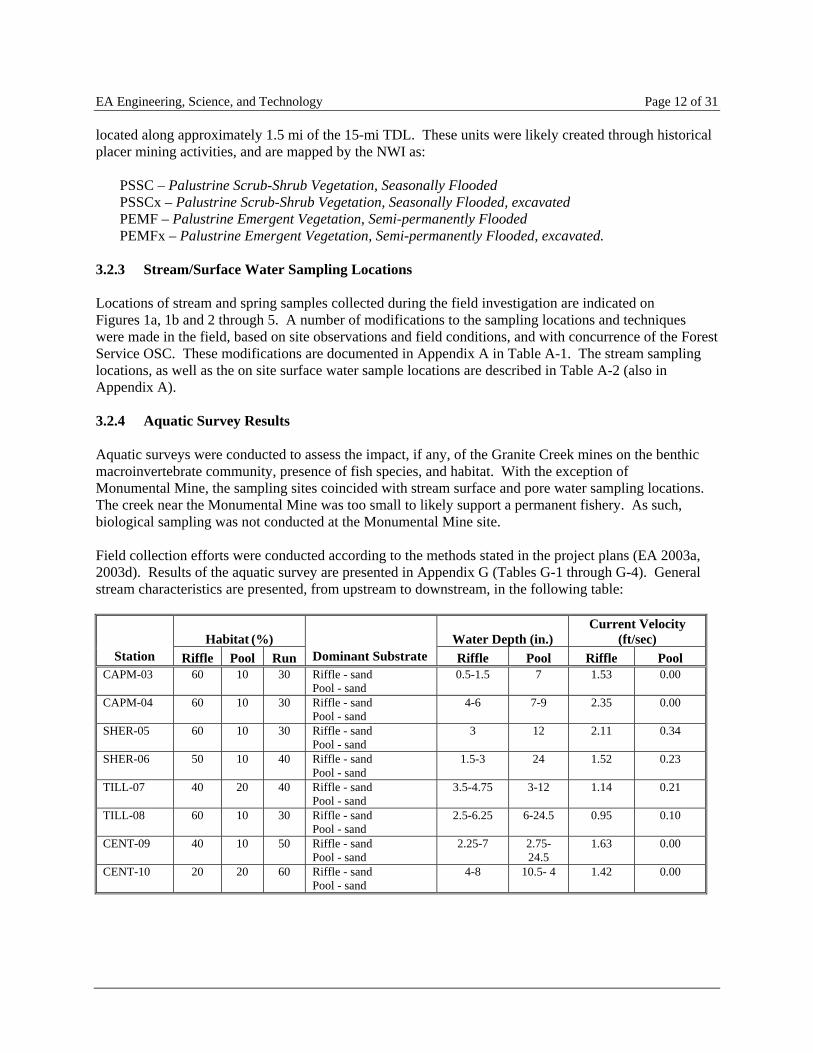
3.2.3 Stream/Surface Water Sampling Locations Locations of stream and spring samples collected during the field investigation are indicated on Figures 1a, 1b and 2 through 5. A number of modifications to the sampling locations and techniques were made in the field, based on site observations and field conditions, and with concurrence of the Forest Service OSC. These modifications are documented in Appendix A in Table A-1. The stream sampling locations, as well as the on site surface water sample locations are described in Table A-2 (also in Appendix A). 3.2.4 Aquatic Survey Results Aquatic surveys were conducted to assess the impact, if any, of the Granite Creek mines on the benthic macroinvertebrate community, presence of fish species, and habitat. With the exception of Monumental Mine, the sampling sites coincided with stream surface and pore water sampling locations. The creek near the Monumental Mine was too small to likely support a permanent fishery. As such, biological sampling was not conducted at the Monumental Mine site. Field collection efforts were conducted according to the methods stated in the project plans (EA 2003a, 2003d). Results of the aquatic survey are presented in Appendix G (Tables G-1 through G-4). General stream characteristics are presented, from upstream to downstream, in the following table:
Habitat (%) Water Depth (in.) Current Velocity
(ft/sec) Station Riffle Pool Run Dominant Substrate Riffle Pool Riffle Pool
CAPM-03 60 10 30 Riffle - sand Pool - sand
0.5-1.5 7 1.53 0.00
CAPM-04 60 10 30 Riffle - sand Pool - sand
4-6 7-9 2.35 0.00
SHER-05 60 10 30 Riffle - sand Pool - sand
3 12 2.11 0.34
SHER-06 50 10 40 Riffle - sand Pool - sand
1.5-3 24 1.52 0.23
TILL-07 40 20 40 Riffle - sand Pool - sand
3.5-4.75 3-12 1.14 0.21
TILL-08 60 10 30 Riffle - sand Pool - sand
2.5-6.25 6-24.5 0.95 0.10
CENT-09 40 10 50 Riffle - sand Pool - sand
2.25-7 2.75-24.5
1.63 0.00
CENT-10 20 20 60 Riffle - sand Pool - sand
4-8 10.5- 4 1.42 0.00
EA Engineering, Science, and Technology Page 13 of 31
Seining and fish observations were conducted as part of this SI. Seining efforts were limited to those areas where the biologist could successfully deploy the seine. The effort was by no means exhaustive, so it is likely other species may be present and that the species collected are considerably more abundant than the data suggest. Numerous low barriers (approximately 1-3 ft high) were identified at several points along Granite Creek, particularly upstream of the Central Mine (Photo 70) and at the Tillicum Mine. However, based on the distribution of fish within Granite Creek, these barriers do not appear to impede the upstream movement of fish. Seining was conducted at stations located upstream and immediately downstream (the “at mine” location) of Central, Tillicum, and the “at mine” site at Sheridan. Due to the confirmed presence of bull trout, a federally listed species, in the study area, seining was not conducted at the upstream Sheridan station or at either of the Cap Martin stations. Instead, the stream was surveyed visually to determine the presence or absence of fish at these stations. Due to the small size of the unnamed tributary at the Monumental site and the likelihood that this stream does not support a permanent fishery, visual observations were made instead of seining. As expected, no fish were observed at the Monumental stations. The results of the seining and fish observations during the SI sampling event are presented in Appendix G (Table G-1). The results are summarized as follows:
• Bull trout (Salvelinus confluents) were observed in small numbers throughout the study area with no spatial patterns being apparent. Bull trout are listed as threatened under the ESA and are listed as critical by the state of Oregon.
• Two small Oncorhychus spp. were observed at Station 04 downstream of Cap Martin, and a third
was collected at Station 10 downstream of Central. Because of their small size, they could not be identified to species but were likely either west slope cutthroat trout (Oncorhynchus clarki lewisi) or redband trout (O. mykiss gairdneri). Both species are federally listed as SOC and identified as vulnerable by the Oregon Fish and Wildlife Commission.
• Both bull trout and Oncorynchus species are undoubtedly more common in Granite Creek than
the limited seining effort indicated.
Benthic macroinvertebrates were sampled in pool and riffle habitat at all stations except near the Monumental Mine, where the stream was too small to sample. Field collection and laboratory sorting of benthic macroinvertebrate samples was conducted in accordance with Oregon Department of Environmental Quality (ODEQ) methods and evaluated using a multi-metric analysis, Level 3 Assessment (ODEQ 2001). Three orders of insects, Ephemeroptera (mayflies), Plecoptera (stoneflies), and Trichoptera (caddisflies), collectively referred to as EPT, are considered to be the most sensitive or responsive groups to impairment within the system. Therefore, the richness of each of these groups is included in the multi-metric analysis. The number and relative abundance of the taxa collected are provided in Tables G-2a (pool habitat) and G-2b (riffle habitat) in Appendix G. A summary of the metrics and scores are provided in Table G-3. No mine-related differences were apparent in the Index scores at any of the riffle locations and at only one of the pool locations along Granite Creek. It should be noted that the ODEQ methods for index and metric scoring for streams in Eastern Oregon remain in development; therefore, interpretation of these values should be conducted with caution until the index and scoring criteria are finalized.
• No upstream/downstream differences in pool Index scores were observed at the Cap Martin or Sheridan Mines.
EA Engineering, Science, and Technology Page 14 of 31
• The Index score in the pool downstream of the Central Mine was lower than in the pool upstream of it, likely due to poorer habitat, especially more sedimentation.
• The pool Index score at Station TILL-07, upstream of Tillicum was lower than at any other
station. The reason for this lower score is unclear. • Based on Index scores and individual metrics, no spatial patterns were evident in the pools. • Index scores in the riffles downstream of each mine were comparable to or higher than those
upstream of each mine. Therefore, no mine-related impacts to the riffle benthic community were found.
• Riffle Index scores at the 8 Granite Creek riffle stations were comparable to those at riffle stations
GRAN-53 and GRAN-54 near Lucas Gulch, about 0.5 mi downstream of the Central Mine. • Collectively, there was nothing in the benthic results to indicate that the benthic community in
Granite Creek would benefit significantly from remediation of the mines studied as part of this project.
Habitat was evaluated at all the stream stations except near the Monumental Mine. Methods used followed those described in the project plan; habitat scores are presented in Table G-4 in Appendix G. The following was noted regarding habitat;
• Habitat was fair to good, and comparably similar at all stations except Station CENT-10, located at Central Mine.
• The habitat score at Station 10 was noticeably lower than at any other station due to more
siltation/embeddedness and a poorer/narrower riparian zone. • The increased siltation/embeddedness likely account for the lower pool benthic Index Score at
Station 10. 3.2.5 Analytical Results Analytical water quality results for surface water, pore water, and sediment samples are presented in Tables 1, 2, and 3, respectively. Only those constituents detected in one or more samples are included in the summary tables. Dissolved metals concentrations were used for comparison with surface water screening criteria. Photographs of selected sample locations are provided in Appendix B. Copies of the laboratory reports are included in Appendix J. Field water quality parameters were measured in conjunction with sampling efforts. Surface water quality parameters were measured in the pool habitat at each station. Pore water quality parameters were measured in water samples extracted from pool habitat. Field parameters for the surface water and pore water are reported in Tables 1 and 2, respectively.
• Field parameters consisted of: hexavalent chromium, temperature, dissolved oxygen, specific conductance, pH, turbidity, oxidation/reduction (redox) potential, and stream depth and current velocity (surface water only).

EA Engineering, Science, and Technology Page 15 of 31
• The pH values for all of the water samples were within the acceptable range (6.5-9).
• Field water quality measurements did not indicate that any of these parameters were a limiting factor which would preclude sustainable benthic macroinvertebrate and fish communities at any of the stream stations sampled.
Laboratory analyses performed include the following:
• Surface water – pH, Target Analyte List (TAL) metals (total and dissolved), arsenic III and V
(total metals only), cyanide, TDS, total suspended solids (TSS, organic, and inorganic), hardness, alkalinity, specific conductance, redox potential, and sulfate.
• Pore water –dissolved TAL metals, arsenic III and V (total metals only), and cyanide.
• Sediment – TAL metals, cyanide, total organic carbon (TOC), grain size, and clay mineralogy (for samples collected in pools only).
Criteria for comparing measured concentrations of metals in surface water and pore water consist of the following human health and ecological screening values:
• ODEQ Water Quality Criteria, Protection of Aquatic Life, Fresh Chronic Criteria (Oregon Administrative Record [OAR] 340-041-001); hardness-based criteria for cadmium, chromium III, copper, lead, nickel, and zinc were calculated based on the hardness values for the surface water samples collected on Granite Creek.
• ODEQ Water Quality Criteria, Protection of Human Health, Water, and Fish Ingestion
(OAR 340-041-001). • ODEQ (1998) Guidance for Ecological Risk Assessment, Level II Screening Values for surface
water; these values are based on previous USEPA water quality criteria that have been superseded by the USEPA (2002) recommendations for ambient water quality criteria for freshwater organisms.
• USEPA (2002) recommended ambient water quality criteria for freshwater aquatic organisms,
chronic; criteria for the hardness-dependant values were calculated based on the hardness results for the surface water samples collected on Granite Creek.
• USEPA (2002) recommended ambient water quality criteria for freshwater aquatic organisms,
Tier II secondary chronic values calculated by Oak Ridge National Laboratory (Suter and Tsao 1996).
• USEPA (2002) recommended ambient water quality criteria for protection of human consumption
of fish; hardness-dependent values are normalized to 128 mg/L (mean stream hardness). • Oak Ridge National Laboratory, U.S. Department of Energy (Efromyson et. al. 1997),
Preliminary Remediation Goals.
EA Engineering, Science, and Technology Page 16 of 31
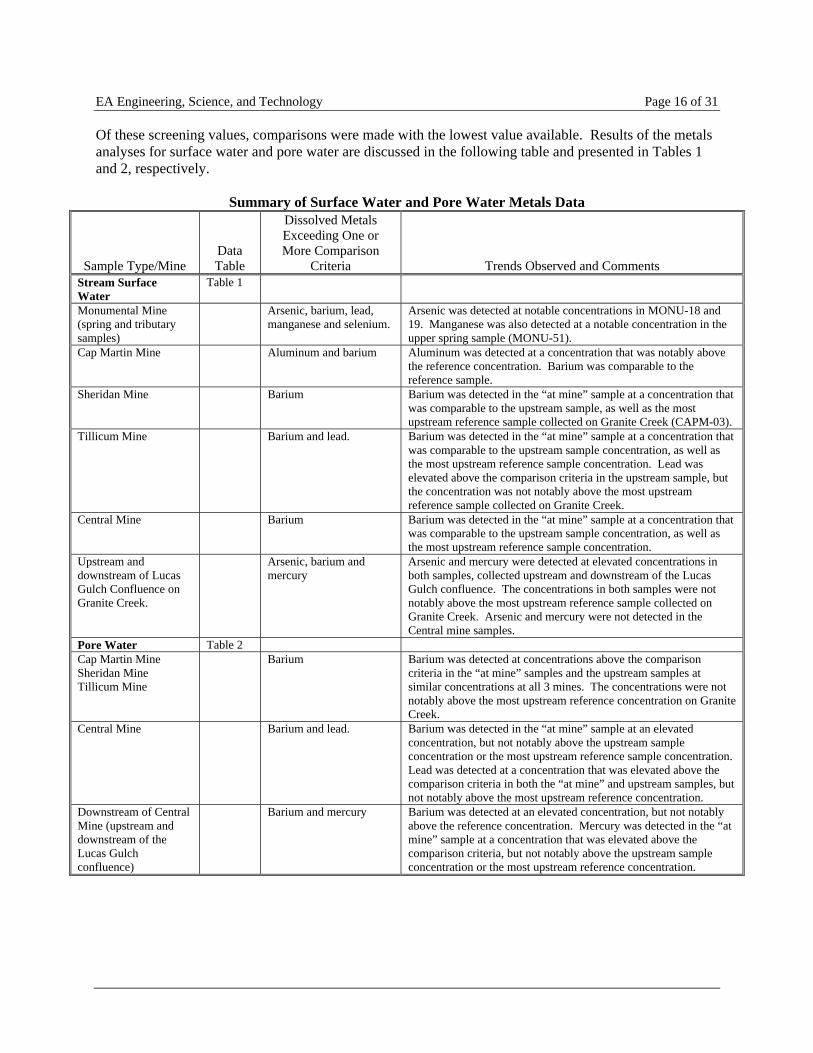
Of these screening values, comparisons were made with the lowest value available. Results of the metals analyses for surface water and pore water are discussed in the following table and presented in Tables 1 and 2, respectively.
Summary of Surface Water and Pore Water Metals Data
Sample Type/Mine Data Table
Dissolved Metals Exceeding One or More Comparison
Criteria Trends Observed and Comments Stream Surface Water
Table 1
Monumental Mine (spring and tributary samples)
Arsenic, barium, lead, manganese and selenium.
Arsenic was detected at notable concentrations in MONU-18 and 19. Manganese was also detected at a notable concentration in the upper spring sample (MONU-51).
Cap Martin Mine Aluminum and barium Aluminum was detected at a concentration that was notably above the reference concentration. Barium was comparable to the reference sample.
Sheridan Mine Barium Barium was detected in the “at mine” sample at a concentration that was comparable to the upstream sample, as well as the most upstream reference sample collected on Granite Creek (CAPM-03).
Tillicum Mine Barium and lead. Barium was detected in the “at mine” sample at a concentration that was comparable to the upstream sample concentration, as well as the most upstream reference sample concentration. Lead was elevated above the comparison criteria in the upstream sample, but the concentration was not notably above the most upstream reference sample collected on Granite Creek.
Central Mine Barium Barium was detected in the “at mine” sample at a concentration that was comparable to the upstream sample concentration, as well as the most upstream reference sample concentration.
Upstream and downstream of Lucas Gulch Confluence on Granite Creek.
Arsenic, barium and mercury
Arsenic and mercury were detected at elevated concentrations in both samples, collected upstream and downstream of the Lucas Gulch confluence. The concentrations in both samples were not notably above the most upstream reference sample collected on Granite Creek. Arsenic and mercury were not detected in the Central mine samples.
Pore Water Table 2 Cap Martin Mine Sheridan Mine Tillicum Mine
Barium Barium was detected at concentrations above the comparison criteria in the “at mine” samples and the upstream samples at similar concentrations at all 3 mines. The concentrations were not notably above the most upstream reference concentration on Granite Creek.
Central Mine Barium and lead. Barium was detected in the “at mine” sample at an elevated concentration, but not notably above the upstream sample concentration or the most upstream reference sample concentration. Lead was detected at a concentration that was elevated above the comparison criteria in both the “at mine” and upstream samples, but not notably above the most upstream reference concentration.
Downstream of Central Mine (upstream and downstream of the Lucas Gulch confluence)
Barium and mercury Barium was detected at an elevated concentration, but not notably above the reference concentration. Mercury was detected in the “at mine” sample at a concentration that was elevated above the comparison criteria, but not notably above the upstream sample concentration or the most upstream reference concentration.

EA Engineering, Science, and Technology Page 17 of 31
Criteria for comparing measured concentrations of metals in sediments were based on the following:
• Threshold Effects Level (TEL) and Probable Effects Level (PEL) from USEPA National Sediment Quality Survey, Screening Values for Chemicals Evaluated http://www.epa.gov/waterscience/cs/vol1/appdx_d.pdf).
• Effects Range-Low (ER-L) and Effects Range-Medium (ER-M), National Oceanic and
Atmospheric Administration (NOAA), from USEPA (1997b) National Sediment Quality Survey, Screening Values for Chemicals Evaluated.
• ODEQ (1998) Guidance for Ecological Risk Assessment, Level II Screening Values for
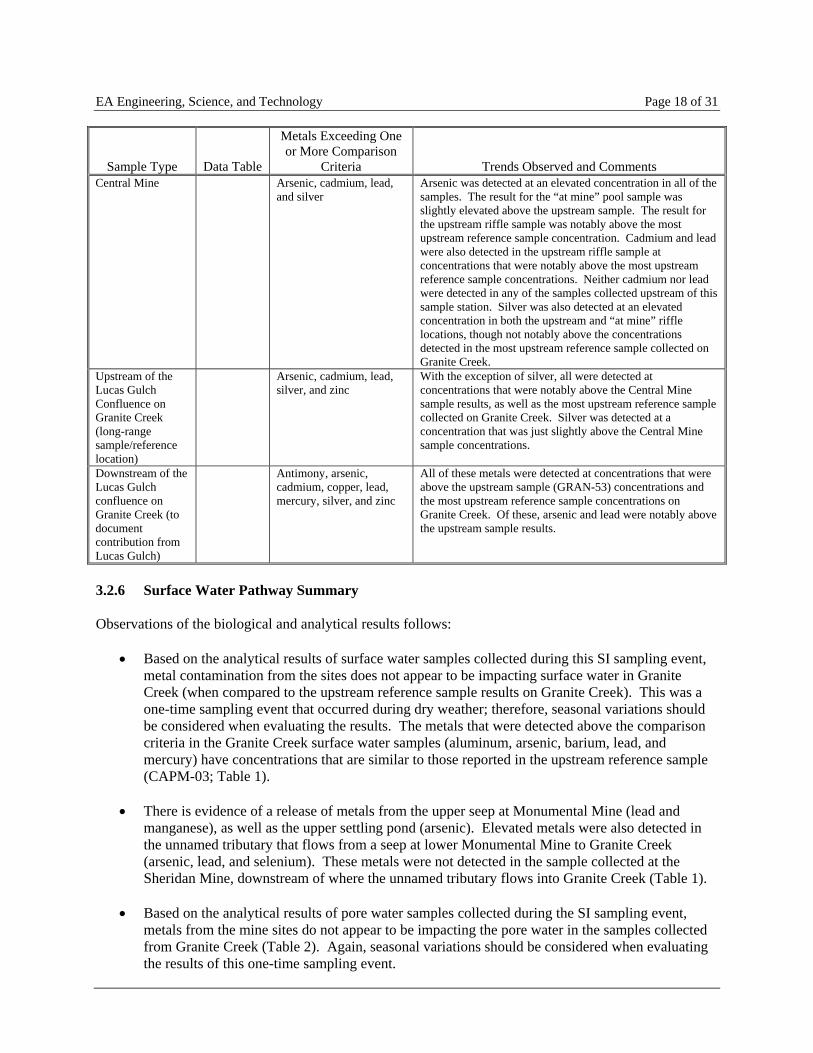
freshwater sediment. Similar to the surface water and pore water samples, the sediment results were compared to the lowest screening criteria available. The analytical results for the sediment samples are provided in Table 3 and are summarized in the following table.
Sample Type Data Table
Metals Exceeding One or More Comparison
Criteria
Trends Observed and Comments Stream Sediment Table 3 Cap Martin Mine (including the most upstream reference sample location CAPM-03)
Arsenic, chromium and silver
Arsenic was detected in the “at mine” samples, as well as the upstream reference samples. The result for the “at mine” riffle sample was slightly elevated above the upstream sample. Chromium was detected in the upstream pool sample at a concentration that was above all of the downstream samples on Granite Creek. Silver was detected in the “at mine” riffle sample at a concentration that was elevated above the comparison criteria, but not notably above the reference sample concentration.
Sheridan Mine Arsenic Arsenic was detected at elevated concentrations in both the riffle and pool “at mine” samples, but not notably above the upstream sample concentrations or the concentrations detected in the most upstream reference samples collected on Granite Creek.
Tillicum Mine Arsenic and silver Arsenic was detected in the “at mine” samples at elevated concentrations in both the riffle and pool samples, but not notably above the upstream concentrations or most upstream reference concentrations. Silver was detected in the upstream samples (pool and riffle) at an elevated concentration. The levels were just slightly above the most upstream sample concentrations on Granite Creek.
EA Engineering, Science, and Technology Page 18 of 31
Sample Type Data Table
Metals Exceeding One or More Comparison
Criteria
Trends Observed and Comments Central Mine Arsenic, cadmium, lead,
and silver Arsenic was detected at an elevated concentration in all of the samples. The result for the “at mine” pool sample was slightly elevated above the upstream sample. The result for the upstream riffle sample was notably above the most upstream reference sample concentration. Cadmium and lead were also detected in the upstream riffle sample at concentrations that were notably above the most upstream reference sample concentrations. Neither cadmium nor lead were detected in any of the samples collected upstream of this sample station. Silver was also detected at an elevated concentration in both the upstream and “at mine” riffle locations, though not notably above the concentrations detected in the most upstream reference sample collected on Granite Creek.
Upstream of the Lucas Gulch Confluence on Granite Creek (long-range sample/reference location)
Arsenic, cadmium, lead, silver, and zinc
With the exception of silver, all were detected at concentrations that were notably above the Central Mine sample results, as well as the most upstream reference sample collected on Granite Creek. Silver was detected at a concentration that was just slightly above the Central Mine sample concentrations.
Downstream of the Lucas Gulch confluence on Granite Creek (to document contribution from Lucas Gulch)
Antimony, arsenic, cadmium, copper, lead, mercury, silver, and zinc
All of these metals were detected at concentrations that were above the upstream sample (GRAN-53) concentrations and the most upstream reference sample concentrations on Granite Creek. Of these, arsenic and lead were notably above the upstream sample results.
3.2.6 Surface Water Pathway Summary Observations of the biological and analytical results follows:
• Based on the analytical results of surface water samples collected during this SI sampling event, metal contamination from the sites does not appear to be impacting surface water in Granite Creek (when compared to the upstream reference sample results on Granite Creek). This was a one-time sampling event that occurred during dry weather; therefore, seasonal variations should be considered when evaluating the results. The metals that were detected above the comparison criteria in the Granite Creek surface water samples (aluminum, arsenic, barium, lead, and mercury) have concentrations that are similar to those reported in the upstream reference sample (CAPM-03; Table 1).
• There is evidence of a release of metals from the upper seep at Monumental Mine (lead and
manganese), as well as the upper settling pond (arsenic). Elevated metals were also detected in the unnamed tributary that flows from a seep at lower Monumental Mine to Granite Creek (arsenic, lead, and selenium). These metals were not detected in the sample collected at the Sheridan Mine, downstream of where the unnamed tributary flows into Granite Creek (Table 1).
• Based on the analytical results of pore water samples collected during the SI sampling event,
metals from the mine sites do not appear to be impacting the pore water in the samples collected from Granite Creek (Table 2). Again, seasonal variations should be considered when evaluating the results of this one-time sampling event.
EA Engineering, Science, and Technology Page 19 of 31
• The sediment within the area of the mine sites along Granite Creek does not appear to be
significantly impacted by metals from the sites, when compared to the results from the most upstream reference sample collected on Granite Creek (CAPM-03, collected upstream of the Cap Martin Mine site). Arsenic was detected at concentrations above the comparison criteria in all of the samples, including the upstream reference sample. Arsenic, cadmium and lead were detected above the comparison criteria and notably above the most upstream reference sample concentrations in the riffle sample collected at the upstream location at Central Mine (CENT-09). Of these, only arsenic was detected in the “at mine” sample collected at Tillicum (TILL-08), upstream of the Central Mine sample location. However, the concentration was comparable to the most upstream reference sample concentration.
• Elevated concentrations of metals were detected in the sediment samples collected near the
confluence of Lucas Gulch (GRAN 53 and 54), approximately 600 yards downstream of Central Mine. Of the metals detected in both samples, only arsenic, lead, and silver were detected in the downstream sample at concentrations that were notably above the upstream sample results, suggesting some contaminant contribution from Lucas Gulch.
• Bull trout (Salvelinus confluents) were observed in small numbers throughout the study area.
Bull trout are listed as threatened under the ESA and are listed as critical by the state of Oregon.
• Two small Oncorhychus spp.; either west slope cutthroat trout (Oncorhynchus clarki lewisi) or redband trout (O. mykiss gardneri), were observed at locations along Granite Creek. Both species are federally listed as SOC and identified as vulnerable by the Oregon Fish and Wildlife Commission.
• There does not appear to be significant benthic habitat impairment or decreased benthic
macroinvertebrate diversity and numbers along Granite Creek within the project area.
3.3 SOIL EXPOSURE PATHWAY 3.3.1 Targets There are no onsite workers at any of the mine sites, and no people live onsite or within 200 ft of areas of suspected contamination related to the sites. The closest regularly occupied building appears to be located on the fringes of the town of Granite, approximately 3 mi from the sites. The town of Granite is located approximately 3.5-4 mi from the sites (straight-line distance). It is reported that approximately 24 people live in the town of Granite (USCB 2002). Furthermore, it is estimated that there are approximately 50 permanent residents located within a 4-mi radius of the mine sites. The sites are open to public access and no warning signs were observed during SI field activities. Land uses within a 4-mi radius of the sites include recreation (hiking, fishing, swimming, camping, all-terrain-vehicle use, etc.), mining on nearby claims, and limited timber harvesting. Soil exposure targets also include sensitive environments located both on the mine sites and within a 4-mi radius of the sites, and are discussed in Section 3.3.2. Terrestrial sensitive environments consist of habitat reported to be used by federal or state T&E species or SOC, and includes the North Fork John Day Wilderness Area.

EA Engineering, Science, and Technology Page 20 of 31
3.3.2 Plant and Wildlife Surveys Habitat reconnaissance surveys were conducted at the mine sites to establish existing habitat conditions, species composition, and the presence of wetlands and T&E species along Granite Creek and at reference/background stations. To accomplish the surveys, two approaches were used. While conducting sampling activities, the site was monitored for wildlife. In addition, flora was located using a timed-meander-search (TMS) procedure. Vegetation was classified using the National Vegetation Classification System (NVCS) to determine the habitat types at the mine sites, with the riparian and forested slopes being the major types (FGDC 1997). All observed species at the site were recorded on a field data sheet as they were encountered and unknown plant species were collected, preserved, and later keyed for identification using reference materials. Site Habitat Description and Vegetation Using the NVCS system combined with a simple habitat assessment, the dominant plant species including canopy and understory species, were documented. The following observations of the area were made:
• The 4 lower mines (Cap Martin, Sheridan, Tillicum, and Central) are situated along Granite Creek in or adjacent to riparian areas. The upper mine, Monumental, is located 800-1,200 ft higher in elevation and springs occur in the upper and lower portions of the site. Drainage from the lower spring, in the marshy area downhill of the lower waste rock pile, forms a tributary that flows into Granite Creek immediately upstream of the Sheridan Mine site.
• The 4 lower mines are located within a large valley ranging from 0.25 to 0.5 mi wide and
approximately 500 ft deep, with steep slopes in many areas. • Granite Creek divides the coniferous forest on the hillsides into 2 distinct habitat types. A drier
ponderosa pine (Pinus ponderosa)- Douglas fir (Psudeotsuga menziesii) woodland is present on the southern side (NVCS code II.B.2.N.a). A moister forest dominated by lodgepole pine (Pinus contorta), larch (Larix lyallii) and silver fir (Abies amabilis) exists on the northern side (NVCS code II.A.4.N.a).
• Granite Creek is typically less than one meter wide and the riparian zone less than 20 meters
wide. Vegetation consists of sparse deciduous plants dominated by red alder (Alnus rubra). The NVCS code most closely describing this habitat is a temporarily flooded cold-deciduous shrubland (III.B.2.N.d.).
• Monumental Mine occurs in a elevationally higher forest dominated by spruce (Picea sp.).
The NVCS code is I.A.8.N.c. There are essentially 4 habitat types in the area of the sites:
• The drier southern facing slopes • The moister northern facing slopes • The riparian zone along Granite Creek • The spruce forest at Monumental Mine.

EA Engineering, Science, and Technology Page 21 of 31
The hillside forest recruitment is a typical one for the Blue Mountains (Franklin and Dyrness 1973). There is almost a complete absence of understory shrubs with the species present consisting of grasses, whortleberry (Vaccinium sp.) and scattered forbs. Wild strawberry (Fragaria virginiana), the plant species selected for plant tissue collection (see below), was widespread in a variety of habitats. Evidence of fire and possible insect infestations was observed. The area above Cap Martin Mine appears to have been logged and portions were in various stages of reforestation. Areas devoid of vegetation were not common except at waste rock piles. No visual indicators of stressed vegetation were recorded at background areas. Prior to conducting the fieldwork, a list of T&E plant species and SOC was generated with data obtained from the Wallowa-Whitman National Forest (Appendix E , Table E-3). In addition, the ONHIC was contacted regarding any specific recorded observations of T&E plant species and SOC within a 2-mi radius of the sites (the search range available). Two species of Carex, northern sedge (Carex concinna) and meadow sedge (Carex praticola), were noted in data obtained from the OHNIC (Appendix D). These sedge species are not a Federal- or State-listed species, but are considered sensitive and are not commonly found in the area. No T&E species or SOC on the Wallowa-Whitman list were observed during the field investigation. The plant species that were observed during the field activities are listed in Appendix E (Table E-4). Wildlife Prior to conducting the fieldwork, a list of T&E terrestrial wildlife species and SOC potentially occurring in Grant County was generated with data obtained from the OHNP (Appendix E, Table E-1). In addition, the ONHIC was contacted regarding any specific recorded observations of T&E wildlife species and SOC within a 2-mi radius of the sites (Appendix D). The Columbia spotted frog (Rana luteiventris), a state-sensitive species (undetermined status), was observed within a 2-mi radius of the sites (on the Boulder Creek drainage, approximately 1 mi upstream from the town of Granite). None were observed during SI field activities however. Very few wildlife species were observed at the Granite Creek Mine sites during the field investigation (Appendix E, Table E-2). Six species of mammals were documented through either direct observation or signs of their presence. No reptiles, amphibians, or terrestrial T&E wildlife species or SOC were observed during the field activities. 3.3.3 Soil/Waste Rock and Plant Tissue Sample Locations Soil and plant tissue sample locations are presented on Figures 1 through 5. Locations for the onsite surface and subsurface soil and/or waste samples are summarized in Appendix A, Table A-3. Background surface soil samples were collected at off-site locations that did not appear to be impacted by mining activity. The descriptions of the background sample locations are also provided on Table A-3. 3.3.4 Plant Tissue Collection Plant tissue specimens were collected from 6 onsite stations (waste rock piles) and from 4 background stations. The samples were analyzed for cyanide and TAL Metals. Three of the background stations were located on the hillsides within the Granite Creek drainage and one was located within the Lucas Gulch drainage. The samples were collected at locations outside of the mining activity and were co-located with surface soil samples. Wild strawberry (Fragaria virginiana), the targeted plant species,
EA Engineering, Science, and Technology Page 22 of 31
was chosen because it occurred on the often barren waste rock piles and both the vegetation and fruit is consumed by wildlife. While wild strawberry is not the most important food species, its prevalence on the waste rock piles and other locations impacted by mining make it a potentially useful species for future use in a food chain analysis of ecological risks. Another strawberry species that occurs in the area of the sites is Fragaria vesca. Neither species was flowering at the time of the field investigation and therefore speciation of the plants was difficult. Only leaves were collected for samples. Plant tissue specimens were collected from waste rock pile locations and were co-located with the waste-rock samples, as indicated on Table A-3 in Appendix A. 3.3.5 Analytical Results All soil and/or waste samples collected at the Granite Creek Mines were analyzed for pH, TAL metals, and cyanide. Synthetic Precipitation Leaching Procedure (SPLP) and Acid Base Accounting (ABA) parameters were also included, as appropriate.
Criteria for comparing measured concentrations of metals in soils consisted of the following human health and ecological screening values:
• ODEQ (1998) Guidance for Ecological Risk Assessment, Level II Screening Values.
• USEPA Region 9 PRGs for Industrial Soils (http://www.epa.gov/region09/waste/sfund/prg/index.htm).
• USEPA (2000a) Generic Soil Screening Levels (SSLs), for protection of human health.
• USEPA (2000b) Ecological Soil Screening Levels (EcoSSLs).
• Oak Ridge National Laboratory PRGs for protection of plants, wildlife, or soil invertebrates,
U.S. Department of Energy (Efroymson et al. 1997). Analytical data were compared to the lowest available screening criteria. The plant tissue samples were analyzed for cyanide and TAL Metals. No comparison criteria are available for plant tissue; these data may be used in a food chain model, if required in the future. The plant tissue samples were compared to background samples for discussion purposes. Surface and Subsurface Soil/Waste Samples A summary of the analytical results for surface and subsurface soil/waste samples is provided in Table 4. Refer to Appendix I for soil sample descriptions and Appendix J for laboratory reports. Surface and subsurface soil sample analytical results are summarized in the following table:

EA Engineering, Science, and Technology Page 23 of 31
Sample Type
Table/ Sample Nos.
Metals Exceeding One or More
Comparison Criteria (in at least one
sample)
Metals Notably Above Highest Background
Concentration (in at least one sample) Trends Observed and Comments
Background Surface Soil GRAN-34
GRAN-35 GRAN-36 LUCA-19
Aluminum, arsenic, barium, beryllium, total chromium, manganese, mercury, selenium, vanadium, and zinc.
NA The pH values in the background soil samples ranged from 5.9 to 6.7. In general, some of the higher concentrations were detected in the soil sample collected near Lucas Gulch.
Monumental Surface and Subsurface Soil/Waste Rock:
MONU-12 MONU-13 MONU-14* MONU-15* MONU-16 MONU-17 MONU-38
Aluminum, antimony, arsenic, barium, beryllium, cadmium, chromium, copper, lead, manganese, mercury, selenium, silver, thallium, vanadium, and zinc
Antimony, arsenic, cadmium, lead, mercury, silver, and zinc.
Soil pH measurements ranged from 3.5 to 8.6. The lower pH values were found in the surface soil samples collected at 3 locations: at MONU-16, near the floater at the upper mill site (4.6), MONU-38, at the crusher near the lower adit (3.5), and MONU-13, from the waste pile near the upper shaft (4.0). The other waste material/soil samples ranged from 6.4 to 8.6. Overall, it appears that the highest concentrations were detected in the samples collected from around the mill, the crusher near the lower adit, and the upper settling pond.
Cap Martin Mine Subsurface Soil/Waste Rock:
CAPM-20 CAPM-21 CAPM-22 CAPM-39
Aluminum, arsenic, barium, beryllium, cadmium, chromium, lead, manganese, mercury, selenium, silver, vanadium, and zinc
Arsenic, cadmium, and zinc.
Soil pH measurements ranged from 4.9 to 8. The lowest value, 4.9, was measured in the sample collected at the waste pile located near the collapsed adit in the western portion of the site (CAPM-39). No staining was noted at this sampling location and AMD was not observed draining from the adit during the field investigation. In general, the highest concentrations were detected in sample CAPM-21 collected from the waste rock pile near the north adit.
Sheridan Mine Subsurface Soil/Waste Rock
SHER-23 SHER-25
Aluminum, antimony, arsenic, barium, beryllium, chromium, copper, iron, manganese, mercury, selenium, silver, vanadium, and zinc
Arsenic (both samples), antimony (SHER-23), mercury (SHER-23), and silver (SHER-23)
Soil pH measurements in the 2 samples were 6.8 and 7. In general, the highest concentrations of metals were detected in the sample collected from the waste rock pile (SHER-23).
Tillicum Mine Surface and Subsurface Soil/Waste Rock:
TILL-26 TILL-27* TILL-28 TILL-30
Aluminum, arsenic, barium, beryllium, cadmium, chromium, lead, manganese, mercury, selenium, silver, thallium, vanadium, and zinc
Arsenic, lead, and zinc.
Soil pH measurements ranged from 6.6 to 8.6. In general, the concentrations in the onsite samples were in the same range.

EA Engineering, Science, and Technology Page 24 of 31
Sample Type
Table/ Sample Nos.
Metals Exceeding One or More
Comparison Criteria (in at least one
sample)
Metals Notably Above Highest Background
Concentration (in at least one sample) Trends Observed and Comments Central Mine
Surface and Subsurface Soil/Waste Rock:
CENT-31* CENT-32 CENT-33
Aluminum, antimony, arsenic, barium, beryllium, chromium, copper, lead, manganese, mercury, selenium, silver, thallium, vanadium, and zinc
Arsenic, lead, and zinc.
Soil pH measurements ranged from 6.5 to 7.2. In general, the concentrations in the onsite samples were in the same range; however, surface soil sample CENT-31 collected from the lower waste rock pile contained concentrations of antimony, copper, and silver that the other samples did not. This sample also contained higher concentrations of arsenic, lead, manganese, vanadium, and zinc.
* - Surface and subsurface sample collected at this location. Plant Tissue Samples A summary of the plant tissue analytical data is provided in Table 5. For most metals, concentrations detected in the onsite plant tissue samples fell within the range of background. No comparison criteria are currently available for plant tissue. The plant tissue results are summarized in the following table:

EA Engineering, Science, and Technology Page 25 of 31
Sample Type
Table/ Sample Nos.
Metals Exceeding the Highest Background Concentration (in at
least one sample)
Metals Notably Above Highest Background
Concentration (in at least one sample) Trends Observed and Comments
Background Plant Tissue GRAN-34,
GRAN-35, GRAN-36, LUCA-19
NA NA Antimony, arsenic, cobalt, and mercury were not detected in any of the background samples.
Monumental Mine Plant Tissue
MONU-14 and MONU-15
Cadmium, iron, lead, and vanadium.
Arsenic and zinc. Arsenic was also detected at notably high concentrations in both of the co-located soil samples. Zinc was detected at a notably high concentration in one of the co-located soil samples (MONU-14).
Cap Martin Mine Plant Tissue
CAPM-20 Mercury None Mercury was detected at a very low concentration (estimated).
Sheridan Mine Plant Tissue
SHER-23 Cadmium, lead, and zinc.
None Lead and zinc were detected just above the highest background concentrations. Cadmium was detected at a very low concentration (estimated).
Tillicum Mine Plant Tissue
TILL-27 Total chromium, iron, lead, mercury,
Cadmium and zinc. Cadmium was not detected at a concentration above the comparison criteria in the co-located soil sample. Zinc was detected above the comparison criteria in the co-located soil sample, but not notably above the highest background concentration.
Central Mine Plant Tissue
CENT-31 Beryllium, cadmium, chromium, copper, iron, lead, magnesium, mercury, vanadium, and zinc.
Total chromium and zinc.
Total chromium and zinc were not detected at notable concentrations in the co-located soil sample. Beryllium, cadmium, chromium, copper, mercury, and vanadium were detected at very low concentrations (estimated) in the plant tissue.
3.3.6 Soil Exposure Pathway Summary Data collected during the field investigation provide evidence that the release of site-related constituents to soils at all 5 of the mine sites has occurred. The following observations are applicable to each of the mine sites:
• The erosion of fine-grained waste material and soil was evident at the sites, particularly on the slopes of the waste rock piles. This erosion was caused by surface water run-off, and is likely a contributor to contaminants migrating offsite and entering the surface water pathway. Surface water runoff would occur at the mines during periods of high rainfall and snowmelt.
• The Columbia spotted frog (Rana luteiventris), a state-sensitive species (undetermined status),
has been observed within a 2-mi radius of the sites (on the Boulder Creek drainage, approximately 1 mi upstream from the town of Granite). However, none was observed during field activities. No other listed terrestrial species have been reported in the vicinity of the site (ONHIP 2003); however, during the field investigation the olive-sided flycatcher (Contopus
EA Engineering, Science, and Technology Page 26 of 31
cooperi) was heard calling in the area of the mine sites several times, but was never seen. This bird is a federal SOC and a state sensitive-vulnerable species.
The following metals were detected in onsite soil/waste samples at concentrations both exceeding the comparison criteria and notably above background:
• Monumental Mine: antimony, arsenic, cadmium, lead, mercury, silver, and zinc. Arsenic and zinc were also detected at concentrations notably above background in the 2 co-located plant tissue samples.
• Cap Martin Mine: arsenic, cadmium, and zinc. • Sheridan Mine: antimony, arsenic, mercury, and silver. • Tillicum Mine: arsenic, lead, and zinc. Cadmium and zinc were also detected at concentrations
notably above background in the co-located plant tissue sample. • Central Mine: arsenic, lead, and zinc. Total chromium and zinc were also detected at
concentrations notably above background in the co-located plant tissue sample. 3.4 AIR PATHWAY 3.4.1 Targets The target distances for the air pathway have been defined as one and 4-mi radii from the sites. It is estimated that 50 people live within 4 mi of the sites. The shortest distance from potential sources of contamination at the sites to any residence or regularly occupied building is estimated to be approximately 3 mi. Within a 4-mi radius of the mine sites, the majority of the NWI mapped units corresponding to federal wetland definitions are outside the Granite Creek drainage. These are largely associated with wet meadows located north of the sites, and were mapped by the NWI as:
PEMH - Palustrine Emergent Vegetation, Permanently Flooded PEMA - Palustrine Emergent Vegetation, Temporarily Flooded PEMB - Palustrine Emergent Vegetation, Saturated conditions PEMC - Palustrine Emergent Vegetation, Seasonally Flooded.
For a detailed description of wetlands, refer to Appendix F. 3.4.2 Air Pathway Summary Air samples were not collected as part of this SI. The most likely air pathway at the mine sites is through inhalation of particulate matter. Arsenic was detected in 4 surface soil samples collected at the Monumental Mine at concentrations exceeding the available USEPA soil screening level for inhalation of particulates (750 mg/kg). Although the potential for an observed release to air is considered possible, the likelihood of exposure from dust particles is low. Because the air pathway is directly related to the soil exposure pathway, addressing and/or eliminating contaminated soils at the site would likely render the air pathway incomplete.

EA Engineering, Science, and Technology Page 27 of 31
4. SUMMARY AND CONCLUSIONS
Based on site observations and the results of field and laboratory analyses, the following site characteristics and conclusions have been identified: Groundwater Pathway:
• Based on available records, one drinking water well is located within the 4-mi TDL; this well is located approximately 4 mi southwest of the sites in the town of Granite. Impacts to this well would not be expected, based on the distance from the sites to the well and the depth of the well. Any impacted shallow groundwater at the site is expected to be very localized in nature, and to present a risk to nearby surface water bodies, in the form of springs and seeps.
Surface Water Pathway:
• Based on analytical results, metals from sources at the mines do not appear to be significantly impacting surface water or pore water in Granite Creek.
• Water flowing from the upper seep and surface water in the upper settling pond at
Monumental Mine contained several metals at high concentrations. Samples collected from the unnamed tributary that flows from the lower seep at Monumental Mine (located near the lower waste rock pile) to Granite Creek also contained several metals at concentrations above the comparison criteria. This unnamed tributary is too small to support fish populations.
• Based on the analytical results, stream sediment within the area of the mine sites along
Granite Creek does not appear to be significantly impacted by metals from the sites. • Elevated concentrations of metals were detected in the sediment samples collected in
Granite Creek near the confluence of Lucas Gulch (GRAN 53 and 54). Of the metals detected in both samples, only arsenic and lead were detected in the downstream sample at concentrations that were notably above the upstream sample results, suggesting some contaminant contribution from Lucas Gulch to Granite Creek.
• Bull trout (Salvelinus confluents) and 2 small Oncorhychus spp. (either west slope cutthroat trout
[Oncorhynchus clarki lewisi] or redband trout [O. mykiss gardneri]) were observed at locations along Granite Creek. Bull trout are listed as threatened under the ESA and are listed as critical by the state of Oregon. Oncorhychus spp are federally listed as SOC and identified as vulnerable by the Oregon Fish and Wildlife Commission.
• There does not appear to be significant benthic habitat impairment or decreased benthic
macroinvertebrate diversity and abundance along Granite Creek within the project area.
Soil Exposure Pathway:
• A number of metals were detected in surface and subsurface soil samples at concentrations exceeding comparison criteria. Of these, only arsenic and/or zinc were detected in soil and/or waste rock material at concentrations that were notably above the background concentrations.
EA Engineering, Science, and Technology Page 28 of 31
Elevated levels of mercury were also detected at notable concentrations in 2 samples collected at the Monumental Mine.
• Arsenic was detected in the plant tissue samples collected at Monumental Mine at concentrations
that were notably above the background levels. Arsenic was also detected at concentrations that were notably above the background concentrations in the co-located surface soil samples.
• The erosion of fine-grained waste material and soil was evident at the sites, particularly on the
slopes of the waste rock piles. This erosion was caused by surface water run-off, and is likely a contributor to contaminants migrating offsite and entering the surface water pathway. Surface water runoff would occur at the mines during periods of high rainfall and snowmelt.
• During SI field activities, the olive-sided flycatcher (Contopus cooperi) was heard calling in the
area of the mine sites several times. This bird is a federal SOC and a state sensitive-vulnerable species.
Air Pathway:
• The air pathway is considered complete, as arsenic was detected in surface soil samples collected
at the Monumental Mine at concentrations above the USEPA soil screening level for inhalation of particulates. However, because the air pathway is directly related to the soil pathway, reducing or eliminating contaminated soils at the site would likely render the air pathway incomplete. Further assessment of the air pathway is not considered necessary.
Recommendations
Based on the elevated concentrations of metals detected in onsite soil and waste rock samples at all 5 mine sites, as well as onsite surface water samples collected at the Monumental Mine, EA recommends performance of an Engineering Evaluation/Cost Analysis (EE/CA) at the Granite Creek sites. As part of the EE/CA, a risk assessment should be performed to assess the human and ecological impacts, establish site removal cleanup standards, and evaluate remediation technologies.
EA Engineering, Science, and Technology Page 29 of 31
5. REFERENCES
Brooks, H.C. and Ramp, L. 1968. Gold and Silver in Oregon. State of Oregon Department of Geology and Mineral Industries, Bulletin 61, Geological Map Series, GMS-25.
Brooks, H.C., Ferns, M.L., and Mullen, E.D. 1982. Geology and Gold Deposits Map of the Granite Quadrangle, Grant County, Oregon. State of Oregon Department of Geology and Mineral Industries.
Cooke, S.S. 1997. A Field Guide to the Common Wetland Plants of Western Washington and Northwestern Oregon. Seattle Audubon Trailside Series.
Durkin, Thomas V. and Johathan G. Herrmann. 1994. Focusing on the Problem of Mining Wastes: An
Introduction to Acid Mine Drainage. http://technology.infomine.com/enviromine/publicat/amdintro.html.
EA. 2003a. Work Plan for Site Inspection at Granite Creek Mines, Wallowa-Whitman National Forest.
Prepared for U.S. Department of Agriculture, Forest Service. July. EA. 2003b. Sampling and Analysis Plan for Site Inspection at Granite Creek Mines, Wallowa-Whitman
National Forest. Prepared for U.S. Department of Agriculture, Forest Service. July. EA. 2003c. Health and Safety Plan for the Granite Creek Mines Site Inspection, Wallowa-Whitman
National Forest. Prepared for US Department of Agriculture, Forest Service. June. EA. 2003d. Standard Operating Procedures for Abandoned Mine Sites. Prepared for US Department of
Agriculture, Forest Service. June.
Efroymson, R.A., G.W. Suter, B.E. Sample, and D.S. Jones. 1997. Preliminary Remediation Goals for Ecological Endpoints. ES/ER/TM-162/R2. Prepared for U.S. Department of Energy. Oak Ridge National Laboratory, Tennessee.
Federal Geographic Data Commission (FGDC). 1997. Vegetation Classification Standard. Vegetation Subcommittee, FGDC, U.S. Geological Survey. http://biology.usgs.gov/fgdc.veg/standards/
Ferns, M.L., H.C. Brooks, and J. Ducette. 1982. Geology and Mineral Resources Map of the Mt. Ireland
Quadrangle, Baker and Grant Counties, Oregon. State of Oregon Department of Geology and Mineral Industries, Geological Map Series, GMS-22.
Franklin, J.F. and C.T. Dyrness. 1973. Natural Vegetation of Oregon and Washington. USDA Forest Service General Technical Report PNW-8. Portland, Oregon. 417pp.
Koch, George S. Jr. 1959. Lode Mines of the Central Part of the Granite Mining District, Grant County,
Oregon. State of Oregon Department of Geology and Mineral Industries. Bulletin No. 49. Oregon Department of Environmental Quality (ODEQ). 1998. Guidance for Ecological Risk
Assessment: Levels I, II, III, IV. Final. Oregon Department of Environmental Quality, Portland, Oregon. April.

EA Engineering, Science, and Technology Page 30 of 31
ODEQ. 2001. Oregon Plan for Salmon and Watersheds Water Quality Monitoring Guide Book. Oregon Department of Environmental Quality.
Oregon Natural Heritage Information Center (ONHIC). 2003. Correspondence from Cliff Alton, Conservation Information Assistant with the Oregon Natural Heritage Information Center. 15 September.
Oregon Natural Heritage Program (ONHP). 2001. Rare, Threatened and Endangered Plants and Animals of Oregon. Oregon Natural Heritage Program, Portland, Oregon. 94 pp. (98 pp. PDF).
Oregon Water Resources Department (OWRD). 2003. Information regarding drinking water wells
obtained from the website: http://www.wrd.state.or.us/
Suter, G.W., and C.L. Tsao. 1996. Toxicological Benchmarks for Screening Potential Contaminants of Concern for Effects on Aquatic Biota: 1996 Revision. Prepared for U.S. Department of Energy. Oak Ridge National Laboratory, Tennessee. June.
Tabor, James Waucop. 1988. Granite and Gold, the Story of Oregon’s Smallest City. Teresa Tabor Fowler, Baker, Oregon.
United States Census Bureau. 2002. Population statistics, Grant County, Oregon. http://quickfacts.census.gov/qfd/states/41000.html
United States Department of Agriculture (USDA). 2002. Granite Area Mining Projects. Draft Environmental Impact Statement. June.
United States Environmental Protection Agency (USEPA). 1997a. Data Summary Report, Granite Creek Watershed, Grant County, Oregon. Prepared by Roy F. Weston, Inc. Seattle, Washington. July.
USEPA. 1997b. The Incidence and Severity of Sediment Contamination in Surface Waters of the United States. Volume 1: National Sediment Quality Survey. USEPA 823-R-97-006. U.S. Environmental Protection Agency, Office of Science and Technology, Washington, DC. September.
USEPA. 2000a. Soil Screening Guidance. User’s Guide. EPA540/R-96/018. Technical background document, Appendix A. http://www.epa.gov/oerrpage/superfund/resources/soil/. Accessed in September 2003.
USEPA. 2000b. Ecological Soil Screening Level Guidance. Draft. U.S. Environmental Protection Agency, Office of Emergency and Remedial Response. 10 July.
USEPA. 2002. National Recommended Water Quality Criteria: 2002. EPA-822-R-02-047. U.S. Environmental Protection Agency, Office of Water, Washington DC. November.
USEPA. 2003. Region 9 Preliminary Remediation Goals, Industrial Soils (http://www.epa.gov/region09/waste/sfund/prg/index.htm). 6 October.
United States Fish and Wildlife Service (USFWS). 1994. National Wetland Inventory 7 ½ Minute Quadrangle Maps, including Granite, Greenhorn, Olive Lake, Mt. Ireland, and Vinegar Hill Lookout.

EA Engineering, Science, and Technology Page 31 of 31
United States Forest Service (USFS). 2003a. Abbreviated Preliminary Assessment, Monumental Mine,
Wallowa-Whitman National Forest, Grant County, Oregon. February.
USFS. 2003b. Abbreviated Preliminary Assessment, Tillicum Mine, Wallowa-Whitman National Forest, Grant County, Oregon. February.
United States Geological Survey (USGS). 1995. 7 ½ Minute Quadrangle Maps, including Granite and Mt. Ireland, Oregon.
USGS. 2003. Historical Streamflow Data. NWISWeb Tutorial Website: (http://waterdata.usgs.gov/tutorial/historical_streamflow.html)
Visconty, Greg. 2003. Title Search Summary for Granite Creek Mines. USFS. Baker City, Oregon. 29 April.

Figures


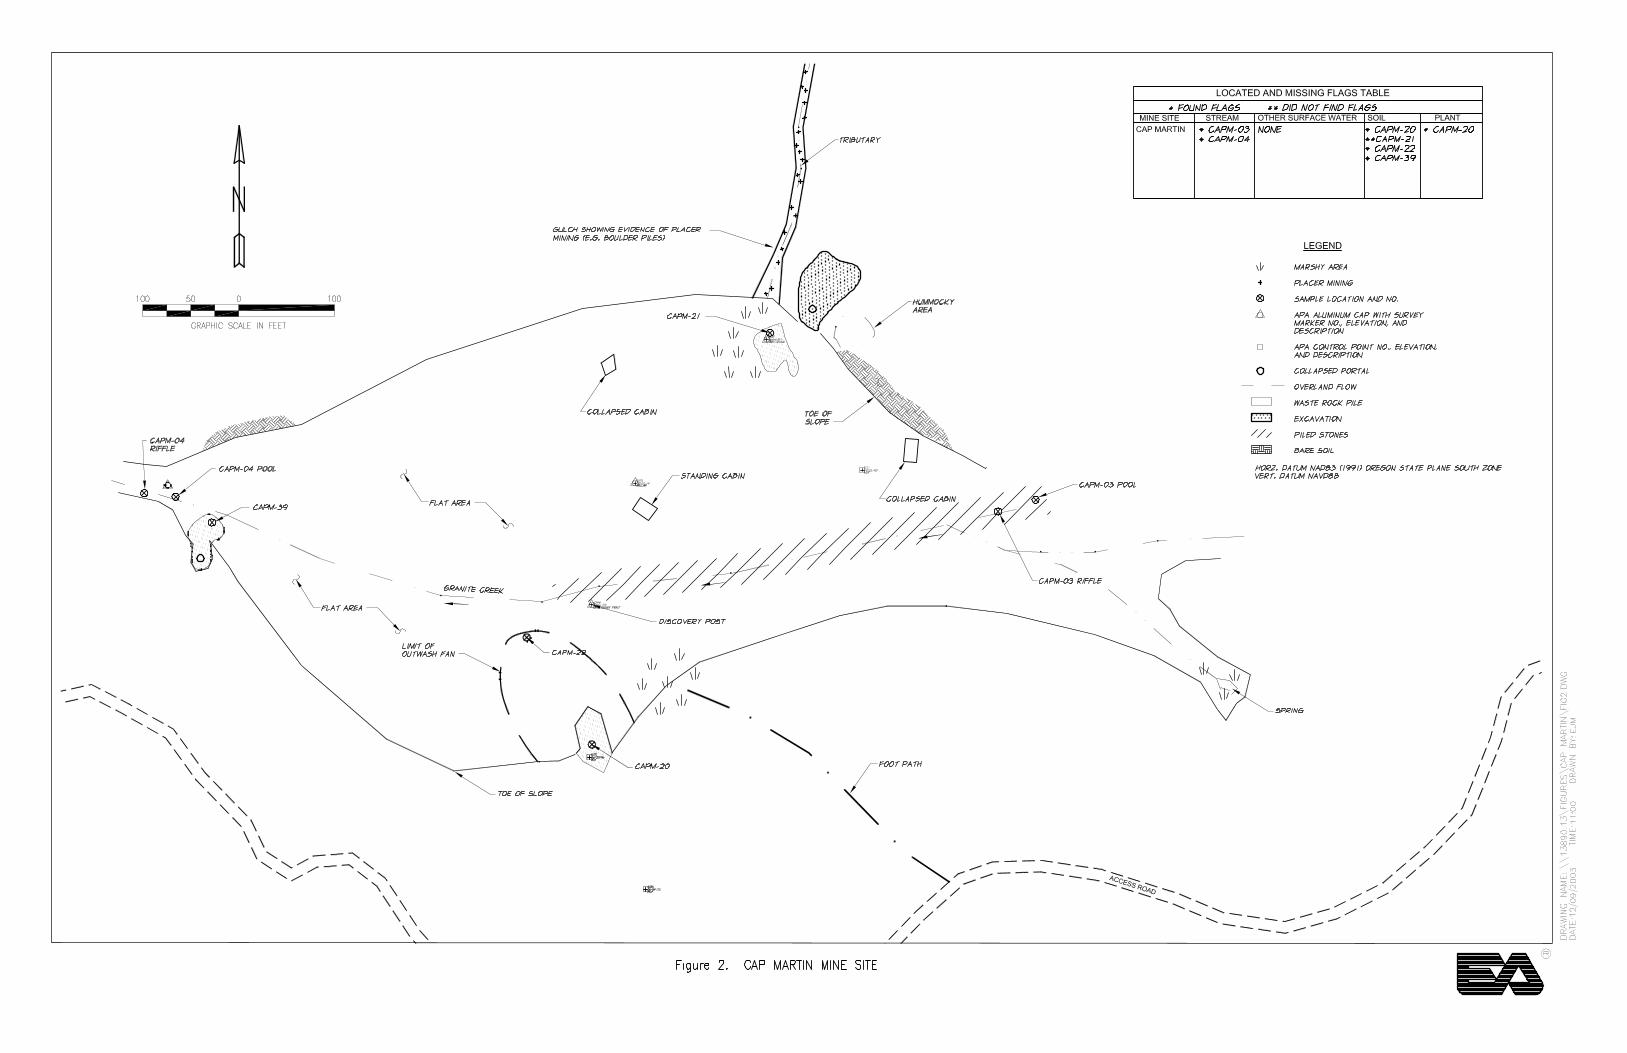

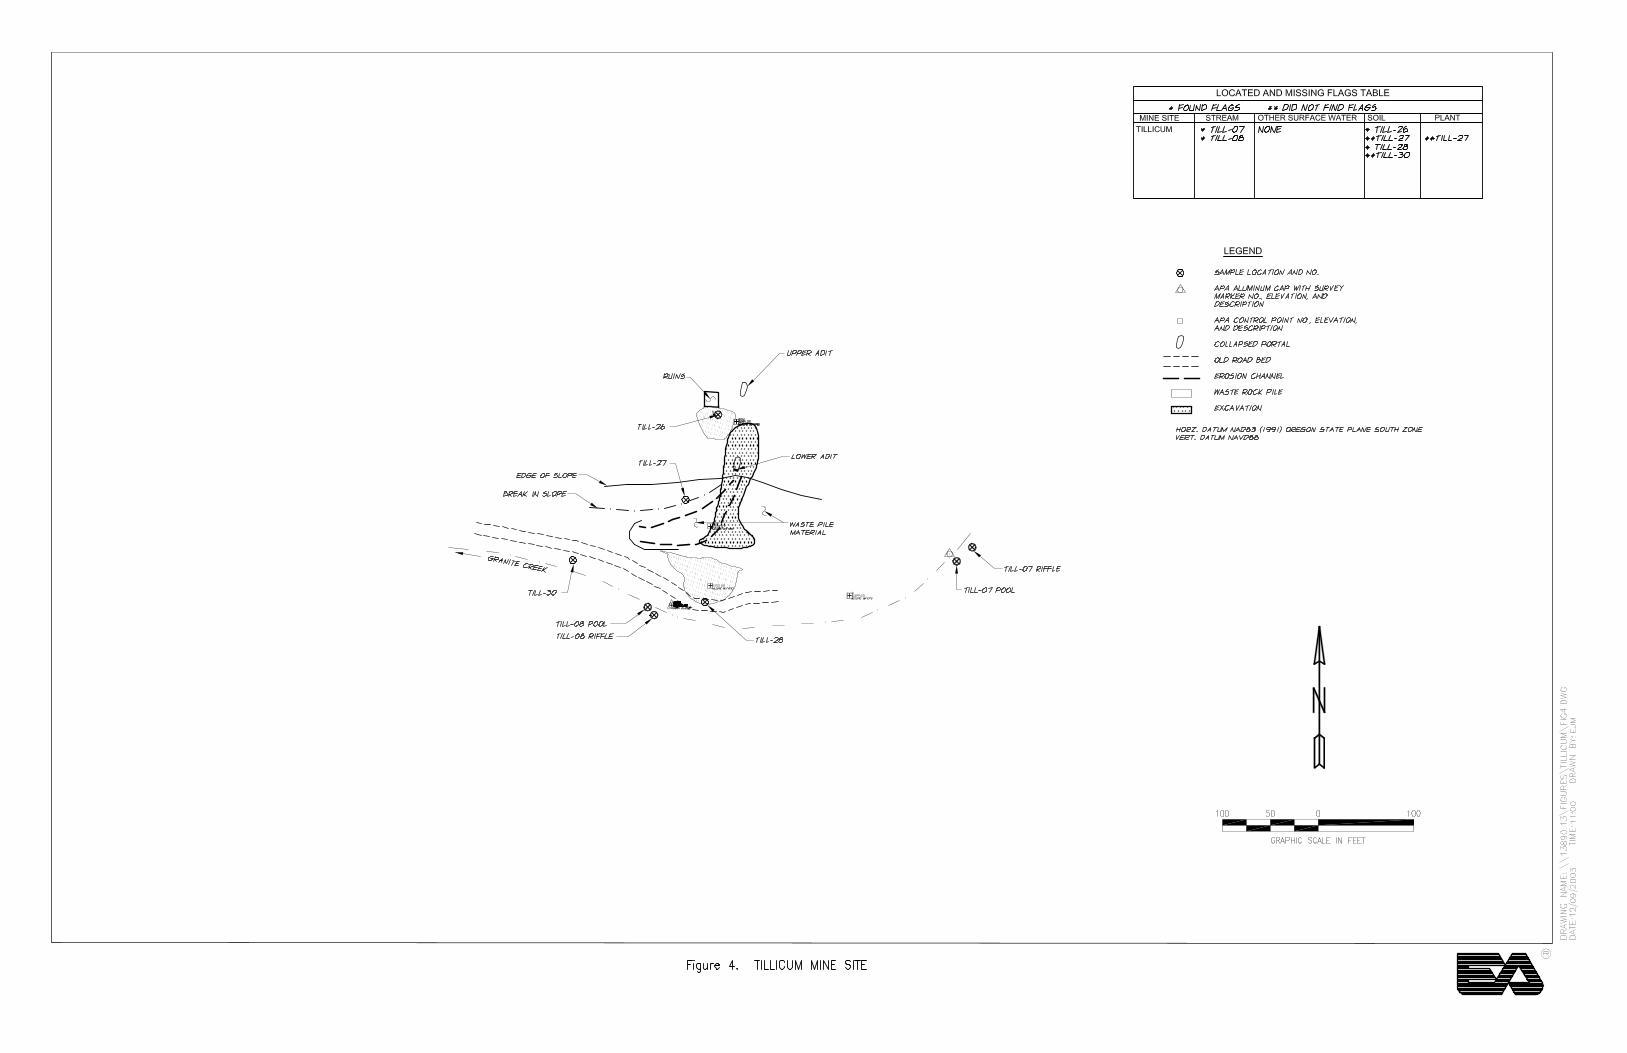


Tables
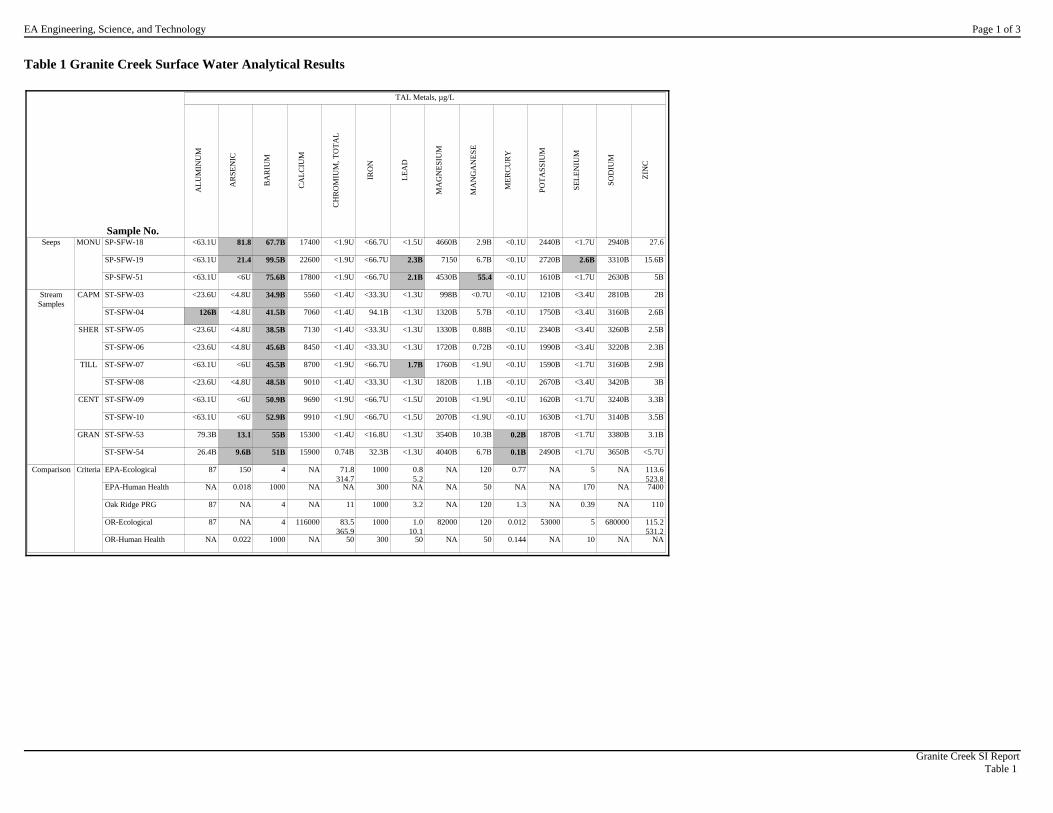
Page 1 of 3EA Engineering, Science, and Technology
Table 1 Granite Creek Surface Water Analytical Results
<63.1U
<63.1U
<63.1U
<23.6U
126B
<23.6U
<23.6U
<63.1U
<23.6U
<63.1U
<63.1U
79.3B
26.4B
87
NA
87
87
NA
81.8
21.4
<6U
<4.8U
<4.8U
<4.8U
<4.8U
<6U
<4.8U
<6U
<6U
13.1
9.6B
150
0.018
NA
NA
0.022
67.7B
99.5B
75.6B
34.9B
41.5B
38.5B
45.6B
45.5B
48.5B
50.9B
52.9B
55B
51B
4
1000
4
4
1000
17400
22600
17800
5560
7060
7130
8450
8700
9010
9690
9910
15300
15900
NA
NA
NA
116000
NA
<1.9U
<1.9U
<1.9U
<1.4U
<1.4U
<1.4U
<1.4U
<1.9U
<1.4U
<1.9U
<1.9U
<1.4U
0.74B
71.8314.7
NA
11
83.5365.9
50
<66.7U
<66.7U
<66.7U
<33.3U
94.1B
<33.3U
<33.3U
<66.7U
<33.3U
<66.7U
<66.7U
<16.8U
32.3B
1000
300
1000
1000
300
<1.5U
2.3B
2.1B
<1.3U
<1.3U
<1.3U
<1.3U
1.7B
<1.3U
<1.5U
<1.5U
<1.3U
<1.3U
0.85.2NA
3.2
1.010.1
50
4660B
7150
4530B
998B
1320B
1330B
1720B
1760B
1820B
2010B
2070B
3540B
4040B
NA
NA
NA
82000
NA
2.9B
6.7B
55.4
<0.7U
5.7B
0.88B
0.72B
<1.9U
1.1B
<1.9U
<1.9U
10.3B
6.7B
120
50
120
120
50
<0.1U
<0.1U
<0.1U
<0.1U
<0.1U
<0.1U
<0.1U
<0.1U
<0.1U
<0.1U
<0.1U
0.2B
0.1B
0.77
NA
1.3
0.012
0.144
2440B
2720B
1610B
1210B
1750B
2340B
1990B
1590B
2670B
1620B
1630B
1870B
2490B
NA
NA
NA
53000
NA
<1.7U
2.6B
<1.7U
<3.4U
<3.4U
<3.4U
<3.4U
<1.7U
<3.4U
<1.7U
<1.7U
<1.7U
<1.7U
5
170
0.39
5
10
2940B
3310B
2630B
2810B
3160B
3260B
3220B
3160B
3420B
3240B
3140B
3380B
3650B
NA
NA
NA
680000
NA
27.6
15.6B
5B
2B
2.6B
2.5B
2.3B
2.9B
3B
3.3B
3.5B
3.1B
<5.7U
113.6523.87400
110
115.2531.2
NAOR-Human Health
CriteriaComparison
OR-Ecological
Oak Ridge PRG
EPA-Human Health
EPA-Ecological
ST-SFW-54
GRAN
Stream Samples
ST-SFW-53
ST-SFW-10
CENT ST-SFW-09
ST-SFW-08
TILL ST-SFW-07
ST-SFW-06
SHER ST-SFW-05
ST-SFW-04
CAPM ST-SFW-03
SP-SFW-51
MONUSeeps
SP-SFW-19
SP-SFW-18
ZIN
C
TAL Metals, µg/L
SOD
IUM
SEL
EN
IUM
POT
ASS
IUM
MER
CU
RY
MA
NG
AN
ESE
MA
GN
ESI
UM
LE
AD
IRO
N
CH
RO
MIU
M, T
OT
AL
CA
LC
IUM
BA
RIU
M
AR
SEN
IC
AL
UM
INU
M
Sample No.
Granite Creek SI ReportTable 1

Page 2 of 3EA Engineering, Science, and Technology
Table 1 Granite Creek Surface Water Analytical Results, continued
47.1
72.1
44.5
25.7
30.2
32
35.4
37.3
37.7
40.1
41
46.9
51.2
141
182
139
46.7
55
57
69.3
73.1
73
78
78.9
108
112
104
132
64
112
128
160
88
96
100
108
100
80
104
>20
NA
NA
NA
NA
6.9
7.5
7
7.3
7.2
7.6
7.6
7.6
7.7
7.6
7.6
7.6
7.7
6.5-9
5-9
NA
6.5-9
NA
289.5
261
274.5
266.5
269
157
162.5
173
156.5
171.5
258.5
184
181
24.6
23.5
26
5
5.2
5.1
5.9
5.9
6.2
6
6.1
14.8
15.3
36.1
50.7
30.6
2.7
5.4
2.4
1.3
1.8
9.2
1.6
1.8
7.2
5
NA
NA
NA
NA
NA
8.1
19.8
17.7
<5U
<5U
<5U
<5U
<5U
<5U
<5U
<5U
<5U
<5U
47.1
72.1
44.5
25.7
30.2
32
35.4
37.3
37.7
40.1
41
46.9
51.2
116
123
107
39
40
51
64
64
65
61
70
100
116
NA
250
NA
500
NA
0.01
0.01
0.01
0.01
0.01
0.00
0.01
0.01
0.01
0.01
0.01
0
0
NM
0.14
NM
NM
NM
0.34
0.23
0.21
0.1
NM
NM
0.03
0.08
0.17
0.17
0.38
0.58
0.67
1.0
2.0
0.75
1.54
1.14
0.6
0.58
0.83
7.8
10.21
7.35
11.29
10.7
10.7
10.73
10.62
10.24
10.78
10.37
10.2
10.58
8
NA
NA
6-11
NA
7.65
7.9
7.76
7.96
7.87
8.27
8.28
8.08
8.08
8.1
8.09
7.81
8.49
6.5-9
5-9
NA
6.5-9
NA
16.8
17.8
-22.4
30.0
42
4.2
0.8
64.4
54.3
8.7
16
78.4
-7.5
148
185
142
48
57
60
70
73
75
80
80
122
133
7.01
10.64
8.36
9.58
10.7
10.72
11.14
12.43
12.31
10.49
13.02
14.96
14.04
4.68
0.72
2.34
0.44
0.71
0.37
0.41
0.27
0.48
0.57
0.4
0.58
5
OR-Human Health
CriteriaComparison
OR-Ecological
Oak Ridge PRG
EPA-Human Health
EPA-Ecological
ST-SFW-54
GRAN
Stream Samples
ST-SFW-53
ST-SFW-10
CENT ST-SFW-09
ST-SFW-08
TILL ST-SFW-07
ST-SFW-06
SHER ST-SFW-05
ST-SFW-04
CAPM ST-SFW-03
SP-SFW-51
MONUSeeps
SP-SFW-19
SP-SFW-18
TU
RB
IDIT
YN
TU
Field Parameters
TE
MPE
RA
TU
RE
DE
G C
SPE
CIF
IC C
ON
DU
CT
AN
CE
µS/C
M³
RE
DO
X P
OT
EN
TIA
LM
V
PHPH
UN
ITS
DIS
SOL
VE
D O
XY
GE
NM
G/L
DE
PTH
FT
CU
RR
EN
T V
EL
OC
ITY
FT/S
EC
CH
RO
MIU
M, H
EX
AV
AL
EN
TM
G/L
TO
TA
L D
ISSO
LV
ED
SO
LID
SM
G/L
Laboratory General Chemistry
TO
TA
L A
LK
AL
INIT
YM
G/L
SUSP
EN
DE
D S
OL
IDS,
VO
LA
TIL
EM
G/L
SUSP
EN
DE
D S
OL
IDS,
TO
TA
LM
G/L
SUL
FAT
EM
G/L
RE
DO
X P
OT
EN
TIA
LM
V
PHPH
UN
ITS
HA
RD
NE
SSM
G/L
CO
ND
UC
TAN
CE
UM
HO
S/C
M
AL
KA
LIN
ITY
, BIC
AR
BO
NA
TE
MG
/L
Sample No.
Granite Creek SI ReportTable 1
Page 3 of 3EA Engineering, Science, and Technology
Table 1 Granite Creek Surface Water Analytical Results, continued
Notes- Bold, shaded results indicate concentrations above the lowest applicable comparison criterion.- Cyanide (total) was analyzed for but not detected in any sample.- All alkalinity was contributed by bicarbonate: carbonate and hydroxide were not detected in any samples.- The following dissolved metals were analyzed for but not detected in any sample: antimony, beryllium, cadmium, cobalt, copper, nickel, silver, thallium, and vanadium.- There were no comparison criteria for total chromium (Cr); therefore, the most conservative criteria, for Cr 6, were used. -
U = Analyte was analyzed for but not detected.B = Analyte was detected at a concentration between the method detection limit (MDL) and practical quantitation limit (PQL).
NA = Not available.NM = Not measureable.
Empty cells in the table indicate no data.
Units:DEG C = Degrees Celsius MV = Millivolts
FT = Feet NTU = Nephelometric turbidity unitsFT/SEC = Feet per second UG/L = Micrograms per liter
MG/L = Milligrams per liter UMHOS/CM = Micro MHOS per centimeterµS/CM³ = Microsiemens per cubic centimeter
Comparison Criteria Oregon Ecological - Criteria are the lowest of:
- ODEQ Water Quality Criteria, Protection of Aquatic Life, Fresh Chronic Criteria (OAR 340-041-001), or- ODEQ (1998b) Guidance for Ecological Risk Assessment, Level II Screening Values for surface water.
EPA Ecological - Criteria are the lowest of:-
-
Oak Ridge PRGs - Oak Ridge National Laboratory Preliminary Remediation Goals (Efroymson et al 1997).Oregon Human Health - ODEQ Water Quality Criteria, Protection of Human Health, Water and Fish Ingestion (OAR-340-041-001).
Hardness-based criteria for cadmium, chromium, copper, lead, nickel, and zinc were calculated for each sample. The range of calculated criteria is indicated, the top number indicating the lowest and the bottom number the highest.
USEPA (2002) recommended ambient water quality criteria for freshwater aquatic organisms, Tier II secondary chronic values calculated by Oak Ridge National Laboratory (Suter & Tsao 1996).
USEPA (2002) recommended ambient water quality criteria for freshwater aquatic organisms, chronic; hardness dependent values were calculated for each sample, or
EPA Human Health - USEPA (2002) recommended ambient water quality criteria for protection of human consumption of fish; hardness dependent values were calculated for each sample, the range of values is indicated.
Granite Creek SI ReportTable 1

Page 1 of 2EA Engineering, Science, and Technology
Table 2 Granite Creek Pore Water Analytical Results
<23.6U
<23.6U
<23.6U
<23.6U
<23.6U
<23.6U
<63.1U
<63.1U
<63.1U
60.5B
45.7B
87
87
87
<4.8U
<4.8U
<4.8U
6.1B
6.1B
<4.8U
<6U
<6U
<6U
16.7
13.2
150
NA
NA
31B
36.2B
36B
38.4B
49.4B
44.3B
49.6B
53.4B
60.8B
47.6B
45.9B
4
4
4
5520
6730
6910
13200
8780
8320
9940
11200
9890
15500
16700
NA
NA
116000
<33.3U
<33.3U
<33.3U
<33.3U
<33.3U
<33.3U
<66.7U
<66.7U
<66.7U
23.3B
<16.8U
1000
1000
1000
<1.3U
<1.3U
<1.3U
<1.3U
<1.3U
<1.3U
2.4B
1.9B
2.4B
<1.3U
<1.3U
0.85.23.2
1.010.1
1010B
1240B
1290B
2460B
1800B
1700B
2110B
2280B
2080B
3580B
4440B
NA
NA
82000
1.1B
2.3B
0.7B
1.1B
4B
1.5B
4.9B
<1.9U
5.1B
4B
4.4B
120
120
120
<0.1U
<0.1U
<0.1U
<0.1U
<0.1U
<0.1U
<0.1U
<0.1U
<0.1U
<0.1U
0.12B
0.77
1.3
0.012
514B
<393U
415B
1060B
1890B
1640B
1650B
1820B
2390B
2000B
1830B
NA
NA
53000
<3.4U
<3.4U
<3.4U
<3.4U
3.5B
<3.4U
<1.7U
<1.7U
<1.7U
<1.7U
<1.7U
5
5
5
2840B
3060B
2980B
4550B
3600B
3540B
3280B
3550B
4070B
3420B
3540B
NA
NA
680000
<5.7U
<5.7U
<5.7U
<5.7U
<5.7U
<5.7U
<2.8U
<2.8U
<2.8U
4.1B
<2.8U
12
12
40
2.4B
1.7B
2.8B
2.7B
4.1B
2.5B
3.1B
4.8B
5.5B
5.9B
5.4B
113.6523.8
110
115.2531.2
0.00
0.01
0.01
0.01
0.01
0.01
0.01
0.01
0.00
0
10.07
9.57
10.02
9.64
10.4
9.53
10.4
8.02
7.9
9.35
10.79
8
NA
6-11
7.94
8.09
8.24
8.24
8.14
8.32
8.16
7.86
8.0
8.2
8.45
6.5-9
NA
6.5-9
21.4
19.2
9.6
5.7
20.8
22.9
8.3
32.2
50.9
83.9
10.2
49
57
59
75
81
70
80
90
87
124
138
11.29
12.51
10.83
10.48
12.65
14.56
10.9
12.88
12.9
15.9
12.08
53.0
36.5
15.9
34.4
18.3
18.3
23.6
76.9
231
61.8
176
OR-Ecological
CriteriaComparison
Oak Ridge PRG
EPA-Ecological
ST-PWP-54
GRAN
Stream Samples
ST-PWP-53
ST-PWR-10
CENT
ST-PWP-10
ST-PWP-09
ST-PWP-08
TILL ST-PWP-07
ST-PWP-06
SHER ST-PWP-05
ST-PWP-04
CAPM ST-PWP-03
TU
RB
IDIT
YN
TU
Field Parameters
TE
MPE
RA
TU
RE
DE
G C
SPE
CIF
IC C
ON
DU
CT
AN
CE
µS/C
M³
RE
DO
X P
OT
EN
TIA
LM
V
PHPH
UN
ITS
DIS
SOL
VE
D O
XY
GE
NM
G/L
CH
RO
MIU
M, H
EX
AV
AL
EN
TM
G/L
ZIN
C
TAL Metals, µg/L
TH
AL
LIU
M
SOD
IUM
SEL
EN
IUM
POT
ASS
IUM
MER
CU
RY
MA
NG
AN
ESE
MA
GN
ESI
UM
LE
AD
IRO
N
CA
LC
IUM
BA
RIU
M
AR
SEN
IC
AL
UM
INU
M
Sample No.
Granite Creek SI ReportTable 2
Page 2 of 2EA Engineering, Science, and Technology
Table 2 Granite Creek Pore Water Analytical Results, continued
Notes- Bold, shaded results indicate concentrations above the lowest applicable comparison criterion.- Cyanide (total) was analyzed for but not detected in any sample.- All alkalinity was contributed by bicarbonate; carbonate and hydroxide were not detected in any samples.- The following dissolved metals were analyzed for but not detected in any sample: antimony, beryllium, cadmium, chromium, cobalt, copper, nickel, silver, and vanadium.- There were no comparison criteria for total chromium (Cr); therefore, the most conservative criteria, for Cr 6, were used. -
U = Analyte was analyzed for but not detected.B = Analyte was detected at a concentration between the method detection limit (MDL) and practical quantitation limit (PQL).
NA = Not available.Empty cells in the table indicate no data.
Units:DEG C = Degrees Celsius µS/CM³ = Microsiemens per cubic centimeter
FT = Feet MV = MillivoltsFT/SEC = Feet per second NTU = Nephelometric turbidity units
MG/L = Milligrams per liter UG/L = Micrograms per liter
Comparison Criteria Oregon Ecological - Criteria are the lowest of:
- ODEQ Water Quality Criteria, Protection of Aquatic Life, Fresh Chronic Criteria (OAR 340-041-001), or- ODEQ (1998b) Guidance for Ecological Risk Assessment, Level II Screening Values for surface water.
EPA Ecological - Criteria are the lowest of:--
Oak Ridge PRGs - Oak Ridge National Laboratory Preliminary Remediation Goals (Efroymson et al 1997).
Oregon Human Health - ODEQ Water Quality Criteria, Protection of Human Health, Water and Fish Ingestion (OAR-340-041-001).
Hardness-based criteria for cadmium, chromium, copper, lead, nickel, and zinc were calculated for each sample. The range of calculated criteria is indicated, the top number indicating the lowest and the bottom number the highest.
USEPA (2002) recommended ambient water quality criteria for freshwater aquatic organisms, chronic; hardness dependent USEPA (2002) recommended ambient water quality criteria for freshwater aquatic organisms, Tier II secondary chronic
EPA Human Health - USEPA (2002) recommended ambient water quality criteria for protection of human consumption of fish; hardness dependent values were calculated for each sample, the range of values is indicated.
Granite Creek SI ReportTable 2
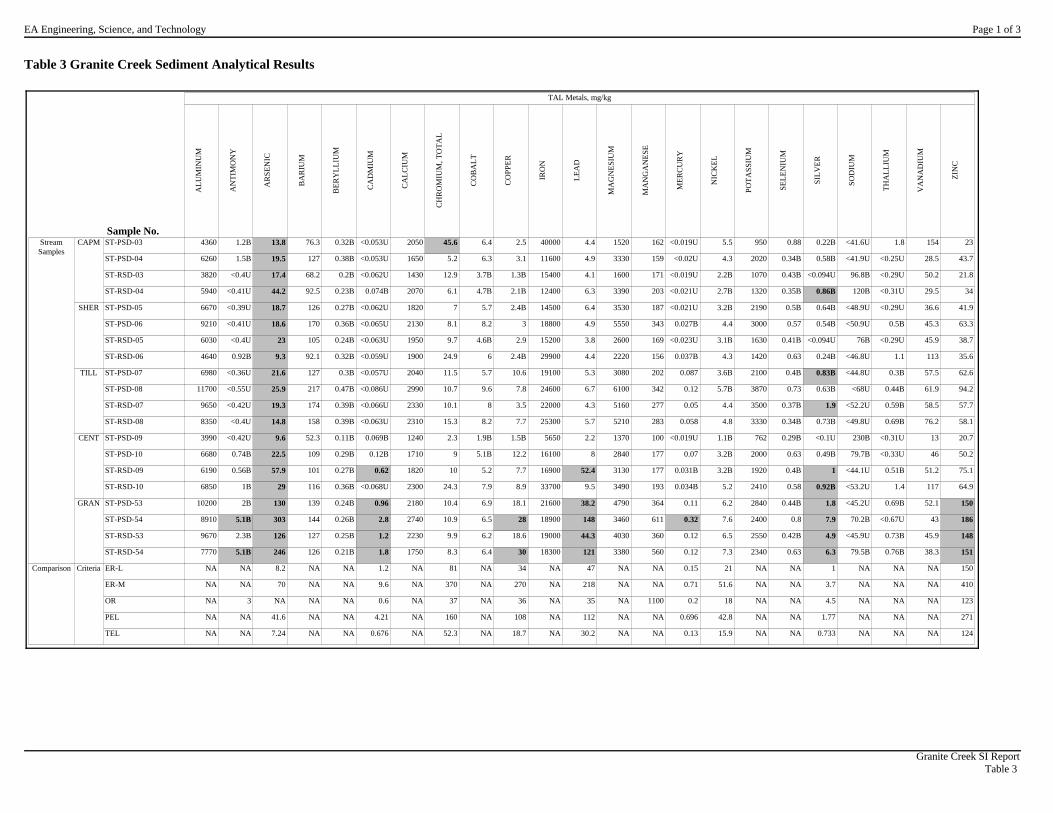
Page 1 of 3EA Engineering, Science, and Technology
Table 3 Granite Creek Sediment Analytical Results
4360
6260
3820
5940
6670
9210
6030
4640
6980
11700
9650
8350
3990
6680
6190
6850
10200
8910
9670
7770
NA
NA
NA
NA
NA
1.2B
1.5B
<0.4U
<0.41U
<0.39U
<0.41U
<0.4U
0.92B
<0.36U
<0.55U
<0.42U
<0.4U
<0.42U
0.74B
0.56B
1B
2B
5.1B
2.3B
5.1B
NA
NA
3
NA
NA
13.8
19.5
17.4
44.2
18.7
18.6
23
9.3
21.6
25.9
19.3
14.8
9.6
22.5
57.9
29
130
303
126
246
8.2
70
NA
41.6
7.24
76.3
127
68.2
92.5
126
170
105
92.1
127
217
174
158
52.3
109
101
116
139
144
127
126
NA
NA
NA
NA
NA
0.32B
0.38B
0.2B
0.23B
0.27B
0.36B
0.24B
0.32B
0.3B
0.47B
0.39B
0.39B
0.11B
0.29B
0.27B
0.36B
0.24B
0.26B
0.25B
0.21B
NA
NA
NA
NA
NA
<0.053U
<0.053U
<0.062U
0.074B
<0.062U
<0.065U
<0.063U
<0.059U
<0.057U
<0.086U
<0.066U
<0.063U
0.069B
0.12B
0.62
<0.068U
0.96
2.8
1.2
1.8
1.2
9.6
0.6
4.21
0.676
2050
1650
1430
2070
1820
2130
1950
1900
2040
2990
2330
2310
1240
1710
1820
2300
2180
2740
2230
1750
NA
NA
NA
NA
NA
45.6
5.2
12.9
6.1
7
8.1
9.7
24.9
11.5
10.7
10.1
15.3
2.3
9
10
24.3
10.4
10.9
9.9
8.3
81
370
37
160
52.3
6.4
6.3
3.7B
4.7B
5.7
8.2
4.6B
6
5.7
9.6
8
8.2
1.9B
5.1B
5.2
7.9
6.9
6.5
6.2
6.4
NA
NA
NA
NA
NA
2.5
3.1
1.3B
2.1B
2.4B
3
2.9
2.4B
10.6
7.8
3.5
7.7
1.5B
12.2
7.7
8.9
18.1
28
18.6
30
34
270
36
108
18.7
40000
11600
15400
12400
14500
18800
15200
29900
19100
24600
22000
25300
5650
16100
16900
33700
21600
18900
19000
18300
NA
NA
NA
NA
NA
4.4
4.9
4.1
6.3
6.4
4.9
3.8
4.4
5.3
6.7
4.3
5.7
2.2
8
52.4
9.5
38.2
148
44.3
121
47
218
35
112
30.2
1520
3330
1600
3390
3530
5550
2600
2220
3080
6100
5160
5210
1370
2840
3130
3490
4790
3460
4030
3380
NA
NA
NA
NA
NA
162
159
171
203
187
343
169
156
202
342
277
283
100
177
177
193
364
611
360
560
NA
NA
1100
NA
NA
<0.019U
<0.02U
<0.019U
<0.021U
<0.021U
0.027B
<0.023U
0.037B
0.087
0.12
0.05
0.058
<0.019U
0.07
0.031B
0.034B
0.11
0.32
0.12
0.12
0.15
0.71
0.2
0.696
0.13
5.5
4.3
2.2B
2.7B
3.2B
4.4
3.1B
4.3
3.6B
5.7B
4.4
4.8
1.1B
3.2B
3.2B
5.2
6.2
7.6
6.5
7.3
21
51.6
18
42.8
15.9
950
2020
1070
1320
2190
3000
1630
1420
2100
3870
3500
3330
762
2000
1920
2410
2840
2400
2550
2340
NA
NA
NA
NA
NA
0.88
0.34B
0.43B
0.35B
0.5B
0.57
0.41B
0.63
0.4B
0.73
0.37B
0.34B
0.29B
0.63
0.4B
0.58
0.44B
0.8
0.42B
0.63
NA
NA
NA
NA
NA
0.22B
0.58B
<0.094U
0.86B
0.64B
0.54B
<0.094U
0.24B
0.83B
0.63B
1.9
0.73B
<0.1U
0.49B
1
0.92B
1.8
7.9
4.9
6.3
1
3.7
4.5
1.77
0.733
<41.6U
<41.9U
96.8B
120B
<48.9U
<50.9U
76B
<46.8U
<44.8U
<68U
<52.2U
<49.8U
230B
79.7B
<44.1U
<53.2U
<45.2U
70.2B
<45.9U
79.5B
NA
NA
NA
NA
NA
1.8
<0.25U
<0.29U
<0.31U
<0.29U
0.5B
<0.29U
1.1
0.3B
0.44B
0.59B
0.69B
<0.31U
<0.33U
0.51B
1.4
0.69B
<0.67U
0.73B
0.76B
NA
NA
NA
NA
NA
154
28.5
50.2
29.5
36.6
45.3
45.9
113
57.5
61.9
58.5
76.2
13
46
51.2
117
52.1
43
45.9
38.3
NA
NA
NA
NA
NA
23
43.7
21.8
34
41.9
63.3
38.7
35.6
62.6
94.2
57.7
58.1
20.7
50.2
75.1
64.9
150
186
148
151
150
410
123
271
124TEL
CriteriaComparison
PEL
OR
ER-M
ER-L
ST-RSD-54
GRAN
Stream Samples
ST-RSD-53
ST-PSD-54
ST-PSD-53
ST-RSD-10
CENT
ST-RSD-09
ST-PSD-10
ST-PSD-09
ST-RSD-08
TILL
ST-RSD-07
ST-PSD-08
ST-PSD-07
ST-RSD-06
SHER
ST-RSD-05
ST-PSD-06
ST-PSD-05
ST-RSD-04
CAPM
ST-RSD-03
ST-PSD-04
ST-PSD-03
ZIN
C
TAL Metals, mg/kg
VA
NA
DIU
M
TH
AL
LIU
M
SOD
IUM
SIL
VE
R
SEL
EN
IUM
POT
ASS
IUM
NIC
KE
L
MER
CU
RY
MA
NG
AN
ESE
MA
GN
ESI
UM
LE
AD
IRO
N
CO
PPE
R
CO
BA
LT
CH
RO
MIU
M, T
OT
AL
CA
LC
IUM
CA
DM
IUM
BE
RY
LL
IUM
BA
RIU
M
AR
SEN
IC
AN
TIM
ON
Y
AL
UM
INU
M
Sample No.
Granite Creek SI ReportTable 3
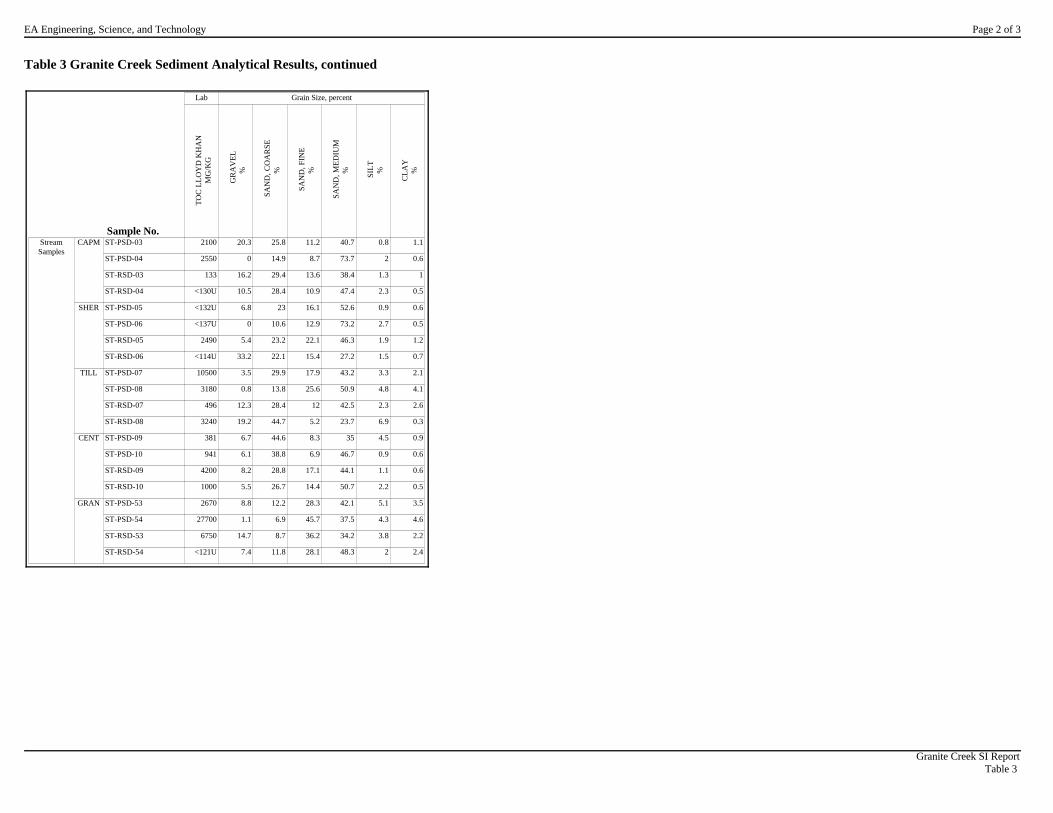
Page 2 of 3EA Engineering, Science, and Technology
Table 3 Granite Creek Sediment Analytical Results, continued
2100
2550
133
<130U
<132U
<137U
2490
<114U
10500
3180
496
3240
381
941
4200
1000
2670
27700
6750
<121U
20.3
0
16.2
10.5
6.8
0
5.4
33.2
3.5
0.8
12.3
19.2
6.7
6.1
8.2
5.5
8.8
1.1
14.7
7.4
25.8
14.9
29.4
28.4
23
10.6
23.2
22.1
29.9
13.8
28.4
44.7
44.6
38.8
28.8
26.7
12.2
6.9
8.7
11.8
11.2
8.7
13.6
10.9
16.1
12.9
22.1
15.4
17.9
25.6
12
5.2
8.3
6.9
17.1
14.4
28.3
45.7
36.2
28.1
40.7
73.7
38.4
47.4
52.6
73.2
46.3
27.2
43.2
50.9
42.5
23.7
35
46.7
44.1
50.7
42.1
37.5
34.2
48.3
0.8
2
1.3
2.3
0.9
2.7
1.9
1.5
3.3
4.8
2.3
6.9
4.5
0.9
1.1
2.2
5.1
4.3
3.8
2
1.1
0.6
1
0.5
0.6
0.5
1.2
0.7
2.1
4.1
2.6
0.3
0.9
0.6
0.6
0.5
3.5
4.6
2.2
2.4ST-RSD-54
GRAN
Stream Samples
ST-RSD-53
ST-PSD-54
ST-PSD-53
ST-RSD-10
CENT
ST-RSD-09
ST-PSD-10
ST-PSD-09
ST-RSD-08
TILL
ST-RSD-07
ST-PSD-08
ST-PSD-07
ST-RSD-06
SHER
ST-RSD-05
ST-PSD-06
ST-PSD-05
ST-RSD-04
CAPM
ST-RSD-03
ST-PSD-04
ST-PSD-03
CL
AY
%
Grain Size, percent
SIL
T%
SA
ND
, ME
DIU
M%
SA
ND
, FIN
E%
SA
ND
, CO
AR
SE%
G
RA
VE
L%
TO
C L
LO
YD
KH
AN
MG
/KG
Lab
Sample No.
Granite Creek SI ReportTable 3

Page 3 of 3EA Engineering, Science, and Technology
Table 3 Granite Creek Sediment Analytical Results, continued
NotesBold, shaded results indicate concentrations above the lowest applicable comparison criterion. Cyanide (total) was analyzed for but not detected in any sample.
U = Analyte was analyzed for but not detected.B = Analyte was detected at a concentration between the method detection limit (MDL) and practical quantitation limit (PQL).
NA = Not available.Units:
MG/KG = Milligrams per kilogram
Comparison Criteria - Threshold Effects Level (TEL) and Probable Effects Level (PEL) from USEPA National Sediment Quality Survey, Screening
Values for Chemicals Evaluated, http://www.epa.gov/waterscience/cs/vol1/appdx_d.pdf.- Effects Range-Low (ER-L) and Effects Range-Medium (ER-M), National Oceanic and Atmospheric Administration (NOAA),
from USEPA (1997) National Sediment Quality Survey, Screening Values for Chemicals Evaluated.- ODEQ (1998) Guidance for Ecological Risk Assessment, Level II Screening Values for freshwater sediment (there was no
criterion for total arsenic; therefore, the most conservative criterion, for arsenic 3, was used).
Sediment samples analyzed for clay minerology were collected in pool habitat only.
Oak Ridge National Laboratory values are not included; they are compiled from TEL and ER-L values, and USEPA Assessment and Remediation of Contaminated Sediment (ARCS) program values which exceed TELs.
Granite Creek SI ReportTable 3

Page 1 of 4EA Engineering, Science, and Technology
Table 4 Granite Creek Surface and Subsurface Soil Analytical Results
24400
26400
31200
19400
13300
6180
1110
4220
3190
3740
10600
4680
4800
12500
15600
10400
14900
17500
11900
11600
9660
3550
8350
11700
11100
11100
10900
17600
100000
NA
NA
NA
50
0.84B
<0.38U
<0.4U
<0.33U
4B
368
78.3
11.6
2.5B
5B
241
5.8B
5.3B
0.68B
0.38B
2B
0.61B
0.94B
6
1.6B
2.4B
1.3B
1.7B
1.8B
1.3B
5.9B
2.3B
1.8B
410
21
31
5
5
4.5
3.4
5.5
11.4
73
7500
4470
860
616
573
11400
355
544
6.3
10.1
198
17.5
26
81.8
58.6
88
183
156
35.7
27.4
295
150
106
1.6
37
0.4
9.9
8
288
187
268
319
322
129
51.7
189
69.8
149
73.2
166
176
155
180
177
167
269
188
201
177
32.8
138
206
124
223
179
225
67000
NA
5500
283
85
1.2
0.72
1
0.55
0.32B
0.25B
0.033B
0.087B
0.26B
0.25B
0.3B
0.23B
0.25B
0.38B
0.48
0.5
0.44
0.55
0.48
0.2B
0.2B
0.43B
0.29B
0.21B
0.2B
0.28B
0.29B
0.3B
1900
NA
0.1
10
10
0.43B
0.35B
0.54
<0.026U
0.65
8.1
0.22B
<0.064U
8.5
1.4
23.4
0.52
1.1
<0.03U
<0.027U
14.1
<0.025U
<0.027U
0.63
6.2
3.4
2.8
7.5
1.9
0.36B
3.4
2.2
1.1
450
29
78
4
4
1830
1130
2110
2080
3050
1610
308B
523B
5980
5570
3610
10100
7180
1940
2850
6320
905
1930
2920
3480
2600
26500
3120
1830
1380
2110
2270
1900
NA
NA
NA
NA
NA
31.3
5.7
6.2
27.4
8.4
7.7
2.3
3.6
2.3
3.5
2.1
3.3
4.4
5.2
8.4
5.5
9.7
8.6
6.7
8.8
5.9
1.4
4.3
6.8
9.8
10.4
8.4
13.3
450
5
270
0.4
NA
11.3
5.5
6.7
10.2
10.4
1.6B
0.6B
3.6B
5B
6.4
2.7B
6.4
6.6
8
9.1
7.4
9.6
10.5
8.6
8.8
8.2
4.7
6.7
8.2
7.2
8.5
8.1
9.9
1900
32
NA
20
20
30.7
8.9
15.4
11
14.2
80
26.6
12.5
7.4
14.6
698
8
18.2
3.3
5.5
43.5
11
10.2
30.5
10.4
27.5
14.4
32.3
15.2
12.6
56.2
30.6
16.3
41000
61
NA
60
50
24600
10800
12400
17700
32000
16300
16500
21500
13600
18900
16300
18800
20900
16300
19700
20700
19600
20600
20100
22900
20000
19300
23800
21300
16900
31400
26500
28200
100000
NA
NA
NA
NA
8.4
3.8
5.9
6.3
27.5
1350
856
31.3
15
12.4
2120
36.9
25
2.8
3.6
44.1
4.2
10.4
15.6
40.9
375
52.2
120
27.8
9.9
358
53
22.9
750
NA
400
40.5
16
2630
880
1560
4930
5730
678
212B
2270
2450
3690
3200
4100
4940
5180
5320
2980
4560
6310
5200
6290
4330
1740
3220
5880
4650
4860
3450
6300
NA
NA
NA
NA
NA
837
429
156
610
730
100
30.9
115
691
757
321
511
776
408
270
504
321
444
782
579
556
890
660
603
378
1260
833
697
19000
NA
NA
NA
100
0.14
0.032B
0.035B
0.027B
56
3.1
0.37
0.5
0.51
0.14
784
0.61
0.33
0.058
0.026B
0.3
0.064
0.048
0.36
0.12
0.38
0.21
0.1
0.029B
0.12
0.27
0.19
0.12
310
NA
NA
0.00051
0.1
23.4
5.2
5.6
23.4
7.3
2.5B
2.2B
2.6B
4.7
4.8
3.2B
4.6
6
3.8B
4.3
4.1
4.8
5.3
5.2
5.7
4.3
4
3.9B
5.2
6.9
9.6
8
9.7
20000
NA
1600
30
30
1570
848
1140
3920
4270
2550
836
2950
1650
2010
3480
2920
2730
3720
4080
3240
3560
4900
3320
3490
2610
1410
1980
3820
2750
2840
1770
4030
NA
NA
NA
NA
NA
0.76
0.61
0.42B
0.24B
1.1
1.6
0.86
0.83
0.7
0.9
0.75
0.61
0.99
0.24B
<0.31U
0.4B
0.4B
0.24B
0.48
0.45B
0.84
0.78
1.1
0.95
0.52
1.6
1
1
5100
NA
390
0.21
1
0.26B
0.28B
0.62B
0.48B
1.8
156
48
21.2
1.5
7.1
319
11.6
6.4
0.28B
0.63B
4.2
0.79B
1.4
32.5
0.29B
1.8
1.2
2.2
<0.24U
<0.21U
2.7
1.9
0.28B
5100
NA
390
2
2
806
1220
1450
1180
1080
370B
193B
557
<23.6U
385B
3240
516
478
982
1100
122B
1060
1330
676
927
590
38.5B
271B
947
805
787
425B
1040
NA
NA
NA
NA
NA
0.97
<0.28U
<0.29U
<0.24U
2.5
1.1B
<0.46U
0.57B
1.2
1.5
1.6
1.7
1.8
<0.28U
<0.25U
0.45B
<0.23U
<0.26U
0.76B
0.98B
1.8
2
2.3
1.6
0.34B
3.3
2.5
1.3
67
NA
NA
1
1
47.8
24.9
26.5
47.2
66.2
15.6
5.1B
26.1
15
24.7
14.9
25.4
30.3
40.6
52.2
33.9
52.2
58.5
50.8
51.6
36.5
11.7
34.5
51.8
44.2
96.1
59.4
73.7
7200
NA
550
2
2
105
50.2
43.2
61.3
211
432
65
55
857
107
2410
107
130
41.8
48.6
495
50.5
66.9
87.8
297
322
183
356
157
63.2
203
137
96.2
100000
120
23000
8.5
50OR-Ecological
CriteriaComparison
Oak Ridge
EPA-Human Health
EPA-Ecological
EPA Industrial PRG
WP-SUS-32(4.0)
CENT
On Site
WP-SUS-31(4.5)
WP-SSS-31(0.5)
TA-SUS-33(1.5)
WP-SUS-27(4.5)
TILL
WP-SUS-26(3.0)
WP-SSS-28(0.8)
WP-SSS-27(0.8)
TA-SSS-30(0.4)
WP-SUS-23(3.5)
SHER TA-SUS-25(1.5)
WP-SUS-39(2.0)
CAPM
WP-SUS-21(2.5)
WP-SUS-20(4.0)
TA-SUS-22(1.5)
WP-SUS-15(4.0)
MONU
WP-SUS-14(3.5)
WP-SSS-17(1.0)
WP-SSS-15(0.5)
WP-SSS-14(0.7)
WP-SSS-13(1.0)
ML-SSS-38(0.5)
ML-SSS-16(0.5)
ML-SSS-12(0.7)
BG-SSS-36(0.5)
GRAN
Background
BG-SSS-35(0.5)
BG-SSS-34(0.5)
BG-SSS-19(0.5)LUCA
ZIN
C
TAL Metals, mg/kg
VA
NA
DIU
M
TH
AL
LIU
M
SOD
IUM
SIL
VE
R
SEL
EN
IUM
POT
ASS
IUM
NIC
KE
L
MER
CU
RY
MA
NG
AN
ESE
MA
GN
ESI
UM
LE
AD
IRO
N
CO
PPE
R
CO
BA
LT
CH
RO
MIU
M, T
OT
AL
CA
LC
IUM
CA
DM
IUM
BE
RY
LL
IUM
BA
RIU
M
AR
SEN
IC
AN
TIM
ON
Y
AL
UM
INU
M
Sample No.
Granite Creek SI ReportTable 4
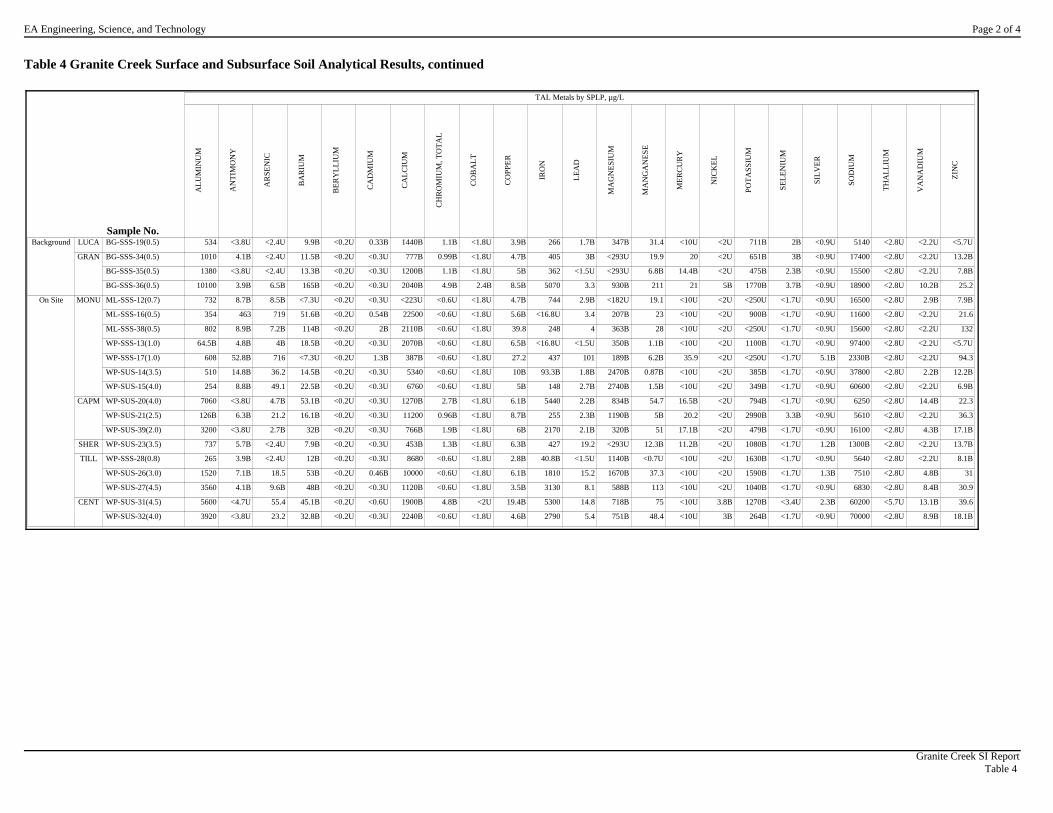
Page 2 of 4EA Engineering, Science, and Technology
Table 4 Granite Creek Surface and Subsurface Soil Analytical Results, continued
534
1010
1380
10100
732
354
802
64.5B
608
510
254
7060
126B
3200
737
265
1520
3560
5600
3920
<3.8U
4.1B
<3.8U
3.9B
8.7B
463
8.9B
4.8B
52.8B
14.8B
8.8B
<3.8U
6.3B
<3.8U
5.7B
3.9B
7.1B
4.1B
<4.7U
<3.8U
<2.4U
<2.4U
<2.4U
6.5B
8.5B
719
7.2B
4B
716
36.2
49.1
4.7B
21.2
2.7B
<2.4U
<2.4U
18.5
9.6B
55.4
23.2
9.9B
11.5B
13.3B
165B
<7.3U
51.6B
114B
18.5B
<7.3U
14.5B
22.5B
53.1B
16.1B
32B
7.9B
12B
53B
48B
45.1B
32.8B
<0.2U
<0.2U
<0.2U
<0.2U
<0.2U
<0.2U
<0.2U
<0.2U
<0.2U
<0.2U
<0.2U
<0.2U
<0.2U
<0.2U
<0.2U
<0.2U
<0.2U
<0.2U
<0.2U
<0.2U
0.33B
<0.3U
<0.3U
<0.3U
<0.3U
0.54B
2B
<0.3U
1.3B
<0.3U
<0.3U
<0.3U
<0.3U
<0.3U
<0.3U
<0.3U
0.46B
<0.3U
<0.6U
<0.3U
1440B
777B
1200B
2040B
<223U
22500
2110B
2070B
387B
5340
6760
1270B
11200
766B
453B
8680
10000
1120B
1900B
2240B
1.1B
0.99B
1.1B
4.9B
<0.6U
<0.6U
<0.6U
<0.6U
<0.6U
<0.6U
<0.6U
2.7B
0.96B
1.9B
1.3B
<0.6U
<0.6U
<0.6U
4.8B
<0.6U
<1.8U
<1.8U
<1.8U
2.4B
<1.8U
<1.8U
<1.8U
<1.8U
<1.8U
<1.8U
<1.8U
<1.8U
<1.8U
<1.8U
<1.8U
<1.8U
<1.8U
<1.8U
<2U
<1.8U
3.9B
4.7B
5B
8.5B
4.7B
5.6B
39.8
6.5B
27.2
10B
5B
6.1B
8.7B
6B
6.3B
2.8B
6.1B
3.5B
19.4B
4.6B
266
405
362
5070
744
<16.8U
248
<16.8U
437
93.3B
148
5440
255
2170
427
40.8B
1810
3130
5300
2790
1.7B
3B
<1.5U
3.3
2.9B
3.4
4
<1.5U
101
1.8B
2.7B
2.2B
2.3B
2.1B
19.2
<1.5U
15.2
8.1
14.8
5.4
347B
<293U
<293U
930B
<182U
207B
363B
350B
189B
2470B
2740B
834B
1190B
320B
<293U
1140B
1670B
588B
718B
751B
31.4
19.9
6.8B
211
19.1
23
28
1.1B
6.2B
0.87B
1.5B
54.7
5B
51
12.3B
<0.7U
37.3
113
75
48.4
<10U
20
14.4B
21
<10U
<10U
<10U
<10U
35.9
<10U
<10U
16.5B
20.2
17.1B
11.2B
<10U
<10U
<10U
<10U
<10U
<2U
<2U
<2U
5B
<2U
<2U
<2U
<2U
<2U
<2U
<2U
<2U
<2U
<2U
<2U
<2U
<2U
<2U
3.8B
3B
711B
651B
475B
1770B
<250U
900B
<250U
1100B
<250U
385B
349B
794B
2990B
479B
1080B
1630B
1590B
1040B
1270B
264B
2B
3B
2.3B
3.7B
<1.7U
<1.7U
<1.7U
<1.7U
<1.7U
<1.7U
<1.7U
<1.7U
3.3B
<1.7U
<1.7U
<1.7U
<1.7U
<1.7U
<3.4U
<1.7U
<0.9U
<0.9U
<0.9U
<0.9U
<0.9U
<0.9U
<0.9U
<0.9U
5.1B
<0.9U
<0.9U
<0.9U
<0.9U
<0.9U
1.2B
<0.9U
1.3B
<0.9U
2.3B
<0.9U
5140
17400
15500
18900
16500
11600
15600
97400
2330B
37800
60600
6250
5610
16100
1300B
5640
7510
6830
60200
70000
<2.8U
<2.8U
<2.8U
<2.8U
<2.8U
<2.8U
<2.8U
<2.8U
<2.8U
<2.8U
<2.8U
<2.8U
<2.8U
<2.8U
<2.8U
<2.8U
<2.8U
<2.8U
<5.7U
<2.8U
<2.2U
<2.2U
<2.2U
10.2B
2.9B
<2.2U
<2.2U
<2.2U
<2.2U
2.2B
<2.2U
14.4B
<2.2U
4.3B
<2.2U
<2.2U
4.8B
8.4B
13.1B
8.9B
<5.7U
13.2B
7.8B
25.2
7.9B
21.6
132
<5.7U
94.3
12.2B
6.9B
22.3
36.3
17.1B
13.7B
8.1B
31
30.9
39.6
18.1BWP-SUS-32(4.0)
CENT
On Site
WP-SUS-31(4.5)
WP-SUS-27(4.5)
TILL
WP-SUS-26(3.0)
WP-SSS-28(0.8)
WP-SUS-23(3.5)SHER
WP-SUS-39(2.0)
CAPM
WP-SUS-21(2.5)
WP-SUS-20(4.0)
WP-SUS-15(4.0)
MONU
WP-SUS-14(3.5)
WP-SSS-17(1.0)
WP-SSS-13(1.0)
ML-SSS-38(0.5)
ML-SSS-16(0.5)
ML-SSS-12(0.7)
BG-SSS-36(0.5)
GRAN
Background
BG-SSS-35(0.5)
BG-SSS-34(0.5)
BG-SSS-19(0.5)LUCA
ZIN
C
TAL Metals by SPLP, µg/L
VA
NA
DIU
M
TH
AL
LIU
M
SOD
IUM
SIL
VE
R
SEL
EN
IUM
POT
ASS
IUM
NIC
KE
L
MER
CU
RY
MA
NG
AN
ESE
MA
GN
ESI
UM
LE
AD
IRO
N
CO
PPE
R
CO
BA
LT
CH
RO
MIU
M, T
OT
AL
CA
LC
IUM
CA
DM
IUM
BE
RY
LL
IUM
BA
RIU
M
AR
SEN
IC
AN
TIM
ON
Y
AL
UM
INU
M
Sample No.
Granite Creek SI ReportTable 4

Page 3 of 4EA Engineering, Science, and Technology
Table 4 Granite Creek Surface and Subsurface Soil Analytical Results, continued
5.9
6.4
6.7
6.6
6.4
4.6
3.5
4
8.4
7.8
6.8
8.6
8.5
7.1
7.4
8
4.9
6.8
7
6.9
6.6
8.6
6.6
7.4
7
6.5
7.2
6.7
none
none
none
none
none
none
none
none
none
slight
slight
none
none
none
none
moderate
none
none
none
none
<0.6
<0.6
<0.6
<0.6
<0.6
2.2
5.0
1.9
3.8
14.4
17.5
<0.6
7.8
<0.6
<0.6
23.1
5.3
<0.6
<0.6
<0.6
-6.0
-5.0
-5.0
0.5
3.7
-4.5
-6.0
-0.5
3.5
31.7
18.2
3.3
11.0
-1.3
4.8
86.4
8.7
2.2
2.5
2.2
5.7
6.0
6.4
6.3
6.5
4.7
3.2
4.2
6.3
8.1
7.8
7.2
7.7
5.1
7.2
8.0
7.0
7.5
7.1
7.0
<0.01
<0.01
<0.01
<0.01
<0.01
0.28
0.24
0.07
0.02
<0.01
<0.01
<0.01
<0.01
<0.01
<0.01
<0.01
0.01
<0.01
<0.01
<0.01
< .02
< .02
< .02
< .02
<0.02
0.07
0.16
0.06
0.12
0.46
0.56
< .02
0.25
< .02
< .02
0.74
0.17
< .02
< .02
< .02
< .02
< .02
< .02
< .02
< .02
0.35
0.4
0.13
0.14
0.46
0.56
< .02
0.25
< .02
< .02
0.74
0.18
< .02
< .02
< .02
-6.0
-5.0
-5.0
0.5
3.7
-6.7
-11.0
-2.4
-0.3
17.3
0.7
3.3
3.2
-1.3
4.8
63.3
3.4
2.2
2.5
2.2WP-SUS-32(4.0)
CENT
On Site
WP-SUS-31(4.5)
WP-SSS-31(0.5)
TA-SUS-33(1.5)
WP-SUS-27(4.5)
TILL
WP-SUS-26(3.0)
WP-SSS-28(0.8)
WP-SSS-27(0.8)
TA-SSS-30(0.4)
WP-SUS-23(3.5)
SHER TA-SUS-25(1.5)
WP-SUS-39(2.0)
CAPM
WP-SUS-21(2.5)
WP-SUS-20(4.0)
TA-SUS-22(1.5)
WP-SUS-15(4.0)
MONU
WP-SUS-14(3.5)
WP-SSS-17(1.0)
WP-SSS-15(0.5)
WP-SSS-14(0.7)
WP-SSS-13(1.0)
ML-SSS-38(0.5)
ML-SSS-16(0.5)
ML-SSS-12(0.7)
BG-SSS-36(0.5)
GRAN
Background
BG-SSS-35(0.5)
BG-SSS-34(0.5)
BG-SSS-19(0.5)LUCA
NE
T N
EU
TR
AL
IZA
TIO
N
POT
EN
TIA
LK
G C
AC
O3/
TO
N
Acid/Base Accounting
TO
TA
L S
UL
FUR
WT
.%
SUL
FID
E S
UL
FUR
WT
.%
SUL
FAT
E S
UL
FUR
WT
.%
PAST
E P
HPH
UN
ITS
NE
UT
RA
LIZ
AT
ION
PO
TE
NT
IAL
KG
CA
CO
3/T
ON
MA
XIM
UM
PO
TE
NT
IAL
AC
IDIT
YK
G C
AC
O3/
TO
N
FIZ
Z R
AT
ING
NO
UN
ITS
PHPH
UN
ITS
Lab
Sample No.
Granite Creek SI ReportTable 4

Page 4 of 4EA Engineering, Science, and Technology
Table 4 Granite Creek Surface and Subsurface Soil Analytical Results, continued
NotesBold, shaded results indicate concentrations above the lowest applicable comparison criterion. Cyanide (total) was anaylzed for but not detected in any sample.
U = Analyte was analyzed for but not detected.B = Analyte was detected at a concentration between the method detection limit (MDL) and practical quantitation limit (PQL).
NA = Not available.Empty cells in the table indicate no data.
Units:MG/KG = Milligrams per kilogram
UG/L = Micrograms per liter
Comparison Criteria - OR Ecological - ODEQ (1998) Guidance for Ecological Risk Assessment, Level II Screening Values - lowest criteria for bird, plant, invertebrate, and
mammal. - EPA Ecological - EPA (2000b) Ecological Soil Screening Levels - Lowest Criteria Indicators for bird, plant, invertebrate, and mammal.- Oak Ridge National Laboratory, US DOE (Efroymson et al 1997), Preliminary Remediation Goals (PRGs) for protection of plants, wildlife, or soil
invertebrates.-
EPA Human Health Criteria - Generic Soil Screening Levels (SSLs) for Protection of Human Heath EPA (2000a). - EPA Region 9 PRGS for industrial soil (http://www.epa.gov/region09/waste/sfund/prg/index.htm).
Granite Creek SI ReportTable 4

Page 1 of 1EA Engineering, Science, and Technology
Table 5 Granite Creek Plant Tissue Analytical Results
72.7
143
312
213
220
206
257
153
284
251
<1.3U
<1.2U
<1.3U
<1.1U
10.6
6.1
<1.2U
<1.3U
1B
<1.4U
252
341
368
505
86.3
51.9B
231
247
272
290
0.12B
0.071B
0.12B
0.054B
0.16B
0.13B
0.096B
0.11B
0.087B
0.13B
<0.16U
0.37B
<0.16U
<0.13U
1B
0.78B
<0.15U
0.5B
2.6
0.85B
12400
13300
10400
17300
12000
9750
12700
12200
20000
17800
<0.37U
<0.36U
<0.37U
<0.31U
<0.38U
<0.38U
<0.36U
<0.37U
0.48B
1.7B
5.7B
4.3B
4.6B
4.8B
5B
5.1B
4.6B
4.6B
5
6.1B
132
181
315
247
642
535
262
197
427
409
1.1
1.1
0.91
0.38B
2.7
1.2
0.5B
1.3
2.7
2.1
4330
4280
4290
4570
4640
4500
4030
4690
4120
5310
238
262
202
324
118
169
162
291
158
191
<0.051U
<0.045U
<0.052U
<0.045U
<0.052U
<0.046U
0.063B
0.05B
0.07B
0.092B
16500
16800
19600
16200
15900
14900
15900
16700
13700
15100
1.4
<0.86U
1.2B
0.95B
<0.92U
<0.93U
<0.87U
0.91B
0.7B
<0.97U
330B
311B
340B
285B
381B
428B
289B
370B
262B
338B
<0.52U
<0.51U
0.94B
0.6B
1.2B
0.95B
0.76B
0.81B
0.9B
0.97B
21.4
18.1
14.2
13.4
53.6
35.9
16.7
27.2
70.2
43.7WP-PLT-31CENT
On Site
WP-PLT-27TILL
WP-PLT-23SHER
WP-PLT-20CAPM
WP-PLT-15
MONU WP-PLT-14
BG-PLT-36
GRAN
Background
BG-PLT-35
BG-PLT-34
BG-PLT-19LUCA
ZIN
C
TAL Metals, mg/kg
VA
NA
DIU
M
SOD
IUM
SEL
EN
IUM
POT
ASS
IUM
MER
CU
RY
MA
NG
AN
ESE
MA
GN
ESI
UM
LE
AD
IRO
N
CO
PPE
R
CH
RO
MIU
M, T
OT
AL
CA
LC
IUM
CA
DM
IUM
BE
RY
LL
IUM
BA
RIU
M
AR
SEN
IC
AL
UM
INU
M
Sample No.
NotesCyanide was analyzed for but was not detected in any sample.The following metals were analyzed for but not detected in any sample: antimony, cobalt, nickel, silver, and thallium.
U = Analyte was analyzed for but not detected.B = Analyte was detected at a concentration between the method detection limit (MDL) and practical quantitation limit (PQL).
Units:MG/KG = Milligrams per kilogram
Granite Creek SI ReportTable 5