sir christopher gent vodafone group plc vodafone contract net additions as a percentage of total net...
TRANSCRIPT


Sir Christopher GentChief Executive
Vodafone Group Plc

Agenda• Overview of the results• Analysis of results• Group funding• KPIs and business drivers• Major operational initiatives• Global products and services• Vodafone’s prospects
Sir Christopher Gent
Ken Hydon
Julian Horn-Smith
Thomas Geitner
Sir Christopher Gent
Results Overview• Statutory results:
– Exclude full consolidation of JT and J-Phone– Control only acquired after period close
• Proportionate results:– Include JT and J-Phone at levels of ownership
throughout period
Excellent financial performance and verystrong growth
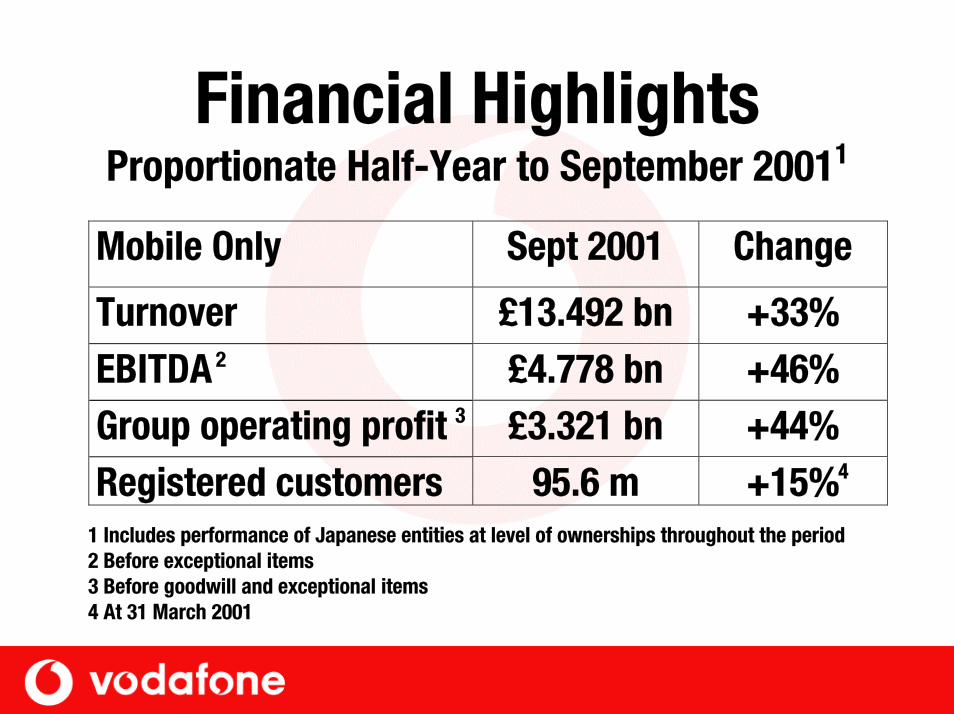
Financial HighlightsProportionate Half-Year to September 20011
Mobile Only Sept 2001 Change
Turnover £13.492 bn +33%EBITDA £4.778 bn +46%Group operating profit £3.321 bn +44%Registered customers 95.6 m +15%
1 Includes performance of Japanese entities at level of ownerships throughout the period2 Before exceptional items3 Before goodwill and exceptional items4 At 31 March 2001
2
3
4
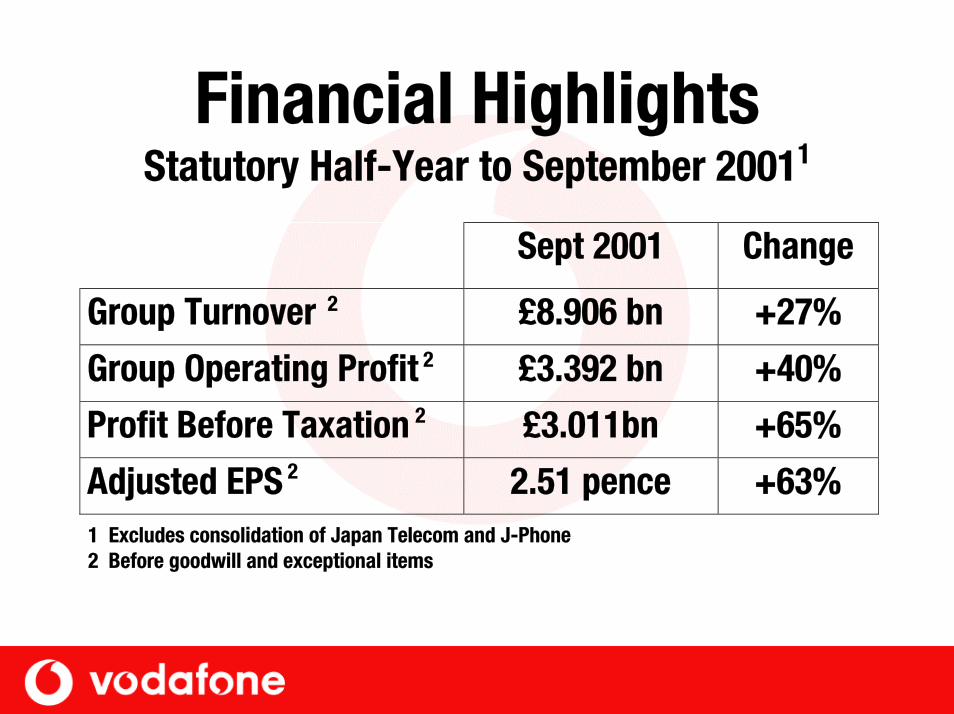
Financial HighlightsStatutory Half-Year to September 20011
Sept 2001 Change
Group Turnover £8.906 bn +27%
Group Operating Profit £3.392 bn +40%
Profit Before Taxation £3.011bn +65%
Adjusted EPS 2.51 pence +63%1 Excludes consolidation of Japan Telecom and J-Phone2 Before goodwill and exceptional items
2
2
2
2
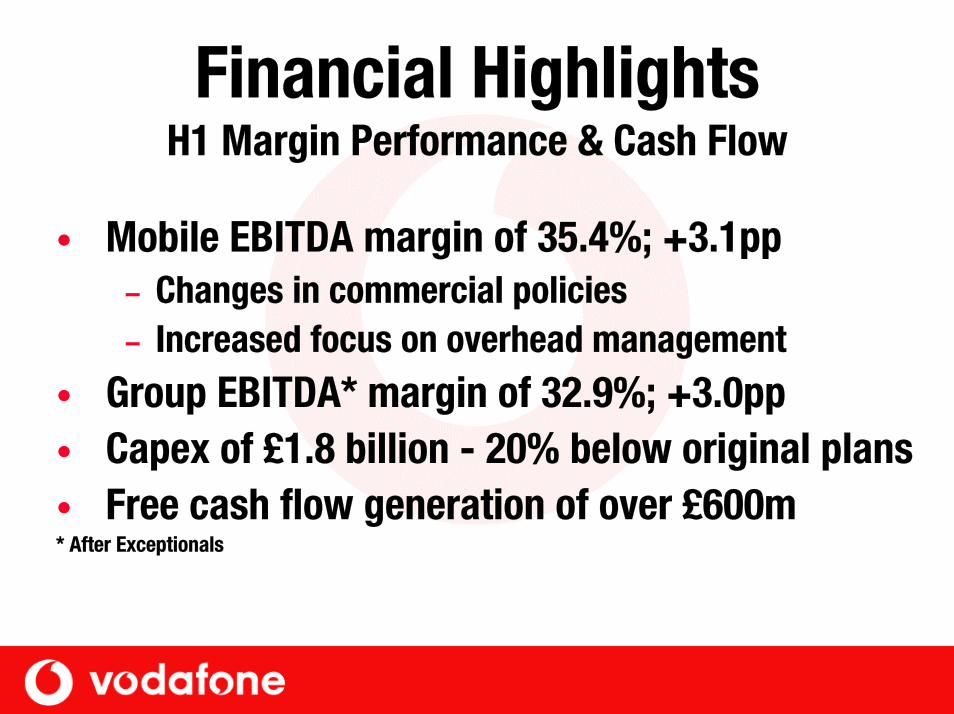
Financial HighlightsH1 Margin Performance & Cash Flow
• Mobile EBITDA margin of 35.4%; +3.1pp– Changes in commercial policies– Increased focus on overhead management
• Group EBITDA* margin of 32.9%; +3.0pp • Capex of £1.8 billion - 20% below original plans• Free cash flow generation of over £600m* After Exceptionals
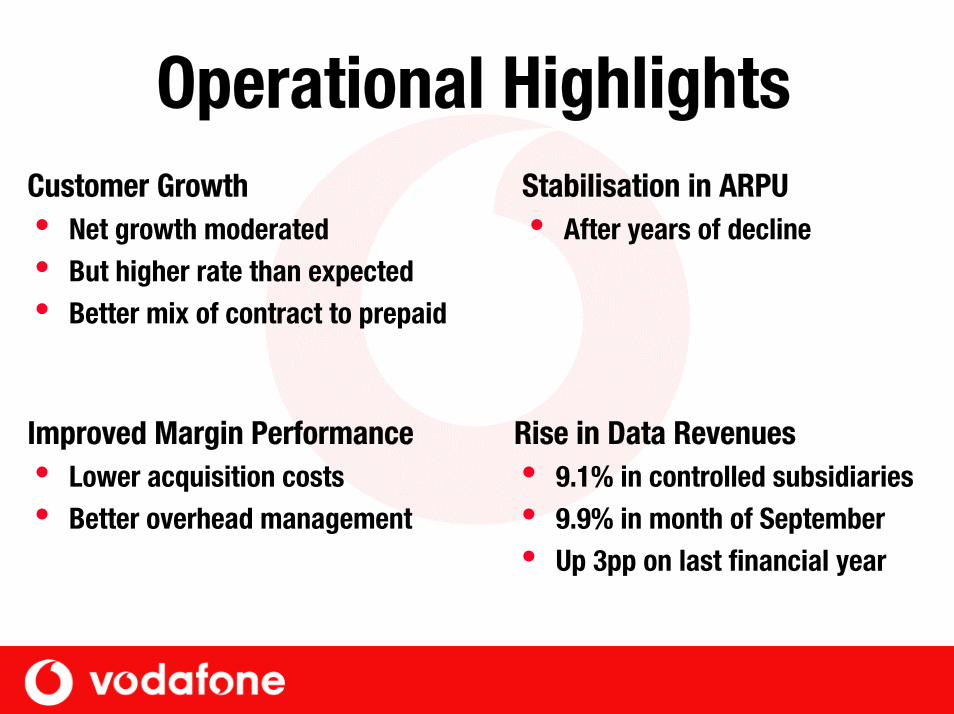
Improved Margin Performancei Lower acquisition costsi Better overhead management
Rise in Data Revenuesi 9.1% in controlled subsidiariesi 9.9% in month of Septemberi Up 3pp on last financial year
Stabilisation in ARPUi After years of decline
Customer Growthi Net growth moderatedi But higher rate than expectedi Better mix of contract to prepaid
Operational Highlights
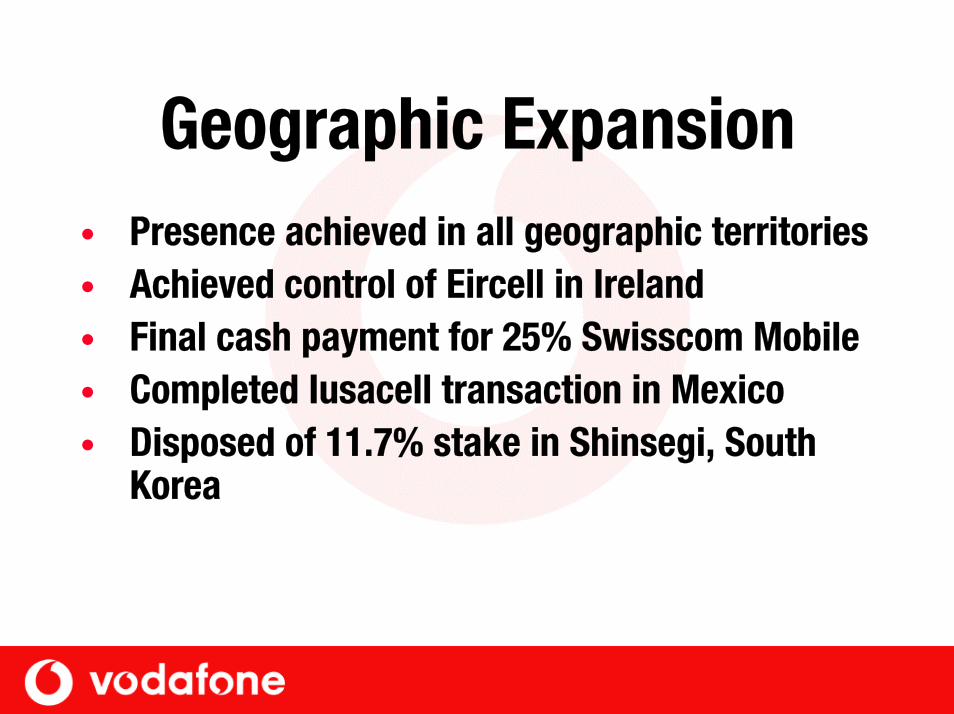
Geographic Expansion• Presence achieved in all geographic territories• Achieved control of Eircell in Ireland• Final cash payment for 25% Swisscom Mobile• Completed Iusacell transaction in Mexico• Disposed of 11.7% stake in Shinsegi, South
Korea
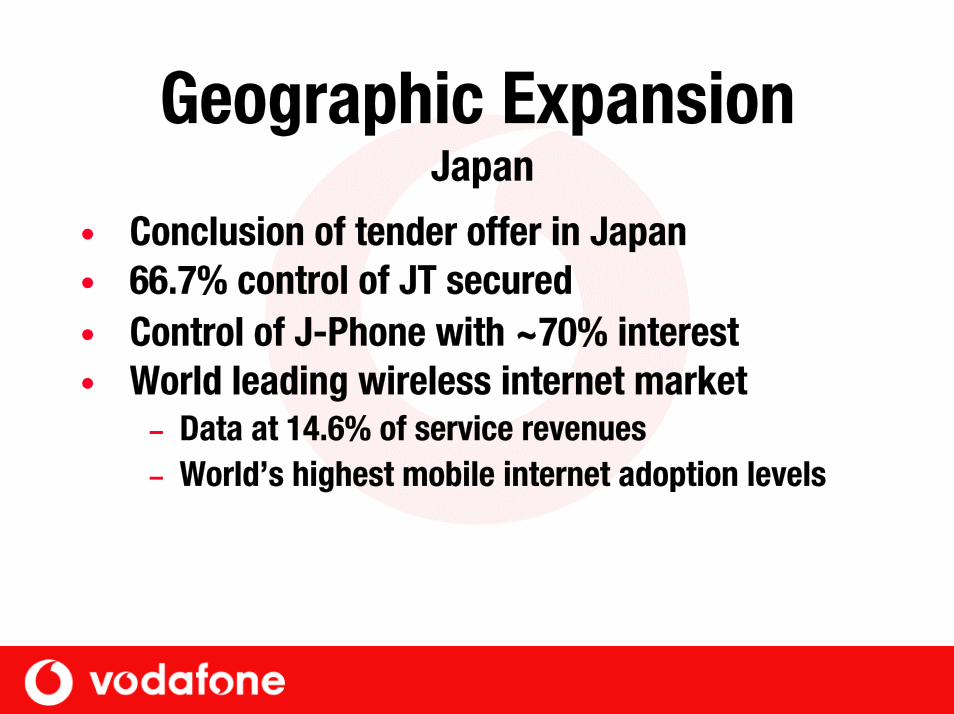
Geographic ExpansionJapan
• Conclusion of tender offer in Japan• 66.7% control of JT secured• Control of J-Phone with ~70% interest• World leading wireless internet market
– Data at 14.6% of service revenues – World’s highest mobile internet adoption levels

Ken HydonGroup Financial Director
Vodafone Group Plc
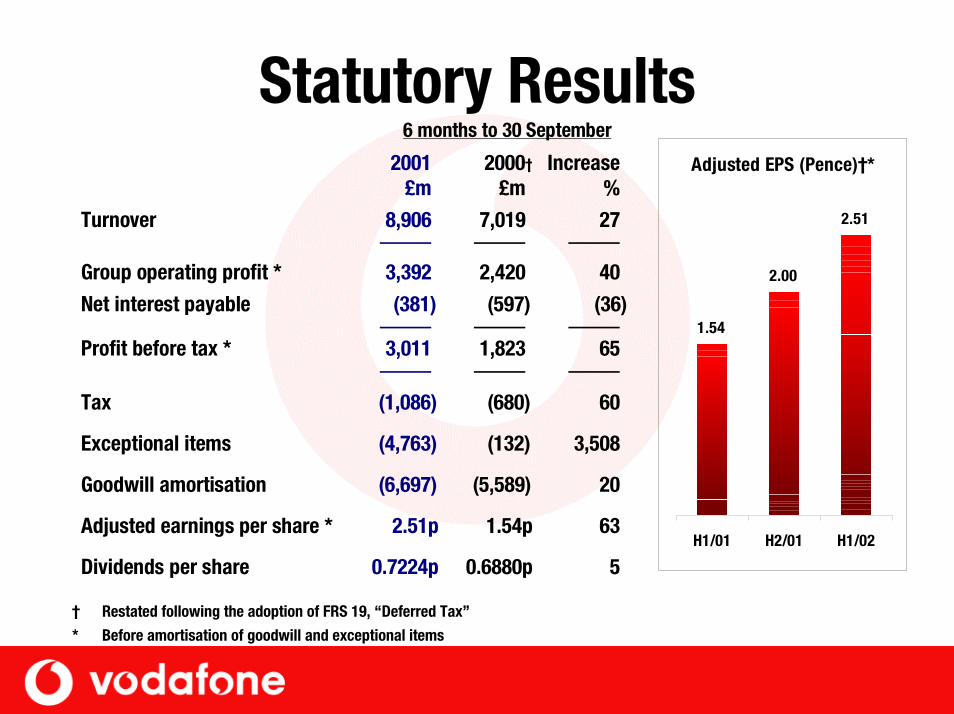
Statutory Results 6 months to 30 September
2001£m
2000†
£mIncrease
%
Turnover 8,906 7,019 27
Group operating profit * 3,392 2,420 40
Net interest payable (381) (597) (36)
Profit before tax * 3,011 1,823 65
Tax (1,086) (680) 60
Exceptional items (4,763) (132) 3,508
Goodwill amortisation (6,697) (5,589) 20
Adjusted earnings per share * 2.51p 1.54p 63
Dividends per share 0.7224p 0.6880p 5
Adjusted EPS (Pence)†*
1.54
2.00
2.51
H1/01 H2/01 H1/02
† Restated following the adoption of FRS 19, “Deferred Tax”
* Before amortisation of goodwill and exceptional items
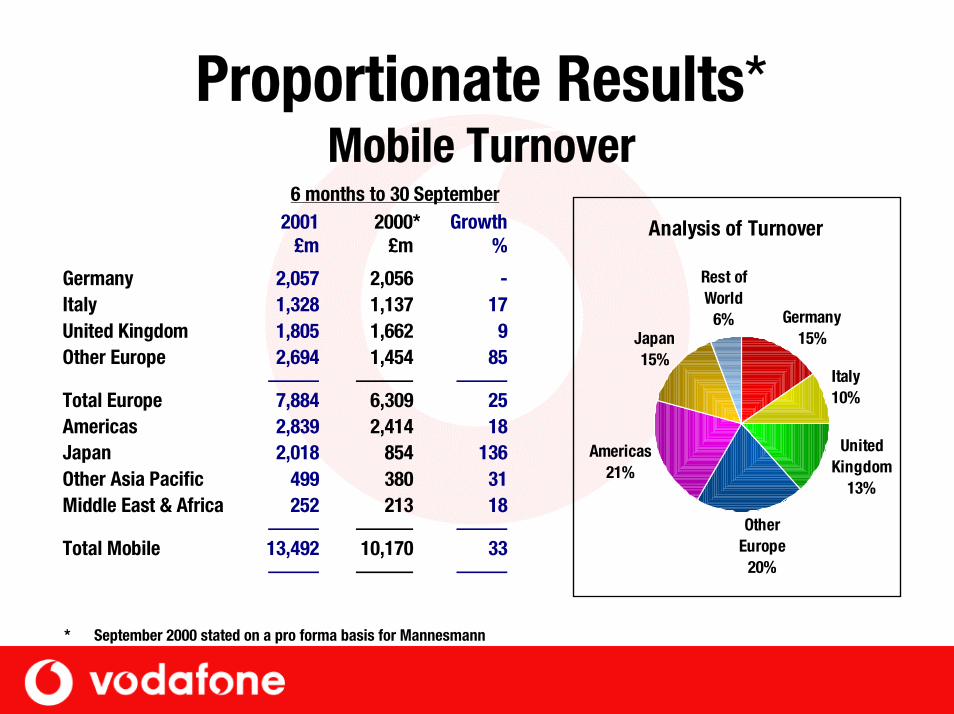
Proportionate Results*Mobile Turnover
Analysis of Turnover
Japan15%
Germany15%
Italy10%
Rest of World
6%
Americas21%
Other Europe
20%
United Kingdom
13%
6 months to 30 September2001
£m2000*
£mGrowth
%
Germany 2,057 2,056 -Italy 1,328 1,137 17United Kingdom 1,805 1,662 9Other Europe 2,694 1,454 85
Total Europe 7,884 6,309 25Americas 2,839 2,414 18Japan 2,018 854 136Other Asia Pacific 499 380 31Middle East & Africa 252 213 18
Total Mobile 13,492 10,170 33
* September 2000 stated on a pro forma basis for Mannesmann
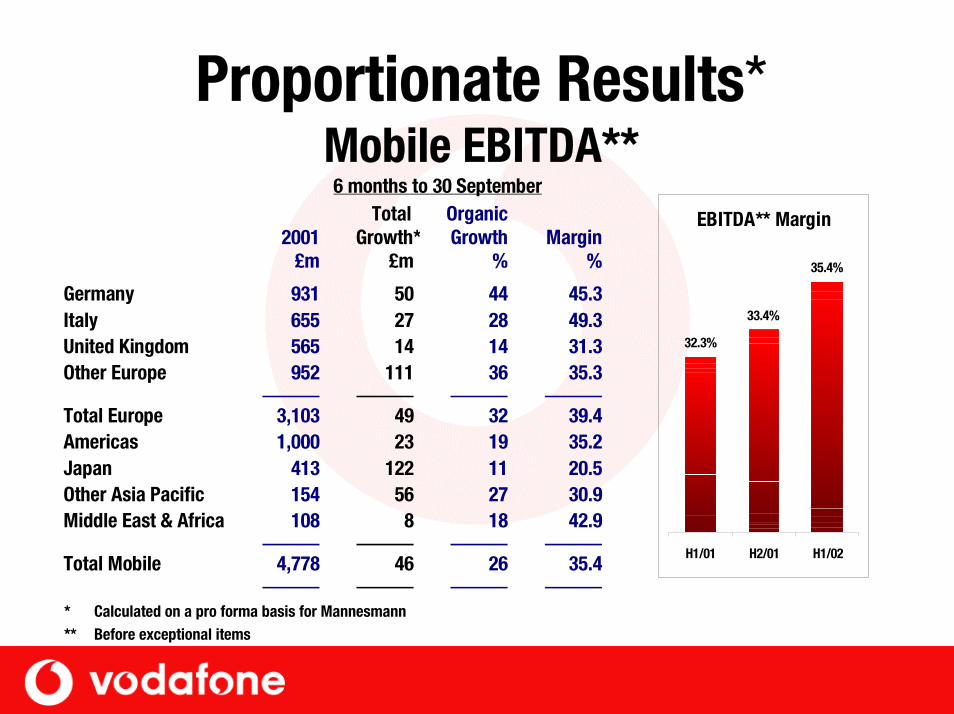
Proportionate Results*Mobile EBITDA**
6 months to 30 September
2001£m
Total Growth*
£m
OrganicGrowth
%Margin
%
Germany 931 50 44 45.3Italy 655 27 28 49.3United Kingdom 565 14 14 31.3Other Europe 952 111 36 35.3
Total Europe 3,103 49 32 39.4Americas 1,000 23 19 35.2Japan 413 122 11 20.5Other Asia Pacific 154 56 27 30.9Middle East & Africa 108 8 18 42.9
Total Mobile 4,778 46 26 35.4
* Calculated on a pro forma basis for Mannesmann** Before exceptional items
EBITDA** Margin
32.3%
33.4%
35.4%
H1/01 H2/01 H1/02
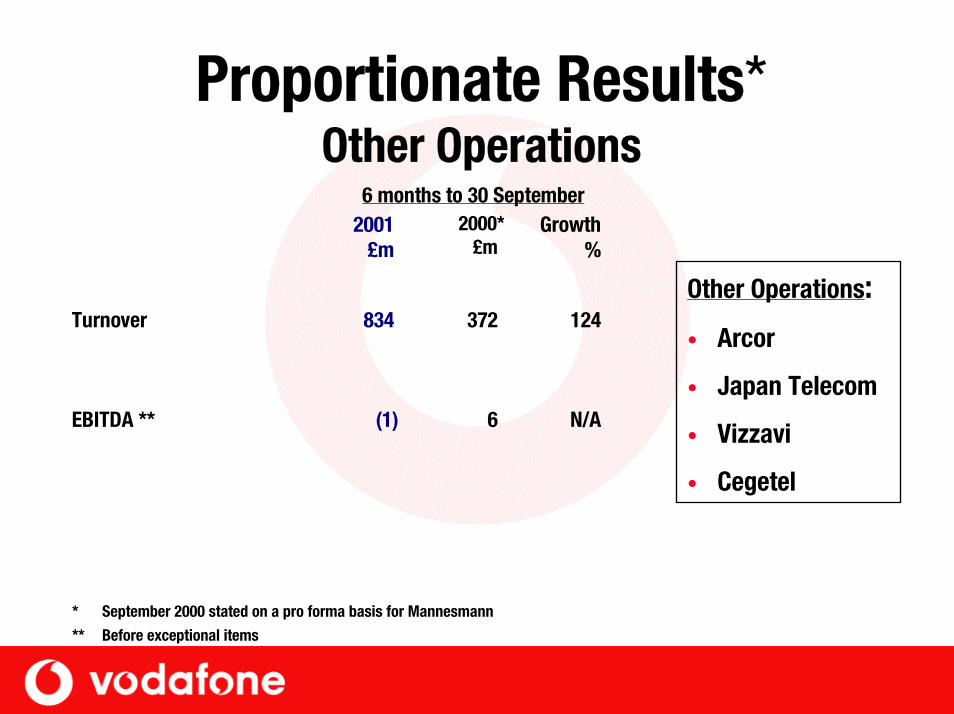
Proportionate Results*Other Operations
* September 2000 stated on a pro forma basis for Mannesmann
** Before exceptional items
6 months to 30 September2001
£m2000*
£mGrowth
%
Turnover 834 372 124
EBITDA ** (1) 6 N/A
Other Operations:
• Arcor
• Japan Telecom
• Vizzavi
• Cegetel
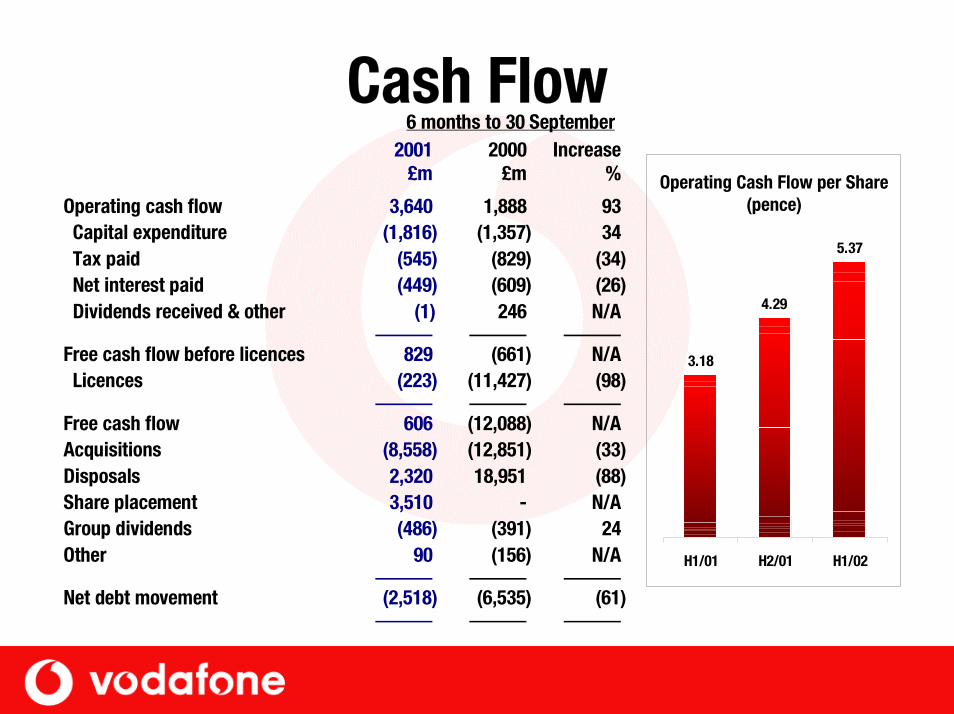
Cash Flow
3.18
4.29
5.37
H1/01 H2/01 H1/02
6 months to 30 September 2001
£m2000
£mIncrease
%
Operating cash flow 3,640 1,888 93Capital expenditure (1,816) (1,357) 34Tax paid (545) (829) (34)Net interest paid (449) (609) (26)Dividends received & other (1) 246 N/A
Free cash flow before licences 829 (661) N/ALicences (223) (11,427) (98)
Free cash flow 606 (12,088) N/AAcquisitions (8,558) (12,851) (33)Disposals 2,320 18,951 (88)Share placement 3,510 - N/AGroup dividends (486) (391) 24Other 90 (156) N/A
Net debt movement (2,518) (6,535) (61)
Operating Cash Flow per Share(pence)
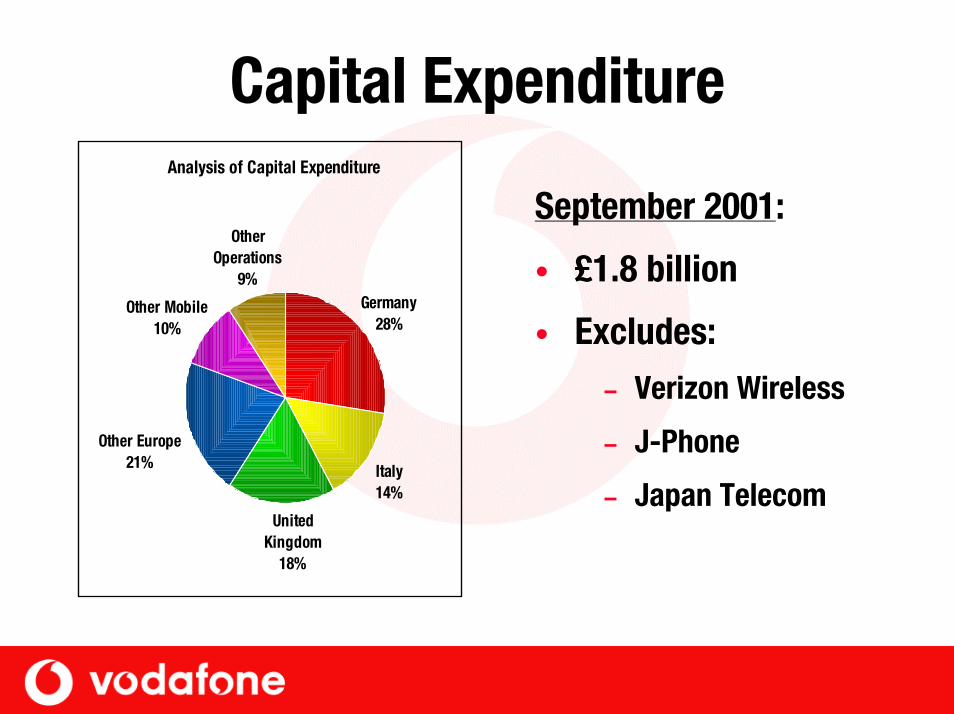
Capital ExpenditureAnalysis of Capital Expenditure
Other Operations
9%Germany
28%
Italy14%
Other Mobile10%
Other Europe21%
United Kingdom
18%
September 2001:
• £1.8 billion
• Excludes:– Verizon Wireless
– J-Phone
– Japan Telecom
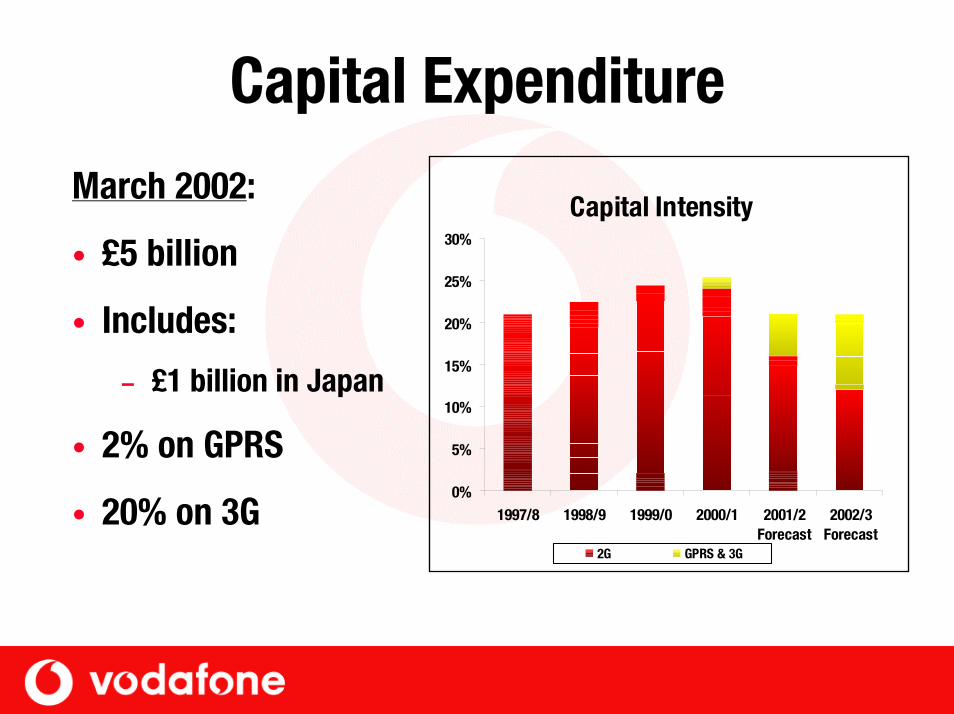
Capital Expenditure
Capital Intensity
0%
5%
10%
15%
20%
25%
30%
1997/8 1998/9 1999/0 2000/1 2001/2Forecast
2002/3Forecast
2G GPRS & 3G
March 2002:
• £5 billion
• Includes:
– £1 billion in Japan
• 2% on GPRS
• 20% on 3G
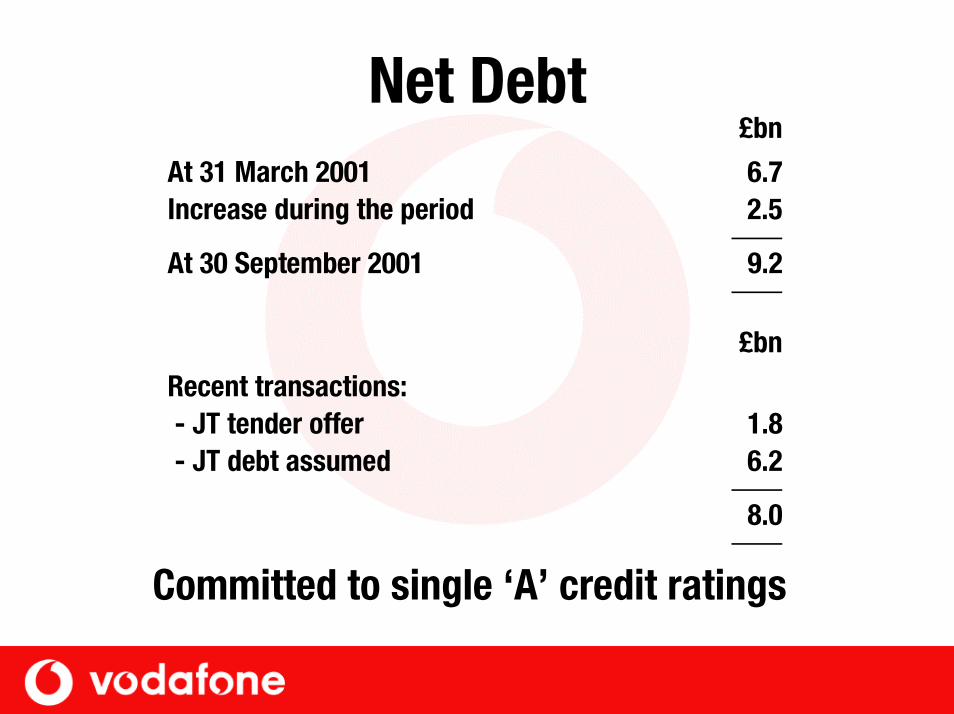
Net Debt
Committed to single ‘A’ credit ratings
£bn
At 31 March 2001 6.7Increase during the period 2.5
At 30 September 2001 9.2
£bn
Recent transactions: - JT tender offer 1.8 - JT debt assumed 6.2
8.0
Summary• Strong growth:
– EBITDA– Operating cash flow per share– Free cash flow– Earnings per share
• Financial strength
• Shareholder value

Julian Horn-SmithGroup Chief Operating Officer
Vodafone Group Plc
Realignment of Strategy• Sharpened focus on revenue growth and
margin improvement• Attracting, servicing and retaining high
value customers and effective cost control• Delivered 3 percentage point increase in
margin
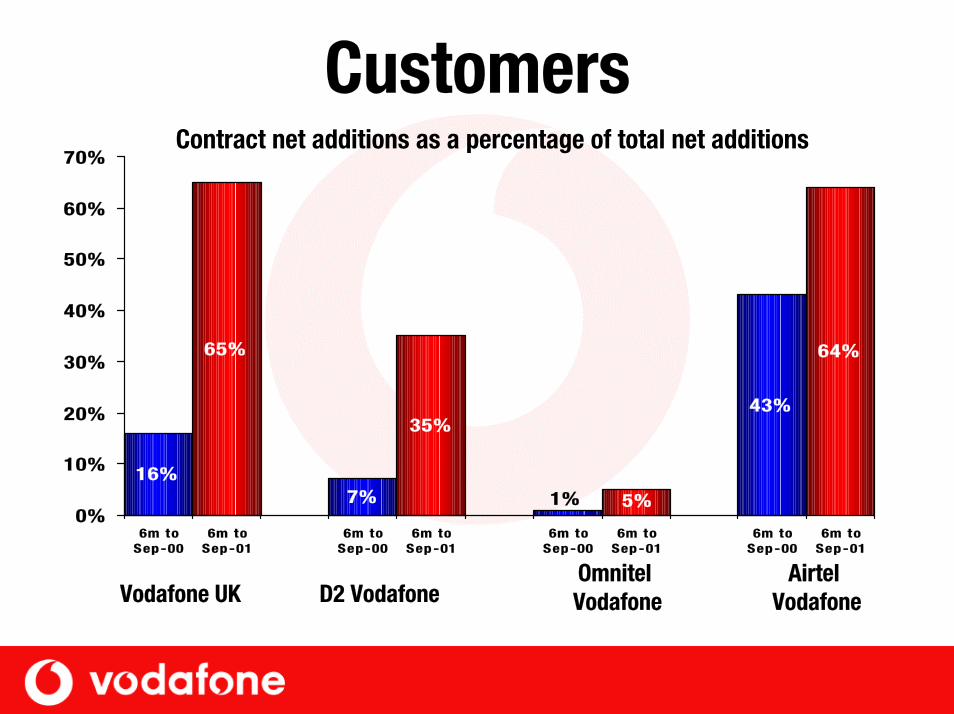
Customers
16%
65%
7%
35%43%
64%
5%1%0%
10%
20%
30%
40%
50%
60%
70%
6m toSep-00
6m toSep-01
6m toSep-00
6m toSep-01
6m toSep-00
6m toSep-01
6m toSep-00
6m toSep-01
Vodafone UK D2 VodafoneOmnitel Vodafone
Contract net additions as a percentage of total net additions
AirtelVodafone
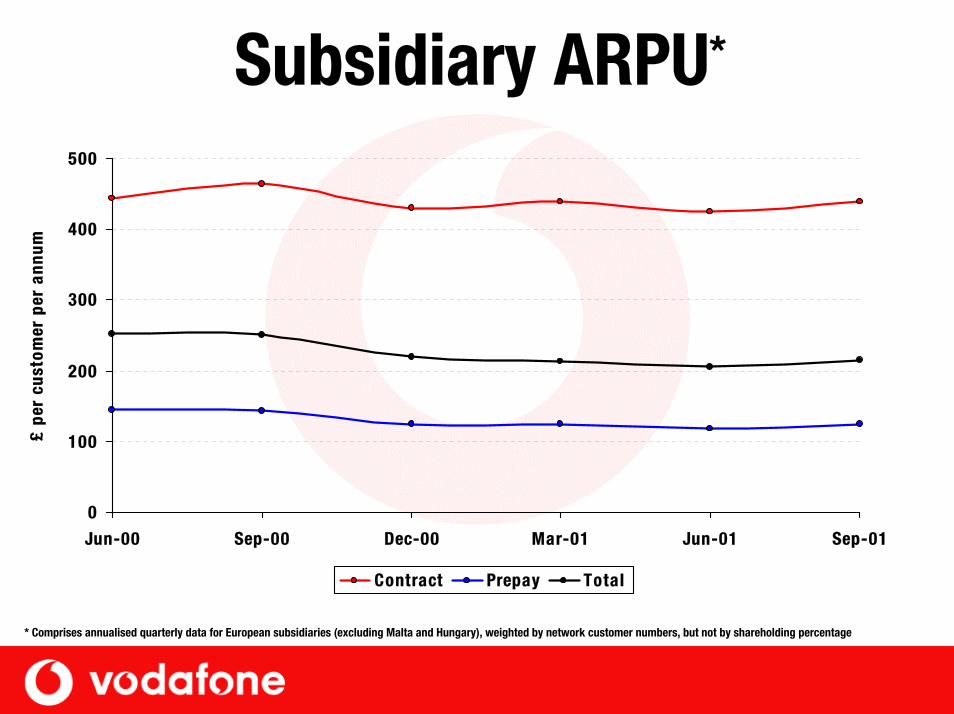
Subsidiary ARPU*
0
100
200
300
400
500
Jun-00 Sep-00 Dec-00 Mar-01 Jun-01 Sep-01
£ pe
r cu
stom
er p
er a
nnum
Contract Prepay Total
* Comprises annualised quarterly data for European subsidiaries (excluding Malta and Hungary), weighted by network customer numbers, but not by shareholding percentage
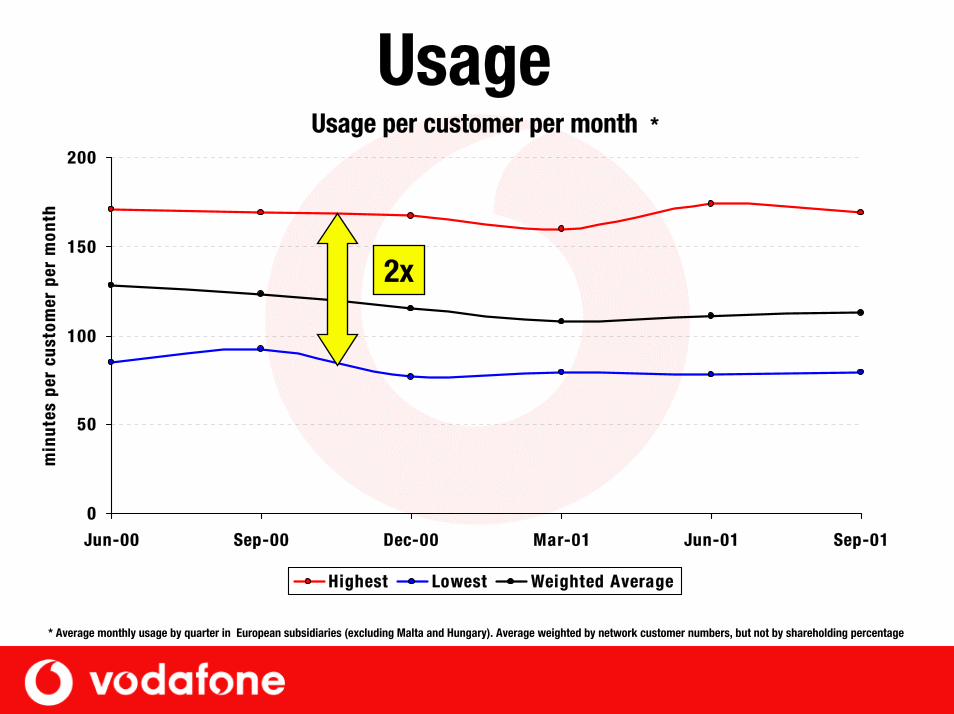
Usage
0
50
100
150
200
Jun-00 Sep-00 Dec-00 Mar-01 Jun-01 Sep-01
min
utes
per
cus
tom
er p
er m
onth
Highest Lowest Weighted Average
Usage per customer per month *
2x
* Average monthly usage by quarter in European subsidiaries (excluding Malta and Hungary). Average weighted by network customer numbers, but not by shareholding percentage
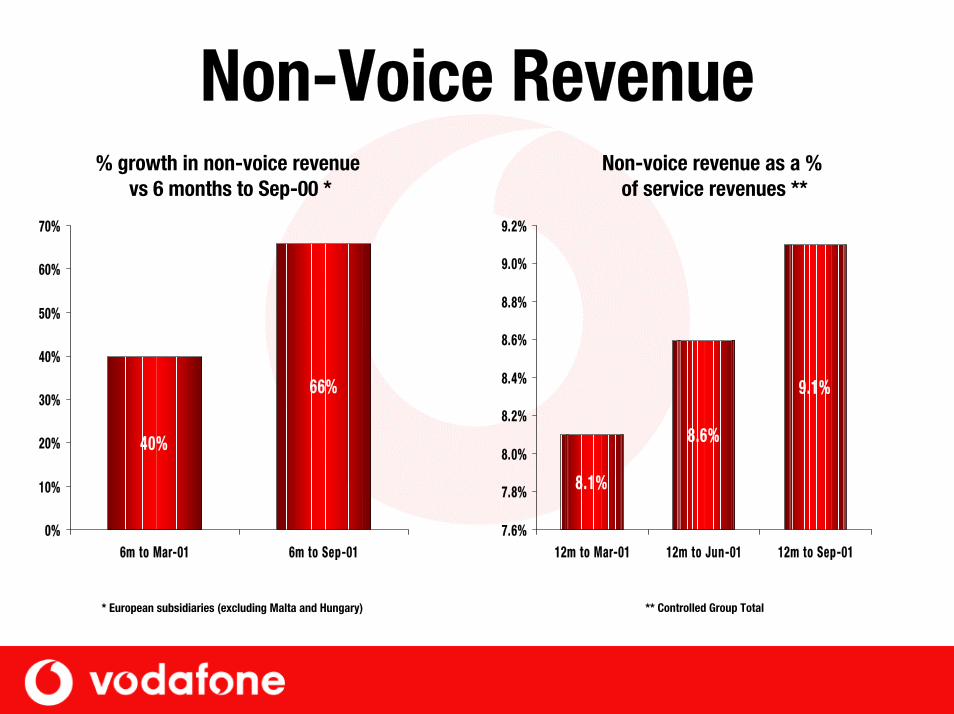
Non-Voice Revenue
40%
66%
0%
10%
20%
30%
40%
50%
60%
70%
6m to Mar-01 6m to Sep-01
Re
ve
nu
e £
m
% growth in non-voice revenue vs 6 months to Sep-00 *
* European subsidiaries (excluding Malta and Hungary)
8.1%
8.6%
9.1%
7.6%
7.8%
8.0%
8.2%
8.4%
8.6%
8.8%
9.0%
9.2%
12m to Mar-01 12m to Jun-01 12m to Sep-01
Re
ve
nu
e £
m
Non-voice revenue as a % of service revenues **
** Controlled Group Total
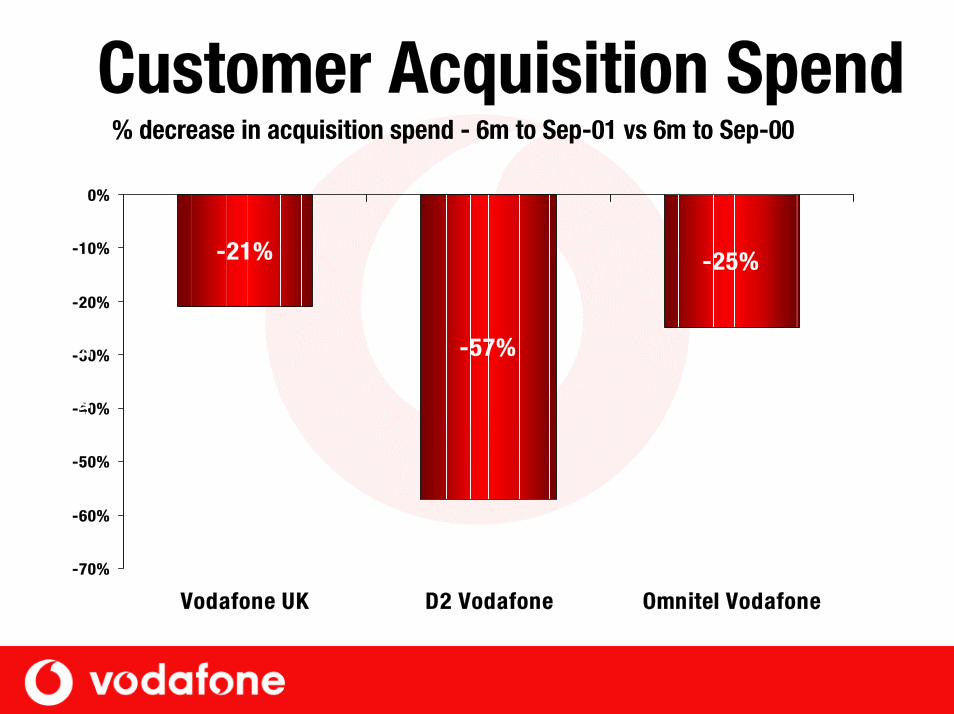
Customer Acquisition Spend% decrease in acquisition spend - 6m to Sep-01 vs 6m to Sep-00
-21%
-57%
-25%
-70%
-60%
-50%
-40%
-30%
-20%
-10%
0%
Vodafone UK D2 Vodafone Omnitel Vodafone
Reve
nue
£m
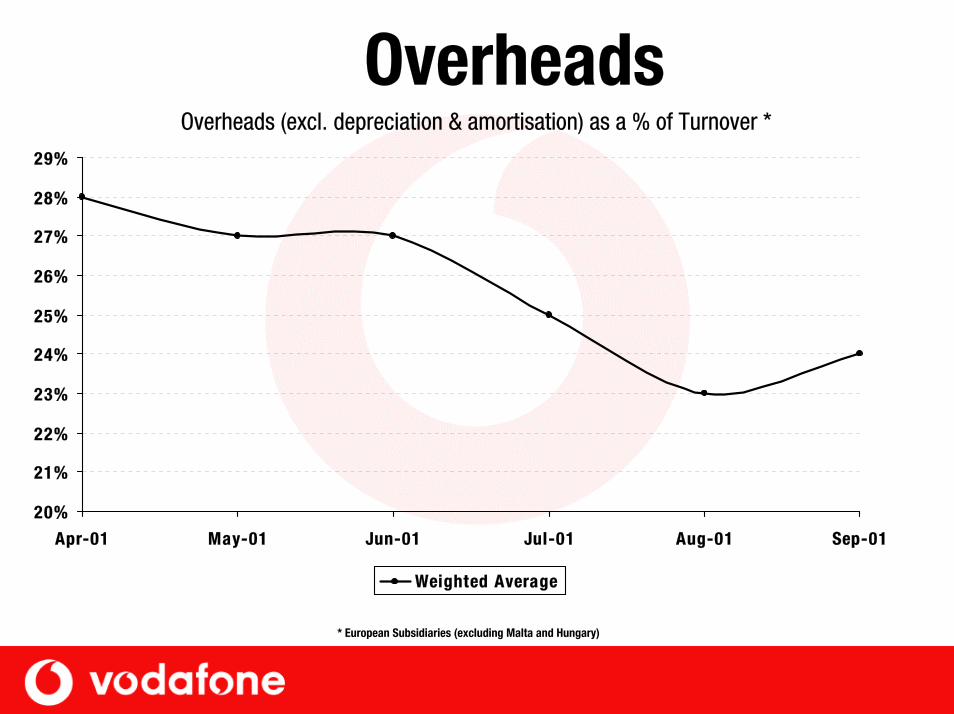
OverheadsOverheads (excl. depreciation & amortisation) as a % of Turnover *
20%
21%
22%
23%
24%
25%
26%
27%
28%
29%
Apr-01 May-01 Jun-01 Jul-01 Aug-01 Sep-01
Weighted Average
* European Subsidiaries (excluding Malta and Hungary)
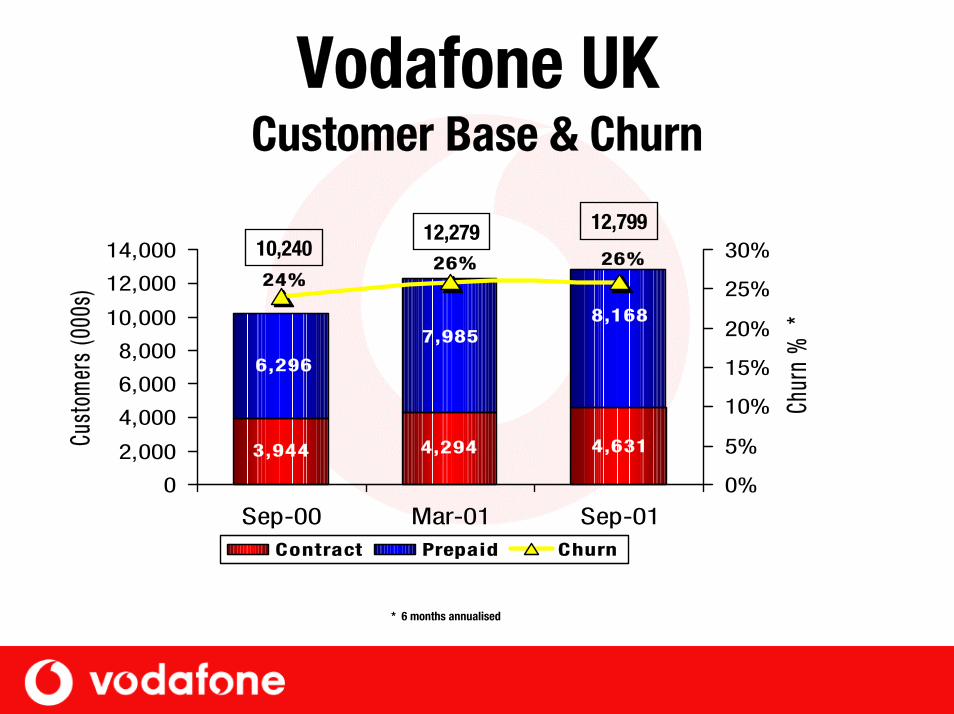
Vodafone UK Customer Base & Churn
4,6314,2943,944
7,985
6,296
8,168
26%26%24%
0
2,000
4,000
6,000
8,000
10,000
12,000
14,000
Sep-00 Mar-01 Sep-01
Cust
omer
s (0
00s)
0%
5%
10%
15%
20%
25%
30%
Chu
rn %
*
Contract Prepaid Churn
12,279 12,79910,240
* 6 months annualised
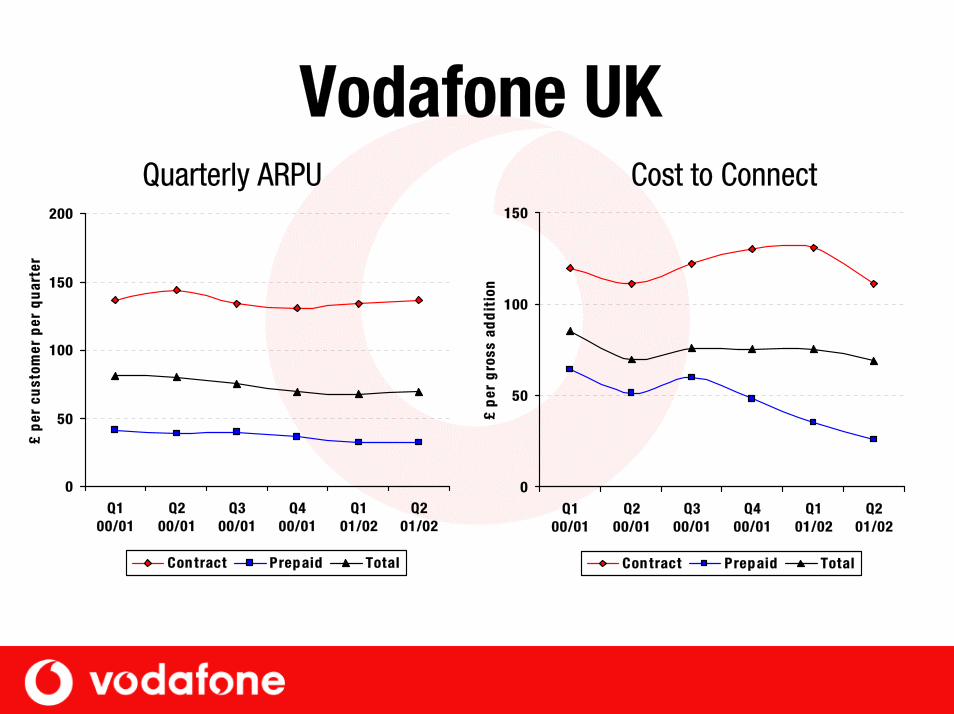
Vodafone UK
0
50
100
150
200
Q100/01
Q200/01
Q300/01
Q400/01
Q101/02
Q201/02
£ p
er c
ust
omer
per
qu
arte
r
Con tract Prepaid Total
Quarterly ARPU
0
50
100
150
Q100/01
Q200/01
Q300/01
Q400/01
Q101/02
Q201/02
£ p
er g
ross
ad
dit
ion
Con tract Prepaid Total
Cost to Connect
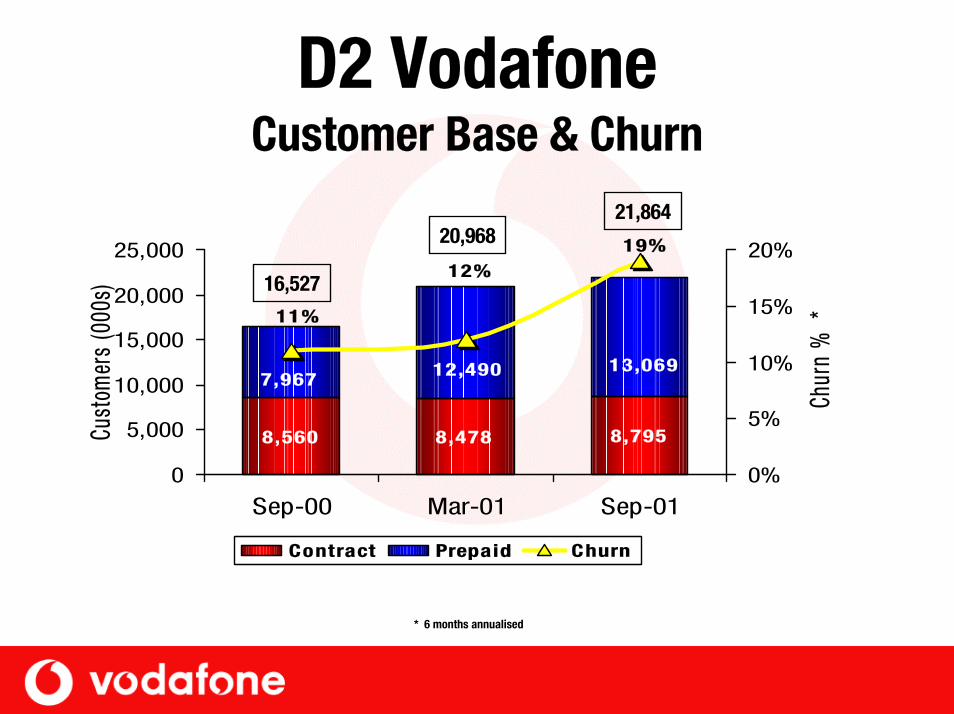
D2 Vodafone Customer Base & Churn
8,560 8,478 8,795
13,0697,967 12,490
11%
12%19%
0
5,000
10,000
15,000
20,000
25,000
Sep-00 Mar-01 Sep-01
Cust
omer
s (0
00s)
0%
5%
10%
15%
20%
Chu
rn %
*
Contract Prepaid Churn
20,96821,864
16,527
* 6 months annualised
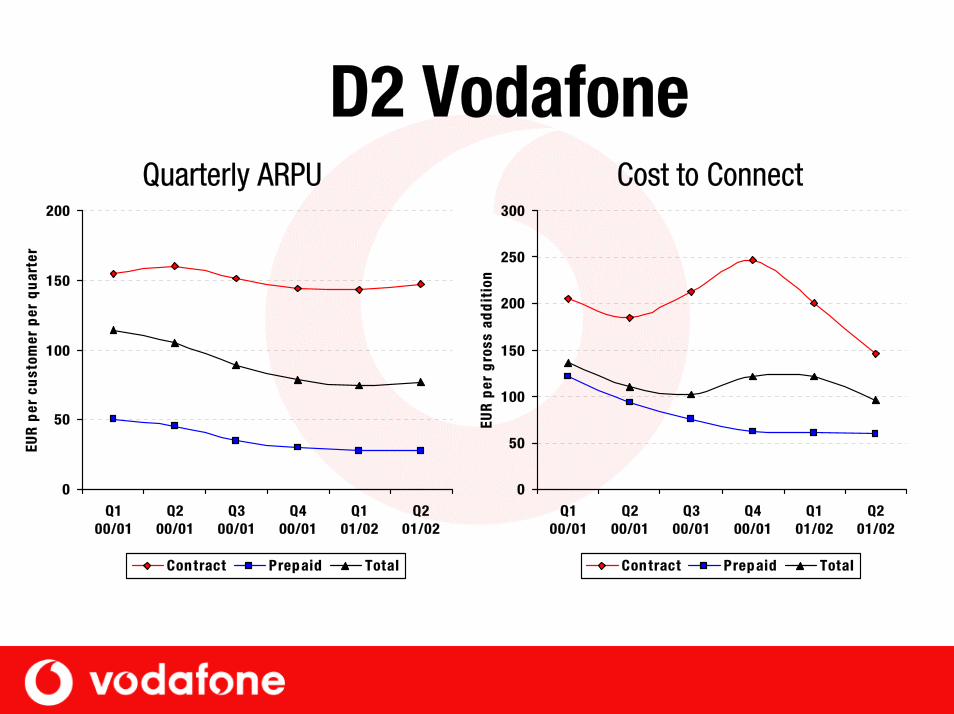
D2 Vodafone
0
50
100
150
200
Q100/01
Q200/01
Q300/01
Q400/01
Q101/02
Q201/02
EUR
per
cu
stom
er p
er q
uar
ter
Con tract Prepaid Total
Quarterly ARPU
0
50
100
150
200
250
300
Q100/01
Q200/01
Q300/01
Q400/01
Q101/02
Q201/02
EUR
per
gro
ss a
dd
itio
n
Con tract Prepaid Total
Cost to Connect
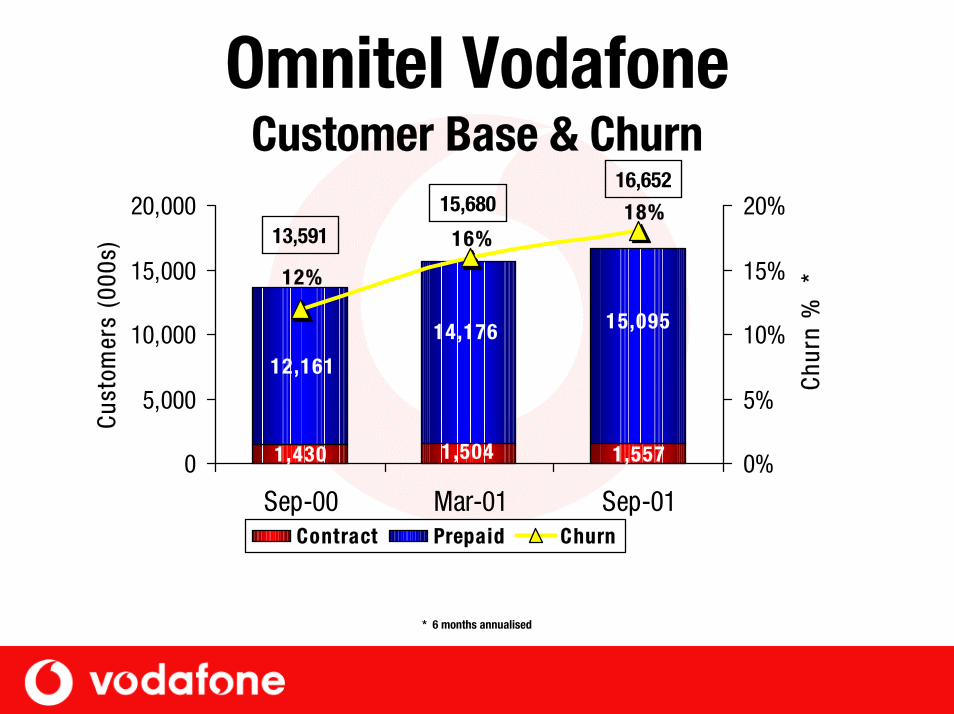
Omnitel Vodafone Customer Base & Churn
1,5571,5041,430
14,176
12,161
15,095
18%16%
12%
0
5,000
10,000
15,000
20,000
Sep-00 Mar-01 Sep-01
Cus
tom
ers
(000
s)
0%
5%
10%
15%
20%
Chu
rn %
*
Contract Prepaid Churn
15,68016,652
13,591
* 6 months annualised
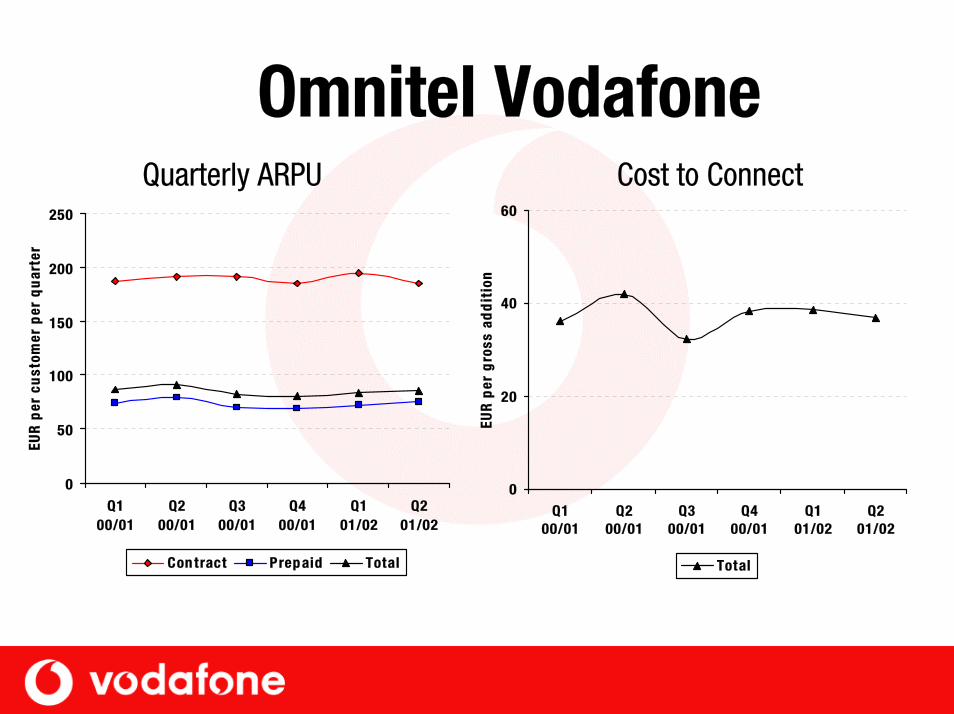
Omnitel Vodafone
0
50
100
150
200
250
Q100/01
Q200/01
Q300/01
Q400/01
Q101/02
Q201/02
EUR
per
cu
stom
er p
er q
uar
ter
Con tract Prepaid Total
Quarterly ARPU
0
20
40
60
Q100/01
Q200/01
Q300/01
Q400/01
Q101/02
Q201/02
EUR
per
gro
ss a
dd
itio
n
Total
Cost to Connect
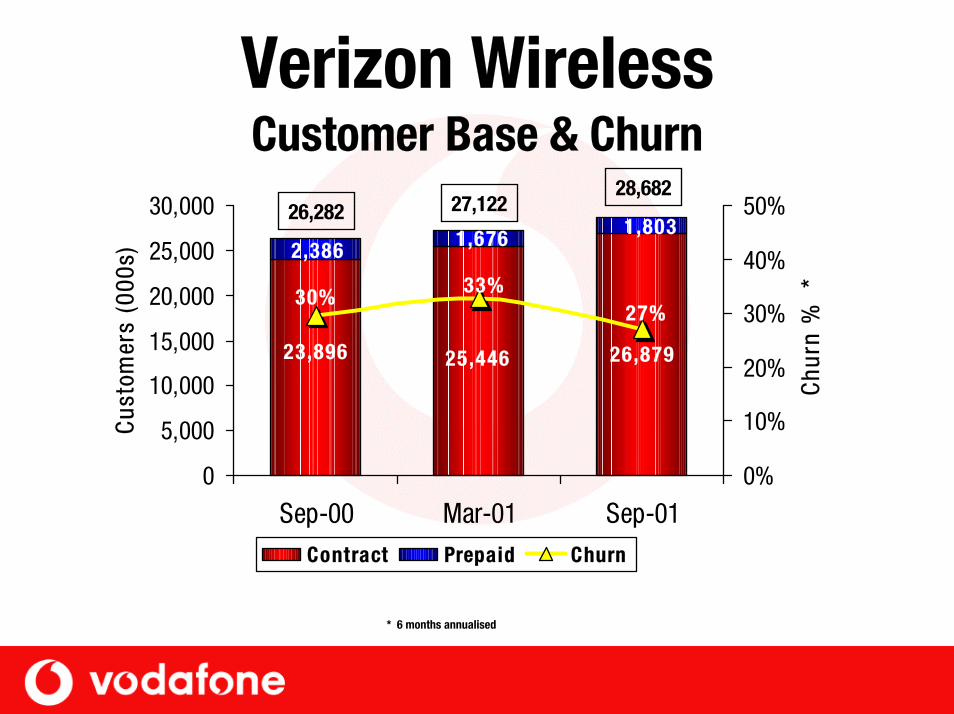
Verizon Wireless Customer Base & Churn
26,87925,44623,896
1,6762,3861,803
27%33%30%
0
5,000
10,000
15,000
20,000
25,000
30,000
Sep-00 Mar-01 Sep-01
Cus
tom
ers
(000
s)
0%
10%
20%
30%
40%
50%
Chu
rn %
*
Contract Prepaid Churn
27,12228,682
26,282
* 6 months annualised
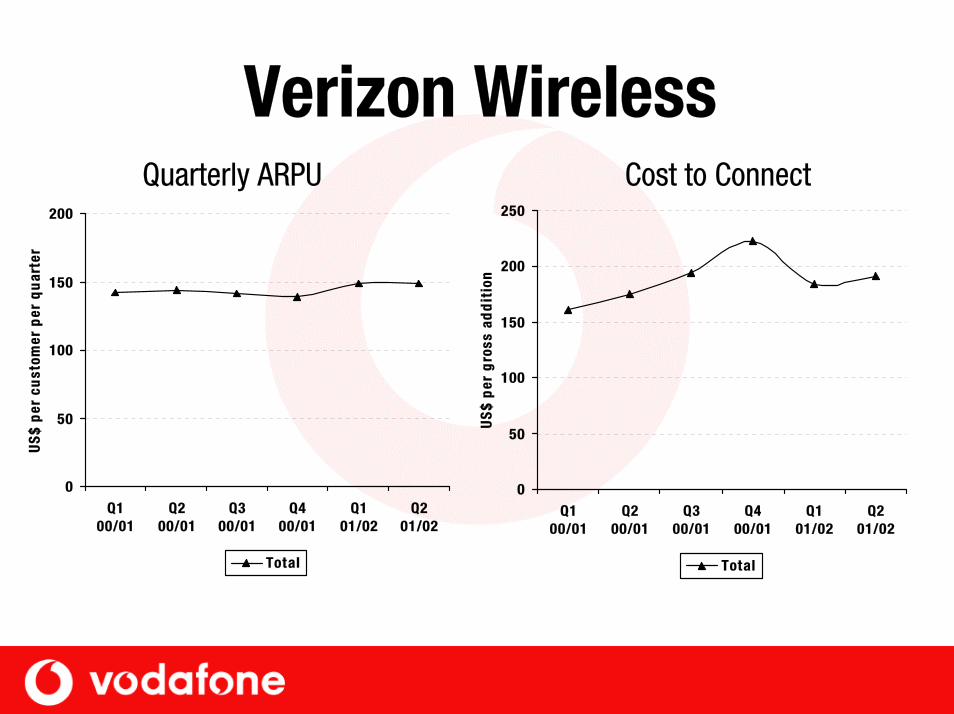
Verizon Wireless
0
50
100
150
200
Q100/01
Q200/01
Q300/01
Q400/01
Q101/02
Q201/02
US
$ p
er c
ust
omer
per
qu
arte
r
Total
Quarterly ARPU
0
50
100
150
200
250
Q100/01
Q200/01
Q300/01
Q400/01
Q101/02
Q201/02
US
$ p
er g
ross
ad
dit
ion
Total
Cost to Connect
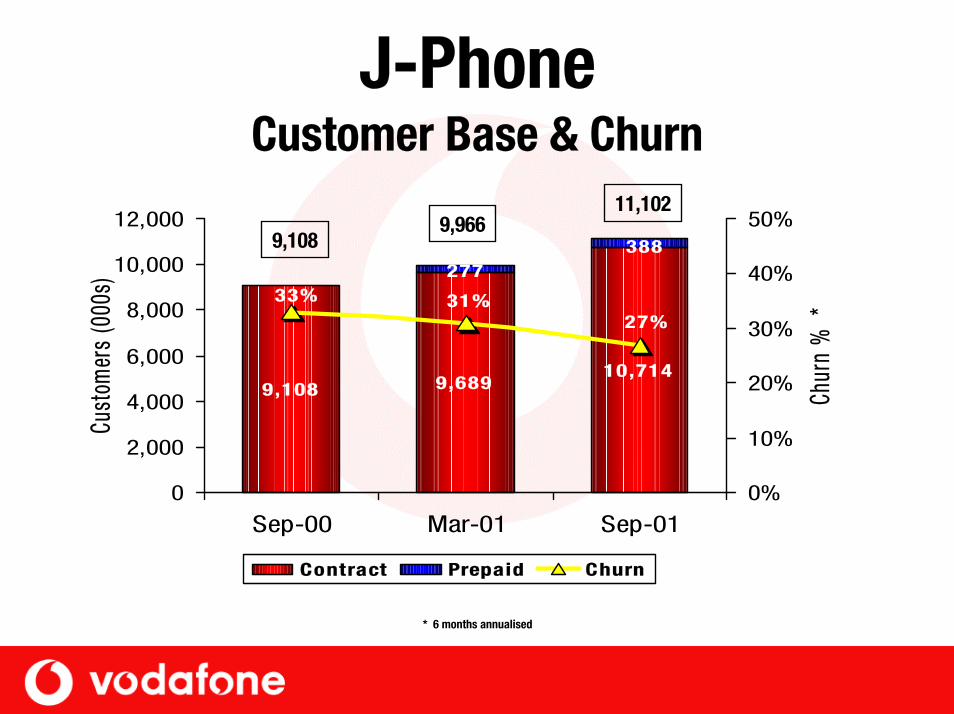
J-Phone Customer Base & Churn
9,108 9,68910,714
388277
33% 31%27%
0
2,000
4,000
6,000
8,000
10,000
12,000
Sep-00 Mar-01 Sep-01
Cust
omer
s (0
00s)
0%
10%
20%
30%
40%
50%
Chur
n %
*
Contract Prepaid Churn
9,96611,102
9,108
* 6 months annualised
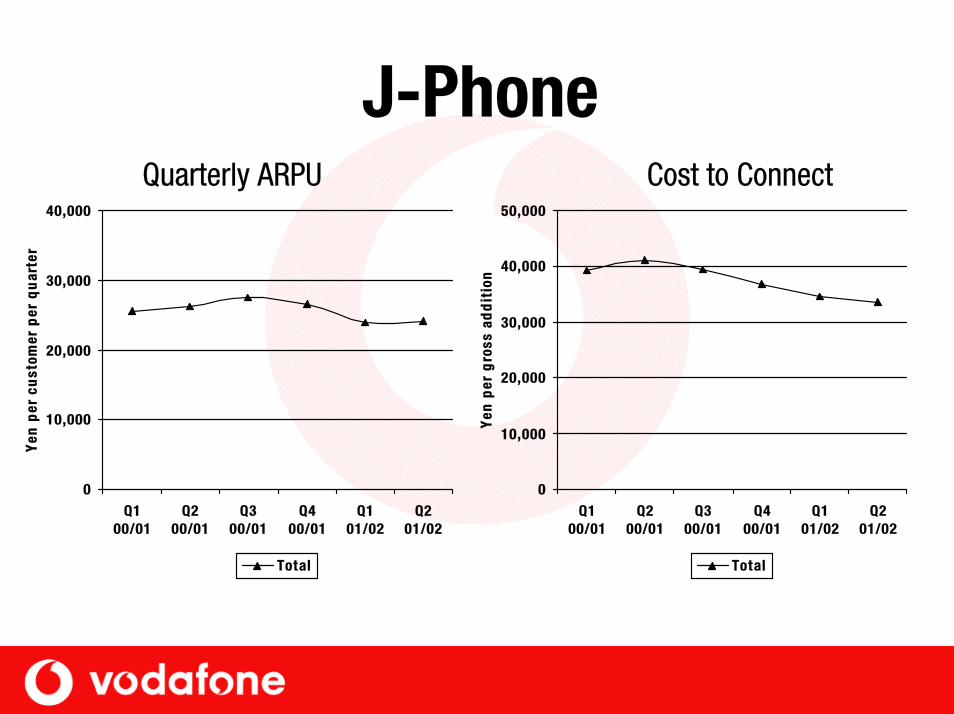
J-Phone
0
10,000
20,000
30,000
40,000
Q100/01
Q200/01
Q300/01
Q400/01
Q101/02
Q201/02
Yen
per
cu
stom
er p
er q
uar
ter
Total
Quarterly ARPU
0
10,000
20,000
30,000
40,000
50,000
Q100/01
Q200/01
Q300/01
Q400/01
Q101/02
Q201/02
Yen
per
gro
ss a
dd
itio
n
Total
Cost to Connect
Multi National Accounts• 11 Multi National Accounts secured to date incl.
– KPMG; – Deloitte & Touche; – Unilever; – Sun Microsystems; – Reuters
• Winning new partners, particularly systems integrators who assist in Corporate Sector

Brand• Launched global ad campaign-“How Are You”
– Communicates the brand values: • Dependability; • Empathy;• Can-do attitude; • Innovation; and • Joie de Vivre
– Paves way for single brand
• Communicate to employees the link between corporate values and brand values
Brand cont.• October Portugal and Spain moved to single brand
– Ahead of early 2002 timetable• Further migrations over course of the next year• Revenue and cost synergies evident• Ferrari sponsorship starts next year
– Significant catalyst to Vodafone brand globally– Introduce products through ferrari.net agreement
• Sponsorship strategy to support overall brand strategy
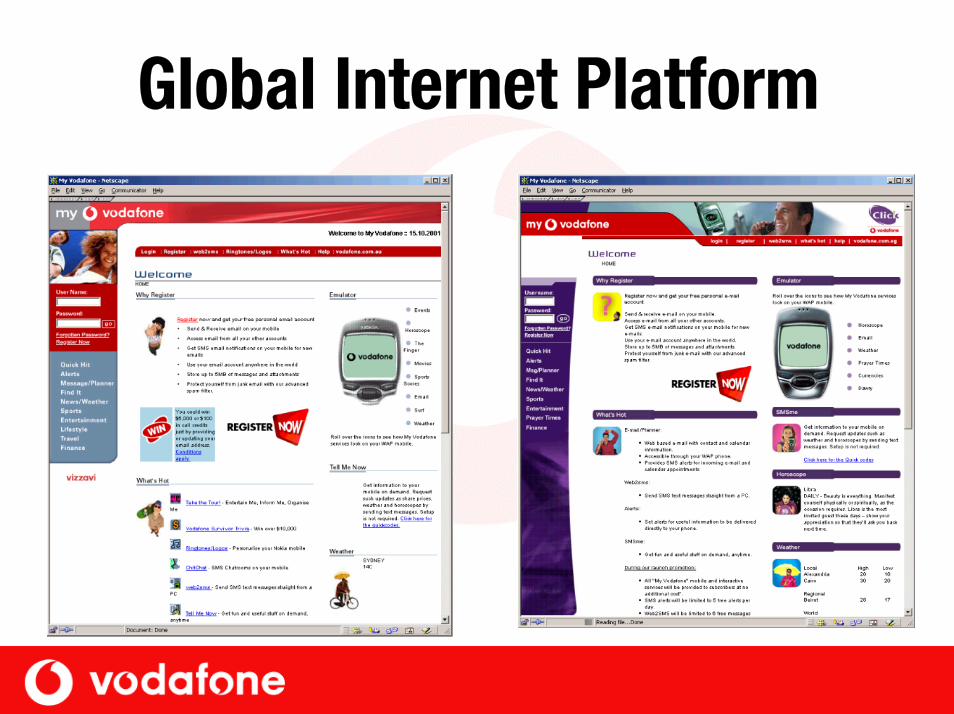
Global Internet Platform
Vizzavi Europe• Portal operational in UK; France; Germany; Greece;
Italy; Netherlands; Portugal and Spain • Customer base at 5.4 million in October• Increase in WAP page views to 63 million in October• Current offering:
– Location based services; WAP games; and SMS• Future services:
– Unified and instant messaging; and multi access chat

Thomas GeitnerChief Executive
Group Products and Services
• Launched February 2001• 4m customers at end Sept 2001• 11 countries across Europe• Certainty and predictability of roaming
charges to customers
Virtual Home Environment• Launched January 2001• Generated 6m* roaming minutes• The product DNA of our brand• Integrated across 11 operators• 3 further countries expected by end of 2001
* Proportionate figure
Assisted Roaming
• Benefits highest value roaming customers • 16 operators globally• Inbound capture rate increasing since
introduction in March 2001
Pre-Paid Roaming• Launched in May 2001• 12 European countries by end FY 2002• Seamless roaming for 45m* European Pre-Paid
customers• >11m* roaming minutes and 5m* text
messages• Spanish top-up cards available to UK customers
* Proportionate figures
GPRS• Data products across Europe• Greater data usage as supply of devices
increases• By Christmas: 13 different terminals
GPRS Roaming• Roll out in 10 European networks• Unlock demand from corporate customers
– New data revenue created– Better value access to services
Customer Applications• Focus on customer applications• Range of 2.5G applications• Foundation for 3G launch
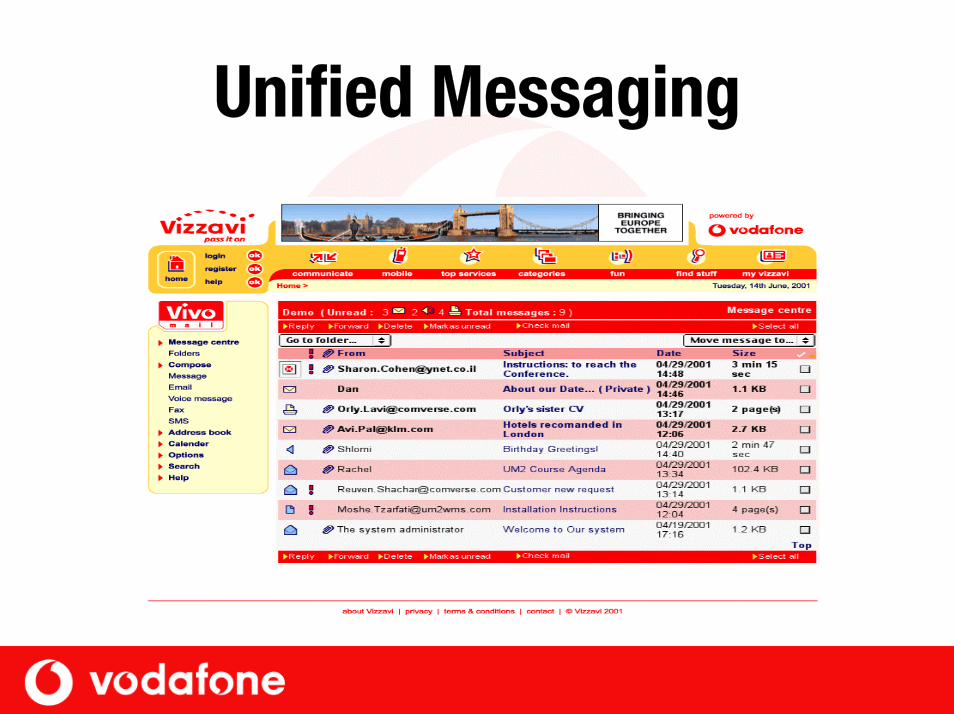
Unified Messaging
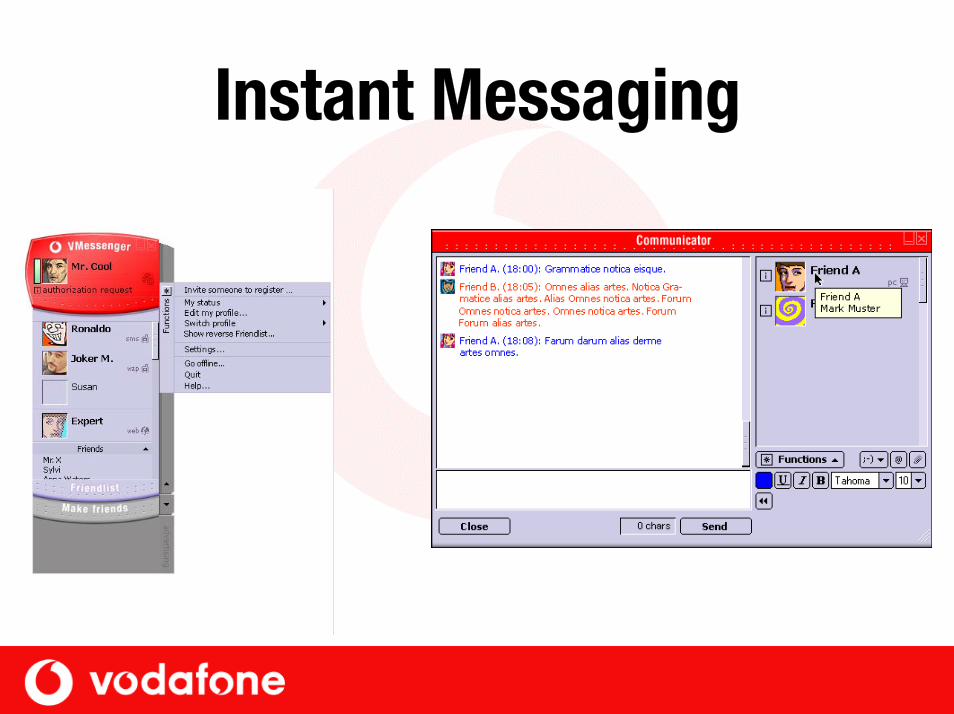
Instant Messaging
Summary• Further significant synergy potential• Substantial synergies already created
– Brand– Products– Technology– Supply Chain Management– Global Account Management

Sir Christopher GentChief Executive
Vodafone Group Plc
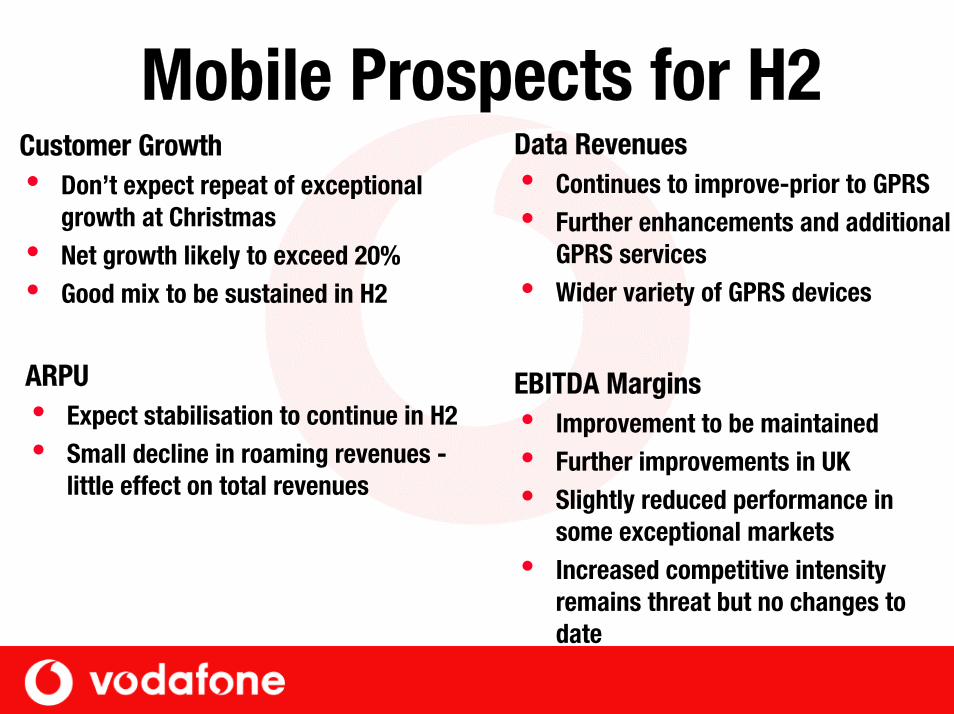
Mobile Prospects for H2 Data Revenuesi Continues to improve-prior to GPRSi Further enhancements and additional
GPRS services i Wider variety of GPRS devices
Customer Growthi Don’t expect repeat of exceptional
growth at Christmasi Net growth likely to exceed 20% i Good mix to be sustained in H2
ARPUi Expect stabilisation to continue in H2i Small decline in roaming revenues -
little effect on total revenues
EBITDA Marginsi Improvement to be maintainedi Further improvements in UKi Slightly reduced performance in
some exceptional marketsi Increased competitive intensity
remains threat but no changes to date

Japan in H2• Will consolidate JT and J-Phone from 12
October• J-Phone continues to exceed expectations
– Better customer growth, good ARPUs, improving margins
• Initial review of Japan Telecom undertaken – Revised forecasts for financial year issued by JT– No material impact on the Group’s results– Further management appointments to be made
Group Outlook in H2• Better performance in controlled mobile assets
in H1 - expect continued performance in H2
• Fixed line businesses in difficult market– Plans in place to improve fundamentals – Benefits not visible until next year
Outlook in FY 2003• Customer growth just under 10%*• ARPU stabilisation or slight improvement
– Increased usage and data contribution
• Healthy EBITDA growth - before 3G• 3G launch in H2 of 2002 is an important step
– Financial impact not significant until end 2003• Reduced capital expenditure expectations
– Reviewed capex downwards in Japan from previous management estimates
• Stronger cash flow than this year, incl. Japan* Including dilutive effect of likely IPO of Verizon Wireless

Vodafone’s Prospects• No further acquisitions or stake increases
planned for this financial year• Expect good EPS* performance this year
and next
* Pre goodwill and exceptionals
Summary• Enhanced global leadership position• Excellent progress on new products and services • Better operational and margin performance
Delivering strong growth momentum• Current market conditions highlight Vodafone’s
defensive and growth qualities
Conclusion• Transitioning to new service environment of 3G • Better financial performance than many
anticipated• Complete confidence remains in revenue growth
opportunities from GPRS and 3G• Good immediate growth prospects for this year
and next