sinter-hardening p/m steels howard g. rutz, amie … library/54. sinter-hardenin… · alloying...
TRANSCRIPT
SINTER-HARDENING P/M STEELS
Howard G. Rutz, Amie H. Graham, Alan B. Davala
Hoeganaes Corporation, Riverton, NJ 08077
Presented at PM2TEC '97International Conference on Powder Metallurgy & Particulate
MaterialsJune 29 - July 2, 1997 Chicago, IL USA
ABSTRACT
The use of P/M structural parts is growing in part due to the useof the sinter-hardening process which utilizes high performancematerials in combination with an accelerated post sinteringcooling rate. The sinter-hardening process offers improvedmechanical properties over conventional sintering without aseparate heat treatment operation. Thus, where the part designpermits, sinter-hardening offers considerable economic benefitsto the part producer.
Sinter-hardening typically requires that the P/M steelsubstantially transform to martensite during cooling. A varietyof microstructures and properties can be obtained by varying thepost sintering cooling rate. By controlling this rate, themicrostructure can be manipulated to produce the required amountof martensite to obtain the desired mechanical properties.
Alloying elements such as molybdenum, nickel, and copper promotehardenability in P/M parts. By increasing the hardenability ofthe material, the parts can be cooled at slower rates and stillproduce large amounts of martensite. The ability to increase theamount of martensite, leading to increased strength and hardness,
through the use of proper alloy selection and accelerated coolingrate will be discussed.
INTRODUCTION
Sinter-hardening refers to a process where the cooling rateexperienced in the cooling zone of the sintering furnace is fastenough that a significant portion of the material matrixtransforms to martensite. Interest in sinter-hardening has grownbecause it offers good manufacturing economy by providing a onestep process and a unique combination of strength, toughness, andhardness [1].
A variety of microstructures and properties can be obtained by

varying both the alloy type and content as well as the postsintering cooling rate. By controlling the cooling rate, themicrostructure can be manipulated to produce the requiredproportion of martensite which will lead to desired mechanicalproperties [1-3]. By understanding how the sintering conditionsaffect the microstructure, materials can be modeled to producethe final properties that are desired.
A graphical way of examining the effects of alloying elements onthe final microstructure of a steel is by using thecharacteristic isothermal transformation (I -T) diagram. Thisindicates the time necessary for the for the isothermaltransformation to start and finish as well as the cooling timeand temperature combinations needed to produce the finalmicrostructure.
As the composition of a steel is changed, the effects are seen inthe l-T diagram for that material. Figures 1a and 1b compare twomaterials that are similar in composition except for a 0.24 w/omolybdenum addition in Figure 1b [4]. An apparent shift in thenose of curve to the right is seen in the material with themolybdenum addition. This indicates that the maximum allowabletime to reach the nose of the curve is longer. Due to this shift,martensite can be produced at slower cooling rates, hence thematerial has a higher hardenability. Similar effects can bedemonstrated for other alloying elements such as nickel, copper,manganese and chromium.
Figures 2a and 2b compare two materials with similar compositionsexcept for carbon content [5]. Figure 2a depicts a material with0.47 w/o carbon while Figure 2b depicts a material with 0.68 w/ocarbon. There is a small shift in the curve to the right with theaddition of carbon. This indicates that the addition of carbonhas only a small effect on the hardenability of a material.
In most cases, a steel is not isothermally transformed at atemperature above the martensite start temperature but iscontinuously cooled from the austenite temperature to roomtemperature. The transformation from austenite to pearlite occursover a range of temperatures rather than at a single isothermaltemperature. The final microstructure after continuous-coolingmay be complex.

Figure 1: Isothermal Transformation Diagrams Displaying theEffect of Molybdenum Additions
Figure 2: Isothermal Transformation Diagrams Displaying theEffect of Carbon
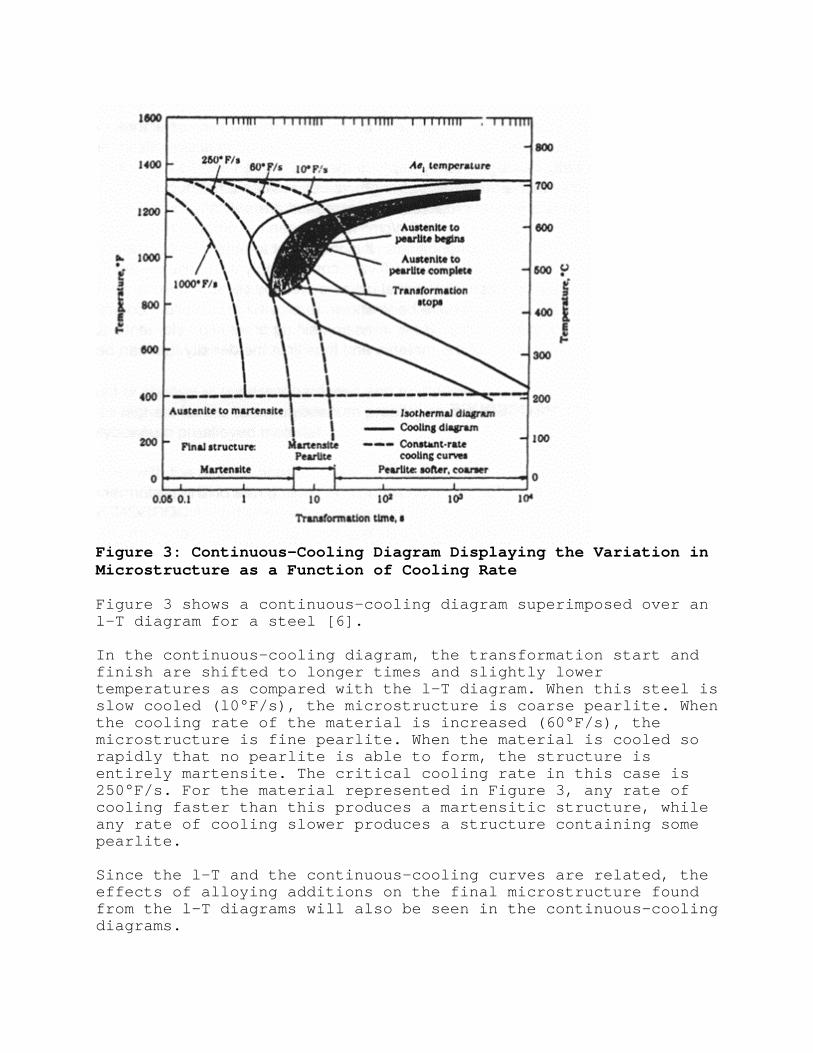
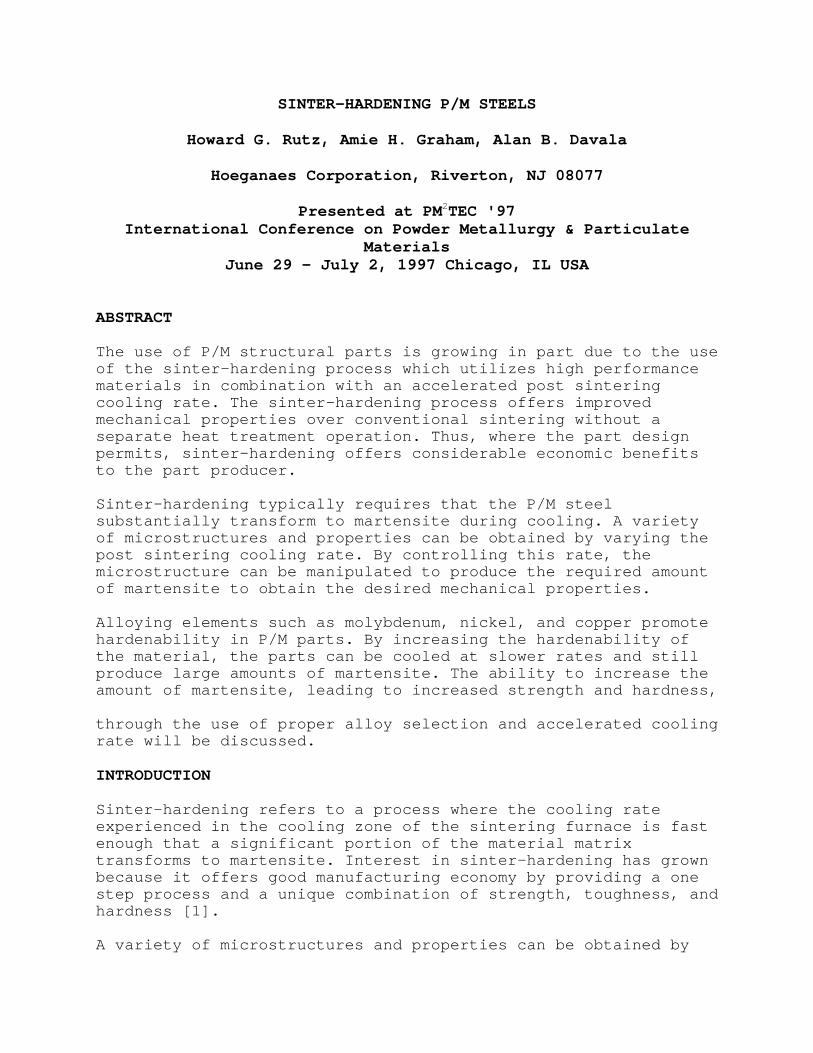
Figure 3: Continuous-Cooling Diagram Displaying the Variation inMicrostructure as a Function of Cooling Rate
Figure 3 shows a continuous-cooling diagram superimposed over anl-T diagram for a steel [6].
In the continuous-cooling diagram, the transformation start andfinish are shifted to longer times and slightly lowertemperatures as compared with the l-T diagram. When this steel isslow cooled (l0°F/s), the microstructure is coarse pearlite. Whenthe cooling rate of the material is increased (60°F/s), themicrostructure is fine pearlite. When the material is cooled sorapidly that no pearlite is able to form, the structure isentirely martensite. The critical cooling rate in this case is250°F/s. For the material represented in Figure 3, any rate ofcooling faster than this produces a martensitic structure, whileany rate of cooling slower produces a structure containing somepearlite.
Since the l-T and the continuous-cooling curves are related, theeffects of alloying additions on the final microstructure foundfrom the l-T diagrams will also be seen in the continuous-coolingdiagrams.

Alloying elements are used in P/M materials to promotehardenability and increase the mechanical strength of the parts.Alloying elements such as molybdenum, nickel, and copper move thecontinuous cooling transformation curves to the right, allowingphase transformations to occur at slower cooling rates. Byalloying the materials, the hardenability increases and moremartensite can be produced at similar cooling rates.
In addition to cooling rate, the hardenability of a material is acritical factor in defining the type of structure that will beproduced on cooling. Hardenability is the property thatdetermines the depth and distribution of hardness induced byquenching from the austenitic condition. A material with highhardenability is one in which austenite is able to transform tomartensite without forming pearlite, even when the rate ofcooling is rather slow. Optimal sinter-hardening materials wouldhave a high hardenability, so that the cooling rates needed toproduce large proportions of martensite will be attainable.
It is important to remember that in addition to composition andmicrostructure, density plays an important role in thedetermination of properties. [7] It has been shown elsewhere thatincreases in density can significantly improve materialproperties. As density levels are increased, not only do hardnessand strength values increase, but ductility values such astensile elongation and impact properties are increaseddramatically. For the tests described below, a moderate densitylevel of 7.0 g/cm3 was chosen to compare the properties of thevarious materials and process conditions. It is important to notethat the compaction pressure required to reach a given densitylevel will vary considerably with base material selected. Two ofthe base materials selected for this trial utilize a prealloycomposition containing only molybdenum. These materials have beenshown to provide an excellent combination of compressibility andhardenability. Base irons containing other alloy elements such asnickel, can limit the compressibility of the material and thuslimit the density that can be achieved.
EXPERIMENTAL PROCEDURE
Materials
In order to evaluate the effect of composition and cooling rateon the performance of several materials, seven 500-pound testpremixes were made using the ANCORBOND® process. The premixeswere chosen to study the effects of molybdenum and nickel asprealloyed additions, and nickel, copper, and graphite as premixadditions. The premix compositions are shown in Table I. In allcases 0.75 w/o Lonza Acrawax was added to the mixes. The nickel

utilized in the premixes was Inco 123, the copper was ACuMet -200mesh atomized copper powder, and the graphite was Asbury 3203 SCRHS.
Test Specimen Preparation
All samples were prepared and tested according to the appropriateMPIF standard [8]. Specimens nominally 0.45 inches x 0.45 inchesx 3.5 inches (11.4 mm x 11.4 mm x 88.9 mm) were compacted to agreen density of 7.0 g/cm3. Once sintered, the specimens weretempered at 380°F (193°C) in air for 1.5 hours and machined intothreaded tensile test pieces.
Table I: Premix CompositionsPrealoyedAdditions
Premix Additions
Mix Base Ni(w/o)
Mo(w/o)
Cu(w/o)
Ni(w/o)
Graphite(w/o)
1 Ancorsteel® 85 HP
-- 0.85 -- 2.00 0.50
2 Ancorsteel150 HP
-- 1.50 -- 2.00 0.50
3 Ancorsteel85 HP
-- 0.85 1.00 2.00 0.50
4 Ancorsteel150 HP
-- 1.50 1.00 2.00 0.50
5 Ancorsteel85 HP
-- 0.85 2.00 -- 0.90
6 Ancorsteel150 HP
-- 1.50 2.00 -- 0.90
7 Ancorsteel4600 V
1.85 0.55 2.00 -- 0.90
Sintering
All test pieces were sintered under production conditions atClarion Sintered Metals. The Abbott furnace used in the study wasequipped with a VARICOOL post sintering cooling system whichcombines radiant and convection cooling to accelerate the coolingcapabilities of the continuous belt furnace. The VARICOOL systemis easily adjustable which facilitates controlling the atmospherere-circulation to optimize the cooling profile.
Two sintering cycles were examined in order to evaluate theeffect of cooling rate on the properties of the selectedmaterials as follows:
Cycle OneSintering Temperature: 2050°F (1120°C)Atmosphere: 7 v/o H2, 93 v/o N2

Belt Speed: 4.8 in/mmVARICOOL Setting: 100%
Cycle TwoSintering Temperature: 2050°F (1120°C)Atmosphere: 7 v/o H2, 93 v/o N2Belt Speed: 4.8 in/mmVARICOOL Setting: 50%
At these settings the parts were at sintering temperature forabout 30 minutes. The sintered parts were stress relieved at380°F (193°C) in air for 1.5 hours prior to machining.
Testing
Following tempering, apparent hardness measurements wereperformed on the surface of the specimens using a Rockwellhardness tester. All of the testing was performed on the RockwellC scale for comparison purposes. Although some values were belowthe minimum for this scale, as suggested by ASTM standard E 18 -94 [9], this single scale was utilized to provide a comparisonbetween a relatively large range of hardness values generatedduring the tests.
Tensile testing was performed on round threaded tensile testpieces with a gauge length of 1 inch (25.4 mm) and a nominaldiameter of 0.20 inches (5.08 mm). Testing was performed on a60,000 pound Tinius Olsen universal testing machine at acrosshead speed of 0.025 inches/minute. Elongation values weredetermined utilizing an extensometer with a range of 0 to 20%.The extensometer was left on to failure.
Metallography
The tensile bars were sectioned and prepared for metallographicanalysis. Photomicrographs were taken of the structures followinga 2% nital/4% picral etch. The martensite content was determinedutilizing point count analysis. This analysis technique includedthe porosity as a portion of the total microstructure. Thereported percentages were corrected by eliminating the 11%porosity present in these materials (the approximate porosityamount at a density of 7.0 g/cm3) so that only the metallicportion of the microstructure is considered.
RESULTS
The apparent hardness, ultimate tensile strength, yield strength,total elongation, and martensite content of the test pieces arerepresented in Table II. Photomicrographs, taken at original

magnification of 500X, of the different materials are shown inFigures 4-10.
Table II: Properties of the Material MatrixMix VARICOOL
Setting(%)
ApparentHardness(HRC)
0.2%Offset YS(psi x103/MPa)
UTS(psi x103/MPa)
Elg.(%)
MartensiteContent(%)
1 50 6 66.5/459 90.5/624 2.4 7.31 100 9 70.2/484 97.1/669 2.3 20.82 50 12 80.5/555 103.5/714 1.6 10.12 100 16 87.0/600 110.3/760 1.5 11.83 50 7 71.6/494 98.1/676 2.0 23.03 100 11 78.5/541 107.9/744 1.9 38.84 50 14 89.7/618 114.3/788 1.9 38.84 100 19 98.1/676 122.4/844 1.4 20.25 50 21 95.2/656 109.5/755 1.1 22.55 100 30 112.6/776 135.9/937 1.2 66.36 50 25 102.7/708 132.0/910 1.5 29.86 100 35 114.7/791 127.1/876 1.0 60.17 50 35 102.4/706 118.9/820 1.1 71.97 100 37 106.3/732 117.9/813 0.9 95.5
Figure 4: Photomicrographs of Mix 1 (Original Magnification 500X)

Figure 5: Photomicrographs of Mix 2 (Original Magnification 500X)
Figure 6: Photomicrographs of Mix 3 (Original Magnification 500X)

Figure 7: Photomicrographs of Mix 4 (Original Magnification 500X)
Figure 8: Photomicrographs of Mix 5 (Original Magnification 500X)

Figure 9: Photomicrographs of Mix 6 (Original Magnification 500X)
Figure 10: Photomicrographs of Mix 7 (Original Magnification500X)

DISCUSSION
The Effect of Cooling Rate
As expected, increasing the cooling rate resulted in increasedapparent hardness and strength values. On the whole, hardnessvalues were increased between 2 to 10 HRC for a given material.The mixes with 0.5 w/o graphite added increased 3 to 5 HRC, withthe amount of change increasing for materials with higherhardness values. The mixes with 0.9 w/o graphite added indicatedthe largest difference in hardness values with the increasesranging from 2 to 10 HRC. Mix 7 which exhibited the highesthardness values at the higher cooling rate, showed the smallestincrease in hardness with faster cooling.
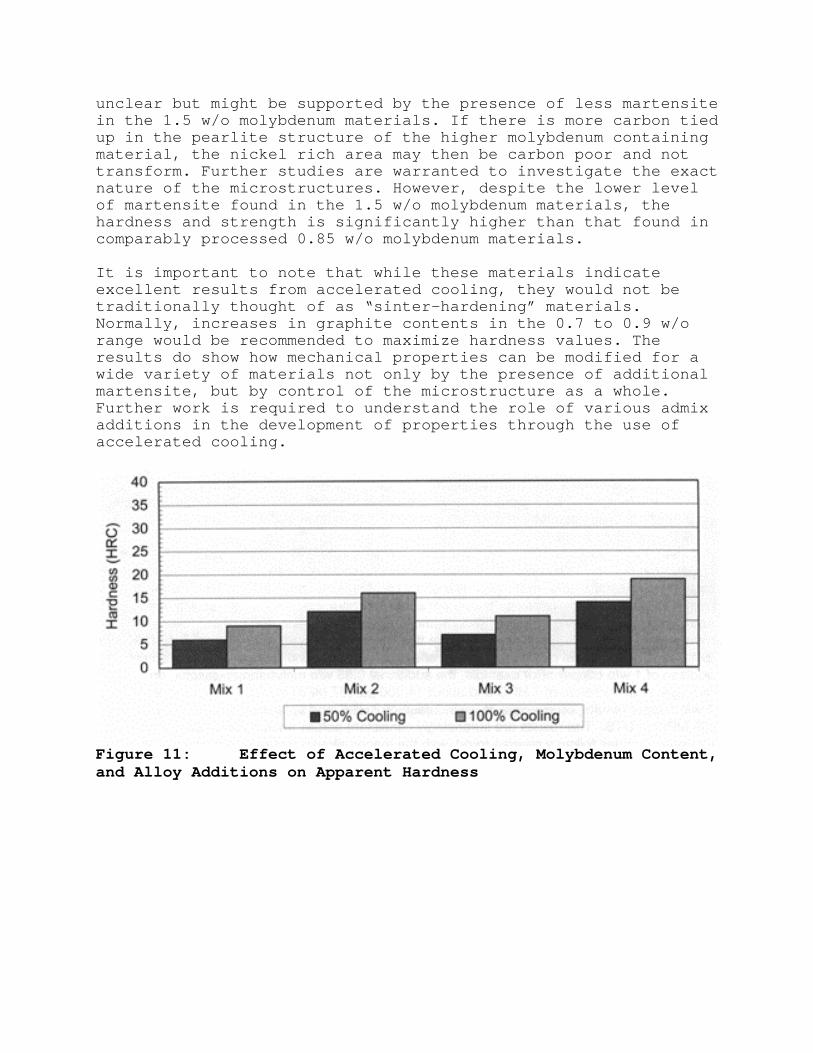
The 0.2% offset yield strength and the ultimate tensile strengthvalues for the mixes with 0.5 w/o graphite all showed increasedlevels with increasing cooling rate. The yield strength increasedfrom 3,700 to 8,400 psi (26 to 58 MPa) for this group while theUTS increased from 6,600 to 9,800 psi (46 to 68 MPa). In thisgroup of materials, the elongation dropped only slightly as theresult of the faster cooling rate. The effects in the mixes with0.9 w/o graphite additions were quite different. Increases incooling rates resulted in improvements in yield strength from3,900 to 17,400 psi (27 to 120 MPa) with the highest effectoccurring in the mix with the lowest prealloy content (0.85 w/omolybdenum) and the lowest in the mix with the highest alloycontent (1.55 w/o nickel +0.55 w/o molybdenum). This basic trendis continued in the UTS where the UTS in improved dramatically inthe 0.85 w/o molybdenum prealloy but actually decreases in theother two, more highly alloyed materials. Again, with theexception perhaps of the 1.5 w/o molybdenum prealloy, nosignificant decrease in elongation was noted.
As expected, in all materials, the percent of martensite presentincreased significantly with the increase in cooling rate. Theeffect of the increased martensite levels is apparent in thehardness values for each of the materials. The effect of thehigher levels of martensite on tensile properties is lessobvious. In several cases, materials with significantly lowerpercentages of martensite and lower hardness values demonstratedhigher tensile strengths. This will be discussed in some detailbelow.
The Effect of Alloy Content
The selection of the mix compositions was designed to allow thestudy of the effect of several different additions. Mixes 1through 4 allow the evaluation of both molybdenum prealloy levelsand copper premix additions at a fixed admix level of 2 w/o

nickel and a moderate level of 0.5 w/o graphite. Mixes 5 through7 allow the study of the effect of several prealloy chemistrieson a fixed admixed chemistry of 2 w/o copper and a higher levelof 0.9 w/o graphite.
Figures 11 through 20 compare the hardness, yield strength, UTSand elongation values for Mixes 1 through 4. As noted above,increased cooling rates resulted in improved hardness andstrength values for all four materials. The effect of increasingcooling rate on individual materials appears to be relativelyconsistent across the four mixes. The mixes with the lowest andhighest level of alloy content (Mixes 1 and 4) exhibit the lowestand highest values of hardness and strength. The results indicatethat the increase in prealloy content from 0.85 w/o to 1.5 w/omolybdenum has a more potent effect on hardness and strength thanthe admix addition of 1 w/o copper. For example, the additional0.65 w/o molybdenum results, on average, in an increase of 7 HRCand about 14,000 psi (97 MPa) in UTS. The addition of 1 w/ocopper results, on average, in an increase of 2 HRC andapproximately 10,000 psi (69 MPa) in UTS. The results aresurprisingly consistent across each material pair. The elongationvalues follow a reverse trend, with the leaner alloyed materialsexhibiting higher ductility.
In terms of microstructure (Figures 4 through 7), in all fourcases, the faster cooling rate increases the amount of martensitepresent. With this group of materials, it appears that theincreased transformation to martensite with the acceleratedcooling occurs predominantly in the nickel rich areas whichremain as retained austenite in the slow cooled materials. In allcases the faster cooling rate also appears to result in a finerpearlite structure.
Perhaps most interesting is the relationship between the twomaterials based on the 0.85 w/o and the 1.5 w/o molybdenummaterials. Surprisingly, the lower molybdenum materials generallycontain higher levels of martensite than the comparably processedmaterials made from the 1.5 w/o molybdenum base iron. Thepearlite in the 1.5 w/o molybdenum materials appears to be verydifferent than the 0.85 w/o molybdenum materials. The highermolybdenum content appears to result in much finer pearlitespacing and perhaps a higher percentage of carbide present withinthe pearlite structure. Microhardness evaluations of thesestructures were carried out with faster cooled versions of Mixes1 and 2. The pearlite structure in Mix 1 (0.85 w/o molybdenum)indicates an average hardness of 219 HV50 while the martensiteexhibits an average hardness of 314 HV25. The results for Mix 2(1.5 w/o molybdenum) indicate nearly identical results for themartensite areas at 327 HV25 but the finer pearlite exhibits ahardness of 306 HV50. The exact mechanism for this result is
unclear but might be supported by the presence of less martensitein the 1.5 w/o molybdenum materials. If there is more carbon tiedup in the pearlite structure of the higher molybdenum containingmaterial, the nickel rich area may then be carbon poor and nottransform. Further studies are warranted to investigate the exactnature of the microstructures. However, despite the lower levelof martensite found in the 1.5 w/o molybdenum materials, thehardness and strength is significantly higher than that found incomparably processed 0.85 w/o molybdenum materials.
It is important to note that while these materials indicateexcellent results from accelerated cooling, they would not betraditionally thought of as “sinter-hardening” materials.Normally, increases in graphite contents in the 0.7 to 0.9 w/orange would be recommended to maximize hardness values. Theresults do show how mechanical properties can be modified for awide variety of materials not only by the presence of additionalmartensite, but by control of the microstructure as a whole.Further work is required to understand the role of various admixadditions in the development of properties through the use ofaccelerated cooling.
Figure 11: Effect of Accelerated Cooling, Molybdenum Content,and Alloy Additions on Apparent Hardness
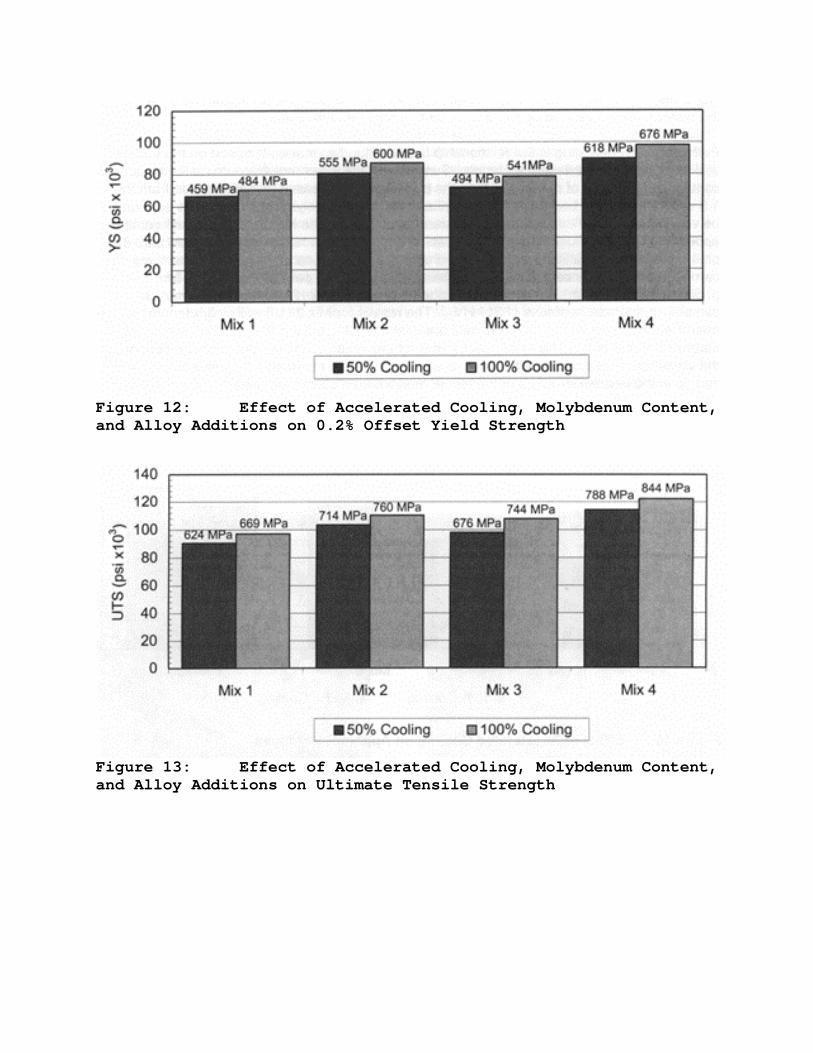
Figure 12: Effect of Accelerated Cooling, Molybdenum Content,and Alloy Additions on 0.2% Offset Yield Strength
Figure 13: Effect of Accelerated Cooling, Molybdenum Content,and Alloy Additions on Ultimate Tensile Strength

Figure 14: Effect of Accelerated Cooling, Molybdenum Content,and Alloy Additions on Elongation
Figures 15 through 18 compare the apparent hardness, yieldstrength, UTS and elongation values for Mixes 5 through 7. Theeffect of increased cooling rate and alloy content appear to bemore complex with this series of materials than noted above forthose with the lower graphite content. In all three cases, thehardness increases with faster cooling rates but the amount ofincrease is significantly less for Mix 7 (2 HRC) than for Mixes 5and 6 (9 and 10 HRC). Mix 5 shows large increases in tensilestrength values with increasing cooling rate. Mixes 6 and 7 showless of an increase in yield strength and both actually indicatedecreases in UTS with increased cooling rate. Thus, the highesttensile properties are not found in those materials exhibitingthe highest hardness values but in the fast cooled version of Mix5 and the slow cooled version of Mix 6.

Figure 15: Effect of Accelerated Cooling on Apparent Hardness
Figure 16: Effect of Accelerated Cooling on 0.2% Offset YieldStrength

Figure 17: Effect of Accelerated Cooling on Ultimate TensileStrength
Figure 18: Effect of Accelerated Cooling on Elongation
The microstructures of these materials support the results notedabove (Figures 8-10). The amount of martensite present in Mixes 5and 6 is increased significantly with the higher cooling ratethus resulting in large increases in apparent hardness values.Mix 5 shows the largest change in microstructure, going frompredominantly unresolved pearlite with a slow cool to mostlymartensite following accelerated cooling. The microstructurescorrespond well with the large increase in strength determinedfor this material. Mix 7, on the other hand, contains asignificant portion of martensite in the slow cooled state, sothe small additional increase in martensite content resultingfrom faster cooling rates has only a minor effect on hardness. Itshould also be noted that the fast cooled versions of Mixes 6 and

7 as well as the slow cooled version of Mix 7 appear to contain asignificant amount of retained austenite. The exact amount ofthis phase is difficult to determine optically on these samples.
Figure 19 shows the relationship between apparent hardness valuesand ultimate tensile strength. There appears to be goodcorrelation between the hardness and strength but the graphhighlights several additional points. At the low values ofhardness, the strength increases rapidly for a given increase inhardness. The rate of increase in strength appears to peak athardness levels of between 25 and 30 HRC. For hardness levelsabove 30 HRC, the strength appears to be decreasing withincreasing hardness values for the materials tested. Anadditional comparison can be made with Mixes 1 through 4. Mixes 1and 2, containing both high and low levels of molybdenum but onlynickel as the admixed ingredient, showed very good correlationbetween hardness and UTS. Mixes 3 and 4, with the added copper,also show a good correlation but, the addition of copper appearsto raise the UTS value for a given level of hardness.
Figure 20 indicates the relationship between the martensite leveland the ultimate tensile strength. Mixes 1 through 4 again show aunique correlation. The materials with 0.85 w/o molybdenum (Mixes1 and 3) indicated good correlation with each other but fairlylow ultimate strength for the given level of martensite. Thematerials with the higher level of molybdenum (Mixes 2 and 4)show a good correlation with each other but much higher strengthfor a given level of martensite. Overall, the trend follows in asimilar fashion to that noted with hardness values. The strengthincreases with increased levels of martensite until peaking ataround 60% martensite, after which further increases inmartensite level actually result in lower strength values.Further investigations will be needed to determine if thepresence of retained austenite or other factors cause thisdecrease in strength.

Figure 19: The Relationship between Apparent Hardness andUltimate Tensile Strength for the Tested Materials
Figure 20: The Relationship between Martensite and TensileStrength for the Tested Materials
CONCLUSIONS
A study was conducted on two families of materials in order toevaluate the effect of post-sintering cooling rate onmicrostructure and the resulting mechanical properties. Theresults may be summarized as follows:
1. For the materials with 2 w/o nickel and 0.5 w/o graphiteadmixed:
• Accelerated cooling resulted in increased strength andapparent hardness while decreasing elongation values onlyslightly. This result was the consequence of increased martensitecontent and finer pearlitic structures. In these materials, themartensite was the result of transformation of nickel rich areasin the microstructure.
• The increase in prealloyed alloy content from 0.85 w/o to1.5 w/o molybdenum resulted in a larger increase in strength thanthe addition of 1.0 w/o admixed copper.
• Although the 0.85 w/o molybdenum materials exhibited higherpercentages of martensite than identical chemistries based on the1.5 w/o molybdenum prealloyed material, the higher molybdenummaterials had higher apparent hardness and strength values. Thissurprising result was explained by the presence in the 1.5 w/omolybdenum based material of significantly finer pearlite. Themicrohardness of this finer pearlite structure approached that ofthe martensite and thus had a significant influence on theperformance.
• It was also noted that these four materials are clearly notoptimized to provide high apparent hardness values. It wassuggested that additional work is called for with higher graphitecontents to obtain high martensite contents and apparent hardnessvalues above 30 HRC. The study did indicate that acceleratedcooling has benefit to the P/M parts fabricator beyond simplycreating very hard materials. The use of this system may allowleaner alloy materials to attain higher properties while reducingmaterial cost.
2. For the material with 2 w/o copper and 0.9 w/o graphiteadmixed:
• As the cooling rate was increased for these materials, theapparent hardness increased. This was associated with highermartensite contents in the faster cooled materials. Martensitecontents of greater than 50% were found in all three base

materials when accelerated cooling was utilized.
• The amount of change in apparent hardness and martensitecontent with accelerated cooling was highest for the twomolybdenum prealloyed materials and least for thenickel/molybdenum prealloyed material.
• The materials with the highest apparent hardness values (0.5w/o nickel, 1.5 w/o molybdenum prealloy) did not exhibit thehighest tensile strength values. The highest UTS values weredetermined for the fast cooled version of the 0.85 w/o molybdenumprealloyed material. It was suggested that retained austenite maybe one potential cause for the fall off in strength for themolybdenum/nickel material.
ACKNOWLEDGMENTS
The authors wish to thank Ron Fitzpatrick, Craig Gamble, SteveKolwicz and Jerry Golin for their assistance in preparing,testing and analyzing the samples. The authors are very gratefulto Tom Murphy for his assistance in interpreting themicrostructures. We would also like to thank Shirley Tworzydlofor her assistance in the preparation of the manuscript. We wouldparticularly like to thank the staffs at Clarion Sintered Metals,Inc. and Abbott Furnace Company for their invaluable expertiseand help in performing the sintering.
REFERENCES
1. Causton, R.J., Fulmer, J.J., “Sinter-Hardening Low-AlloySteels”, Advances in Powder Metallurgy & Particulate Materials -1992, Vol.5 , p.17, Metal Powder Industries Federation,Princeton, NJ.
2. Gangnè, M., Trudel, Y., “Effects of Post-Sintering Coolingon the Properties of Low Alloy Sintered Materials”, Advances inPowder Metallurgy - 1991, Vol.4, p.115, Metal Powder IndustriesFederation, Princeton, NJ.
3. Akpan, E., L' Esperance, G., Roy, L., “Case Histories withSinter Hardening Low Alloy Steel Powder”, Advances in PowderMetallurgy & Particulate Materials - 1993, Vol.4, p. 289, MetalPowder Industries Federation, Princeton, NJ.4. Atlas of Isothermal Transformation and CoolingTransformation Diagrams, American Society for Metals, MetalsPark, Ohio, 1977, p.18,133.

5. ibid., p. 131, 133.
6. Smith, W.F., Principles of Materials Science & Engineering,2nd Edition, McGraw-Hill, Inc., 1990, p.491.
7. Rutz, H., Hanejko, F., “High Density Processing of HighPerformance Ferrous Materials”, Advances in Powder Metallurgy &Particulate Materials - 1994, Vol.5, pp 117-133, Metal PowderIndustries Federation, Princeton, NJ.
8. “Standard Test Methods for Metal Powders and PowderMetallurgy Products”, Metal Powder Industries Federation,Princeton, NJ, 1996.
9. “Metals Test Methods and Analytical Procedures”, AmericanSociety for Testing and Materials, Vol.03.01,1995, Philadelphia,PA.