single phasing fault identification using wavelet … phasing fault identification using ... (dwt),...
TRANSCRIPT

Single phasing Fault Identification using Wavelet Analysis
Abitha Memala.W #1, Dr. Rajini.V*2 # Asst. Professor, Department of Electrical & Electronics Engineering,
Sathyabama University, Chennai, India 1 [email protected]
* Professor, Department of Electrical & Electronics Engineering, SSNCE, Anna University, Chennai, India
Abstract—In our work, the induction motor is modeled in stationary reference frame and single phasing stator fault created in the induction motor model is identified using discrete wavelet transform. The wavelet coefficients are used in calculating the energy and standard deviation of the decomposed signal, which are the fault indicators in diagnosis. The Discrete Wavelet Transform along with Power Spectral Density achieves better results in identifying the fault.
Keyword- Discrete Wavelet Transform (DWT), Fault identification, Induction motor model, Stationary reference frame, Power Spectral Density (PSD)
I. INTRODUCTION
Induction motors are popularly used machine in industries as they provide the reliable and safe operation. Failure of these may lead to unknown down time, greater loss in profit, etc. Therefore it is necessary to monitor the system continuously as it provides adequate warning about the failure. The external faults are phase failure, asymmetry of main supply and mechanical overload. Early fault detection helps for maintenance to be scheduled during downtime and reduces the period of downtime. It leads in smoother functioning of the plant. The main classifications of induction motor faults are stator fault, rotor fault, bearing fault and eccentricity fault. Stator fault includes single phasing stator fault, inter turn short circuit and stator core insulation failures. The failure in the system can be classified into internal and external failures. The internal failures are inter-turn short circuit fault, broken bar fault, end ring fault and bearing fault. The fields & techniques related to the identification of the fault related signals are vibration [1] & acoustic pressure measurement [2], artificial intelligence and neural network based techniques [3] and pattern recognition [4], state and parameter estimation [5], motor current signature analysis (MCSA) [6], Fast Fourier Transform [7], Short Time Fourier Transform [8], parks’ approach [16] and wavelet transform based techniques [8-12, 13&14, 17-19]. The induction motor is modeled in stationary reference frame [15]. Single phasing fault will occur as a result of loose wire, a bad connection, bad starter contacts, overload relay problems, a bad breaker, a blown fuse, and other things can cause this destructive condition. The symmetry of the motor is disturbed because of single phasing fault and it has serious effect on the induction motor operation. The indication of single phasing fault is louder than normal humming noise and shaft that vibrates rather than rotating. Fault diagnosis of rotor faults are implemented using DWT & PSD [19]. Our contribution is implementing the fault diagnosing system for identifying the stator related faults using DWT & PSD. Our proposed methodology is diagnosing the single phasing fault of the motor using Discrete Wavelet Transform (DWT). The energy and standard deviation of the wavelet coefficients are calculated using the wavelet coefficients. The Discrete Wavelet Transform (DWT) and Power Spectral Density (PSD) is used in diagnosing the faults. The energy is calculated using Parseval’s theorem. The standard deviation is used in verifying the results.
II. INDUCTION MOTOR MODEL
An induction motor model is developed in stationary reference frame using MATLAB. According to this equivalent circuit the equations of stationary reference frame can be derived and modified to find the parameters like stator and rotor q-axis and d-axis flux linkages and currents. Stator and rotor flux linkages in stationary q axis and d axis ((qs
s ,dss ,qr
1s & dr1s ) are given below.
qss = bVqs + (mq
s - qss ) dt (1)
dss = bVds + (md
s - dss ) dt (2)
qr1s = b Vqr
1s +
dr1s + (mq
s - qr1s ) (3)
dr1s = b Vdr
1s -
qr1s + (md
s - dr1s ) dt (4)
Abitha Memala.W et al. / International Journal of Engineering and Technology (IJET)
ISSN : 0975-4024 Vol 6 No 6 Dec 2014-Jan 2015 2712

Stator and rotor currents in stationary q axis and d axis are specifiedas iqss,ids
s,iqr1s & idr
1s respectively.
iqss = qs
s - mqs (5)
idss = ds
s - mds (6)
iqr1s = qr
1s - mqs (7)
idr1s = dr
1s - mds (8)
mqs = x qs
s + qr1s x (9)
mds = x ds
s + dr1s
(10)
Where = 2 x = 2fL (11)
ψmqs & ψmd
s - stator mutual flux linkages in stationary q and d axis respectively. xls & xlr1 - stator and rotor
leakage reactance respectively. Vqr1 & Vdr
1 - slip frequency voltages which is taken as zero for squirrel cage induction motor model. rs - the stator resistance. rr
1 - the rotor resistance. Lls & Llr1 - stator and rotor leakage
inductances respectively. ωb - the base or rated value of angular frequency. ωr/ωb - the per unit speed needed for building speed voltage terms in rotor voltage equations. The superscript s indicates stationary reference frame. The subscript q & d indicates the parameter in stationary q & d axis respectively. The electromagnetic torque,
Tem = b
(dss iqs
s − qss ids
s) (12)
Motion of rotor is given by the following equation: 2H d()/dt = Tem - Tmech - Tdamp (13)
Where H = bm (14)
H - the ratio of kinetic energy of rotating mass at base speed to the rated power. Tmech - externally applied mechanical torque in the direction of rotor speed. Tdamp - the damping torque in the direction opposite to rotation. Fig1 shows the induction motor model in stationary reference frame.
Fig1. Induction motor model in stationary reference frame
Abitha Memala.W et al. / International Journal of Engineering and Technology (IJET)
ISSN : 0975-4024 Vol 6 No 6 Dec 2014-Jan 2015 2713

Fig2. Single phasing fault in Induction Motor Model
The induction motor model has the following sub blocks. They are 3phase ac generator, abc to dq conversion, q axis block, d axis block, rotor, dq to abc conversion and zero sequence voltage to current conversion blocks. The inputs of the motor are the maximum input voltage, the frequency and the induction motor parameters. It has the following 7 subsystems blocks: 3phase ac generator, abc to dq conversion, q axis block, d axis block, rotor, dq to abc conversion & zero sequence voltage to current conversion blocks. A. Generating 3phase ac voltage
Your The 3phase ac supply applied on the stator terminals are Vas,Vbs and Vcs. = (15) = sin( − 120) (16) = sin( − 240) (17)Vm - the maximum voltages in a, b & c phase of the supply voltage. ias, ibs and ics are stator phase currents. The zero sequence current,
i = (18)
The 3φ supply is given to the stator terminals of the induction motor. When the three phase currents are balanced, the zero sequence current, ios is zero.
B. abc to qdo transformation
The phase voltages Vas, Vbs and Vcs can be transformed into qdo stationary voltages Vqs, Vds and Vos using the equations (19 to 22). The q-axis of stationary voltages aligns with stator a phase axis. V = V − V − V (19) V = √ (V − V ) (20) V = (V + V + V ) − (i + i + i ) (21)
Where C = ; (22)
Csg is very small value.
Abitha Memala.W et al. / International Journal of Engineering and Technology (IJET)
ISSN : 0975-4024 Vol 6 No 6 Dec 2014-Jan 2015 2714

C. q-axis & d-axis
In this block, the stationary qdo stator and rotor voltages are used to calculate the flux linkages and the currents in stationary reference. The equations related to this are calculated using the equations (1 to 11).
D. Rotor
To construct a rotor model, the torque & the per unit speed of the motor are calculated using the equations (12 to 14).
E. qdo to abc transformation
Inverse transformation is used in transforming the stator qdo currents to abc phase currents. = + (23) i = i − √ i + i (24)i = i + √ i + i (25)
F. Zero sequence
The zero sequence current (ios) is calculated from the zero sequence voltage(Vos) using equation (20) = ( − ) (26)
25.4mm (1")
• Bottom = 25.4mm (1")
• Left = Right = 25.4mm (1")
III. SINGLE PHASING STATOR FAULT IN INDUCTION MOTOR
A three phase induction motor will have steady state operation, if it receives 3 phase supply. The stator fault is created by opening any of the phase supply connected to the system.It is shown in fig 2. 80000 data samples with sampling frequency of 100kHz are stored under healthy and faulty conditions. The data of single phasing faulty condition is acquired with R phase open, Y phase open and B phase open. The current is measured in each phase and the effect of fault in each phase should be analyzed. The sample R phase current measured with healthy and single phasing faulty condition is shown in fig3.
(a)
(b)
Fig3. Phase current measured in R phase under (a) healthy condition (b) single phasing faulty condition
Abitha Memala.W et al. / International Journal of Engineering and Technology (IJET)
ISSN : 0975-4024 Vol 6 No 6 Dec 2014-Jan 2015 2715
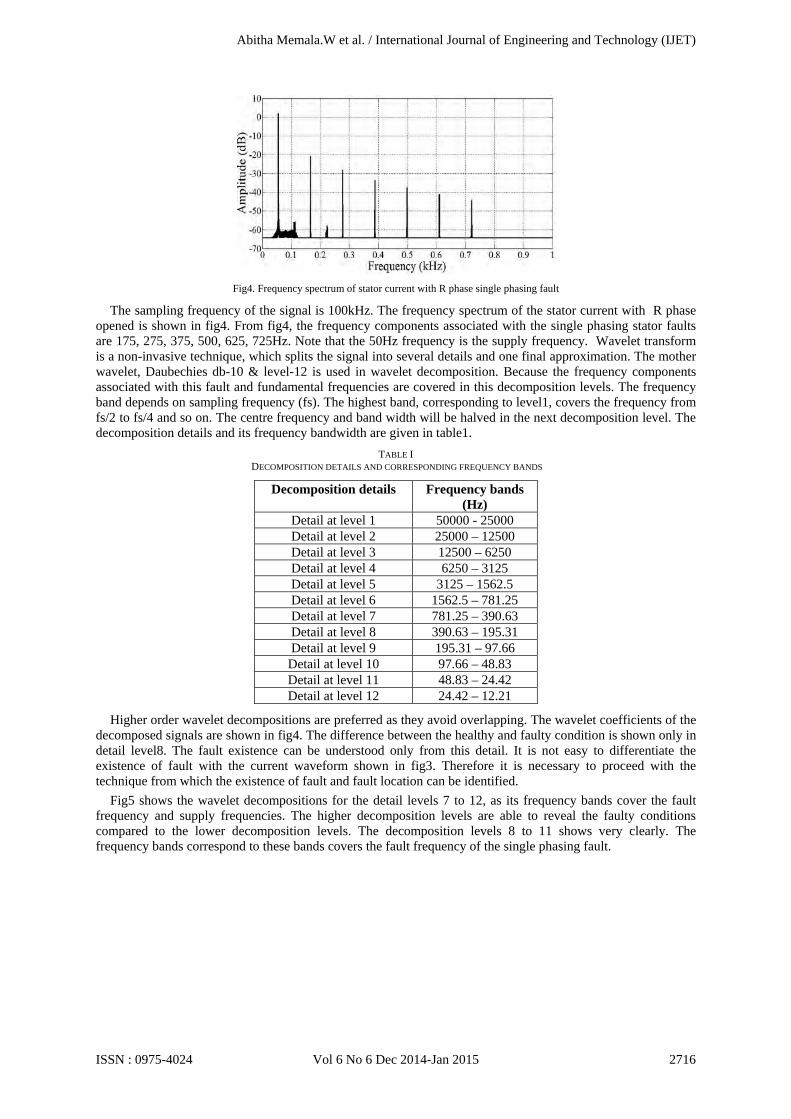
Fig4. Frequency spectrum of stator current with R phase single phasing fault
The sampling frequency of the signal is 100kHz. The frequency spectrum of the stator current with R phase opened is shown in fig4. From fig4, the frequency components associated with the single phasing stator faults are 175, 275, 375, 500, 625, 725Hz. Note that the 50Hz frequency is the supply frequency. Wavelet transform is a non-invasive technique, which splits the signal into several details and one final approximation. The mother wavelet, Daubechies db-10 & level-12 is used in wavelet decomposition. Because the frequency components associated with this fault and fundamental frequencies are covered in this decomposition levels. The frequency band depends on sampling frequency (fs). The highest band, corresponding to level1, covers the frequency from fs/2 to fs/4 and so on. The centre frequency and band width will be halved in the next decomposition level. The decomposition details and its frequency bandwidth are given in table1.
TABLE I DECOMPOSITION DETAILS AND CORRESPONDING FREQUENCY BANDS
Decomposition details Frequency bands (Hz)
Detail at level 1 50000 - 25000 Detail at level 2 25000 – 12500 Detail at level 3 12500 – 6250 Detail at level 4 6250 – 3125 Detail at level 5 3125 – 1562.5 Detail at level 6 1562.5 – 781.25 Detail at level 7 781.25 – 390.63 Detail at level 8 390.63 – 195.31 Detail at level 9 195.31 – 97.66
Detail at level 10 97.66 – 48.83 Detail at level 11 48.83 – 24.42 Detail at level 12 24.42 – 12.21
Higher order wavelet decompositions are preferred as they avoid overlapping. The wavelet coefficients of the decomposed signals are shown in fig4. The difference between the healthy and faulty condition is shown only in detail level8. The fault existence can be understood only from this detail. It is not easy to differentiate the existence of fault with the current waveform shown in fig3. Therefore it is necessary to proceed with the technique from which the existence of fault and fault location can be identified.
Fig5 shows the wavelet decompositions for the detail levels 7 to 12, as its frequency bands cover the fault frequency and supply frequencies. The higher decomposition levels are able to reveal the faulty conditions compared to the lower decomposition levels. The decomposition levels 8 to 11 shows very clearly. The frequency bands correspond to these bands covers the fault frequency of the single phasing fault.
Abitha Memala.W et al. / International Journal of Engineering and Technology (IJET)
ISSN : 0975-4024 Vol 6 No 6 Dec 2014-Jan 2015 2716

(a) (b)
Fig5. Wavelet decomposition of induction motor (a) healthy condition (b) faulty condition
But it is quite difficult to compare the coefficients directly. Therefore, DWT along with PSD is used in our work to identify the single phasing fault, which is discussed in the next session. The energy and the standard deviations are used as the indicators of fault.
IV. DWT & PSD IN IDENTIFYING SINGLE PHASING FAULT
Discrete Wavelet Transform (DWT) is used in Multi-Resolution Analysis (MRA) as it decomposes the high frequency components and low frequency components. The filter coefficients are used to calculate the wavelet coefficients. These coefficients are used in calculating the energy and standard deviation of the signal. The energy of a signal is calculated using Parsevel’s theorem, i.e., by adding squared coefficients of details and final approximation. ∑ | ( )| = ∑ ( ) + ∑ ∑ ( ) (27)
As the energy of the signal is used in PSD, it performs better. Standard deviation of the decomposed signals is used in verifying the results. The energy and standard deviations are calculated and used as fault indicators in this session. The energy at each decomposition level is calculated with wavelet coefficients. It is able to reveal the fault occurred in the motor. The mother wavelet used in calculating the wavelet coefficients is Daubechies db10 with 8 decomposition levels. The energy is calculated with the phase current measured in all the phases under healthy and single phasing faulty conditions. The considered single phasing faulty conditions are R phase open, Y phase open and B phase open. The tableII shows the energy calculated in each decomposition level for healthy and faulty conditions with phase currents measured in R phase. TableIII shows the energy calculated using the current measured in Y phase. TableIV shows the energy calculated using the current measured in B phase. For the data listed in tabled 2 to4, the energy is calculated and it is shown using fig4. i.e. Fig6 shows the energy of the wavelet coefficients of each decomposition level under healthy and single phasing faulty conditions with the stator currents measured in all the phases.
Fig6a,b,&c show the energy of the signal calculated using the wavelet coefficients of R phase, Y phase & B phase stator current signal. The energy of the signal is calculated with healthy data and faulty data. The faulty data considered are R phase open, Y phase open and B phase open. When single phasing fault occurs in R phase, the energy of the R phase signal is lesser compared to the healthy condition; when the single phasing fault occurs in other phases Y or B, the energy calculated with R phase measurement is higher compared to the healthy conditions.
Abitha Memala.W et al. / International Journal of Engineering and Technology (IJET)
ISSN : 0975-4024 Vol 6 No 6 Dec 2014-Jan 2015 2717

TABLE II ENERGY CALCULATED FROM THE CURRENT MEASURED IN R PHASE
TABLE IIII ENERGY CALCULATED FROM THE CURRENT MEASURED IN Y PHASE
Wavelet decompos
ition levels
Energy in Joules (R phase measurement)
Healthy R ph open
Y ph open
B ph open
1 3.47E+08 1.93E+08
1.05E+09 9.56E+08
2 3.47E+08 1.93E+08
1.05E+09 9.56E+08
3 3.47E+08 1.93E+08
1.05E+09 9.57E+08
4 3.47E+08 1.93E+08
1.05E+09 9.57E+08
5 3.47E+08 1.93E+08
1.05E+09 9.58E+08
6 3.48E+08 1.94E+08
1.05E+09 9.59E+08
7 3.48E+08 1.95E+08
1.05E+09 9.62E+08
8 3.49E+08 1.97E+08
1.05E+09 9.66E+08
Wavelet decomposition
levels
Energy in Joules (Y phase measurement)
Healthy R ph open
Y ph open
B ph open
1 3.50E+08 9.64E+08 1.94E+08 1.05E+09 2 3.50E+08 9.64E+08 1.94E+08 1.05E+09 3 3.50E+08 9.64E+08 1.94E+08 1.05E+09 4 3.50E+08 9.65E+08 1.95E+08 1.05E+09 5 3.51E+08 9.65E+08 1.95E+08 1.05E+09 6 3.51E+08 9.66E+08 1.95E+08 1.05E+09 7 3.52E+08 9.69E+08 1.97E+08 1.05E+09 8 3.53E+08 9.73E+08 1.99E+08 1.06E+09
Abitha Memala.W et al. / International Journal of Engineering and Technology (IJET)
ISSN : 0975-4024 Vol 6 No 6 Dec 2014-Jan 2015 2718

TABLE IIIII ENERGY CALCULATED FROM THE CURRENT MEASURED IN Y PHASE
When the energy is calculated using the stator current measured in Y phase, the energy of the signal with Y phase single phasing fault is lesser compared to the healthy condition. The energy of the signal with the other phase opened will be higher when it is calculated with Y phase currents.The energy calculated with B phase stator current has the energy lesser than the healthy condition, during B phase single phasing fault and higher than the healthy condition, during the other phase single phasing faults. From the above discussion it is clear that the energy is lesser than the healthy condition, if the single phasing fault is occurred in the same phase; whereas the energy in other phases increases.
(a)
(b)
Wavelet decomposition
levels
Energy in Joules (B phase measurement)
Healthy R ph open
Y ph open B ph open
1 3.54E+08 1.05E+09 9.61E+08 1.94E+08 2 3.54E+08 1.05E+09 9.61E+08 1.94E+08 3 3.54E+08 1.05E+09 9.61E+08 1.94E+08 4 3.54E+08 1.05E+09 9.61E+08 1.94E+08 5 3.54E+08 1.05E+09 9.61E+08 1.94E+08 6 3.54E+08 1.05E+09 9.61E+08 1.94E+08 7 3.54E+08 1.05E+09 9.61E+08 1.94E+08 8 3.55E+08 1.05E+09 9.61E+08 1.94E+08
Abitha Memala.W et al. / International Journal of Engineering and Technology (IJET)
ISSN : 0975-4024 Vol 6 No 6 Dec 2014-Jan 2015 2719

(c)
Fig6. Energy calculated from the wavelet coefficients of the original signal at different decomposition levels with the stator current measured in (a) R phase (b) Y phase (c) B phase
A. Generating 3phase ac voltage The standard deviation from the wavelet analysis of the of the stator current during healthy and faulty
conditions are given in table V. TABLE V
STANDARD DEVIATION OF THE HEALTHY AND FAULTY CONDITIONS
From table V, the standard deviation of the healthy conditions is approximately same with all the phase currents. Under single phasing faulty condition, the standard deviation of the faulty phase stator current is very much lesser compared to the other two phases; and it is lesser than the standard deviation of the phase currents of the healthy condition also. Standard deviation in other 2 phases is more than the healthy condition. From the above discussion, the standard deviation value calculated from the wavelet coefficients of the stator current is able to reveal the single phasing fault and the phase in which fault occurs. B. Result & Discussion
The energy and standard deviation calculated from the wavelet coefficients of the stator current is able to reveal the single phasing fault and locate the faulty phase also. During healthy condition, the energy and standard deviation is same with the currents measured in all the phases. If single phasing fault occurs, the calculated energy & the standard deviation values in that phase are reduced than the healthy condition; whereas in all the other phases it increases.
V. CONCLUSION
The energy and standard deviation of the stator current is measured in all the phases after decomposing the signal using Daubechies db-10 & lev12. The sampling frequency of the signal is 100kHz. In our work, the single phasing fault is identified. The energy is calculated using DWT along with PSD; the standard deviation is calculated from wavelet coefficients. This method is able to reveal the single phasing fault occurrence and location of the faulty phase. DWT along with PSD achieves better results in fault diagnosis.
This work can be extended to identify the severity of the fault.
Fault type
Standard deviation
R phase measurement
Y phase measurement
B phase measurement
healthy 53.79 54.01 54.31
R ph open 40.06 89.63 93.6
Y ph open 93.32 40.24 89.49
B ph open 89.27 93.39 40.22
Abitha Memala.W et al. / International Journal of Engineering and Technology (IJET)
ISSN : 0975-4024 Vol 6 No 6 Dec 2014-Jan 2015 2720
ACKNOWLEDGMENT
The heading of the Acknowledgment section and the References section must not be numbered. Causal Productions wishes to acknowledge Michael Shell and other contributors for developing and
maintaining the IEEE LaTeX style files which have been used in the preparation of this template. To see the list of contributors, please refer to the top of file IEEETran.cls in the IEEE LaTeX distribution.
REFERENCES [1] A.R.Mohantry, C.Kar, “Monitoring gear vibrations through motor curret signature analysis and wavelet transform”, Mechanical
systems and signal processing, vol.20, no.1, pp.158-187, Jan 2006. [2] A.J.C.Sharkey, G.O.Chandroth and N.E.Sharkey, “Acoustic emission cylinder pressure and vibration:A multi sensor approach to
robust fault fault diagnosis”, IJCNN 2000, vol.6, pp.223-228. [3] C.Thanga Raj, Radha Thangaraj, Millie Pant, Pascal Bouvry, Ajith Abraham, “Design optimization of induction motors with
differential evolution (DE) algorithms with an application in textile spinning,” Application of Artificial Intelligence, Vol. 26, No. 9, pp. 809-831, 2012.
[4] A.Soualhi, H.razik and a.Lebaroud, “Fault detection and diagnosis of induction motors based on hidden markov model”, Int. Conf. Elelect. Mach. 2012, pp.1693-1699, Sep 2012,
[5] M.Mansouri, M.Mohamed-Seghir, H.Nounou, M.Nounou and H.Abu-rub, “States and parameters estimation in induction motor using Bayesian Techniques” 10th IMCSSD, Tunisia, Mar 2013.
[6] Arun Gandhi, Timothy Corrigan, Leila Parsa. ”Recent advances in modeling and online detection of stator interturn faults in electrical motors” IEEE Trans. Ind . Electron., Vol.58, No.5, May 2011 .
[7] M.P.Sanchez, M.R.Guasp, J.A.A.Daviu, J.R.Folch, J.P.Cruz and R.P.Panadero, “ Diagnosis of induction motor faults in the fractional fourier domain”, IEEE Trans. Inst. Meas., Vol.59, No.8, Aug 2010.
[8] Bonnett, Austin H. ,” Analysis of Winding Failures in Three-Phase Squirrel Cage Induction motors” IEEE Trans. Ind. Applicat., Vol: 14 , Issue:3,pp-223 – 226, May 1978.
[9] Guillermo.A.Jimenez, Alfredo.O.Munoz, Manuel.A.Duarte-Mermoud,”Fault detection in induction motors using Hilbert and wavelet transforms”, J.Elect.Engg., Vol.89, pp.205 – 220, Jan 2007.
[10] Khadim Moin Siddique, V.K.Giri,”Broken bar fault detection in induction motors using wavelet transform”, Int. Conf. Computing Electronics & Electrical Technologies (ICCEET), pp.1-6, Mar 2012.
[11] Jose A. Antonino-Daviu, Martin Riera-Guasp, Jose Roger Folch, M.Pilar Molina Palomares,”Validation of a new method for the diagnosis of rotor bar failures via wavelet transform in industrial induction machines”, IEEE Trans. Indus.appln.,Vol.42, No.4, July/Aug 2006.
[12] A. Bonnett & G. Souk up,”Cause & analysis of stator & rotor failures in three phase squirrel cage induction motors”, IEEE Trans. Ind.Appln., Vol. 28,No. 4, pp. 921 – 937, Jul / Aug 1992.
[13] W.S. Chow & S.Hai, “ Induction machine fault diagnostic analysis with wavelet technique”, IEEE Trans. Ind. Eletron.., vol.51, Issue 3, pp. 558 – 565, Jun 2004.
[14] Syed Kamruddin Ahmed, “Diagnosis of broken bar fault of induction motor through envelope analysis of motor start up current using Hilbert & Wavelet transform”, Innovative system design Engg., Vol. 2, No.4, 2011.
[15] Chee-Mun Ong,” Three phase induction machines” in Dynamic simulation of Electrical Machinery using MATLAB/Simulink, New Jersey, Printice Hall PTR, 1998, ch.6, sec.6.8, pp.196-202.
[16] Neelam Mehala, Ratna Dahiya “ Detection of bearing faults of induction motor using Park’s vector approach”, IJET, Vol. 2(4), pp. 263 – 266.
[17] Jordi Cusido, Luis Romeral, Jual A.Ortega, Javier.A.Rosero, Antonio Garcia Espinosa,”Induction motor fault detection by using wavelet decomposition on dqo components”, IEEE ISIE 2006, Montreal, Quebec, Canada,Vol.3, pp.2406 – 2411, July 2006.
[18] L.Frosini, E.Bassi, “Stator current and motor efficiency as indicators for different types of bearing faults in induction motors”, IEEE Trans. Ind. Electr., vol.67, no.1, Jan 2010.
[19] Jordi Cusido, Luis Romeral, Jual A.Ortega, Javier.A.Rosero, Antonio Garcia Espinosa,”Fault detection in induction machines using power spectral density in wavelet decomposition”, IEEE Trans.Indus.electron.,Vol.55, No.2, pp. 633-643, Feb 2008.
Abitha Memala.W et al. / International Journal of Engineering and Technology (IJET)
ISSN : 0975-4024 Vol 6 No 6 Dec 2014-Jan 2015 2721