singapore exporter guide 2015 - usda gain publications/exporter guide... · alice kwek joani dong...
TRANSCRIPT

THIS REPORT CONTAINS ASSESSMENTS OF COMMODITY AND TRADE ISSUES MADE BY
USDA STAFF AND NOT NECESSARILY STATEMENTS OF OFFICIAL U.S. GOVERNMENT
POLICY
Date:
GAIN Report Number:
Approved By:
Prepared By:
Report Highlights:
Singapore is the fourth largest market for U.S. agriculture, fish, and forestry products. Singapore is a
leading market for high-value consumer-oriented products. The market is dynamic with high interest in
new products, yet very competitive. Leading U.S. prospects are temperate fruits, dairy products, further
processed meat products, prepared foods, edible nuts, snacks and fruit juices.
Post:
Singapore
Alice Kwek
Joani Dong
2015
Exporter Guide
Singapore
SN6002
2/26/2016
Required Report - public distribution

GAIN REPORT: SN6002 – Exporter Guide Annual 2015 Page 2
Table of Contents
EXECUTIVE SUMMARY .......................................................................................................... 3
SECTION I. MARKET OVERVIEW ........................................................................................ 4
SECTION II. EXPORTER BUSINESS TIPS ........................................................................... 7
SECTION III. MARKET SECTOR STRUCTURE AND TRENDS ...................................... 8
SECTION V. KEY CONTACTS AND FURTHER INFORMATION ................................. 14
APPENDIX I. STATISTICS ...................................................................................................... 15

GAIN REPORT: SN6002 – Exporter Guide Annual 2015 Page 3
EXECUTIVE SUMMARY:
Singapore is one of the world’s most open economies and is highly dependent on international trade; it
is the 14th
largest exporter and the 15th
largest importer in the world. With one of the highest per capita
GDPs ($58,497) in the world, it is also a solid market for U.S. high value products. In 2014, the U.S.
exported a record $783 million in consumer-oriented products to Singapore, with sales expected to grow
another 10 percent in 2015. Leading U.S. prospects are temperate fruits, dairy products, further
processed meat products, prepared foods, nuts, and fruit juices.

GAIN REPORT: SN6002 – Exporter Guide Annual 2015 Page 4
SECTION I. MARKET OVERVIEW
Singapore is an independent Republic with a land area of 270 square miles and a population of 5.5
million in a highly urbanized island. The resident population is 74 percent ethnic Chinese, 13.3 percent
Malay, 9 percent Indian and 3.5 percent of other ethnic groups. Major languages spoken are English,
Mandarin and Malay. Singapore has a low annual birth rate of less than one percent.
Strategically located in the middle of key trade flows from Asia, Australia, Europe, the Middle East and
the U.S., it is one of the world’s most open economies and is highly dependent on international trade.
The volume of its external trade is about three and a half times its annual Gross Domestic Product.
Any decline in the economies of any of its major trading partners, i.e. the U.S., China, Malaysia,
Indonesia, and South Korea will have an impact on the economy. The top five trading partners are the
China, Malaysia, the United States, Indonesia and Hong Kong.
Singapore's principal exports are petroleum products, food and beverages, chemicals, textile/garments,
electronic components, telecommunication apparatus, and transport equipment. Singapore's main
imports are aircraft, crude oil and petroleum products, electronic components, radio and television
receivers/parts, motor vehicles, chemicals, food/beverages, iron/steel, and textile yarns/fabrics.
Singapore is at the cross-roads of major air and sea routes within the Asia Pacific region and serves as a
hub and major transshipment center for much of the Southeast Asian region and the Indian
subcontinent. Singapore's role in regional trade is demonstrated by the fact that re-exports comprise
between 45-50 percent of total exports. It is also serves as a regional food showcase and headquarters
for international food and agricultural related companies.
The Market for Consumer Oriented Foods
Singapore is almost entirely dependent on imports for all of its food requirements with virtually no local
agricultural production. There are no import tariffs or excise taxes for all food and beverages, except
for alcoholic beverages and tobacco products. However, a Goods and Services Tax of 7 percent (GST)
is levied for all goods and services at the point of distribution.
In 2014, Singapore imported $12.67 billion of agriculture, fish and forestry products. The United States
was the fourth largest supplier, accounting for US$999 million in imports. Malaysia, Indonesia, and
China are the other members of the top three in descending order.
The total value of imported consumer oriented foods exceeded $7.3 billion in 2014. A total value of
US$10.5 billion of fish and seafood products were also imported. Major Consumer-Oriented food
imports include dairy products, alcoholic and non-alcoholic beverages, meat, fresh fruit and vegetables,
snack foods and processed fruit and vegetable. The U.S. is a major supplier of fresh and processed
fruits and vegetables, meats, dairy products, breakfast cereals, snack foods, and prepared microwaveable
meals.
Competition with U.S. agricultural products comes from Australia, New Zealand, EU, Brazil, China and

GAIN REPORT: SN6002 – Exporter Guide Annual 2015 Page 5
South Africa, who export similar consumer oriented products, including temperate fruits and vegetables,
fruit juices, nuts, wines, processed packaged and canned food products, confectionery and candies,
frozen poultry and frozen meats. As the market for consumer-oriented products is very open and easily
accessible, there is fairly quick entry for new comers. Competition in some of the consumer product
categories is very intense.
The major impediments to U.S. agricultural exports are strict sanitary requirements on meat, poultry and
egg imports. A good example is AVA’s zero tolerance for salmonella enteriditis and extremely low
tolerance for staph aureus in poultry meat to protect consumers from poor food handling and cooking
practices. AVA also objects to certain use of anti-microbial sprays on animal and poultry carcasses,
which is a widespread practice in the United States.
Not all the imported foods are consumed locally. It is estimated that routinely, and, depending on the
product category, up to 75 percent of food imports are re-exported mostly to neighboring countries.
Major product categories include dairy products, frozen poultry and poultry parts, fresh fruit and
vegetables, red meats, alcoholic and non-alcoholic beverages, snack foods and other consumer-oriented
products. The growth rate for the consumer oriented foods category averaged about 5 percent per annum
over the calendar period 2012-2014. The U.S. market share from 2012 to 2014 averaged 9-11 percent
for the consumer oriented foods category.
Demography and Socio-economic impact
Singapore’s population growth rates have been falling rapidly in the last decade as a result of the
decreasing number of births by Singapore citizens. The current total population of 5.53 million
comprised of 3.87 million citizens and permanent residents and 1.63 million non-residents. The
proportion of elderly residents has increased rapidly over the last ten years. Residents aged 65 years
and above comprised 11 percent of Singapore’s resident population. Half of the resident population
aged 25 years and over had at least post-secondary qualifications in 2014. University graduates
constituted 23.7 per cent of the resident population in 2014, compared to 16 per cent a decade ago.
Residents with diploma and professional qualifications also accounted for a larger share at 14.7 per cent
in 2014.
Among the resident population, 32.2 per cent were singles in 2014, a slight increase from 30.8 per cent
in 2004. Conversely, married persons constituted 59.5 per cent in 2014, a decline from 61.3 per cent a
decade ago. Divorced or separated persons and widowed persons made up 3.4 per cent and 4.9 per cent
of the resident population respectively in 2014
The most common type of dwelling among resident households in 2014 continued to be HDB
(government subsidized apartments) 4-room apartments - 32.2 per cent, followed by HDB 5-room and
executive apartments - 24.4 per cent and HDB 3-room apartments - 18.3 per cent. In 2014, 13.5 per
cent of resident households stayed in condominiums & other apartments and 5.8 per cent stayed in
landed properties. The proportion of resident households staying in condominiums and other apartments
had generally increased over the years.

GAIN REPORT: SN6002 – Exporter Guide Annual 2015 Page 6
Left: Government Subsidized Apartments in Chinatown
Center: Eu Tong Sen Street in Chinatown
Right: Part of Singapore River within the Central Business District
(Source: FAS Singapore)
Summary of socio-economic impact of changing demographic structure.
Slower growth rates in domestic demand.
Growing personal disposal income due to better-educated workforce.
Smaller household sizes due to falling marriage and birth rates.
Growing demand for food products for the mature age groups.
Growth and diversity in consumer tastes with the greater increase in the number of highly
educated and more traveled Singaporeans.
The rising numbers of visitor arrivals and foreign workers in the country have contributed to a
more diverse consumer base.
More working women and single professionals have led to growth in demand for convenience
foods and ready to cook prepared meals.

GAIN REPORT: SN6002 – Exporter Guide Annual 2015 Page 7
Advantages and Challenges for U.S. Suppliers
Advantages Challenges
Fast growing incomes and highly educated
population.
High costs of entry into major supermarket
chains.
Increasing preference for higher quality products. Lower prices of competing products from
other countries.
Proliferation of western family-style restaurants and
fast food chains.
Inadequate knowledge on use of U.S.
products.
Large numbers of resident expatriate population
familiar with western type foods.
High promotional and advertising costs for
introducing new products.
SECTION II. EXPORTER BUSINESS TIPS
Local Business Practices and Custom In the arena of international trade, Singapore business practices tend to follow those in the more
developed and highly urbanized economies. The country’s laws are patterned after the British legal
system. There is considerable reliance on international trading practices and contracts.
Letters of credit are normally used for first time transactions and only after a long history of business
relationship is established, the terms of payment may be mutually adjusted to an open trading account
with payment terms of up to two months. It is not uncommon for buyers to request for samples from
first time suppliers. In some cases, U.S. exporters may request that buyers pay for airfreight charges and
handling costs of samples if they become prohibitive.
U.S. exporters who are exporting for the first time to the Singapore market would be advised to consider
making use of local distributors or at least a local representative to help them guide through the
requirements of the Singapore Food regulations and local trading practices.
However, financial and credit arrangements in the domestic economy are very different. With few
exceptions, supermarket chains, restaurants and other retail customers expect suppliers to provide credit
terms of up to ninety days. There is also an implicit understanding to accept the return of damaged and
unsold goods. On the other hand, some small retailers like Mom and Pop stores pay cash on delivery, as
their order sizes are very small. Hence, if U.S. exporters decide to carry out their own local distribution,
they would have to expect to meet the usual credit terms demanded by local supermarket chains.
General Consumer Tastes and Preferences
With rising consumer incomes, Singaporeans are prepared to pay for higher quality food products or
products that will provide savings in labor and time. Hence, on the supermarket shelves we tend to see
an increasing number of prepared and convenience foods. Diced vegetables and seasoned portion-
control meats and poultry are in increasing demand as both spouses work.
As almost all Singapore households are of Asian origin, imported foods that are to be used in local
cooking have to be able to lend themselves to Asian cuisines. Asian dishes tend to be stir fried,
prepared in curries or marinated in sauces.
GAIN REPORT: SN6002 – Exporter Guide Annual 2015 Page 8
Food Standards and Regulations Singapore food laws are delineated in the Food Act and all packaged foods sold in retail outlets have to
comply with the allowable ingredients and preservatives listed in the abovementioned Act (please refer
to the latest GAINS FAIRS Report in the USDA website, (www.fas.usda.gov).
Singapore has a very open import regime and all foods, with the exception of alcoholic beverages and
tobacco products are imported duty-free. There are practically no non-tariff restrictions since there is
very little local production and the current government policy is to source food products from all over
the world. Customs clearance of imported food products is carried out electronically and the process is
completed in less than 48 hours.
Import and Inspection Procedures. Export health certification is required for the import of meat, poultry
products and shellfish products. In most import cases, random inspection and laboratory analysis of
meat and poultry products are carried out.
SECTION III. MARKET SECTOR STRUCTURE AND TRENDS
Consumer-oriented Foods and Beverages & Edible Fishery Products Singapore, which has one of the highest per capita income in Asia, is one of the most open economies in
the world with no tariffs on all food products except on alcoholic beverages. As a result, a wide range
of food products from all over the world can be found on supermarket shelves in this compact island
nation of 5.53 million people.
The major suppliers of fresh temperate climatic fruit to Singapore are the United States, Australia, South
Africa, New Zealand, Korea, Egypt, Spain, France, Argentina and Turkey. Suppliers of tropical fruit
are neighboring countries of Malaysia, Philippines, Thailand and Vietnam. Singapore households buy
mostly fresh leafy green vegetables from China, Malaysia, Indonesia, Thailand, and Vietnam. On the
other hand, most of the imported temperate vegetables originating from Australia, New Zealand,
European Union and the United States are supplied to restaurants and larger supermarket stores.
Singapore imports all the meats and poultry it consumes from all over the world. Poultry and pork are
the main meat items consumed in Singapore. Freshly slaughtered chicken is obtained mostly by
importing live poultry from Malaysia for slaughter in local abattoirs. About half of the chicken
requirements are fulfilled through the imports of frozen chicken and chicken parts from Brazil,
Thailand, United States, Malaysia, Argentina and China.
Since local pig farms ceased production in April 1999, the only source of imported live pigs (about
335,000 head annually) for slaughter comes from Indonesia. Most of Singapore’s pork requirements are
fulfilled through the import of chilled pork from Australia and frozen pork from European Union and
the United States. Beef, while not as widely consumed as chicken, is sold principally in the
supermarkets. Major suppliers of beef include Australia, New Zealand, Argentina and China.
In the fish and seafood category, Singaporeans consume mostly fresh and frozen finfish caught and sold
by neighboring countries, i.e. China, Malaysia, Indonesia, and Vietnam. Other major suppliers include
Norway, Thailand, Japan, Australia and India. In 2014, a total value of US$1 billion of fish and
seafood were imported from worldwide sources.
Singaporeans are very fond of fresh seafood; especially fin fish, crabs, lobsters and clams. While most

GAIN REPORT: SN6002 – Exporter Guide Annual 2015 Page 9
of the finfish are purchased in the wet markets for home consumption, Singapore consumers generally
go to restaurants for the consumption of crabs and lobsters.
Food Retail Sector
The Singapore food retail industry had total revenues of $10 billion in 2014, and it is estimated that
about 50 percent of the food retail sales of $5.7 billion take place in supermarkets, hypermarkets and
modern mini marts, while the rest are sold in convenience shops, neighborhood/ traditional provision
stores (Mom & Pop stores), petrol stations and wet market stalls. Traditionally Singaporeans shop for
their fresh produce, meats and fish in wet market stalls. However, the trend is now changing with more
households are patronizing to supermarkets for their fresh produce, meats and fish requirements.
Generally, importers who represent foreign brands will be responsible for the market development of
the brands, advertising and promotion and increasing distribution reach to all retailers.
Generally, the large supermarket chains and several up-market retailers import western-type products
directly from source countries, consolidators and distributors for their own outlets, while smaller
retailers buy from local distributors. Products imported directly include juices, jams, confectionery,
biscuits, salad dressings, pre-packed deli meats and fresh temperate fruit. Products procured from local
importers would include products from the Asian region, dry groceries, tropical fruit, frozen chicken
and chicken parts, frozen beef, local sauces and ethnic foods.
Two major supermarket chains dominate the Singapore retail industry, Dairy Farm, and NTUC
Fairprice. Dairy Farm stores target principally the middle and higher income groups, while NTUC cater
to the mass-market group. NTUC Fairprice remains the leader in the industry with a market share of 33
percent.
The largest supermarket chain in terms of number of supermarket retail stores is the Dairy Farm Group
with 123 supermarket stores, comprising of 47 Cold Storage supermarket retail stores, 9 premier Market
Place stores, 4 Specialty stores and 62 Giant Stores (previously called Shop & Save). A large
percentage of products on their shelves are western-type products from the EU, Australia, New Zealand
and the United States. Nine of their outlets are located in upper middle-income residential areas and
customers to these outlets are principally expatriates and upper middle-income residents. In addition, the
Dairy Farm Group operates the 7-Eleven Convenience Chain of 530 stores and 128 Guardian Pharmacy
outlets.
The second largest, is the NTUC Fairprice supermarket chain with a network comprising 97 Fairprice
supermarkets, 16 Fairprice Finest stores and 7 Fairprice Xtra (Hypermarkets). In addition, the group
has 160 Cheers Convenience Stores and 20 Fairprice Convenience Stores some of which are located in
Esso-Mobil Stations. NTUC Fairprice’s target audience is principally the middle and lower income
groups.
Competitive pricing is one of the main factors determining whether a new product should be procured
for the NTUC Fairprice stores. The NTUC Fairprice chain is the most extensive in terms of consumer
reach, geographically and across all income segments. Fair price stores are located in almost every large
residential population concentration. Importers who require their products to be distributed island-wide
and with the focus on the mass market prefer to work with NTUC Fairprice.
GAIN REPORT: SN6002 – Exporter Guide Annual 2015 Page 10
NTUC Fairprice supermarket chain procures their food products from consolidators, distributors local
importers. The company has also embarked since 1985 on extensive house branding of basic essentials
like confectionery, rice, bread, sauces, cooking oil, toilet paper, tissue paper, sugar, detergents, canned
fruits and vegetables, etc. The items are, on average, priced 10 to 15 per cent lower than comparable
products. In July 2008, “Pasar Organic” was added to the range, offering organic produce at affordable
prices.
There are several independently managed supermarkets such as Big Box, Isetan, Meidi-Ya, Mustafa’s,
and Prime Supermarket. The most recently established supermarket chain, Sheng Siong which has 33
small and medium sized stores and Prime Supermarket with 19 outlets are family-owned business
entities which originated from small single grocery outlets to their current sizes today. Both Sheng
Siong and Prime are very price competitive as they procure most of their products from China and other
neighboring low cost Asian supplier countries.
Customers of both supermarket chains come mostly from the lower middle-income groups. The rest of
the above mentioned supermarkets are independently operated supermarket stores with only one outlet
each. Isetan and Meidi-Ya target principally the upper middle-income groups and the Japanese
community in Singapore.
Food Service Sector
The Singaporean foodservice market has witnessed steady growth mainly due to a steady domestic
economy, rise in tourism and demographic changes. Restaurant sales reported an increase of 10 percent
for 2014 due to the greater influx of tourists and business arrivals. The key drivers of the foodservice
industry are growth in tourism, a stable economic environment, increases in the female working
population and a low level of inflation. The opening of the two integrated resorts; Marina Bay Sands
and Resorts World Singapore and new leisure facilities; Gardens by the Bay and Marine Life Park, and
shopping malls provided opportunities for further expansion by existing players and allowing new
entrants into the market.
Singaporeans spend about US$5.7 billion annually eating out. Restaurants as a group account for 37
percent, while fast food outlets account for 13 percent of the total revenue in the food & beverage
services industry. Food caterers take up a 12 percent share of the food and beverage industry. The
Others Category consisting of cafes, coffee houses, food courts, coffee shops and eating houses take up
38 percent of the total.
Since eating out in the numerous cooked food stalls located round every corner of major housing
residential estates is relatively inexpensive, most Singaporeans eat out at least once a day. A Department
of Statistics survey found that an average monthly household of US$213 was spent at dining-in
restaurants, cafés and pubs. As most households have working wives, Singapore families find it more
convenient and, in most cases, less expensive to eat out. It is not uncommon each evening to see
families walk to the nearest neighborhood cooked-food stall to have their dinner.
About 5,500 cooked food stall outlets exist on the island. Besides these cooked-food stalls, fast food
chains like McDonalds, Kentucky Fried Chicken, Burger King, Pizza Hut, Swensen’s are located in

GAIN REPORT: SN6002 – Exporter Guide Annual 2015 Page 11
large shopping malls across the island.
Food service companies in Singapore are widening their distribution network to other countries in the
Asian region to achieve economies of scale in operation. As individual restaurant requirements are
small, Singapore food service companies provide an alternative supply chain to customers who have
small but frequent procurement needs for U.S. or western-type products.
A number of well-known U.S. brands are being transshipped or distributed from Singapore. Singapore
Importers/Traders are able to provide credit terms to their counterparts in the region or to carry out
specific handling, packaging or documentation requirements. Generally, products which have a longer
shelf life and which do not need refrigeration are more easily transshipped.
Meat and poultry products, which require halal certification for Muslim consumers in the region, are
generally shipped direct to the country of destination. Again, some Singapore traders may be involved
in the procurement process as well as in the provision of short-term credit to the local importers in the
destination country.
Food Processing Sector
Singapore’s food processing sector is relatively small due to limited natural resources, livestock and
agricultural production. As the country engages in very minimal agricultural production, raw materials
for food processing are largely imported. The relatively limited local food manufacturers are also
unable to meet the overall demand; hence Singapore imports large amounts of processed food products.
The U.S., Malaysia Indonesia Australia and China are Singapore’s main suppliers of food and food
products. Competition is largely dependent on the nature of the product. For example, Australia and
New Zealand supply most of the milk products and dairy ingredients and China supplies mostly the corn
and soybean products, and Malaysia supplies nearly 20percent of the food ingredient market and a
major supplier of live poultry, edible oils, and tropical fruits and vegetables. The U.S. has substantial
market share in juice, juice concentrate, frozen poultry parts, fresh temperature fruit, nuts, flavorings,
spices and leaf tobacco.
In 2014, the U.S. exported $795.2 million in total agricultural products to Singapore, which was a
5percent growth from 2013. Of that amount, a record $608.1 million in consumer-oriented products
were exported to Singapore, an increase of 6 percent%. Top exports of processed foods to Singapore in
2014 included ingredients and beverage bases, chocolate, distilled spirits, whey protein, lactose and
syrups, French fries, powdered milk and dry beverages.
Singapore’s food processing sector is made up of 750 companies, dominated by mainly small and
medium enterprises. These companies span 17 sub-sectors, ranging from flavors, sauces, ready meals,
noodles, deli meats, sausage making, confectionery, chocolates, snack foods to beverages. Some of the
food manufacturers are keen to venture overseas and many have gained footholds in various parts of the
countries, including the ASEAN region and in the Middle East and Russia.
Singapore food manufacturers are keen to invest in Research and Development to cater to wider

GAIN REPORT: SN6002 – Exporter Guide Annual 2015 Page 12
consumer bases through improved packaging, and product shelf life, as well as adherence to strict food
safety standards. Many are certified to international food safety standards as the Hazard Analysis and
Critical Control Points (HACCP), ISO 22000 and BRC which help them gain a competitive edge in the
global marketplace.
SECTION IV. BEST HIGH –VALUE PRODUCT PROSPECTS
Product
Category
2014
Market
Size
(Volume)
Metric
Tons
2014
Imports
5-Year
Avg.
Annual
Import
Growth
Key
Key
Constraints
Over Market
Development
Market
Attractiveness
for USA
Breakfast
Cereals
1,518 $43,031,774
15% Availability of
local brands at
lower price
points.
Consumer health
consciousness
and for quick
breakfast drive
demand.
Dairy
Products
361,551 $1,242,422,626 8% Availability of
products from
New Zealand,
Australia and
France.
As consumer
becomes gain
product
understanding,
opportunities
will exist for
development for
U.S. dairy
products.
Fresh
Fruits
433,796 $537,816,369 11% Strong
competition
from China,
Malaysia,
Australia and
South Africa
Strong demand
for U.S. products
for premium
fruits such as
stone fruits,
summer berries
and avocados.
Edible
Nuts
n/a $161,206,955 34% Price sensitive
market.
Very strong
demand for U.S.
nuts.
Products Not Present in Significant Quantities But Have Good Sales Potential
Product 2014 2014 5-Year Key Constraints Market

GAIN REPORT: SN6002 – Exporter Guide Annual 2015 Page 13
Category Market
Size
(Volume)
Metric
Tons
Imports Avg.
Annual
Import
Growth
Key
Over Market
Development
Attractiveness
for USA
Fish and
Seafood
198,641 $1,049,132,259 4% Intense
competition
from lower
cost regional
suppliers
such as
China,
Malaysia,
Indonesia
and Vietnam
High fish
consumption with
fish and meat
accounting for
approximately
40% of a typical
diet.
Pork 89,713 $323,247,778 14% Strong
competition
from
Australian
air-flown
fresh
product, and
frozen
Brazilian
product at
the lower
segment
Major protein
food staple, good
prospects in high-
end outlets where
consumers pay
premium price for
higher quality.
Fresh
Vegetables
508,655 $432,589,425 -0.7% Price
sensitivity
for some
vegetables
such as
asparagus as
well as lower
priced
alternatives
from
regional
markets such
as Malaysia,
China, India
and
Australia.
Solid demand for
U.S. produce,
consumers will
pay premium for
fresh air-flown
produce.
Snack
Foods
67,757 $416,315,848 7% Competition
from cheaper
sources such
as Malaysia
and Italy.
Strong demand
for quality U.S.
products and U.S.
product has
strong brand
recognition.
Wine 32,887,742
liters
$628,682,522 12% Diverse
competitive
market with
a massive
number of
Broad and wide
market, with
many
opportunities at
the right price

GAIN REPORT: SN6002 – Exporter Guide Annual 2015 Page 14
labels from
Australia,
France, Italy,
Chile, South
Africa, etc.
point.
SECTION V. KEY CONTACTS AND FURTHER INFORMATION
U.S. Department of Agriculture (USDA)
Foreign Agricultural Service (FAS)
U.S. Embassy – Office of Agricultural Affairs
27 Napier Road
Singapore 258508
Fax:(65) 6476-9517
Tel: (65) 6476-9120
Email: [email protected]
Agri-Food & Veterinary Authority of Singapore
Ministry of National Development
Agri-Food & Veterinary Authority (Headquarters)
JEM Office Tower, #14-01
52 Jurong Gateway Road
Singapore 608550
Tel: 6805 2992 (General Enquiries)
Fax: 6334 1831
Website: www.ava.gov.sg
International Enterprise Singapore
230 Victoria Street, Level 10
Bugis Junction Office Tower
Singapore 188024
Tel: (65) 6337-6628
Fax: (65) 6337-6898
Website: www.iesingapore.com
Singapore Business Federation
10 Hoe Chiang Road
#22-01 Keppel Tower
Singapore 089315
Tel: (65) 6827-6828
Fax: (65) 6827-6807
Website: www.sbf.org.sg
GAIN REPORT: SN6002 – Exporter Guide Annual 2015 Page 15
Email: [email protected]
American Chamber of Commerce in Singapore
1, Scotts Road
#23-04, Shaw Centre
Singapore 228208
Tel: (65) 6235-0077
Fax:(65) 6732-5917
Website: www.amcham.org.sg
Singapore Retailers Association
371 Beach Road
#02-04/05 Keypoint
Singapore 199597
Tel:(65) 6295-2622
Fax:(65) 6295-2722
Email: [email protected]
Website: www.retail.org.sg
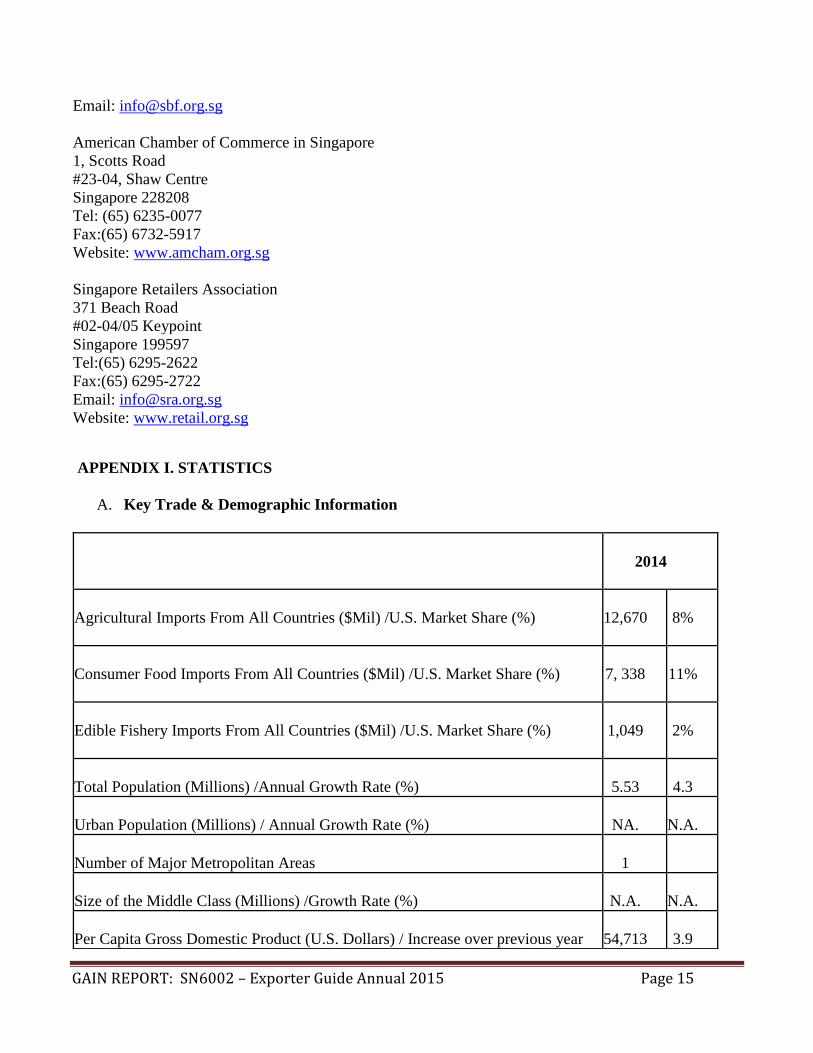
APPENDIX I. STATISTICS
A. Key Trade & Demographic Information
2014
Agricultural Imports From All Countries ($Mil) /U.S. Market Share (%)
12,670
8%
Consumer Food Imports From All Countries ($Mil) /U.S. Market Share (%)
7, 338
11%
Edible Fishery Imports From All Countries ($Mil) /U.S. Market Share (%)
1,049
2%
Total Population (Millions) /Annual Growth Rate (%)
5.53
4.3
Urban Population (Millions) / Annual Growth Rate (%)
NA.
N.A.
Number of Major Metropolitan Areas
1
Size of the Middle Class (Millions) /Growth Rate (%)
N.A.
N.A.
Per Capita Gross Domestic Product (U.S. Dollars) / Increase over previous year
54,713
3.9
GAIN REPORT: SN6002 – Exporter Guide Annual 2015 Page 16
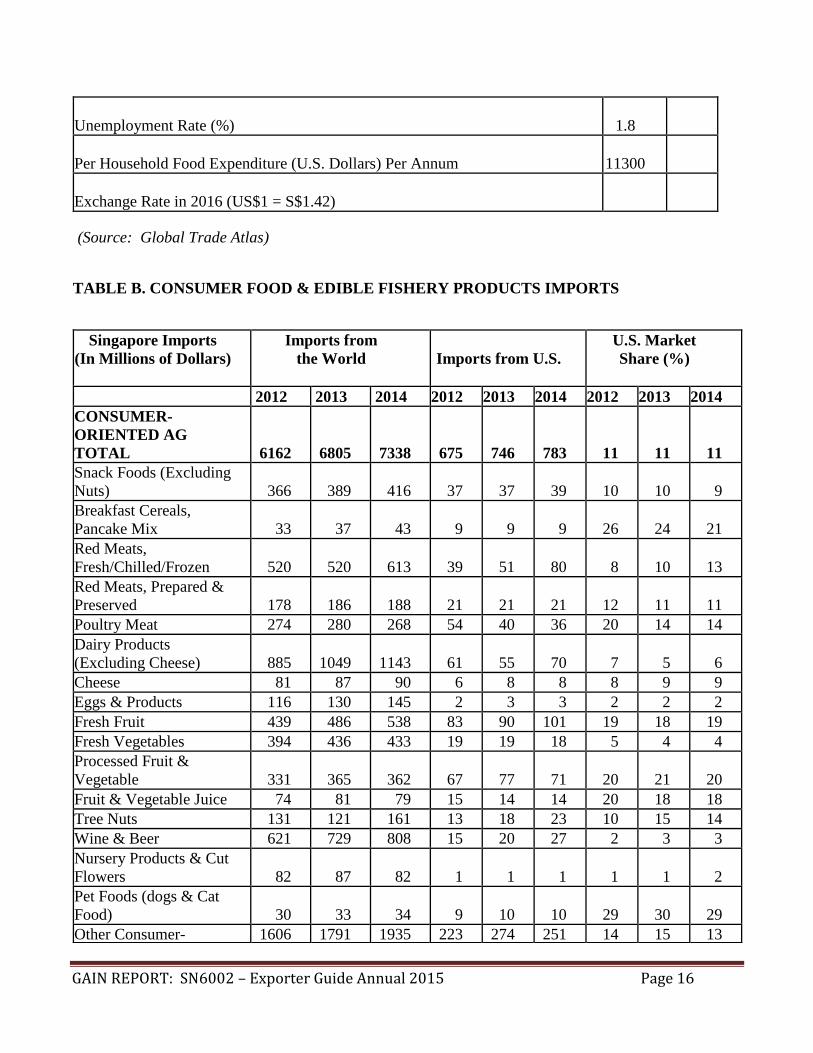
Unemployment Rate (%)
1.8
Per Household Food Expenditure (U.S. Dollars) Per Annum
11300
Exchange Rate in 2016 (US$1 = S$1.42)
(Source: Global Trade Atlas)
TABLE B. CONSUMER FOOD & EDIBLE FISHERY PRODUCTS IMPORTS
Singapore Imports
(In Millions of Dollars)
Imports from
the World
Imports from U.S.
U.S. Market
Share (%)
2012 2013 2014 2012 2013 2014 2012 2013 2014
CONSUMER-
ORIENTED AG
TOTAL 6162 6805 7338 675 746 783 11 11 11
Snack Foods (Excluding
Nuts) 366 389 416 37 37 39 10 10 9
Breakfast Cereals,
Pancake Mix 33 37 43 9 9 9 26 24 21
Red Meats,
Fresh/Chilled/Frozen 520 520 613 39 51 80 8 10 13
Red Meats, Prepared &
Preserved 178 186 188 21 21 21 12 11 11
Poultry Meat 274 280 268 54 40 36 20 14 14
Dairy Products
(Excluding Cheese) 885 1049 1143 61 55 70 7 5 6
Cheese 81 87 90 6 8 8 8 9 9
Eggs & Products 116 130 145 2 3 3 2 2 2
Fresh Fruit 439 486 538 83 90 101 19 18 19
Fresh Vegetables 394 436 433 19 19 18 5 4 4
Processed Fruit &
Vegetable 331 365 362 67 77 71 20 21 20
Fruit & Vegetable Juice 74 81 79 15 14 14 20 18 18
Tree Nuts 131 121 161 13 18 23 10 15 14
Wine & Beer 621 729 808 15 20 27 2 3 3
Nursery Products & Cut
Flowers 82 87 82 1 1 1 1 1 2
Pet Foods (dogs & Cat
Food) 30 33 34 9 10 10 29 30 29
Other Consumer- 1606 1791 1935 223 274 251 14 15 13

GAIN REPORT: SN6002 – Exporter Guide Annual 2015 Page 17
Oriented Products
FISH & SEAFOOD
PRODUCTS 1006 1009 1049 22 19 19 2 2 2
Salmon 49 68 69 0 0 0 0 0 0
Surimi 0 0 0 0 0 0 0 0 0
Crustaceans 323 372 408 10 10 9 3 2 2
Ground fish & Flatfish 42 29 29 2 3 1 5 10 3
Molluscs 107 106 106 5 4 3 4 4 3
Other Fishery Products 484 434 437 5 3 6 1 1 190
AGRICULTURAL
PRODUCTS TOTAL 10274 10428 10911 803 915 965 8 9 9
AGRICULTURAL,
FISH & FORESTRY
TOTAL 12036 12184 12670 849 954 999 7 8 8
(Source: Global Trade Atlas (GTA)
TABLE C. TOP 15 SUPPLIERS OF CONSUMER FOODS & EDIBLE FISHERY PRODUCTS
Consumer Oriented Agricultural Imports (In US$ Million)
Rank Partner Country
United States Dollars
2012 2013 2014
1 Malaysia 1,025 1,121 1,179
2 United States 676 746 783
3 Australia 628 614 684
4 France 451 506 601
5 New Zealand 398 492 534
6 China 466 509 503
7 Brazil 340 378 407
8 Indonesia 296 299 394
9 Thailand 286 315 319
10 Netherlands 196 216 235
11 Vietnam 101 166 216
12 Germany 109 125 136
13 Japan 120 117 120
14 India 97 120 119
15 Italy 93 101 119
Others 884 981 989
Total 6,162 6,805 7,338
(Source: Global Trade Atlas (GTA)

GAIN REPORT: SN6002 – Exporter Guide Annual 2015 Page 18
Edible Fishery Products Imports (In US$ Million)
Rank Partner Country
United States Dollars
2012 2013 2014
1 China 94 109 151
2 Indonesia 131 130 136
3 Malaysia 129 135 129
4 Vietnam 88 99 110
5 Norway 56 71 73
6 Thailand 73 67 63
7 Japan 53 55 51
8 Australia 46 49 40
9 India 39 37 37
10 Chile 27 25 29
11 New Zealand 22 22 21
12 Hong Kong 21 18 20
13 United States 22 19 19
14 France 12 13 17
15 United Kingdom 4 16 16
Others 187 145 137
Total 1,006 1,009 1,049
(Source: Global Trade Atlas (GTA)
END OF REPORT.

GAIN REPORT: SN6002 – Exporter Guide Annual 2015 Page 19