simplified highway capacity calculation method for the ... · capacity is as follows: “the...
TRANSCRIPT
Simplified Highway Capacity Calculation Method for the Highway Performance Monitoring System
October 2017

Notice
This document is disseminated under the sponsorship of the U.S. Department of Transportation in the interest of information exchange. The U.S. Government assumes no liability for the use of the information contained in this document.
The U.S. Government does not endorse products or manufacturers. Trademarks or manufacturers’ names appear in this report only because they are considered essential to the objective of the document.
Quality Assurance Statement
The Federal Highway Administration (FHWA) provides high-quality information to serve Government, industry, and the public in a manner that promotes public understanding. Standards and policies are used to ensure and maximize the quality, objectivity, utility, and integrity of its information. FHWA periodically reviews quality issues and adjusts its programs and processes to ensure continuous quality improvement.

i
Technical Report Documentation Page
1. Report No.
PL-18-003
2. Government Accession No.
3. Recipient’s Catalog No.
4. Title and Subtitle
Simplified Highway Capacity Calculation Method for the Highway Performance Monitoring System
5. Report Date
October 15, 2017
6. Performing Organization Code
7. Author(s)
Richard Margiotta and Scott Washburn
8. Performing Organization Report No.
9. Performing Organization Name And Address
Cambridge Systematics, Inc. 4800 Hampden Lane, Suite 800 Bethesda, MD 20814
10. Work Unit No. (TRAIS)
11. Contract or Grant No.
DTFH61-13-D-00014
12. Sponsoring Agency Name and Address
Federal Highway Administration Office of Policy and Governmental Affairs 1200 New Jersey Avenue, SE Washington, DC 20590
13. Type of Report and Period Covered
Final Report
14. Sponsoring Agency Code
15. Supplementary Notes
16. Abstract The Federal Highway Administration’s Highway Performance Monitoring System (HPMS) provides information on the extent, condition, performance, use, and operating characteristics of the Nation’s highways. Each year State Transportation Agencies must submit HPMS data to the FHWA. The Sample Panel portion of HPMS provides detailed statistical data on a randomly selected sample of roadway sections on the State’s public road system. One data item submitted for sample panels is capacity (Sample Panel Data Item 69). The HPMS Field Manual guidance for capacity is as follows: “The capacity of a roadway facility is the maximum reasonable hourly rate at which vehicles can be expected to transverse a point or a uniform section of lane or roadway during a given time period under prevailing road-way, traffic, and control conditions.” Reasonable expectancy is that the stated capacity can be achieved repeatedly. The Highway Capacity Manual (HCM) provides procedures, formulas, graphics, and tables in assessing roadway capacity. This item should be estimated based on procedures consistent with the HCM. The results of the project are the development of: 1. Capacity computation methods that use HPMS data items to the extent possible, and can be used to validate HPMS Sample Panel Item 69; and 2. Simplified Methodologies to Create Generalized Level of Service (LOS) Lookup Tables. Both of these results use the most recent HCM methodologies. Specifically, it was found that the procedures in National Cooperative Research Program Report 825 (“Planning and Preliminary Engineering Applications Guide to the Highway Capacity Manual”) could be easily adapted to the types of data present in HPMS. 17. Key Words
Highway Capacity Manual; level of service; generalized service volumes; HPMS data
18. Distribution Statement
No restrictions
19. Security Classif. (of this report)
Unclassified
20. Security Classif. (of this page)
Unclassified
21. No. of Pages
46
22. Price
N/A


Simplified Highway Capacity Calculation Method for the Highway Performance Monitoring System
iii
TABLE OF CONTENTS
CHAPTER 1. INTRODUCTION .................................................................................................1
CHAPTER 2. DEVELOPMENT OF CAPACITY COMPUTATION METHODS ................3
REVIEW HIGHWAY ECONOMIC REQUIREMENTS SYSTEM CAPACITY PROCEDURES FOR USE IN HIGHWAY PERFORMANCE MONITORING SYSTEM ................................................................................................................................3
Freeways ........................................................................................................................4
Multilane Highways .......................................................................................................5
Signalized Highways .....................................................................................................5
Two-Lane Highways with No Traffic Control ..............................................................6
Stop-Controlled Highways.............................................................................................6
UPDATE CAPACITY PROCEDURES BASED ON NEW HIGHWAY CAPACITY MANUAL EDITION .............................................................................................................7
CHAPTER 3. BACKGROUND DEVELOP SIMPLIFIED METHODOLOGIES TO CREATE GENERALIZED LEVEL OF SERVICE (LOS) LOOKUP TABLES ...........9
BACKGROUND ....................................................................................................................9
DEFAULT VALUES ...........................................................................................................10
RESULTS .............................................................................................................................10
APPENDIX A. GENERALIZED SERVICE VOLUME TABLES .........................................23


Simplified Highway Capacity Calculation Method for the Highway Performance Monitoring System
v
LIST OF FIGURES Figure 1. Flow chart. Overview of major task activities. .................................................................2 Figure 2. Equation. Capacity calculation for freeway capacity. ......................................................4 Figure 3. Equation. Calculation or free flow speed for freeways. ...................................................5 Figure 4. Equation. Calculation of capacity for multilane highways. .............................................5 Figure 5. Equation. Calculation of capacity for signalized highways. ............................................6 Figure 6. Equation. Calculation of capacity for stop-controlled highways. ....................................7

Simplified Highway Capacity Calculation Method for the Highway Performance Monitoring System
vii
LIST OF TABLES Table 1. Highway performance monitoring system data items used in the highway economic requirements system capacity calculation procedures. ....................................................3 Table 2. Conflicting flow rates for two-way stop-controlled highways—vehicles per hour.........10 Table 3. Default values for level of service calculation. ................................................................11 Table 4. Level of service for 2014 highway performance monitoring system sample panel— rural sections ....................................................................................................................12 Table 5. Level of service for 2014 highway performance monitoring system sample panel—urban sections ....................................................................................................................13 Table 6. Selected highway performance monitoring system freeway sections with level of service and service measures attached. ..........................................................................................14 Table 7. Selected highway performance monitoring system multilane sections with level of service and service measures attached. ..........................................................................................15 Table 8. Selected highway performance monitoring system rural two-lane sections with level of service and service measures attached. .............................................................................16 Table 9. Selected highway performance monitoring system signalized sections with level of service and service measures attached. ......................................................................................18 Table 10. Selected highway performance monitoring system stop-controlled sections with level of service and service measures attached. .............................................................................19 Table 11. Level of service ranges by highway type. ......................................................................21 Table 12. Level of service ranges for signalized highways. ..........................................................21 Table 13. Freeway generalized service volume table. ...................................................................23 Table 14. Multilane highway generalized service volume table. ...................................................25 Table 15. Signalized highway generalized service volume table. .................................................26 Table 16. Stop sign-controlled highways generalized service volume table. ................................33 Table 17. Rural two-lane highways generalized service volume table. .........................................33


Simplified Highway Capacity Calculation Method for the Highway Performance Monitoring System
1
CHAPTER 1. INTRODUCTION The Federal Highway Administration’s (FHWA) Highway Performance Monitoring System (HPMS) provides information on the extent, condition, performance, use, and operating characteristics of the Nation’s highways. Each year State Transportation Agencies (STA) must submit HPMS data to the FHWA. Certain data items, including length, lane-miles, and travel are required for all public roads that are eligible for Federal-aid highway funds. The data items reported for all public roads are known as full extent data items. In addition to full extent data items, there are data items that are reported on a partial extent basis, which are known as sample panel data items. The sample panel provides more detailed statistical data on a randomly selected sample of roadway sections in the State’s public road system. One data item submitted for sample panels is capacity (Sample Panel Data Item 69). The HPMS Field Manual guidance for capacity is as follows: “The capacity of a roadway facility is the maximum reasonable hourly rate at which vehicles can be expected to transverse a point or a uniform section of lane or roadway during a given time period under prevailing roadway, traffic, and control conditions. Reasonable expectancy is that the stated capacity can be achieved repeatedly. The Highway Capacity Manual (HCM) provides procedures, formulas, graphics, and tables in assessing roadway capacity. This item should be estimated based on procedures consistent with the HCM. All urban and rural capacity for freeways and other multilane facilities is for the peak direction. If a rural facility has two or three lanes with one-way operation, it is considered to be a multilane facility for determining capacity. The capacity for rural facilities with two or three lanes and two-way operation is for both directions.” The objectives of the project are to develop: 1. Capacity computation methods that: 1) use HPMS data items to the extent possible, and 2) can
be used to validate HPMS Sample Panel Item 69. 2. Simplified methodologies to create generalized level of service (LOS) lookup tables. 3. These two objectives were covered by tasks 2 and 3 and are presented as separate sections
below (figure 1).

Simplified Highway Capacity Calculation Method for the Highway Performance Monitoring System
2
Task 2: HPMS Capacity Calculation Procedures
Task 4: Final Report
Review HERS Capacity Procedure for Use in HPMS
Update Capacity Procedures Based on New HCM Edition
Test: State Submitted Capacities versus Calculated
Task 3: Simplified Methods for Generalized LOS
Integrate Capacity Calculation with HCM LOS Procedures by Facility Type
Build Tool
Apply Tool Iteratively to Generate LOS Tables
Figure 1. Flow chart. Overview of major task activities.

Simplified Highway Capacity Calculation Method for the Highway Performance Monitoring System
3
CHAPTER 2. DEVELOPMENT OF CAPACITY COMPUTATION METHODS REVIEW HIGHWAY ECONOMIC REQUIREMENTS SYSTEM CAPACITY PROCEDURES FOR USE IN HIGHWAY PERFORMANCE MONITORING SYSTEM The Highway Economic Requirements System (HERS) capacity procedures, completed in 2014, adapted the Highway Capacity Manual (HCM) 2010 capacity calculation methods.1 It utilized Highway Performance Monitoring System (HPMS) data items to the maximum extent but also had to make many assumptions about default values. The HPMS data items that were used are shown in table 1. HCM capacity input data that had to set to default values are as follows: • Freeways—ramp density, peak-hour factor, and driver population factor. • Multilane highways—driveway density, peak-hour factor, and driver population factor. • Signals—lane group assignments (based on presence of right- and left-turning lanes), grade,
number of parking maneuvers per hour, bus blockage, area type, lane utilization, left- and right-turn lanes.
• Rural two-lane highways—driveway density and peak-hour factor. • Stop signs—conflicting flow rates, base critical gap, follow-up times, and assignment of
turning movements to lanes. The project team compared the HERS procedures with National Cooperative Highway Research Program (NCHRP) Project 07-22, Planning and Preliminary Engineering Applications Guide to the HCM. The report has recently been published as NCHRP Report 825.2 Its midlevel analysis methods for capacity are very similar to the HERS procedures which preceded it. Where the two methods differ, we developed a test procedure using 2014 HPMS data to compare the capacity values obtained with each method. The results of the comparison are as follows.
Table 1. Highway performance monitoring system data items used in the highway economic requirements system capacity calculation procedures.
HPMS Data Item
Facility Type
Freeways Multilane Signals Rural Two
Lane Stop Sign Lane Width –
Right Shoulder Width
– –
Left Shoulder Width
– – – –
Through Lanes – – Peak Lanes – – – –
% SU Trucks
1 Task 6 Technical Memo: Procedures for Estimating Highway Capacity, May 2014. 2 Dowling, Richard et al., Planning and Preliminary Engineering Applications Guide to the Highway Capacity
Manual, NCHRP Report 825, 2016, http://www.trb.org/NCHRP/Blurbs/174958.aspx.

Simplified Highway Capacity Calculation Method for the Highway Performance Monitoring System
4
Table 1. Highway performance monitoring system data items used in the highway economic requirements system capacity calculation procedures (continuation).
HPMS Data Item
Facility Type
Freeways Multilane Signals Rural Two
Lane Stop Sign % Comb. Trucks
Median Type – – – – – No. Other
Intersections – – –
Right-Turn Lanes – – – Left-Turn Lanes – – –
K-factor – – D-factor – –
Percent Green Lime – – – – Terrain – –
Functional Class – – – – Speed Limita – – – –
a Speed limit is generally used in the computation of service measures but except for rural two-lane highways is not used in capacity calculation.
Freeways The HERS capacity procedure is very similar to that of NCHRP 825. The HERS procedure follows the HCM procedure verbatim, with adjustments for lane width, lateral clearance, interchange density, heavy trucks, and the peak-hour factor. The NCHRP method excludes the peak-hour factor. However, their formulations for the final capacity value are slightly different. When applied to 2014 Sample Panel data (21,940 freeway sections), HERS-developed capacity values are five percent lower than those of NCHRP 825. We consider this difference negligible, so we recommend the NCHRP 825 method for capacity and (Level of Service) LOS calculations.
Where: FFS = free flow speed %HV = percent of heavy vehicles (decimal), with heavy vehicles consisting of
trucks with more than four tires, buses, and recreational vehicles Multilane Highways
Figure 2. Equation. Capacity calculation for freeway capacity.

Simplified Highway Capacity Calculation Method for the Highway Performance Monitoring System
5
Where: fLW = adjustment for lane width (HPMS data item 34) fRLC = adjustment for right side lateral clearance (HPMS data item 38) Lanes = HPMS data item 10
Figure 3. Equation. Calculation or free flow speed for freeways. The HERS method follows the HCM faithfully. NCHRP 825 recommends using the HCM method, so the two methods are the same. Therefore, the HCM method (which also is the HERS method) is recommended for capacity and LOS calculations. Multilane Highways The HERS method follows the HCM faithfully. NCHRP 825 recommends using the HCM method, so the two methods are the same. Therefore, the HCM method (which is also the HERS method) is recommended for capacity and LOS calculations.
Where:
fHV = adjustment for heavy vehicles
PT = HPMS data item 23 + HPMS data item 25 ET = 1.5 if HPMS data item 2 indicates a forma urban area; otherwise: = 1.5 if HPMS data item 44 = 1 = 2.5 if HPMS data item 44 = 2 = 4.5 if HPMS data item 44 = 3 FFS = HPMS data item 14 + 5 Lanes = HPMS data item 10
Figure 4. Equation. Calculation of capacity for multilane highways. Signalized Highways Different philosophies are taken between the HERS method and NCHRP 825 method. In the HERS method, the capacity of the entire approach is calculated. This done because in HERS’ speed estimation, turning movement volumes are not available in HPMS and the volume on the entire segment is used. In the NCHRP 825 method, only the through movement is used. (It offers a solution if only total volume is available: if exclusive left-turn and right lanes exist, deduct 10 percent for each.) To be comparable, we used the HERS method to analyze just the through

Simplified Highway Capacity Calculation Method for the Highway Performance Monitoring System
6
movement. In the HERS method, saturation flow rate is adjusted downward for lane width, heavy vehicles, parking, and the peak-hour factor. In the NCHRP 825 method, saturation flow rate is unadjusted. As a result, when applied to the Sample Panel data (26,504 signalized sections), the HERS method produces capacities that are 14 percent lower than NCHRP 825. The main problem with the HERS method is that the turning lane and their volume assignments are based on many assumptions. Because of its simplicity in dealing with turning movements, we recommend the NCHRP 825 method for capacity and LOS calculations.
Where: g/C = HPMS data item 30 Lanes = HPMS data item 10
Figure 5. Equation. Calculation of capacity for signalized highways. Two-Lane Highways with No Traffic Control Completely different approaches are taken by the two methods. The HERS method assumes that no traffic control is present while the NCHRP 825 method includes delay at intersections if they are present. The HERS procedure calculates two-way capacity while the NCHRP method uses one-way capacity and assigns a fixed value, either 1,450 or 1,490 vehicles per hour, but capacity is not used in the calculation of LOS—it is only used to create a v/c ratio for screening. Because of this difference, no tests were made. The HERS method is quite complex, accounting for grades, heavy vehicles, peak-hour factor, and percent no passing zones. The NCHRP 825 approach is simpler for capacity, but the calculation of speed and associated LOS basically follows the same method as for the capacity calculation in HERS. This is because capacity is “backcalculated” in the HERS method so that the HERS speed equations, which are based on the AADT-to-capacity ratio, can be used. In the NCHRP 825 method, capacity is largely irrelevant for two-lane highway LOS as it is based on average travel speed or percent of time following. Because it is more closely tied to HCM methods for the calculation of average travel speed (the basis for LOS), we recommend the NCHRP 825 method for capacity (one-way) and LOS calculations. That is, the one-way capacity is set at 1,490 vehicles per hour. Stop-Controlled Highways Very different capacity calculations are used in the HCM 2010 depending on whether an intersection has two-way stop control or all-way stop control. Unfortunately, it is impossible to distinguish the two conditions with HPMS data. Both HERS and NCHRP 825 procedures are complex and highly dependent on turning movements on all the approaches. The HERS procedure is based on the HCM 2000 procedure for two-way stop-controlled intersections. It is data intensive and makes many assumptions about turning movements based on the presence of turning lanes. In contrast, the NCHRP 825 procedure uses the highly simplified adaptation of the HCM procedure for all-way stop control and a more complex procedure for two-way stop control which is based on the update to the HCM 2010. For this reason, we did not run any comparisons between the two methods. Because, the two-way stop control procedures in NCHRP 825 is

Simplified Highway Capacity Calculation Method for the Highway Performance Monitoring System
7
based on the recently updated version of the HCM 2010, we recommend that the NCHRP 825 procedure be used for capacity and LOS calculations. In doing so, it is assumed that all stop control is two-way.
Capacity = 1,200 vehicles/hour; where HPMS data item 10 = 1
= 1,500 vehicles/hour otherwise
Figure 6. Equation. Calculation of capacity for stop-controlled highways.
UPDATE CAPACITY PROCEDURES BASED ON NEW HIGHWAY CAPACITY MANUAL EDITION The Major Update to the HCM 2010 has been released. We reviewed the new procedures against the HERS capacity procedures and found no changes in the way capacity is calculated except for two-way stop-controlled intersections. The NCHRP 825 method is consistent with the new HCM as the researchers had access to the draft chapters. Therefore, the recommendations made above are not changed.


Simplified Highway Capacity Calculation Method for the Highway Performance Monitoring System
9
CHAPTER 3. BACKGROUND DEVELOP SIMPLIFIED METHODOLOGIES TO CREATE GENERALIZED LEVEL OF SERVICE (LOS) LOOKUP TABLES
BACKGROUND This report documents the work performed on Task 3: Develop Simplified Methodologies to Create Generalized Level of Service (LOS) Lookup Tables. At the kickoff meeting it was decided that a stand-alone tool would be built that can interface directly with Highway Performance Monitoring System (HPMS) data. Based on the task 2 assessment, the National Cooperative Highway Research Program (NCHRP) Report 825 version of the Highway Capacity Manual (HCM) procedures for calculating LOS has been programmed into this tool.3 The advantage is that all relevant HPMS data elements could be used. Also, updating would be much easier—all that is required is to change the procedure rather than regenerate the massive lookup table that otherwise would have been created. In addition to the LOS designation for an HPMS section, the actual value of the service measure on which LOS is based will also be reported. It also was decided that generalized service volume tables for each facility would be produced, accounting for all of the nondefault factors that are covered by the NCHRP 825 methodology. The types of facilities that are included in the analysis are as follows. These follow the facility types covered by the HCM: • Freeways. • Multilane highways. • Rural two-lane highways. • Signalized highways. • Stop-controlled highways. HPMS sections can be grouped into these categories based on their data elements. A hierarchy is used to make these assignments: • If functional system is one or two, and full access control exists, then the section is a
freeway. • If stop signs exist, then the section is stop controlled. • If signals exist, then the section is signalized. • If through lanes are greater than or equal to four, the section is multilane. • If through lanes are equal to two or three and the urban code indicates rural, the section is
rural two lane. However, a significant number of HPMS Sample Panel sections (about 30,000) cannot be classified using the above scheme. These tend to be two-, three-lane urban highways with no traffic control device on the actual section. Level of Service was not calculated for these
3 Dowling, Richard et al., Planning and Preliminary Engineering Applications Guide to the Highway Capacity
Manual, NCHRP Report 825, 2016, http://www.trb.org/NCHRP/Blurbs/174958.aspx.
Simplified Highway Capacity Calculation Method for the Highway Performance Monitoring System
10
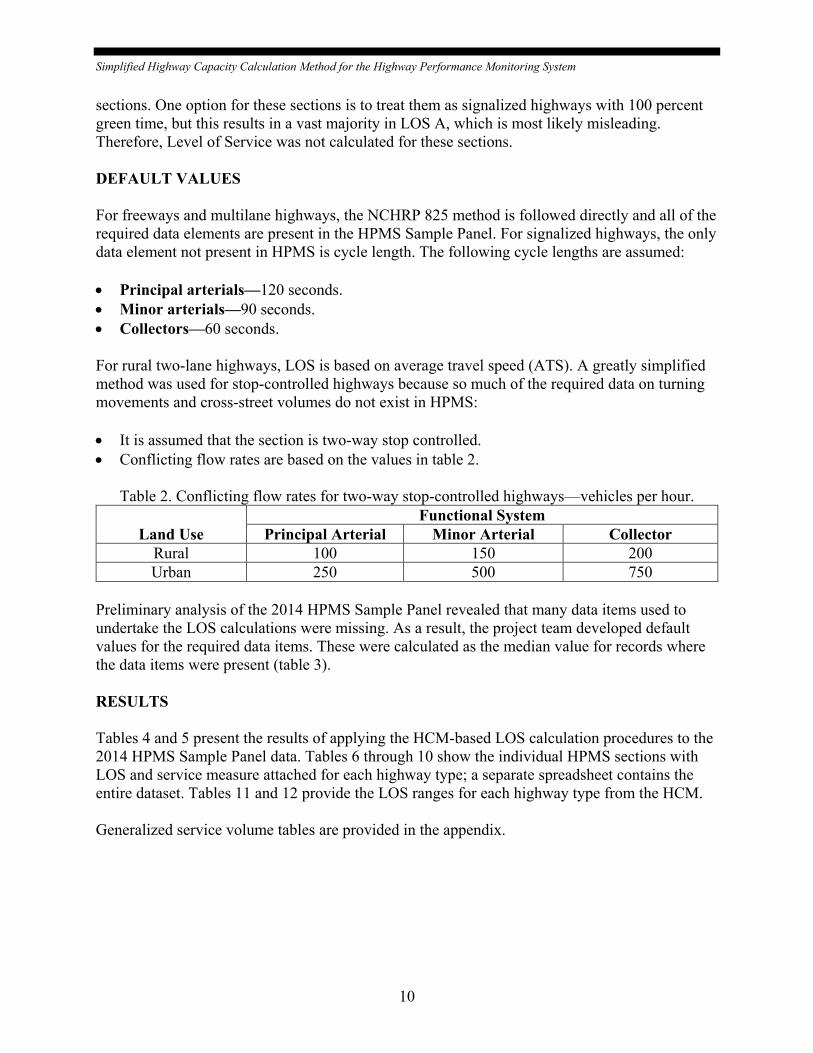
sections. One option for these sections is to treat them as signalized highways with 100 percent green time, but this results in a vast majority in LOS A, which is most likely misleading. Therefore, Level of Service was not calculated for these sections. DEFAULT VALUES For freeways and multilane highways, the NCHRP 825 method is followed directly and all of the required data elements are present in the HPMS Sample Panel. For signalized highways, the only data element not present in HPMS is cycle length. The following cycle lengths are assumed: • Principal arterials—120 seconds. • Minor arterials—90 seconds. • Collectors—60 seconds. For rural two-lane highways, LOS is based on average travel speed (ATS). A greatly simplified method was used for stop-controlled highways because so much of the required data on turning movements and cross-street volumes do not exist in HPMS: • It is assumed that the section is two-way stop controlled. • Conflicting flow rates are based on the values in table 2.
Table 2. Conflicting flow rates for two-way stop-controlled highways—vehicles per hour.
Land Use Functional System
Principal Arterial Minor Arterial Collector Rural 100 150 200 Urban 250 500 750
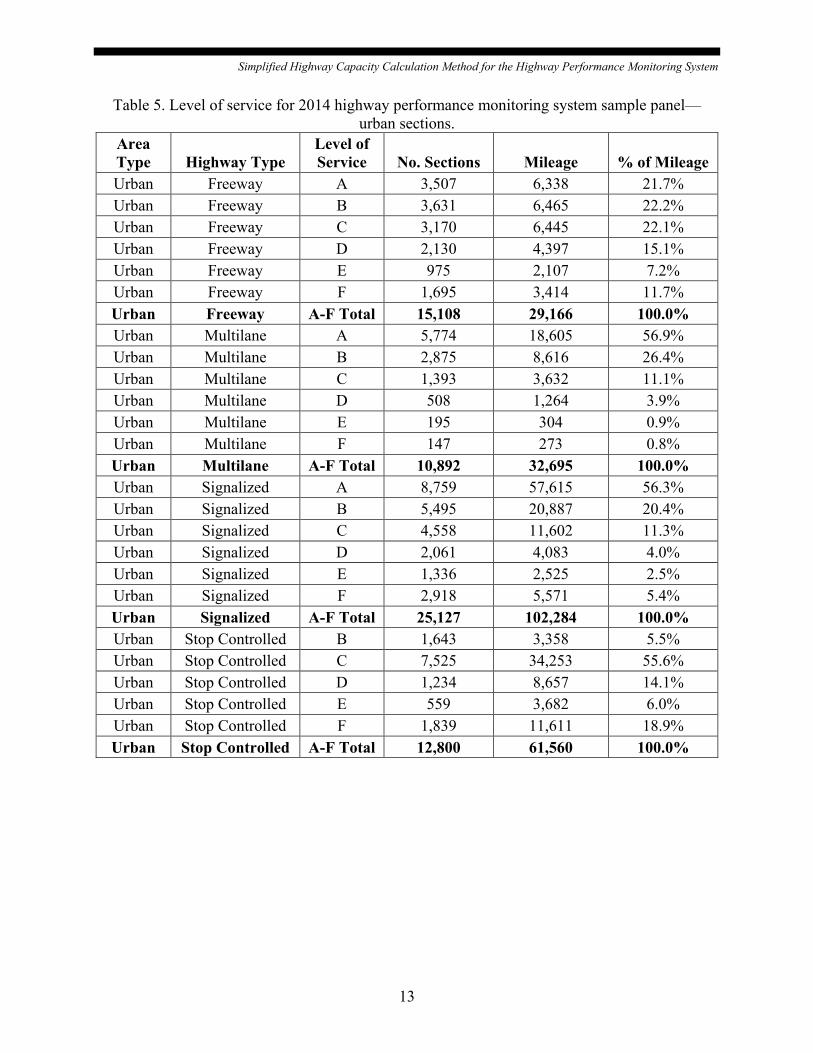
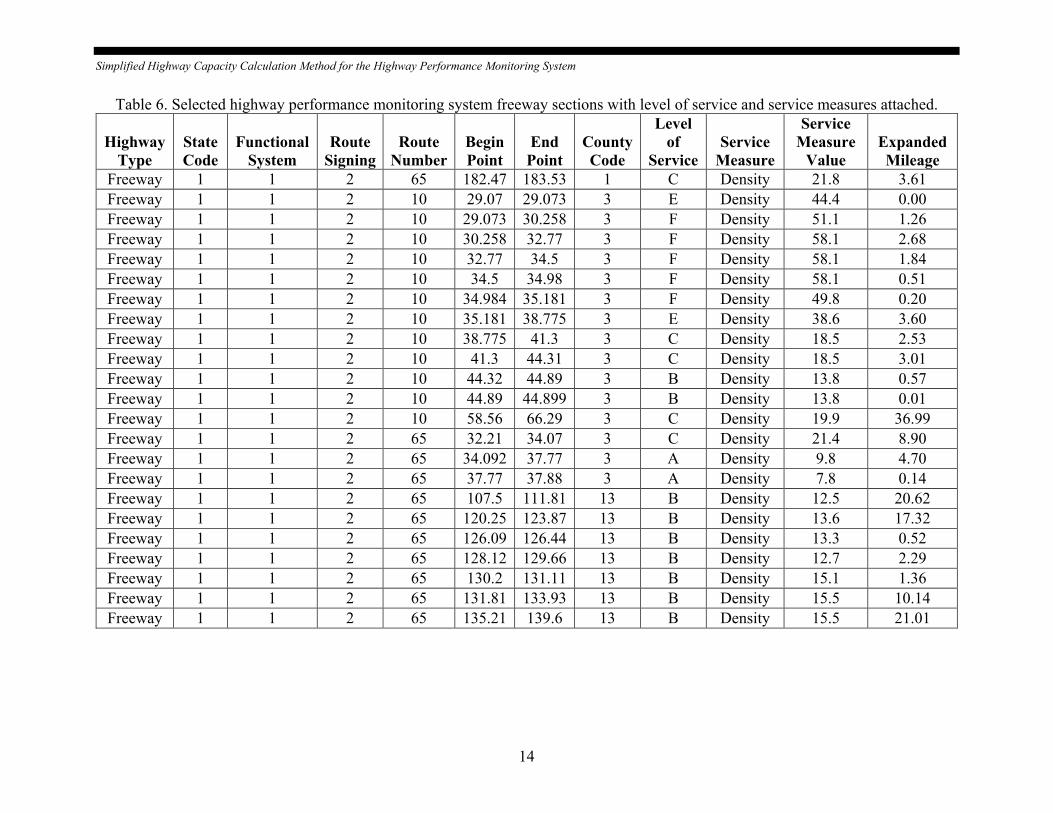
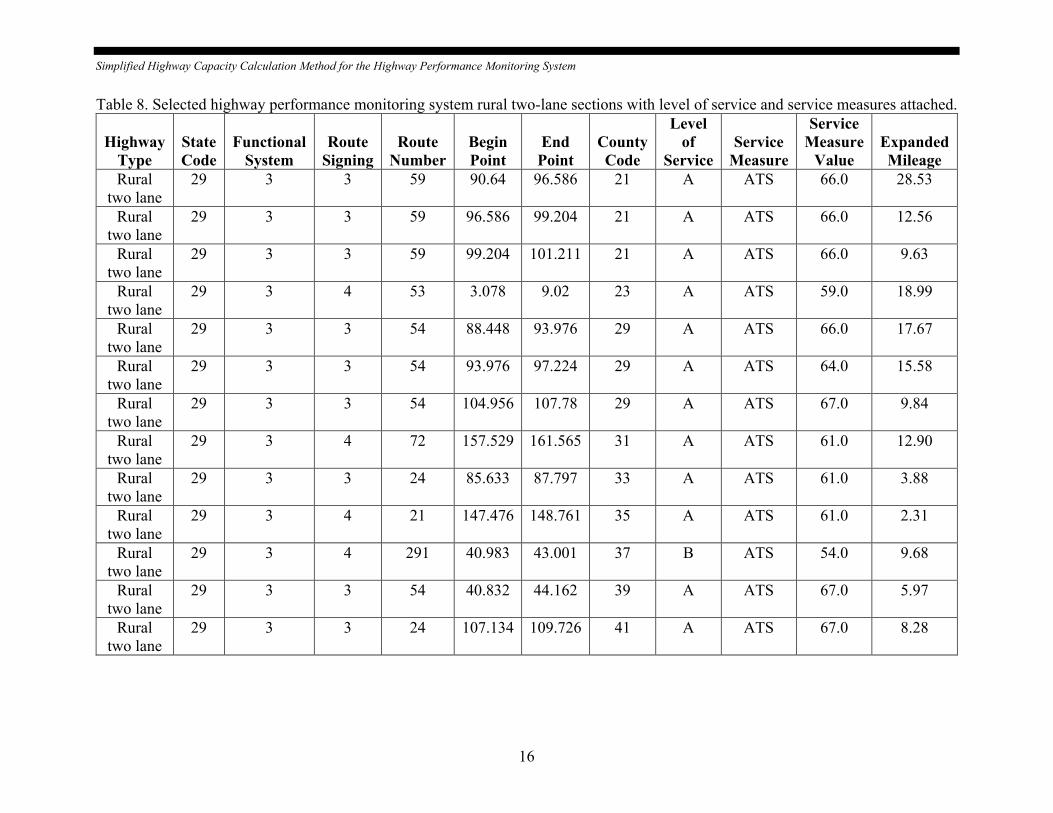
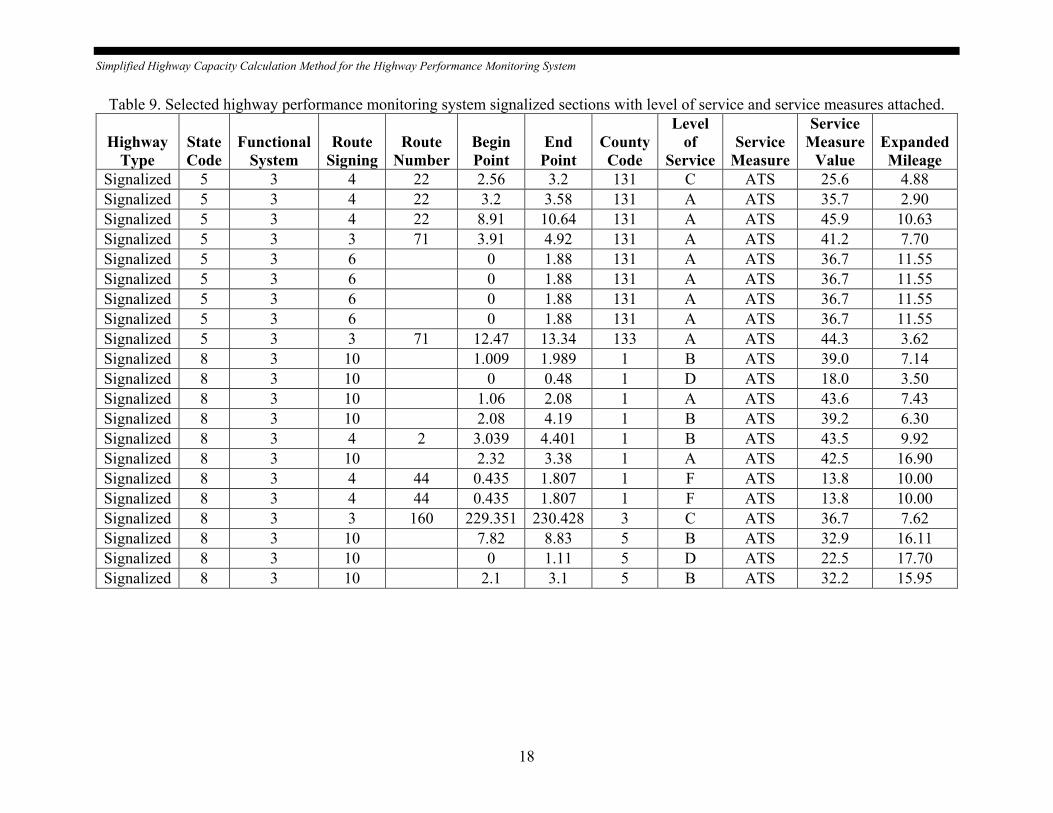
Preliminary analysis of the 2014 HPMS Sample Panel revealed that many data items used to undertake the LOS calculations were missing. As a result, the project team developed default values for the required data items. These were calculated as the median value for records where the data items were present (table 3). RESULTS Tables 4 and 5 present the results of applying the HCM-based LOS calculation procedures to the 2014 HPMS Sample Panel data. Tables 6 through 10 show the individual HPMS sections with LOS and service measure attached for each highway type; a separate spreadsheet contains the entire dataset. Tables 11 and 12 provide the LOS ranges for each highway type from the HCM. Generalized service volume tables are provided in the appendix.

Simplified Highway Capacity Calculation Method for the Highway Performance Monitoring System
11
Table 3. Default values for level of service calculation.
HPMS Data Item Freeways Multilane
Rural Two
Lane Urban Rural Urban Rural Signalized LANE_WIDTH 12 12 12 12 11 12
SHOULDER_WIDTH_R 10 10 10 10
5 AADT_SINGLE_UNIT =AADT*0.034 =AADT*0.043 =AADT*0.038 =AADT*0.043
=AADT*0.051
AADT_COMBINATION =AADT*0.060 =AADT*0.193 =AADT*0.035 =AADT*0.082
=AADT*0.048 K_FACTOR 10 9 10 10 10 11 D_FACTOR 55 55 59 57 57 57
MEDIAN_TYPE
3 2
SPEED_LIMIT
55 65 40 55 PCT_GREEN_TIME
50
SIGNAL_TYPE
2
TERRAIN_TYPE 1 2 1 2
2
Simplified Highway Capacity Calculation Method for the Highway Performance Monitoring System
12
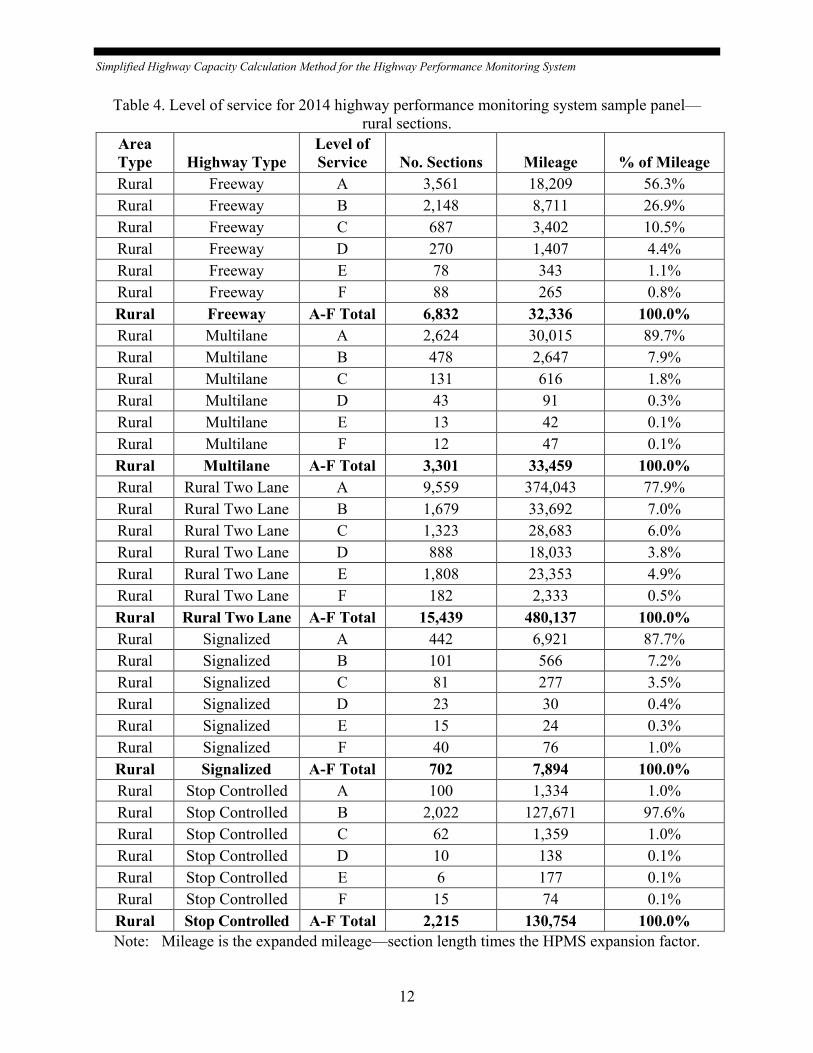
Table 4. Level of service for 2014 highway performance monitoring system sample panel— rural sections.
Area Type Highway Type
Level of Service No. Sections Mileage % of Mileage
Rural Freeway A 3,561 18,209 56.3% Rural Freeway B 2,148 8,711 26.9% Rural Freeway C 687 3,402 10.5% Rural Freeway D 270 1,407 4.4% Rural Freeway E 78 343 1.1% Rural Freeway F 88 265 0.8% Rural Freeway A-F Total 6,832 32,336 100.0% Rural Multilane A 2,624 30,015 89.7% Rural Multilane B 478 2,647 7.9% Rural Multilane C 131 616 1.8% Rural Multilane D 43 91 0.3% Rural Multilane E 13 42 0.1% Rural Multilane F 12 47 0.1% Rural Multilane A-F Total 3,301 33,459 100.0% Rural Rural Two Lane A 9,559 374,043 77.9% Rural Rural Two Lane B 1,679 33,692 7.0% Rural Rural Two Lane C 1,323 28,683 6.0% Rural Rural Two Lane D 888 18,033 3.8% Rural Rural Two Lane E 1,808 23,353 4.9% Rural Rural Two Lane F 182 2,333 0.5% Rural Rural Two Lane A-F Total 15,439 480,137 100.0% Rural Signalized A 442 6,921 87.7% Rural Signalized B 101 566 7.2% Rural Signalized C 81 277 3.5% Rural Signalized D 23 30 0.4% Rural Signalized E 15 24 0.3% Rural Signalized F 40 76 1.0% Rural Signalized A-F Total 702 7,894 100.0% Rural Stop Controlled A 100 1,334 1.0% Rural Stop Controlled B 2,022 127,671 97.6% Rural Stop Controlled C 62 1,359 1.0% Rural Stop Controlled D 10 138 0.1% Rural Stop Controlled E 6 177 0.1% Rural Stop Controlled F 15 74 0.1% Rural Stop Controlled A-F Total 2,215 130,754 100.0% Note: Mileage is the expanded mileage—section length times the HPMS expansion factor.
Simplified Highway Capacity Calculation Method for the Highway Performance Monitoring System
13
Table 5. Level of service for 2014 highway performance monitoring system sample panel—urban sections.
Area Type Highway Type
Level of Service No. Sections Mileage % of Mileage
Urban Freeway A 3,507 6,338 21.7% Urban Freeway B 3,631 6,465 22.2% Urban Freeway C 3,170 6,445 22.1% Urban Freeway D 2,130 4,397 15.1% Urban Freeway E 975 2,107 7.2% Urban Freeway F 1,695 3,414 11.7% Urban Freeway A-F Total 15,108 29,166 100.0% Urban Multilane A 5,774 18,605 56.9% Urban Multilane B 2,875 8,616 26.4% Urban Multilane C 1,393 3,632 11.1% Urban Multilane D 508 1,264 3.9% Urban Multilane E 195 304 0.9% Urban Multilane F 147 273 0.8% Urban Multilane A-F Total 10,892 32,695 100.0% Urban Signalized A 8,759 57,615 56.3% Urban Signalized B 5,495 20,887 20.4% Urban Signalized C 4,558 11,602 11.3% Urban Signalized D 2,061 4,083 4.0% Urban Signalized E 1,336 2,525 2.5% Urban Signalized F 2,918 5,571 5.4% Urban Signalized A-F Total 25,127 102,284 100.0% Urban Stop Controlled B 1,643 3,358 5.5% Urban Stop Controlled C 7,525 34,253 55.6% Urban Stop Controlled D 1,234 8,657 14.1% Urban Stop Controlled E 559 3,682 6.0% Urban Stop Controlled F 1,839 11,611 18.9% Urban Stop Controlled A-F Total 12,800 61,560 100.0%
Simplified Highway Capacity Calculation Method for the Highway Performance Monitoring System
14
Table 6. Selected highway performance monitoring system freeway sections with level of service and service measures attached.
Highway Type
State Code
Functional System
Route Signing
Route Number
Begin Point
End Point
County Code
Level of
Service Service
Measure
Service Measure
Value Expanded Mileage
Freeway 1 1 2 65 182.47 183.53 1 C Density 21.8 3.61 Freeway 1 1 2 10 29.07 29.073 3 E Density 44.4 0.00 Freeway 1 1 2 10 29.073 30.258 3 F Density 51.1 1.26 Freeway 1 1 2 10 30.258 32.77 3 F Density 58.1 2.68 Freeway 1 1 2 10 32.77 34.5 3 F Density 58.1 1.84 Freeway 1 1 2 10 34.5 34.98 3 F Density 58.1 0.51 Freeway 1 1 2 10 34.984 35.181 3 F Density 49.8 0.20 Freeway 1 1 2 10 35.181 38.775 3 E Density 38.6 3.60 Freeway 1 1 2 10 38.775 41.3 3 C Density 18.5 2.53 Freeway 1 1 2 10 41.3 44.31 3 C Density 18.5 3.01 Freeway 1 1 2 10 44.32 44.89 3 B Density 13.8 0.57 Freeway 1 1 2 10 44.89 44.899 3 B Density 13.8 0.01 Freeway 1 1 2 10 58.56 66.29 3 C Density 19.9 36.99 Freeway 1 1 2 65 32.21 34.07 3 C Density 21.4 8.90 Freeway 1 1 2 65 34.092 37.77 3 A Density 9.8 4.70 Freeway 1 1 2 65 37.77 37.88 3 A Density 7.8 0.14 Freeway 1 1 2 65 107.5 111.81 13 B Density 12.5 20.62 Freeway 1 1 2 65 120.25 123.87 13 B Density 13.6 17.32 Freeway 1 1 2 65 126.09 126.44 13 B Density 13.3 0.52 Freeway 1 1 2 65 128.12 129.66 13 B Density 12.7 2.29 Freeway 1 1 2 65 130.2 131.11 13 B Density 15.1 1.36 Freeway 1 1 2 65 131.81 133.93 13 B Density 15.5 10.14 Freeway 1 1 2 65 135.21 139.6 13 B Density 15.5 21.01

Simplified Highway Capacity Calculation Method for the Highway Performance Monitoring System
15
Table 7. Selected highway performance monitoring system multilane sections with level of service and service measures attached.
Highway Type
State Code
Functional System
Route Signing
Route Number
Begin Point
End Point
County Code
Level of
Service Service
Measure
Service Measure
Value Expanded Mileage
Multilane 6 2 20 14.869 15.231 13 B Density 17.1 4.34 Multilane 6 2 20 14.869 15.231 13 B Density 17.1 0.94 Multilane 6 2 20 144.831 144.962 13 B Density 17.1 0.18 Multilane 6 2 20 144.831 144.962 13 B Density 17.1 1.57 Multilane 6 2 20 144.831 144.962 13 B Density 17.1 0.34 Multilane 6 2 20 14.958 15.14 13 B Density 17.1 0.25 Multilane 6 2 20 14.958 15.14 13 B Density 17.1 2.18 Multilane 6 2 20 14.958 15.14 13 B Density 17.1 0.47 Multilane 6 2 50 16.374 16.49 17 C Density 24.0 0.31 Multilane 6 2 50 16.374 16.49 17 C Density 24.0 0.13 Multilane 6 2 50 45.959 46.059 17 D Density 32.7 0.25 Multilane 6 2 50 49.066 49.31 17 C Density 24.0 0.65 Multilane 6 2 50 49.066 49.31 17 C Density 24.0 0.28 Multilane 6 2 101 706.865 707.463 23 C Density 21.9 1.51 Multilane 6 2 111 1.04 1.048 25 B Density 17.7 0.01 Multilane 6 2 111 1.048 2.076 25 C Density 19.5 1.03 Multilane 6 2 111 2.076 2.56 25 C Density 19.0 0.51 Multilane 6 2 111 2.076 2.56 25 C Density 19.0 0.48 Multilane 6 2 111 11.7 11.708 25 C Density 19.0 0.01 Multilane 6 2 111 11.7 11.708 25 C Density 19.0 0.01 Multilane 6 2 33 89.04 89.491 29 A Density 5.5 1.75
Simplified Highway Capacity Calculation Method for the Highway Performance Monitoring System
16
Table 8. Selected highway performance monitoring system rural two-lane sections with level of service and service measures attached.
Highway Type
State Code
Functional System
Route Signing
Route Number
Begin Point
End Point
County Code
Level of
Service Service
Measure
Service Measure
Value Expanded Mileage
Rural two lane
29 3 3 59 90.64 96.586 21 A ATS 66.0 28.53
Rural two lane
29 3 3 59 96.586 99.204 21 A ATS 66.0 12.56
Rural two lane
29 3 3 59 99.204 101.211 21 A ATS 66.0 9.63
Rural two lane
29 3 4 53 3.078 9.02 23 A ATS 59.0 18.99
Rural two lane
29 3 3 54 88.448 93.976 29 A ATS 66.0 17.67
Rural two lane
29 3 3 54 93.976 97.224 29 A ATS 64.0 15.58
Rural two lane
29 3 3 54 104.956 107.78 29 A ATS 67.0 9.84
Rural two lane
29 3 4 72 157.529 161.565 31 A ATS 61.0 12.90
Rural two lane
29 3 3 24 85.633 87.797 33 A ATS 61.0 3.88
Rural two lane
29 3 4 21 147.476 148.761 35 A ATS 61.0 2.31
Rural two lane
29 3 4 291 40.983 43.001 37 B ATS 54.0 9.68
Rural two lane
29 3 3 54 40.832 44.162 39 A ATS 67.0 5.97
Rural two lane
29 3 3 24 107.134 109.726 41 A ATS 67.0 8.28

Simplified Highway Capacity Calculation Method for the Highway Performance Monitoring System
17
Table 8. Selected highway performance monitoring system rural two-lane sections with level of service and service measures attached (continuation).
Highway Type
State Code
Functional System
Route Signing
Route Number
Begin Point
End Point
County Code
Level of
Service Service
Measure
Service Measure
Value Expanded Mileage
Rural two lane
29 3 3 60 65.175 66.136 43 A ATS 63.0 3.35
Rural two lane
29 3 3 61 0 2.413 45 A ATS 62.0 7.71
Rural two lane
29 3 4 92 22.623 26.498 47 B ATS 55.0 12.38
Rural two lane
29 3 4 8 4.782 14.947 55 A ATS 61.0 18.24
Rural two lane
29 3 4 8 19.762 22.989 55 A ATS 59.0 10.31
Rural two lane
29 3 4 8 23.454 33.377 55 A ATS 61.0 31.71
Rural two lane
29 3 3 65 213.933 215.239 59 A ATS 66.0 4.17
Rural two lane
29 3 4 6 47.655 51.941 61 A ATS 66.0 13.70
Simplified Highway Capacity Calculation Method for the Highway Performance Monitoring System
18
Table 9. Selected highway performance monitoring system signalized sections with level of service and service measures attached.
Highway Type
State Code
Functional System
Route Signing
Route Number
Begin Point
End Point
County Code
Level of
Service Service
Measure
Service Measure
Value Expanded Mileage
Signalized 5 3 4 22 2.56 3.2 131 C ATS 25.6 4.88 Signalized 5 3 4 22 3.2 3.58 131 A ATS 35.7 2.90 Signalized 5 3 4 22 8.91 10.64 131 A ATS 45.9 10.63 Signalized 5 3 3 71 3.91 4.92 131 A ATS 41.2 7.70 Signalized 5 3 6
0 1.88 131 A ATS 36.7 11.55
Signalized 5 3 6
0 1.88 131 A ATS 36.7 11.55 Signalized 5 3 6
0 1.88 131 A ATS 36.7 11.55
Signalized 5 3 6
0 1.88 131 A ATS 36.7 11.55 Signalized 5 3 3 71 12.47 13.34 133 A ATS 44.3 3.62 Signalized 8 3 10
1.009 1.989 1 B ATS 39.0 7.14
Signalized 8 3 10
0 0.48 1 D ATS 18.0 3.50 Signalized 8 3 10
1.06 2.08 1 A ATS 43.6 7.43
Signalized 8 3 10
2.08 4.19 1 B ATS 39.2 6.30 Signalized 8 3 4 2 3.039 4.401 1 B ATS 43.5 9.92 Signalized 8 3 10
2.32 3.38 1 A ATS 42.5 16.90
Signalized 8 3 4 44 0.435 1.807 1 F ATS 13.8 10.00 Signalized 8 3 4 44 0.435 1.807 1 F ATS 13.8 10.00 Signalized 8 3 3 160 229.351 230.428 3 C ATS 36.7 7.62 Signalized 8 3 10
7.82 8.83 5 B ATS 32.9 16.11
Signalized 8 3 10
0 1.11 5 D ATS 22.5 17.70 Signalized 8 3 10
2.1 3.1 5 B ATS 32.2 15.95

Simplified Highway Capacity Calculation Method for the Highway Performance Monitoring System
19
Table 10. Selected highway performance monitoring system stop-controlled sections with level of service and service measures attached.
Highway Type
State Code
Functional System
Route Signing
Route Number
Begin Point
End Point
County Code
Level of
Service Service
Measure
Service Measure
Value Expanded Mileage
Stop Control
1 5 1 1046 0.12 0.83 33 C Delay 16.0 1.22
Stop Control
1 5 1 1386 0.294 1.12 33 C Delay 16.0 1.41
Stop Control
1 5 6 30 5.335 7.2 35 B Delay 10.2 75.01
Stop Control
1 5 6 85 1.368 6.63 37 B Delay 10.3 211.63
Stop Control
1 5 6 101 0 1.55 39 C Delay 16.0 9.61
Stop Control
1 5 6 687 0.07 0.71 39 C Delay 15.9 3.97
Stop Control
1 5 6 19 0 1.52 39 C Delay 16.1 9.42
Stop Control
1 5 6 36 7.41 8.17 43 C Delay 17.3 15.85
Stop Control
1 5 6 11 1.84 6.67 45 B Delay 10.3 194.25
Stop Control
1 5 6 50 1.534 3.38 45 C Delay 17.9 38.50
Stop Control
1 5 6 375 0.104 0.69 45 C Delay 16.3 0.96
Stop Control
1 5 6 377 0 0.31 45 C Delay 15.7 0.51
Stop Control
1 5 6 23 4.5 7.24 51 C Delay 17.2 10.80
Stop Control
1 5 6 1 10.858 17 53 B Delay 10.3 247.02

Simplified Highway Capacity Calculation Method for the Highway Performance Monitoring System
20
Table 10. Selected highway performance monitoring system stop-controlled sections with level of service and service measures attached (continuation).
Highway Type
State Code
Functional System
Route Signing
Route Number
Begin Point
End Point
County Code
Level of
Service Service
Measure
Service Measure
Value Expanded Mileage
Stop Control
1 5 6 49 1.132 1.46 53 D Delay 25.8 20.19
Stop Control
1 5 6 5039 0.9 1.5 53 C Delay 20.1 12.51
Stop Control
1 5 6 15 0 1.43 55 C Delay 20.2 9.01
Stop Control
1 5 6 185 0 1.86 55 C Delay 18.2 11.72
Stop Control
1 5 6 185 1.869 2.65 55 C Delay 18.6 4.92
Stop Control
1 5 1 419 4.238 4.97 55 C Delay 18.7 4.61
Stop Control
1 5 1 810 0 0.88 55 C Delay 16.3 1.20

Simplified Highway Capacity Calculation Method for the Highway Performance Monitoring System
21
Table 11. Level of service ranges by highway type.
Service Measure
Freeway Multilane Rural Two Lane Stop
Controlled
Density Density Average Travel
Speed (ATS) Delay Level of Service A <= 11 <= 11 > 55 <= 10 Level of Service B > 11-18 > 11-18 > 50-55 > 10-15 Level of Service C > 18-26 > 18-26 > 45-50 > 15-25 Level of Service D > 26-35 > 26-35 > 40-45 > 25-35 Level of Service E > 35-45 > 35-45 <= 40 > 35-50 Level of Service F > 45 or where
demand > capacity
> 45 or where demand > capacity
Demand > capacity > 50
Notes: Density is measured as passenger cars per mile, per lane. ATS is measured as miles per hour. Delay is measured in seconds per vehicle.
Table 12. Level of service ranges for signalized highways.
Base-Free Flow Speed
Average Travel Speed Level of
Service A Level of
Service B Level of
Service C Level of
Service D Level of
Service E Level of
Service F >= 55 > 44 > 37 > 28 > 22 > 17 <= 17
50 > 40 > 34 > 25 > 20 > 15 <= 15 45 > 36 > 30 > 23 > 18 > 14 <= 14 40 > 32 > 27 > 20 > 16 > 12 <= 12 35 > 28 > 23 > 18 > 14 > 11 <= 11 30 > 24 > 20 > 15 > 12 > 9 <= 9
<= 25 >20 > 17 > 13 > 10 > 8 <= 8

Simplified Highway Capacity Calculation Method for the Highway Performance Monitoring System
23
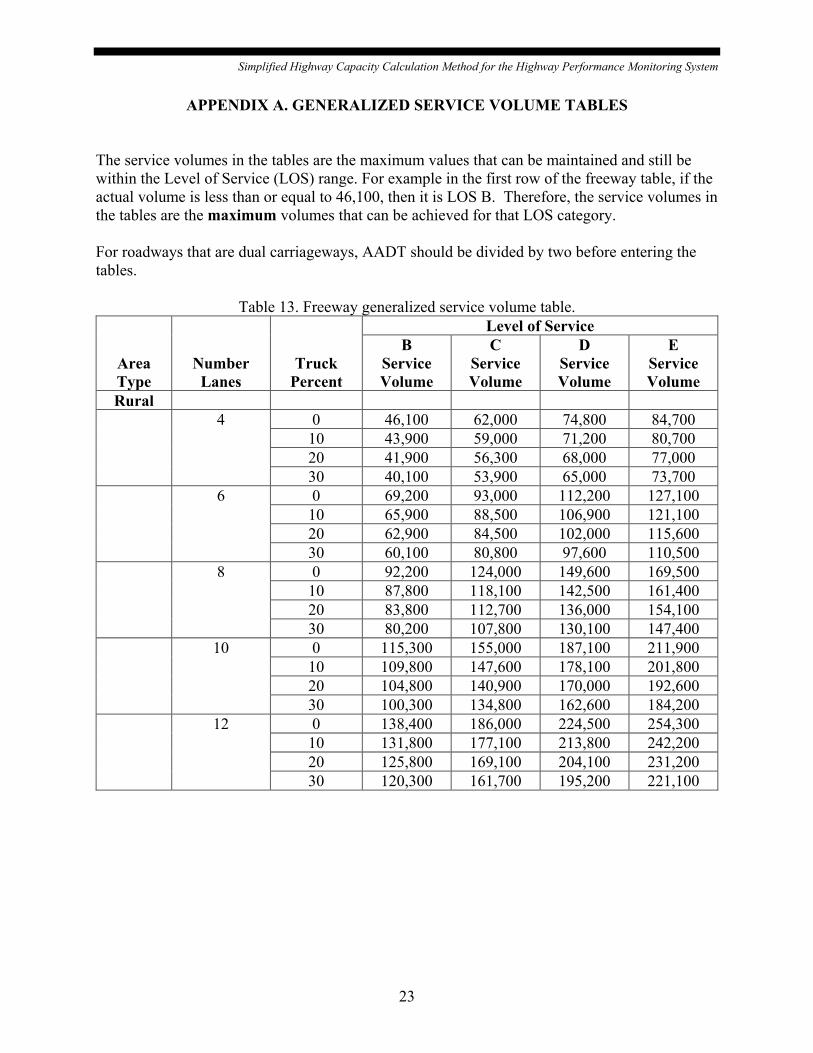
APPENDIX A. GENERALIZED SERVICE VOLUME TABLES The service volumes in the tables are the maximum values that can be maintained and still be within the Level of Service (LOS) range. For example in the first row of the freeway table, if the actual volume is less than or equal to 46,100, then it is LOS B. Therefore, the service volumes in the tables are the maximum volumes that can be achieved for that LOS category. For roadways that are dual carriageways, AADT should be divided by two before entering the tables.
Table 13. Freeway generalized service volume table.
Area Type
Number Lanes
Truck Percent
Level of Service B
Service Volume
C Service Volume
D Service Volume
E Service Volume
Rural 4 0 46,100 62,000 74,800 84,700
10 43,900 59,000 71,200 80,700 20 41,900 56,300 68,000 77,000 30 40,100 53,900 65,000 73,700
6 0 69,200 93,000 112,200 127,100 10 65,900 88,500 106,900 121,100 20 62,900 84,500 102,000 115,600 30 60,100 80,800 97,600 110,500
8 0 92,200 124,000 149,600 169,500 10 87,800 118,100 142,500 161,400 20 83,800 112,700 136,000 154,100 30 80,200 107,800 130,100 147,400
10 0 115,300 155,000 187,100 211,900 10 109,800 147,600 178,100 201,800 20 104,800 140,900 170,000 192,600 30 100,300 134,800 162,600 184,200
12 0 138,400 186,000 224,500 254,300 10 131,800 177,100 213,800 242,200 20 125,800 169,100 204,100 231,200 30 120,300 161,700 195,200 221,100

Simplified Highway Capacity Calculation Method for the Highway Performance Monitoring System
Table 13. Freeway generalized service volume table (continuation).
Area Type
Number Lanes
Truck Percent
Level of Service B
Service Volume
C Service Volume
D Service Volume
E Service Volume
Urban 4 0 43,700 60,100 73,100 83,000
10 41,600 57,200 69,600 79,100 20 39,700 54,600 66,400 75,500 30 38,000 52,200 63,600 72,200
6 0 65,600 90,100 109,700 124,600 10 62,500 85,800 104,400 118,600 20 59,600 81,900 99,700 113,200 30 57,000 78,300 95,400 108,300
8 0 87,500 120,200 146,200 166,100 10 83,300 114,400 139,300 158,200 20 79,500 109,200 132,900 151,000 30 76,100 104,500 127,200 144,400
10 0 109,400 150,200 182,800 207,600 10 104,200 143,100 174,100 197,700 20 99,400 136,600 166,200 188,700 30 95,100 130,600 159,000 180,500
12 0 131,300 180,300 219,400 249,200 10 125,000 171,700 208,900 237,300 20 119,300 163,900 199,400 226,500 30 114,100 156,700 190,800 216,700

Simplified Highway Capacity Calculation Method for the Highway Performance Monitoring System
25
Table 14. Multilane highway generalized service volume table.
Area Type
Number Lanes
Truck Percent
Level of Service B
Service Volume
C Service Volume
D Service Volume
E Service Volume
Rural 4 0 42,000 57,300 69,600 80,000
10 39,900 54,600 66,300 76,100 20 38,100 52,100 63,300 72,700 30 36,500 49,900 60,600 69,500
6 0 63,000 86,000 104,500 120,000 10 59,900 81,900 99,500 114,200 20 57,200 78,200 95,000 109,000 30 54,700 74,800 90,900 104,300
8 0 84,000 114,700 139,300 160,000 10 79,900 109,300 132,700 152,300 20 76,300 104,300 126,700 145,400 30 73,000 99,800 121,200 139,100
10 0 105,000 143,400 174,200 200,000 10 99,900 136,600 165,900 190,400 20 95,400 130,400 158,300 181,800 30 91,300 124,700 151,500 173,900
Urban 4 0 34,500 49,300 61,400 71,600
10 32,800 47,000 58,400 68,200 20 31,300 44,800 55,800 65,100 30 30,000 42,900 53,300 62,300
6 0 51,700 74,000 92,100 107,500 10 49,200 70,500 87,700 102,300 20 47,000 67,300 83,700 97,700 30 45,000 64,400 80,000 93,400
8 0 69,000 98,700 122,800 143,300 10 65,700 94,000 116,900 136,500 20 62,700 89,700 111,600 130,300 30 60,000 85,800 106,700 124,600
10 0 86,200 123,400 153,500 179,100 10 82,100 117,500 146,200 170,600 20 78,400 112,200 139,500 162,800 30 75,000 107,300 133,400 155,700

Simplified Highway Capacity Calculation Method for the Highway Performance Monitoring System
Table 15. Signalized highway generalized service volume table.
Number Lanes
% Green Time
Speed Limit
Level of Service B
Service Volume
C Service Volume
D Service Volume
E Service Volume
2 40 35 12,800 14,900 16,400 18,700 40 12,600 14,400 15,900 17,700 45 12,000 14,200 15,500 17,400 50 11,800 13,800 15,200 16,700 55 12,300 14,100 15,400 16,900 60 12,700 14,300 15,500 17,100
45 35 14,600 16,900 18,500 21,100 40 14,400 16,300 18,000 20,000 45 13,900 16,100 17,600 19,700 50 13,600 15,700 17,200 18,900 55 14,200 16,000 17,400 19,100 60 14,600 16,200 17,600 19,300
50 35 16,500 18,900 20,700 23,600 40 16,300 18,300 20,100 22,300 45 15,700 18,100 19,600 22,000 50 15,500 17,700 19,200 21,100 55 16,100 17,900 19,500 21,400 60 16,400 18,100 19,600 21,500
55 35 18,400 20,900 22,900 26,000 40 18,100 20,300 22,200 24,700 45 17,600 20,000 21,700 24,300 50 17,400 19,600 21,300 23,400 55 17,900 19,900 21,500 23,600 60 18,300 20,100 21,700 23,800
60 35 20,300 22,900 25,100 28,500 40 20,000 22,200 24,400 27,000 45 19,500 22,000 23,800 26,600 50 19,300 21,500 23,300 25,600 55 19,800 21,800 23,600 25,800 60 20,200 22,100 23,800 26,100

Simplified Highway Capacity Calculation Method for the Highway Performance Monitoring System
27
Table 15. Signalized highway generalized service volume table (continuation).
Number Lanes
% Green Time
Speed Limit
Level of Service B
Service Volume
C Service Volume
D Service Volume
E Service Volume
2 65 35 22,200 25,000 27,300 31,000 40 21,900 24,200 26,500 29,400 45 21,400 24,000 25,900 28,900 50 21,200 23,500 25,400 27,800 55 21,700 23,800 25,700 28,100 60 22,100 24,000 25,900 28,300
70 35 24,100 27,000 29,500 33,500 40 23,800 26,200 28,700 31,700 45 23,300 26,000 28,000 31,200 50 23,100 25,400 27,500 30,100 55 23,600 25,800 27,800 30,400 60 24,000 26,000 28,000 30,600
75 35 26,000 29,100 31,700 36,000 40 25,700 28,200 30,800 34,100 45 25,200 28,000 30,100 33,600 50 25,000 27,400 29,600 32,300 55 25,500 27,700 29,900 32,700 60 25,900 28,000 30,100 32,900
80 35 27,900 31,100 33,900 38,500 40 27,600 30,300 33,000 36,500 45 27,100 30,000 32,300 35,900 50 26,900 29,400 31,700 34,600 55 27,400 29,700 32,000 35,000 60 27,800 30,000 32,300 35,200
4 40 35 27,400 30,600 33,300 37,800 40 27,100 29,700 32,400 35,900 45 26,500 29,400 31,700 35,300 50 26,200 28,800 31,100 34,000 55 26,800 29,200 31,400 34,300 60 27,300 29,500 31,700 34,600

Simplified Highway Capacity Calculation Method for the Highway Performance Monitoring System
Table 15. Signalized highway generalized service volume table (continuation).
Number Lanes
% Green Time
Speed Limit
Level of Service B
Service Volume
C Service Volume
D Service Volume
E Service Volume
4 45 35 31,100 34,500 37,600 42,700 40 30,700 33,600 36,600 40,500 45 30,100 33,300 35,800 39,900 50 29,800 32,600 35,100 38,400 55 30,500 33,000 35,500 38,800 60 30,900 33,400 35,800 39,100
50 35 34,700 38,500 41,900 47,600 40 34,400 37,500 40,800 45,100 45 33,700 37,100 39,900 44,400 50 33,500 36,400 39,200 42,800 55 34,100 36,900 39,600 43,200 60 34,600 37,200 39,900 43,600
55 35 38,400 42,600 46,300 52,500 40 38,100 41,400 45,100 49,800 45 37,400 41,000 44,100 49,000 50 37,100 40,200 43,200 47,200 55 37,800 40,700 43,700 47,700 60 38,300 41,100 44,100 48,100
60 35 42,100 46,600 50,700 57,400 40 41,800 45,400 49,300 54,400 45 41,100 44,900 48,200 53,600 50 40,800 44,100 47,300 51,700 55 41,500 44,600 47,800 52,200 60 42,000 45,000 48,300 52,600
65 35 45,900 50,700 55,100 62,300 40 45,500 49,300 53,600 59,200 45 44,800 48,900 52,400 58,300 50 44,500 48,000 51,500 56,200 55 45,200 48,500 52,000 56,700 60 45,700 49,000 52,400 57,100

Simplified Highway Capacity Calculation Method for the Highway Performance Monitoring System
29
Table 15. Signalized highway generalized service volume table (continuation).
Number Lanes
% Green Time
Speed Limit
Level of Service B
Service Volume
C Service Volume
D Service Volume
E Service Volume
4 70 35 49,600 54,700 59,500 67,300 40 49,200 53,300 57,900 63,900 45 48,500 52,800 56,600 62,900 50 48,200 51,900 55,600 60,700 55 48,900 52,400 56,200 61,200 60 49,500 52,900 56,700 61,700
75 35 53,400 58,800 63,900 72,300 40 53,000 57,300 62,200 68,600 45 52,200 56,800 60,900 67,600 50 51,900 55,800 59,800 65,200 55 52,700 56,400 60,400 65,800 60 53,200 56,900 60,900 66,300
80 35 57,200 63,000 68,400 77,300 40 56,800 61,300 66,600 73,400 45 56,000 60,800 65,100 72,300 50 55,700 59,700 64,000 69,700 55 56,400 60,400 64,600 70,400 60 57,000 60,900 65,200 70,900
6 40 35 41,700 46,100 50,200 56,900 40 41,300 44,900 48,800 53,900 45 40,600 44,400 47,700 53,100 50 40,300 43,600 46,800 51,200 55 41,000 44,100 47,300 51,700 60 41,500 44,600 47,800 52,100
45 35 47,100 52,000 56,600 64,100 40 46,700 50,700 55,100 60,800 45 46,000 50,200 53,900 59,900 50 45,700 49,300 52,900 57,700 55 46,400 49,800 53,400 58,300 60 47,000 50,300 53,900 58,800

Simplified Highway Capacity Calculation Method for the Highway Performance Monitoring System
Table 15. Signalized highway generalized service volume table (continuation).
Number Lanes
% Green Time
Speed Limit
Level of Service B
Service Volume
C Service Volume
D Service Volume
E Service Volume
6 50 35 52,600 58,000 63,100 71,500 40 52,200 56,500 61,400 67,800 45 51,400 56,000 60,100 66,800 50 51,100 55,000 59,000 64,400 55 51,800 55,600 59,600 65,000 60 52,400 56,100 60,100 65,500
55 35 58,100 64,100 69,600 78,800 40 57,700 62,400 67,800 74,800 45 56,800 61,800 66,300 73,700 50 56,500 60,700 65,100 71,000 55 57,300 61,400 65,700 71,700 60 57,900 62,000 66,300 72,200
60 35 63,700 70,100 76,200 86,200 40 63,200 68,300 74,100 81,800 45 62,300 67,700 72,500 80,600 50 62,000 66,500 71,200 77,700 55 62,800 67,200 71,900 78,400 60 63,500 67,800 72,600 79,000
65 35 69,300 76,200 82,700 93,600 40 68,800 74,200 80,600 88,900 45 67,800 73,600 78,800 87,500 50 67,400 72,200 77,400 84,400 55 68,300 73,100 78,200 85,200 60 69,000 73,700 78,900 85,900
70 35 74,900 82,300 89,400 101,100 40 74,300 80,200 87,000 95,900 45 73,300 79,500 85,100 94,500 50 72,900 78,100 83,600 91,100 55 73,900 78,900 84,500 92,000 60 74,700 79,700 85,200 92,700

Simplified Highway Capacity Calculation Method for the Highway Performance Monitoring System
31
Table 15. Signalized highway generalized service volume table (continuation).
Number Lanes
% Green Time
Speed Limit
Level of Service B
Service Volume
C Service Volume
D Service Volume
E Service Volume
6 75 35 80,500 88,500 96,000 108,600 40 80,000 86,200 93,500 103,100 45 78,900 85,500 91,500 101,500 50 78,500 83,900 89,900 97,900 55 79,500 84,900 90,800 98,800 60 80,300 85,700 91,600 99,600
80 35 86,200 94,700 102,700 116,100 40 85,600 92,300 100,000 110,200 45 84,500 91,400 97,900 108,600 50 84,100 89,800 96,100 104,700 55 85,100 90,800 97,100 105,700 60 86,000 91,700 97,900 106,500
8 40 35 55,800 61,600 67,000 75,900 40 55,400 60,000 65,200 72,000 45 54,500 59,400 63,700 70,900 50 54,200 58,300 62,600 68,300 55 55,000 59,000 63,200 69,000 60 55,700 59,600 63,800 69,500
45 35 63,100 69,500 75,600 85,600 40 62,600 67,700 73,500 81,200 45 61,700 67,100 71,900 80,000 50 61,300 65,900 70,600 77,100 55 62,200 66,600 71,300 77,800 60 62,900 67,200 72,000 78,400
50 35 70,400 77,500 84,200 95,300 40 69,900 75,500 82,000 90,500 45 68,900 74,800 80,200 89,100 50 68,500 73,500 78,700 85,900 55 69,400 74,300 79,500 86,700 60 70,200 75,000 80,200 87,400

Simplified Highway Capacity Calculation Method for the Highway Performance Monitoring System
Table 15. Signalized highway generalized service volume table (continuation).
Number Lanes
% Green Time
Speed Limit
Level of Service B
Service Volume
C Service Volume
D Service Volume
E Service Volume
8 55 35 77,700 85,500 92,900 105,100 40 77,200 83,300 90,400 99,800 45 76,100 82,600 88,500 98,300 50 75,700 81,100 86,900 94,700 55 76,700 82,000 87,800 95,600 60 77,500 82,700 88,500 96,400
60 35 85,100 93,600 101,600 115,000 40 84,500 91,200 99,000 109,100 45 83,300 90,400 96,800 107,500 50 82,900 88,800 95,100 103,600 55 84,000 89,700 96,000 104,600 60 84,900 90,600 96,900 105,400
65 35 92,600 101,700 110,400 124,900 40 91,900 99,100 107,500 118,500 45 90,700 98,200 105,200 116,800 50 90,200 96,500 103,300 112,600 55 91,400 97,500 104,400 113,600 60 92,300 98,400 105,200 114,500
70 35 100,100 109,900 119,200 134,800 40 99,300 107,100 116,100 128,000 45 98,000 106,100 113,600 126,100 50 97,600 104,200 111,600 121,600 55 98,800 105,400 112,700 122,700 60 99,800 106,400 113,700 123,700
75 35 107,600 118,100 128,100 144,800 40 106,800 115,100 124,800 137,500 45 105,400 114,100 122,100 135,500 50 104,900 112,100 119,900 130,600 55 106,200 113,300 121,100 131,900 60 107,300 114,300 122,200 132,900
80 35 115,200 126,300 137,000 – 40 114,400 123,100 133,500 297,000 45 112,900 122,100 130,600 144,900 50 112,300 119,900 128,300 139,700 55 113,700 121,200 129,600 141,000 60 114,800 122,300 130,700 142,100

Simplified Highway Capacity Calculation Method for the Highway Performance Monitoring System
33
Table 16. Stop sign-controlled highways generalized service volume table.
Land Use Functional
System
Level of Service B
Service Volume
C Service Volume
D Service Volume
E Service Volume
Rural Princ. Arterial 7,600 11,100 12,400 13,600 Minor
Arterial 6,800 10,200 11,500 12,600
Collector 5,900 9,300 10,600 11,700 Urban Princ. Arterial 5,200 8,500 9,800 10,900
Minor Arterial
1,900 5,200 6,400 7,400
Collector 2,800 4,000 4,800
Table 17. Rural two-lane highways generalized service volume table.
Speed Limit Terrain Truck Pct.
Level of Service B
Service Volume
C Service Volume
D Service Volume
45 Flat 0 3,600 8,700 13,900 2 3,500 8,700 13,900 4 3,500 8,700 13,900 6 3,500 8,700 13,900 8 3,400 8,600 13,900 10 3,400 8,600 13,900
Rolling 0 3,600 8,700 13,900 2 3,500 8,600 13,900 4 3,400 8,500 13,900 6 3,300 8,400 13,900 8 3,300 8,200 13,900 10 3,200 8,100 13,900
Mountainous 0 3,600 8,700 13,900 2 3,200 7,700 12,300 4 2,800 7,000 11,100 6 2,600 6,300 10,100 8 2,400 5,800 9,300 10 2,200 5,400 8,500
50 Flat 0 8,700 13,900 19,000 2 8,700 13,900 19,000 4 8,700 13,900 19,000

Simplified Highway Capacity Calculation Method for the Highway Performance Monitoring System
Table 17. Rural two-lane highways generalized service volume table (continuation).
Speed Limit Terrain Truck Pct.
Level of Service B
Service Volume
C Service Volume
D Service Volume
50 Flat 6 8,700 13,900 19,000 8 8,600 13,900 19,000 10 8,600 13,900 19,000
Rolling 0 8,700 13,900 19,000 2 8,600 13,900 19,000 4 8,500 13,900 19,000 6 8,400 13,900 19,000 8 8,200 13,900 19,000 10 8,100 13,900 19,000
Mountainous 0 8,700 13,900 19,000 2 7,700 12,300 16,900 4 7,000 11,100 15,200 6 6,300 10,100 13,900 8 5,800 9,300 12,700 10 5,400 8,500 11,700
55 Flat 0 13,900 19,000 24,200 2 13,900 19,000 24,200 4 13,900 19,000 24,200 6 13,900 19,000 24,200 8 13,900 19,000 24,200 10 13,900 19,000 24,200
Rolling 0 13,900 19,000 24,200 2 13,900 19,000 24,200 4 13,900 19,000 24,200 6 13,900 19,000 24,200 8 13,900 19,000 24,200 10 13,900 19,000 24,200
Mountainous 0 13,900 19,000 24,200 2 12,300 16,900 21,500 4 11,100 15,200 19,400 6 10,100 13,900 17,600 8 9,300 12,700 16,100 10 8,500 11,700 14,900

Simplified Highway Capacity Calculation Method for the Highway Performance Monitoring System
35
Table 17. Rural two-lane highways generalized service volume table (continuation).
Speed Limit Terrain Truck Pct.
Level of Service B
Service Volume
C Service Volume
D Service Volume
60 Flat 0 19,000 24,200 29,300 2 19,000 24,200 29,300 4 19,000 24,200 29,300 6 19,000 24,200 29,300 8 19,000 24,200 29,300 10 19,000 24,200 29,300
Rolling 0 19,000 24,200 29,300 2 19,000 24,200 29,300 4 19,000 24,200 29,300 6 19,000 24,200 29,300 8 19,000 24,200 29,300 10 19,000 24,200 29,300
Mountainous 0 19,000 24,200 29,300 2 16,900 21,500 26,100 4 15,200 19,400 23,500 6 13,900 17,600 21,400 8 12,700 16,100 19,600 10 11,700 14,900 18,100
65 Flat 0 24,200 29,300 34,500 2 24,200 29,300 34,500 4 24,200 29,300 34,500 6 24,200 29,300 34,500 8 24,200 29,300 34,500 10 24,200 29,300 34,500
Rolling 0 24,200 29,300 34,500 2 24,200 29,300 34,500 4 24,200 29,300 34,500 6 24,200 29,300 34,500 8 24,200 29,300 34,500 10 24,200 29,300 34,500
Mountainous 0 24,200 29,300 34,500 2 21,500 26,100 30,700 4 19,400 23,500 27,600 6 17,600 21,400 25,100 8 16,100 19,600 23,000 10 14,900 18,100 21,300

Federal Highway Administration Office of Policy and Governmental Affairs
1200 New Jersey Avenue, SE Washington, DC 20590
https://www.fhwa.dot.gov/policy/
October 2017 PL-18-003
This material is based upon work supported by the FHWA under contract number DTFH61-13-D-00014.
Any opinions, findings and conclusions or recommendations expressed in this publication are those of the author(s) and do not necessarily reflect the views of the FHWA.