signal timing design example problems. intersection of michigan avenue and hewitt road
Post on 21-Dec-2015
214 views
TRANSCRIPT

Signal Timing Design
Example Problems
N
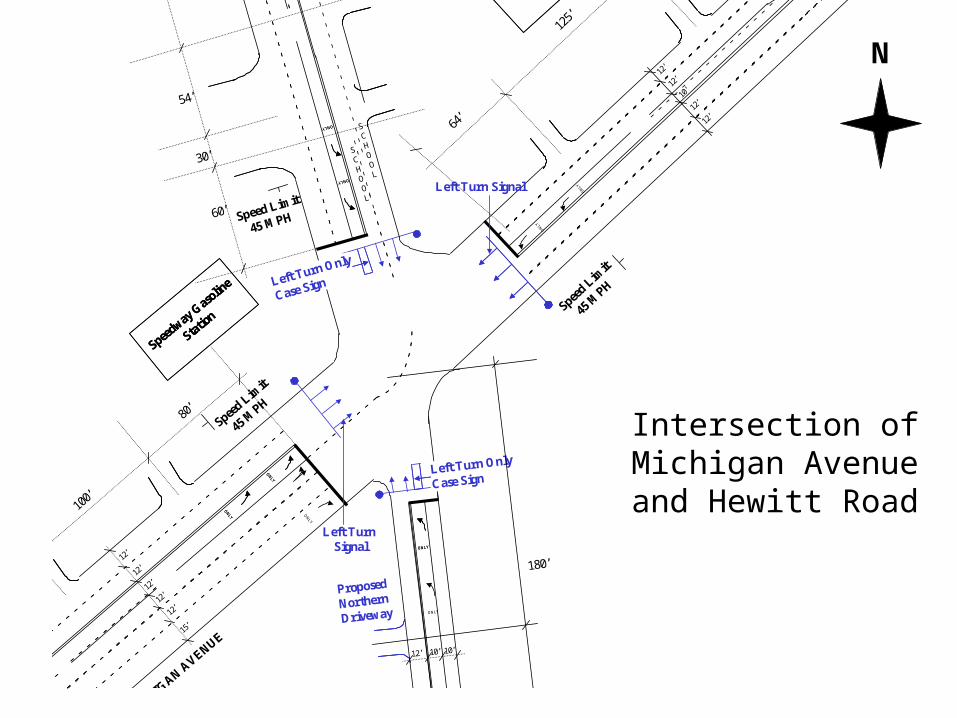
Figure 3. Condition Diagram of the Michigan Avenue and Hewitt Road Intersection
ONLY
ONLY
ONLY
ONLY
Speed L
imit
45 MPH
MIC
HIGAN A
VENUE
383’
12’
12’
12’
12’
12’
15’
80’
100’
ONLY
Proposed Development Site(Vacant Land)
Vacant Land
Standard F
eder
al
Bank
Family Services &Learning Center
To I-94Freeway
Left Turn Signal
Speedway G
asolin
e
Station
Speedway G
asolin
e
Station
12’ 12’ 10’ 12’ 12’
60’
72’
30’
54’
48’
ONLY
ONLY
ONLY
ONLY
SCHOOL
Speed Limit
45 MPH
Left Turn Only
Case SignLeft Turn Only
Case Sign
HE
WIT
T R
OA
D
12’ 10’10’
ONLY
ONLYONLY
Left Turn Only
Case SignLeft Turn Only
Case Sign
180’
310’
220’
Proposed
Northern
Driveway
Proposed
Southern
Driveway
SCHOOL
Speed L
imit
45 M
PH
12’
12’
12’
12’
10’
ONLY
ONLY
64’
125’
Rich G
asoli
ne
Statio
n
Rich G
asoli
ne
Statio
n
Left Turn Signal
Intersection of Michigan Avenue and
Hewitt Road
N

Proposed Tim Horton’s/
Wendy’s Restaurant
(Two Driveways Proposed)
Proposed Tim Horton’s/
Wendy’s Restaurant
(Two Driveways Proposed)
Proposed Tim Horton’s/
Wendy’s Restaurant
(Two Driveways Proposed)
HEWIT
T ROAD
ELLSWORTH ROAD
309+15=324
103120
679+16=695
274+15=289
289
7
56
220
192+14= 206
98
46+31=77
38+44=82 17+9=26
35490
1102
36361+41=102
31321
4+9=13
320+9=329
345
404+9=413
187
Approach Volume = 547 vph(Vehicles per Hour)
Approach Volume= 352 vph
Approach Volume= 187 vph
Approach Volume= 1022 vph
Approach Volume= 524 vph
Approach Volume= 674 vph
Approach Volume= 413 vph
Approach Volume= 1567 vph
Approach Volume= 556 vph
Approach Volume= 185 vph
Approach Volume= 347 vph
Total Intersection Volume= 2,445 vph
Total Intersection Volume= 1,274 vph
Total Intersection Volume= 2,655 vph
Figure 18. Future AM Peak Hour Traffic Volumes at the Three Study Intersections(Includes Existing Traffic Plus 5% Growth Plus Newly Generated Traffic due to the Proposed Development)
2+29=31
155
2
4
38
143
Newly Generated Traffic due to the Proposed Tim Hortons/Wendy’s Restaurant Only
LEGEND
Newly Generated Traffic due to the Proposed Tim Hortons/Wendy’s Restaurant Only
LEGEND
N
Proposed Tim Horton’s/
Wendy’s Restaurant
(Two Driveways Proposed)
Proposed Tim Horton’s/
Wendy’s Restaurant
(Two Driveways Proposed)
Proposed Tim Horton’s/
Wendy’s Restaurant
(Two Driveways Proposed)
HEWIT
T ROAD
ELLSWORTH ROAD
309+15=324
103120
679+16=695
274+15=289
289
7
56
220
192+14= 206
98
46+31=77
38+44=82 17+9=26
35490
1102
36361+41=102
31321
4+9=13
320+9=329
345
404+9=413
187
Approach Volume = 547 vph(Vehicles per Hour)
Approach Volume= 352 vph
Approach Volume= 187 vph
Approach Volume= 1022 vph
Approach Volume= 524 vph
Approach Volume= 674 vph
Approach Volume= 413 vph
Approach Volume= 1567 vph
Approach Volume= 556 vph
Approach Volume= 185 vph
Approach Volume= 347 vph
Total Intersection Volume= 2,445 vph
Total Intersection Volume= 1,274 vph
Total Intersection Volume= 2,655 vph
Figure 18. Future AM Peak Hour Traffic Volumes at the Three Study Intersections(Includes Existing Traffic Plus 5% Growth Plus Newly Generated Traffic due to the Proposed Development)
2+29=31
155
2
4
38
143
Newly Generated Traffic due to the Proposed Tim Hortons/Wendy’s Restaurant Only
LEGEND
Newly Generated Traffic due to the Proposed Tim Hortons/Wendy’s Restaurant Only
LEGEND
N
N

10’
10’
12’
10’ON
LY
ON
LY
SCHOOL
10’5’
ONLY
ONLY
ONLY
ONLY
10’ 10’ 10’ 10’12’
10’5’
110’
15’
ONLY
ONLY
ONLY
ONLY
ON
LY
ON
LY
ON
LY
ON
LY
ON
LY
ON
LY
10’
10’
10’
10’
12’
140’40’ 5’10’5’
5’10’
105’
230’
HE
WIT
T R
OA
D
7-11 Convenience Store
School(8AM – 9AM, 3PM – 4PM)
Speed Limit 30 MPH
Speed Limit 45 MPH
Vacant Land
ELLSWORTH ROAD
Speed Limit 45 MPH
Residential AreaShopping Mall
N
Figure 5. Condition Diagram of the Hewitt Road and Ellsworth Road Intersection
Left Turn Signal (LT)
LT
LT
LT
N
HE
WIT
T R
OA
D

Proposed Tim Horton’s/
Wendy’s Restaurant
(Two Driveways Proposed)
Proposed Tim Horton’s/
Wendy’s Restaurant
(Two Driveways Proposed)
Proposed Tim Horton’s/
Wendy’s Restaurant
(Two Driveways Proposed)
MIC
HIG
AN
AV
ENU
E
HE
WIT
T R
OA
D
ELLSWORTH ROAD
309+15=324
103120
679+16=695
274+15=289
289
7
56
220
192+14= 206
98
46+31=77
38+44=82 17+9=26
35490
1102
36361+41=102
31321
4+9=13
320+9=329
345
404+9=413
187
Approach Volume = 547 vph(Vehicles per Hour)
Approach Volume= 352 vph
Approach Volume= 187 vph
Approach Volume= 1022 vph
Approach Volume= 524 vph
Approach Volume= 674 vph
Approach Volume= 413 vph
Approach Volume= 1567 vph
Approach Volume= 556 vph
Approach Volume= 185 vph
Approach Volume= 347 vph
Total Intersection Volume= 2,445 vph
Total Intersection Volume= 1,274 vph
Total Intersection Volume= 2,655 vph
Figure 18. Future AM Peak Hour Traffic Volumes at the Three Study Intersections(Includes Existing Traffic Plus 5% Growth Plus Newly Generated Traffic due to the Proposed Development)
2+29=31
155
2
4
38
143
Newly Generated Traffic due to the Proposed Tim Hortons/Wendy’s Restaurant Only
LEGEND
Newly Generated Traffic due to the Proposed Tim Hortons/Wendy’s Restaurant Only
LEGEND
N
N

SOLUTIONS
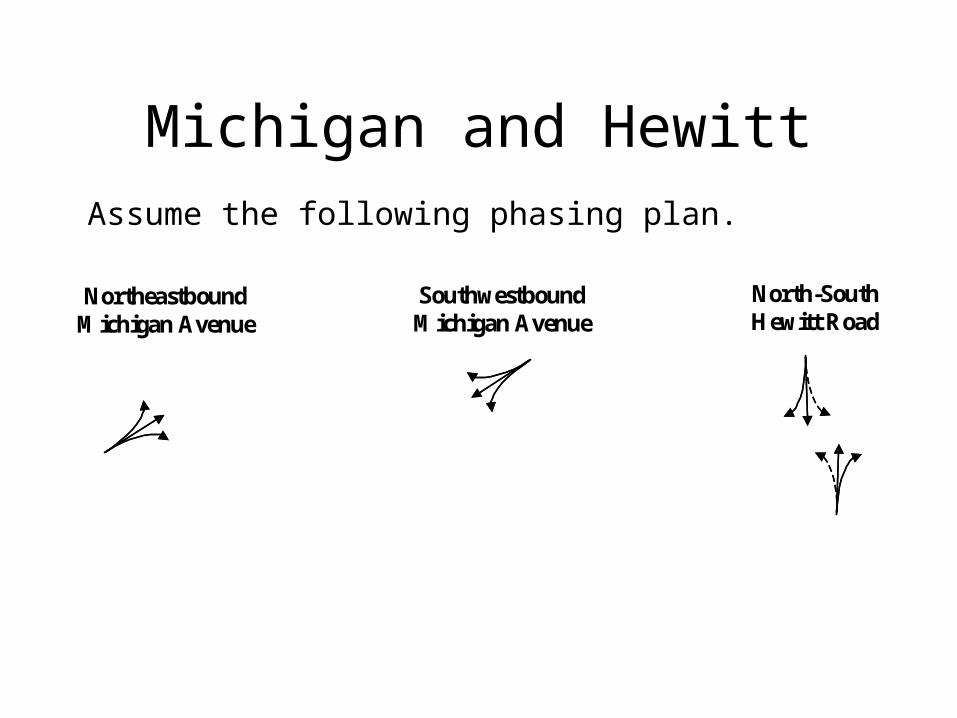
Michigan and Hewitt
NortheastboundMichigan Avenue
SouthwestboundMichigan Avenue
North-SouthHewitt Road
Assume the following phasing plan.

Assume the through and left-turn lane at the NE Bound approach is used as an exclusive left-turn lane during the peak hour.
Assume Saturation flow (S):
SThru = 1800 vphgpl, SLeft = 1200 vphgpl
YNE(split phase) = Max [1102/(1200*2), 363/1800, 102/1800]
= 0.46 0.20 0.06
YNE = 0.46
Michigan and Hewitt
Cycle Length Calculation

YSW(split phase) = Max [13/1200), (313+21)/(1800*2)]
= 0.01 0.09
YSW = 0.09
YNS(thru and permitted left turn phase)
= Max [82/1200, (77+26)/1800, 35/1200, (490+31)/(1800*2)]
= Max [0.07, 0.06, 0.03, 0.14]
YNS = 0.14Left turn-lane critical volumes were considered in YNS (although permitted), since there is not an exclusive left-turn phase for both directions

1.5L + 5
1 - yi
L = sum of lost time per phase
# Phases = 3
L = 2(3) = 6 sec
yi = 0.46 + 0.09 + 0.14 = 0.69
1.5*6 + 5
1 – 0.69
Assume C = 60 sec.
Cycle Length Calculation
C =
C = = 14/0.31 = 45 sec

Assume 85th Percentile Speed on Michigan and Hewitt is approximately 45 mph = 66 fps
v
Y = t + 2(a+gG) = 1 + 66/20 = 4.3 sec
Assume width to clear Michigan Avenue = 100 ft
Assume width to clear Hewitt Avenue = 100 ft
AR = (W + L)/v
AR = (100+20)/66 = 1.8 sec
Clearance Interval per phase = 4.3 sec + 1.8 sec = 6.1 sec
Total Clearance Time = (6.1 sec) ( 3 phases) = 18.3 sec
Net Green time = cycle length – total clearance time
= 60 – 18.3 = 41.7 sec
Clearance Interval Design

Calculation of Splits
NE Bound Michigan = 41.7(0.46/0.69) = 27.8 sec
SW Bound Michigan = 41.7(0.09/0.69) = 5.4 sec
NS Bound Hewitt = 41.7(0.14/0.69) = 8.5 sec
Resulting Signal Timing Plans
G = 27.8 G = 5.4 G = 8.5
Y = 4.3 Y = 4.3 Y = 4.3
AR = 1.8 AR = 1.8 AR = 1.8

Hewitt and Ellsworth
East-WestEllsworth Road
Left Turn
East-WestEllsworth Road
North-SouthHewitt Road
NorthboundHewitt Road
Assume the following phasing plan.

Assume Saturation flow (S):
SThru = 1800 vphgpl, SLeft = 1200 vphgpl
YEW (Left) = Max [98/1200, 7/1200]
= 0.08 0.006
YEW (Left) = 0.08YEW (thru with permitted lefts)
= Max [220/1800, 206/1800, (289+56)/(1800*2)]
= 0.12 0.11 0.09
YEW THRU = 0.12Left turn-lane critical volumes were NOT considered in YEW (although permitted), since there is an exclusive left-turn phase for both directions
Hewitt and Ellsworth

Assume 70% of left-turn volumes and 50% of thru and right turn volumes go during the NB Split phase.
YNB (split) = Max [(289*0.7)/1200, (695+38)*(0.5)/(1800*2)]
= 0.17 0.10
YNB (split) = 0.17
YNS (thru and permitted lefts)
= Max [(289*3)/1200, (695+38)*0.5/(1800*2), 103/1200, (324+120)/(1800*2)]
= Max [0.07, 0.10, 0.08, 0.12]
YNS (thru and permitted lefts) = 0.12
Left turn-lane critical volumes were considered in YNS (although permitted), since there is not an exclusive left-turn phase for both directions and the left-turn demand has not dissipated.

1.5L + 5
1 - yi
L = sum of lost time per phase
# Phases = 4
L = 2(4) = 8 sec
yi = 0.08 + 0.12 + 0.17 + 0.12 = 0.49
1.5*8 + 5
1 – 0.49
Assume C = 90 sec, since there are 4 phases and total clearance interval time may be 24 sec.
Cycle Length Calculation
C =
C = = 33 sec

Assume 85th Percentile Speed on Hewitt and Ellsworth = 45 mph = 66 fps
v
Y = t + 2(a+gG) = 1 + 66/20 = 4.3 sec
Assume width to clear Hewitt Road = 80 ft
Assume width to clear Ellsworth Road = 80 ft
Clearance Interval Design

All Red, AR = W + L = (80+20)/66 = 1.5 sec
V
Clearance Interval per phase
= 4.3 sec + 1.5 sec = 5.8 sec/phase
Total Clearance Time = (5.8 sec) ( 4 phases) = 23.2 sec
Net Green time = cycle length – total clearance time
= 90 – 23.2 = 66.8 sec
Clearance Interval Design

Calculation of SplitsGreen time for:
EW Left = 66.8(0.08/0.49) = 10.9 sec
EW Thru = 66.8(0.12/0.49) = 16.4 sec
NB Split = 66.8(0.17/0.49) = 23.2 sec
NS = 66.8(0.12/0.49) = 16.3 sec
Resulting Signal Timing Plans
G = 10.9 G = 16.4 G = 23.2 G = 16.3
Y = 4.3 Y = 4.3 Y = 4.3 Y =4.3
R* = 73.3 R* = 67.8 R* = 61.0 R* = 67.9
AR = 1.5 AR = 1.5 AR = 1.5 AR = 1.5
* Excludes All Red Time

Impact of Traffic Signal Systems on Traffic Crashes
EXAMPLES

Intersection: Seven Mile & Ryan

N
LEGEND
Seven Mile Road
Rya
n R
oad
Collision Diagram for Seven Mile Road and Ryan Road Intersection for Before Improvement Period from June 1994 - May 1995 (12 Months) data
Rear-End
Backed Into
Head On
Angle
Left-TurnHead-On
Sideswipe
Fixed Object
Parked Vehicle
Pedestrian
Other
Injury
Fatality
*
1
2
3
4
5
6
7
89
10
11
12
13
14
15
16
17
1819
20
21
22
23
24
25
26
27
28
29
30
Driveway3132
33
34
35
36
37
38
39
40
41
42
43 44
4546
47
48
4950
51
N
LEGEND
Seven Mile Road
Rya
n R
oad
Collision Diagram for Seven Mile Road and Ryan Road Intersection for Before Improvement Period from June 1994 - May 1995 (12 Months) data
Rear-End
Backed Into
Head On
Angle
Left-TurnHead-On
Sideswipe
Fixed Object
Parked Vehicle
Pedestrian
Other
Injury
Fatality
**
1
2
3
4
5
6
7
89
10
11
12
13
14
15
16
17
1819
20
21
22
23
24
25
26
27
28
29
30
Driveway3132
33
34
35
36
37
38
39
40
41
42
43 44
4546
47
48
4950
51
N
LEGEND
Seven Mile Road
Rya
n R
oad
Rear-End
Backed Into
Head On
Angle
Left-TurnHead-On
Sideswipe
Fixed Object
Parked Vehicle
Pedestrian
Other
Injury
Fatality
*
1
2
3
4
56
7
8
9
10
11
12
13
14
15
16
17
18
19
20
21
22
23
24
25
26
27
28
29
30
31
32
33
34
35
36
37
38
39
40
41
42
43
44
45
46
47
48
49
50
51
52
53
54
55
56
57
58
59
60
61
62
63
6465
Collision Diagram for Seven Mile Road and Ryan Road Intersection for Before Improvement Period from June 1995 - May 1996 (12 Months) data
N
LEGEND
Seven Mile Road
Rya
n R
oad
Rear-End
Backed Into
Head On
Angle
Left-TurnHead-On
Sideswipe
Fixed Object
Parked Vehicle
Pedestrian
Other
Injury
Fatality
**
1
2
3
4
56
7
8
9
10
11
12
13
14
15
16
17
18
19
20
21
22
23
24
25
26
27
28
29
30
31
32
33
34
35
36
37
38
39
40
41
42
43
44
45
46
47
48
49
50
51
52
53
54
55
56
57
58
59
60
61
62
63
6465
Collision Diagram for Seven Mile Road and Ryan Road Intersection for Before Improvement Period from June 1995 - May 1996 (12 Months) data
BEFORE PERIOD COLLISION DIAGRAMS
June 1995 – May 1996June 1994 – May 1995

BEFORE PERIOD COLLISION DIAGRAM
June 1996 – May 1997
N
LEGEND
Seven Mile Road
Rya
n R
oad
Rear-End
Backed Into
Head On
Angle
Left-TurnHead-On
Sideswipe
Fixed Object
Parked Vehicle
Pedestrian
Other
Injury
Fatality
*
1
2
34
5
6
7
8
9
10
11
12
13
14
1516
17
18
19
20
*
21
22
23
24
25
26
27
28
29
30
31
32
33
34
35
36
37
38
39
40
41
42
43
44
45 4647
4849
50
51
52
53
54
55
56
57
58
*59
60
61
62
63
64
65
66
67
*
Driveway Related
68
69
70
71
72
73
74
75
76
77
78
79
80
81
82
Collision Diagram for Seven Mile Road and Ryan Road Intersection for Before Improvement Period from June 1996 - May 1997 (12 Months) data
N
LEGEND
Seven Mile Road
Rya
n R
oad
Rear-End
Backed Into
Head On
Angle
Left-TurnHead-On
Sideswipe
Fixed Object
Parked Vehicle
Pedestrian
Other
Injury
Fatality
**
1
2
34
5
6
7
8
9
10
11
12
13
14
1516
17
18
19
20
**
21
22
23
24
25
26
27
28
29
30
31
32
33
34
35
36
37
38
39
40
41
42
43
44
45 4647
4849
50
51
52
53
54
55
56
57
58
**59
60
61
62
63
64
65
66
67
**
Driveway Related
68
69
70
71
72
73
74
75
76
77
78
79
80
81
82
Collision Diagram for Seven Mile Road and Ryan Road Intersection for Before Improvement Period from June 1996 - May 1997 (12 Months) data

AFTER PERIOD COLLISION DIAGRAMS
June 1997 – December 1997
N
LEGENDRear-End
Backed Into
Head On
Angle
Left-TurnHead-On
Sideswipe
Fixed Object
Parked Vehicle
Pedestrian
Other
Injury
Fatality
*
Rya
n R
oad
Seven Mile Road
Collision Diagram for Seven Mile Road and Ryan for (June - December 1997) After Period
1
2
3
4
5
6
7
8
9
10
11
12
14
13
15
16
17
18
19
20
21
22
N
LEGENDRear-End
Backed Into
Head On
Angle
Left-TurnHead-On
Sideswipe
Fixed Object
Parked Vehicle
Pedestrian
Other
Injury
Fatality
**
Rya
n R
oad
Seven Mile Road
Collision Diagram for Seven Mile Road and Ryan for (June - December 1997) After Period
1
2
3
4
5
6
7
8
9
10
11
12
14
13
15
16
17
18
19
20
21
22
N
LEGENDRear-End
Backed Into
Head On
Angle
Left-TurnHead-On
Sideswipe
Fixed Object
Parked Vehicle
Pedestrian
Other
Injury
Fatality
*
Rya
n R
oad
Seven Mile Road
Collision Diagram for Seven Mile Road and Ryan for (January - December 1998) After Period
1
2
3
4
5
6
7 8
9
10
11
12
13
14
15
16
17
18
19
20
21
22
2324
25
26
27
28
29
30
31
32
N
LEGENDRear-End
Backed Into
Head On
Angle
Left-TurnHead-On
Sideswipe
Fixed Object
Parked Vehicle
Pedestrian
Other
Injury
Fatality
**
Rya
n R
oad
Seven Mile Road
Collision Diagram for Seven Mile Road and Ryan for (January - December 1998) After Period
1
2
3
4
5
6
7 8
9
10
11
12
13
14
15
16
17
18
19
20
21
22
2324
25
26
27
28
29
30
31
32
January 1998 – December 1998

AFTER PERIOD COLLISION DIAGRAMS
January 2000 – December 2000
N
LEGENDRear-End
Backed Into
Head On
Angle
Left-TurnHead-On
Sideswipe
Fixed Object
Parked Vehicle
Pedestrian
Other
Injury
Fatality
*
Rya
n R
oad
Seven Mile Road
Collision Diagram for Seven Mile Road and Ryan for (January - December 1999) After Period
1
2
3
4
5
6
7
8
9
10
11
13
14
15
16
17
18
19
20
21
22
23
24
25
26
27
29
28
30
31
32
33
34
35
12
N
LEGENDRear-End
Backed Into
Head On
Angle
Left-TurnHead-On
Sideswipe
Fixed Object
Parked Vehicle
Pedestrian
Other
Injury
Fatality
**
Rya
n R
oad
Seven Mile Road
Collision Diagram for Seven Mile Road and Ryan for (January - December 1999) After Period
1
2
3
4
5
6
7
8
9
10
11
13
14
15
16
17
18
19
20
21
22
23
24
25
26
27
29
28
30
31
32
33
34
35
12
January 1999 – December 1999
N
LEGENDRear-End
Backed Into
Head On
Angle
Left-TurnHead-On
Sideswipe
Fixed Object
Parked Vehicle
Pedestrian
Other
Injury
Fatality
*
Rya
n R
oad
Seven Mile Road
Collision Diagram for Seven Mile Road and Ryan for (January - December 2000) After Period
1
2
3
4
5
6
7
8
9
10
11
12
13
14
15
16
17
18
19
20
21
22
23
24
25
2627
28
29
3031
32
34
35
36
33
N
LEGENDRear-End
Backed Into
Head On
Angle
Left-TurnHead-On
Sideswipe
Fixed Object
Parked Vehicle
Pedestrian
Other
Injury
Fatality
**
Rya
n R
oad
Seven Mile Road
Collision Diagram for Seven Mile Road and Ryan for (January - December 2000) After Period
1
2
3
4
5
6
7
8
9
10
11
12
13
14
15
16
17
18
19
20
21
22
23
24
25
2627
28
29
3031
32
34
35
36
33

AFTER PERIOD COLLISION DIAGRAM
January 2001 – December 2001
N
LEGENDRear-End
Backed Into
Head On
Angle
Left-TurnHead-On
Sideswipe
Fixed Object
Parked Vehicle
Pedestrian
Other
Injury
Fatality
*
Rya
n R
oad
Seven Mile Road
Collision Diagram for Seven Mile Road and Ryan for (January - December 2001) After Period
1 2
3
4
5
*6
7
8
9
10
11
12
13
14
15
16
1718
19
20
21
22
23
24
25
26
N
LEGENDRear-End
Backed Into
Head On
Angle
Left-TurnHead-On
Sideswipe
Fixed Object
Parked Vehicle
Pedestrian
Other
Injury
Fatality
**
Rya
n R
oad
Seven Mile Road
Collision Diagram for Seven Mile Road and Ryan for (January - December 2001) After Period
1 2
3
4
5
**6
7
8
9
10
11
12
13
14
15
16
1718
19
20
21
22
23
24
25
26

20 19
62
82
33
21.6
3435
46
36
17
3.2478
5
0
10
20
30
40
50
60
70
80
90
1994-1995 1995-1996 1996-1997 1997-1998 1998-1999 1999-2000 2000-2001 *2001-2002
Time* Represents Annual Average of 15 months (June 2001- August 2002) data
Ann
ual A
vera
ge T
otal
Cra
sh F
requ
ency
Annual Average Total CrashesAnnual Average Injury Crashes
Before After
Before (UD 10) and After (UD 10) Crash Data Comparison for Seven Mile Road and Ryan Road Intersection
10.7
20.7
8.79.1
3.8 2.7
31.2
67.7
17.318.7
7.2
5.3
0.0
10.0
20.0
30.0
40.0
50.0
60.0
70.0
80.0
Rear End Angle (Intersection) Left-Turn Head-On SideSwipe TOTAL InjuryPredominant Crash Types and Severity
* Represents Annual Average of 63 months (June 1997 - August 2002) data
Ann
ual A
vera
ge C
rash
Fre
quen
cy
Annual average of 3 years beforedata*Annual average of after data
Yearly Trend Analysis for Total and Injury Crashes for the Intersection of Seven Mile
Road and Ryan Road
Comparison of ‘Before and After’ Crashes for the Intersection of Seven
Mile Road and Ryan Road

Intersection: Seven Mile & John R.

BEFORE PERIOD COLLISION DIAGRAMS
September 1994 – August 1995
N
LEGEND
Seven Mile Road
Joh
n R
Ro
ad
Collision Diagram for Seven Mile Road and John R Road September 1994 – August 1995 (12 Months Before Period)
Rear-End
Backed Into
Head On
Angle
Left-TurnHead-On
Sideswipe
Fixed Object
Parked Vehicle
Pedestrian
Other
Injury
Fatality
*
1
2
34
5
6
7
8
9
10
11
12
13
14
15
1617
18
19
20
21
22
23
24
25
26
27
28
29
30
3132
3334
3536
3738
39
4041
42
4344
45
46
47
48
49
50
51
52
53
54
55
56
N
LEGEND
Seven Mile Road
Joh
n R
Ro
ad
Collision Diagram for Seven Mile Road and John R Road September 1994 – August 1995 (12 Months Before Period)
Rear-End
Backed Into
Head On
Angle
Left-TurnHead-On
Sideswipe
Fixed Object
Parked Vehicle
Pedestrian
Other
Injury
Fatality
**
1
2
34
55
6
7
8
9
10
11
12
13
14
15
1617
18
19
20
21
22
23
24
25
26
27
28
29
30
3132
3334
3536
3738
39
4041
42
4344
45
46
47
48
49
50
51
52
53
54
55
56
N
LEGEND
Seven Mile Road
Joh
n R
Ro
ad
Rear-End
Backed Into
Head On
Angle
Left-TurnHead-On
Sideswipe
Fixed Object
Parked Vehicle
Pedestrian
Other
Injury
Fatality
*
Collision Diagram for Seven Mile Road and John R Road September 1995 – August 1996(12 Months Before Period)
1
2
4
3
5
6
7
8
9
* 10
11
12
13
14
15
16
17
18
19
20
21
22
23
24
25
26
27
28
29
30
*31
32
33
34
35
36
37
38
39
40
41
42
43
44
45
46
47
48
4950
51
52
53
N
LEGEND
Seven Mile Road
Joh
n R
Ro
ad
Rear-End
Backed Into
Head On
Angle
Left-TurnHead-On
Sideswipe
Fixed Object
Parked Vehicle
Pedestrian
Other
Injury
Fatality
**
Collision Diagram for Seven Mile Road and John R Road September 1995 – August 1996(12 Months Before Period)
1
2
4
3
5
6
7
8
9
** 10
11
12
13
14
15
16
17
18
19
20
21
22
23
24
25
26
27
28
29
30
**31
32
33
34
35
36
37
38
39
40
41
42
43
44
45
46
47
48
4950
51
52
53
September 1995 – August 1996

BEFORE PERIOD COLLISION DIAGRAM
September 1996 – August 1997
N
LEGEND
Seven Mile Road
Joh
n R
Ro
ad
Rear-End
Backed Into
Head On
Angle
Left-TurnHead-On
Sideswipe
Fixed Object
Parked Vehicle
Pedestrian
Other
Injury
Fatality
*
1
2
3
4
4
5
6
7
8 9
10
11
12
13
14
15
16
17 18
19
20
21
22
23
24
25
26
27
28
29
30
31
32
33
34
35
36
37
38
39
40
41
42
43
*44
45
46
* 47
48
49
50
Collision Diagram for Seven Mile Road and John R Road September 1996 – August 1997(12 Months Before Period)
N
LEGEND
Seven Mile Road
Joh
n R
Ro
ad
Rear-End
Backed Into
Head On
Angle
Left-TurnHead-On
Sideswipe
Fixed Object
Parked Vehicle
Pedestrian
Other
Injury
Fatality
**
1
2
3
4
4
5
6
7
8 9
10
11
12
13
14
15
16
17 18
19
20
21
22
23
24
25
26
27
28
29
30
31
32
33
34
35
36
37
38
39
40
41
42
43
**44
45
46
** 47
48
49
50
Collision Diagram for Seven Mile Road and John R Road September 1996 – August 1997(12 Months Before Period)

AFTER PERIOD COLLISION DIAGRAMS
N
LEGEND
Seven Mile Road
Joh
n R
Ro
ad
Rear-End
Backed Into
Head On
Angle
Left-TurnHead-On
Sideswipe
Fixed Object
Parked Vehicle
Pedestrian
Other
Injury
Fatality
*
Collision Diagram for Seven Mile Road and John R Road September 1997 – August 1998(12 Months After Period)
1
* 2
3
4
5
6
7
8
9
10
11
12
13
14
1516
17
18
19
20
21
22
2324
25
26
27
28
29
30
31
32
*33
N
LEGEND
Seven Mile Road
Joh
n R
Ro
ad
Rear-End
Backed Into
Head On
Angle
Left-TurnHead-On
Sideswipe
Fixed Object
Parked Vehicle
Pedestrian
Other
Injury
Fatality
**
Collision Diagram for Seven Mile Road and John R Road September 1997 – August 1998(12 Months After Period)
1
** 2
3
4
5
6
7
8
9
10
11
12
13
14
1516
17
18
19
20
21
22
2324
25
26
27
28
29
30
31
32
**33
September 1997 – August 1998
N
LEGEND
Seven Mile Road
Joh
n R
Ro
ad
Rear-End
Backed Into
Head On
Angle
Left-TurnHead-On
Sideswipe
Fixed Object
Parked Vehicle
Pedestrian
Other
Injury
Fatality
*
Collision Diagram for Seven Mile Road and John R Road September 1998 – August 1999(12 Months After Period)
1
2
3
4
19
5
6
7
8
9
10
11
12
13
14
1516
17
18
20
21
22
N
LEGEND
Seven Mile Road
Joh
n R
Ro
ad
Rear-End
Backed Into
Head On
Angle
Left-TurnHead-On
Sideswipe
Fixed Object
Parked Vehicle
Pedestrian
Other
Injury
Fatality
**
Collision Diagram for Seven Mile Road and John R Road September 1998 – August 1999(12 Months After Period)
1
2
3
4
19
5
6
7
8
9
10
11
12
13
14
1516
17
18
20
21
22
September 1998 – August 1999

AFTER PERIOD COLLISION DIAGRAMS
September 1999 – August 2000 September 2000 – August 2001
N
LEGEND
Seven Mile Road
Joh
n R
Ro
ad
Rear-End
Backed Into
Head On
Angle
Left-TurnHead-On
Sideswipe
Fixed Object
Parked Vehicle
Pedestrian
Other
Injury
Fatality
*
Collision Diagram for Seven Mile Road and John R Road September 1999 – August 2000(12 Months After Period)
1
2
3
4
5
6
7
8
9
10
11
12
13
14
15
16
17
18
1920
*21
22
N
LEGEND
Seven Mile Road
Joh
n R
Ro
ad
Rear-End
Backed Into
Head On
Angle
Left-TurnHead-On
Sideswipe
Fixed Object
Parked Vehicle
Pedestrian
Other
Injury
Fatality
**
Collision Diagram for Seven Mile Road and John R Road September 1999 – August 2000(12 Months After Period)
1
2
3
4
5
6
7
8
9
10
11
12
13
14
15
16
17
18
1920
**21
22
N
LEGEND
Seven Mile Road
Joh
n R
Ro
ad
Rear-End
Backed Into
Head On
Angle
Left-TurnHead-On
Sideswipe
Fixed Object
Parked Vehicle
Pedestrian
Other
Injury
Fatality
*
Collision Diagram for Seven Mile Road and John R Road September 2000 – August 2001(12 Months After Period)
1
2
3
4
5
6
7
8 9
1011
1213
14
15
16
17
18
19
20
*21
22*23
2425
26
27
28
29
30
31
32
33
34
35
N
LEGEND
Seven Mile Road
Joh
n R
Ro
ad
Rear-End
Backed Into
Head On
Angle
Left-TurnHead-On
Sideswipe
Fixed Object
Parked Vehicle
Pedestrian
Other
Injury
Fatality
**
Collision Diagram for Seven Mile Road and John R Road September 2000 – August 2001(12 Months After Period)
1
2
3
4
5
6
7
8 9
1011
1213
14
15
16
17
18
19
20
**21
22**23
2425
26
27
28
29
30
31
32
33
34
35

AFTER PERIOD COLLISION DIAGRAM
September 2001 – December 2001
N
LEGEND
Seven Mile Road
Joh
n R
Ro
ad
Rear-End
Backed Into
Head On
Angle
Left-TurnHead-On
Sideswipe
Fixed Object
Parked Vehicle
Pedestrian
Other
Injury
Fatality
*
Collision Diagram for Seven Mile Road and John R Road September 2001 – December 2001(4 Months After Period)
1
23
4
57
7
N
LEGEND
Seven Mile Road
Joh
n R
Ro
ad
Rear-End
Backed Into
Head On
Angle
Left-TurnHead-On
Sideswipe
Fixed Object
Parked Vehicle
Pedestrian
Other
Injury
Fatality
**
Collision Diagram for Seven Mile Road and John R Road September 2001 – December 2001(4 Months After Period)
1
23
4
57
7

Yearly Trend Analysis for Total and Injury Crashes for the Intersection of Seven Mile
Road and John R. Road
Comparison of ‘Before and After’ Crashes for the Intersection of Seven
Mile Road and John R. Road
56
51
33
22 22
31.5
15
21 21
2
5
9
48
8 7
7
0
10
20
30
40
50
60
*1994-1995 *1995-1996 *1996-1997 *1997-1998 *1998-1999 *1999-2000 *2000-2001 *2001-2002
Time*Represents an annual average of 12 month (September -August) data
An
nu
al
Av
era
ge
To
tal
Cra
sh F
req
uen
cy
Annual Average of Total Crashes
Annual Average of Injury Crashes
Before After
12.0
15.0
9.0
51.7
16.7
4.22.8
4.6
25.4
6.0
7.77.7
8.05.8
0.0
10.0
20.0
30.0
40.0
50.0
60.0
Rear End Angle(Intersection)
Left-Turn Head-On
SideSwipe Other TOTAL Injury
Predominant Crash Types and Severity *Represents an annual average of 60 months (Septembern1997 through August 2002) data
An
nu
al A
vera
ge C
rash
Fre
qu
ency
Annual Average of 3 years BeforeData* Annual average of After Data

Intersection: Hubbell & Puritan
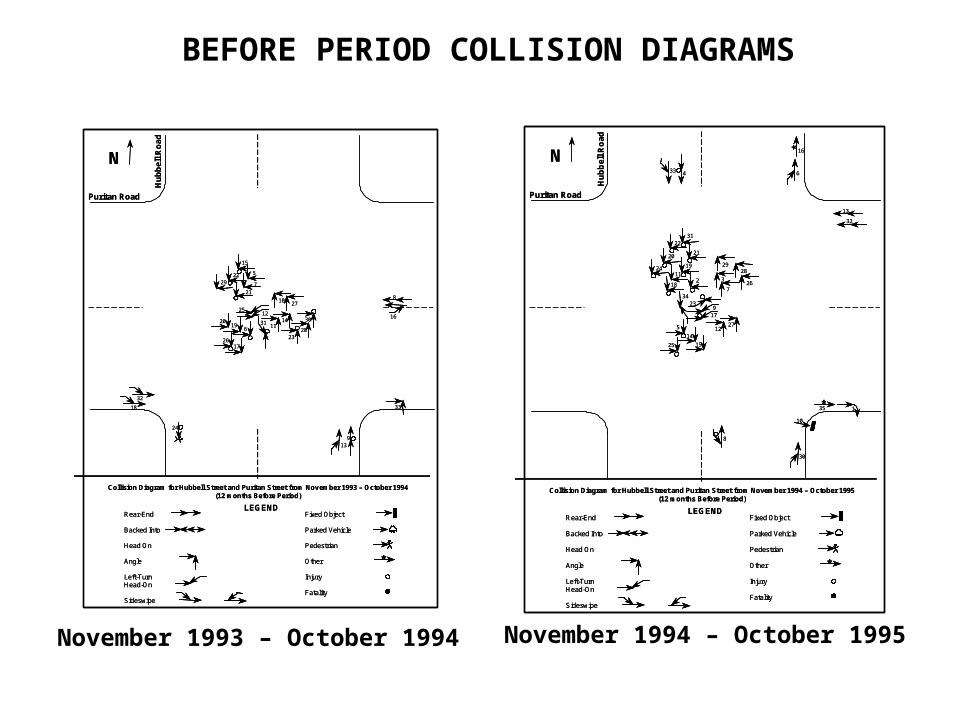
BEFORE PERIOD COLLISION DIAGRAMS
November 1993 – October 1994
N
LEGENDRear-End
Backed Into
Head On
Angle
Left-TurnHead-On
Sideswipe
Fixed Object
Parked Vehicle
Pedestrian
Other
Injury
Fatality
*
Hu
bb
ell
Ro
ad
Puritan Road
Collision Diagram for Hubbell Street and Puritan Street from November 1993 – October 1994 (12 months Before Period)
5
6
7
8
9
10
11
12
13
14
15
16
17
18
19
21
22
23
24
25
26
27
28
29
3031
32
33
20
N
LEGENDRear-End
Backed Into
Head On
Angle
Left-TurnHead-On
Sideswipe
Fixed Object
Parked Vehicle
Pedestrian
Other
Injury
Fatality
**
Hu
bb
ell
Ro
ad
Puritan Road
Collision Diagram for Hubbell Street and Puritan Street from November 1993 – October 1994 (12 months Before Period)
5
6
7
8
9
10
11
12
13
14
15
16
17
18
19
21
22
23
24
25
26
27
28
29
3031
32
33
20
N
LEGENDRear-End
Backed Into
Head On
Angle
Left-TurnHead-On
Sideswipe
Fixed Object
Parked Vehicle
Pedestrian
Other
Injury
Fatality
*
Hu
bb
ell
Ro
ad
Puritan Road
Collision Diagram for Hubbell Street and Puritan Street from November 1994 – October 1995 (12 months Before Period)
*
1
2 3
4
5
6
7
8
9
10
11
12
13
14
15
16
17
18
19
2021
22
23
24
25
26
27
2829
30
31
32
33
34
*35
N
LEGENDRear-End
Backed Into
Head On
Angle
Left-TurnHead-On
Sideswipe
Fixed Object
Parked Vehicle
Pedestrian
Other
Injury
Fatality
**
Hu
bb
ell
Ro
ad
Puritan Road
Collision Diagram for Hubbell Street and Puritan Street from November 1994 – October 1995 (12 months Before Period)
**
1
2 3
4
5
6
7
8
9
10
11
12
13
14
15
16
17
18
19
2021
22
23
24
25
26
27
2829
30
31
32
33
34
**35
November 1994 – October 1995

BEFORE PERIOD COLLISION DIAGRAM
November 1995 – October 1996
N
LEGENDRear-End
Backed Into
Head On
Angle
Left-TurnHead-On
Sideswipe
Fixed Object
Parked Vehicle
Pedestrian
Other
Injury
Fatality
*
Hu
bb
ell
Ro
ad
Puritan Road
Collision Diagram for Hubbell Street and Puritan Street from November 1995 – October 1996(12 months Before Period)
* 12
3
4
5
6
7
8
9
10
11
12
13
14
15
16 17
18
19
20
21
22
23
24 25
26
2728
29
30
33
34
35
36
37
25
*32
N
LEGENDRear-End
Backed Into
Head On
Angle
Left-TurnHead-On
Sideswipe
Fixed Object
Parked Vehicle
Pedestrian
Other
Injury
Fatality
**
Hu
bb
ell
Ro
ad
Puritan Road
Collision Diagram for Hubbell Street and Puritan Street from November 1995 – October 1996(12 months Before Period)
** 12
3
4
5
6
7
8
9
10
11
12
13
14
15
16 17
18
19
20
21
22
23
24 25
26
2728
29
30
33
34
35
36
37
25
**32

AFTER PERIOD COLLISION DIAGRAMS
N
LEGENDRear-End
Backed Into
Head On
Angle
Left-TurnHead-On
Sideswipe
Fixed Object
Parked Vehicle
Pedestrian
Other
Injury
Fatality
*
Hu
bb
ell
Ro
adPuritan Road
Collision Diagram for Hubbell Street and Puritan Street from November 1997 –October 1998 (12 months After Period)
1
2
3
4
5
67
8
910
11
12
13
*14
15 16
17
18
N
LEGENDRear-End
Backed Into
Head On
Angle
Left-TurnHead-On
Sideswipe
Fixed Object
Parked Vehicle
Pedestrian
Other
Injury
Fatality
**
Hu
bb
ell
Ro
adPuritan Road
Collision Diagram for Hubbell Street and Puritan Street from November 1997 –October 1998 (12 months After Period)
1
2
3
4
5
67
8
910
11
12
13
**14
15 16
17
18
November 1997 – October 1998 November 1998 – October 1999
N
LEGENDRear-End
Backed Into
Head On
Angle
Left-TurnHead-On
Sideswipe
Fixed Object
Parked Vehicle
Pedestrian
Other
Injury
Fatality
*
Hu
bb
ell
Ro
ad
Puritan Road
Collision Diagram for Hubbell Street and Puritan Street from November 1998 –October 1999(12 months After Period)
1
2
3
4
*5
6
7
10
11
8
9
N
LEGENDRear-End
Backed Into
Head On
Angle
Left-TurnHead-On
Sideswipe
Fixed Object
Parked Vehicle
Pedestrian
Other
Injury
Fatality
**
Hu
bb
ell
Ro
ad
Puritan Road
Collision Diagram for Hubbell Street and Puritan Street from November 1998 –October 1999(12 months After Period)
1
2
3
4
**5
6
7
10
11
8
9

AFTER PERIOD COLLISION DIAGRAMS
November 1999 – October 2000 November 2000 – October 2001
N
LEGENDRear-End
Backed Into
Head On
Angle
Left-TurnHead-On
Sideswipe
Fixed Object
Parked Vehicle
Pedestrian
Other
Injury
Fatality
*
Hu
bb
ell
Ro
ad
Puritan Road
Collision Diagram for Hubbell Street and Puritan Street from November 1999 –October 2000 (12 months After Period)
1
2
3
4
5
6
78
9
10
40
41
42
43
4445
*
46
47
48
*49 50
51
52
53
54
5556
57
58
59
N
LEGENDRear-End
Backed Into
Head On
Angle
Left-TurnHead-On
Sideswipe
Fixed Object
Parked Vehicle
Pedestrian
Other
Injury
Fatality
**
Hu
bb
ell
Ro
ad
Puritan Road
Collision Diagram for Hubbell Street and Puritan Street from November 1999 –October 2000 (12 months After Period)
1
2
3
4
5
6
78
9
10
40
41
42
43
4445
**
46
47
48
**49 50
51
52
53
54
5556
57
58
59
N
LEGENDRear-End
Backed Into
Head On
Angle
Left-TurnHead-On
Sideswipe
Fixed Object
Parked Vehicle
Pedestrian
Other
Injury
Fatality
*
Hu
bb
ell
Ro
ad
Puritan Road
Collision Diagram for Hubbell Street and Puritan Street from November 2000 –October 2001 (12 months After Period)
1
2
3
4
5
67
89
10
11
12
13
*14
15
16
17
18
19
20
21
22
*23
24
25
28
29
30
31
32
3334
35
363738
39
40
26
27
41
42
43
4445
*
46
47
48
*49 50
51
52
53
54
5556
57
58
59
N
LEGENDRear-End
Backed Into
Head On
Angle
Left-TurnHead-On
Sideswipe
Fixed Object
Parked Vehicle
Pedestrian
Other
Injury
Fatality
**
Hu
bb
ell
Ro
ad
Puritan Road
Collision Diagram for Hubbell Street and Puritan Street from November 2000 –October 2001 (12 months After Period)
1
2
3
4
5
67
89
10
11
12
13
**14
15
16
17
18
19
20
21
22
**23
24
25
28
29
30
31
32
3334
35
363738
39
40
26
27
41
42
43
4445
**
46
47
48
**49 50
51
52
53
54
5556
57
58
59

AFTER PERIOD COLLISION DIAGRAM
November 2001 – December 2001
N
LEGENDRear-End
Backed Into
Head On
Angle
Left-TurnHead-On
Sideswipe
Fixed Object
Parked Vehicle
Pedestrian
Other
Injury
Fatality
*
Hu
bb
ell
Ro
ad
Puritan Road
Collision Diagram for Hubbell Street and Puritan Street from November 2001 –December 2001 (2 months After Period)
1N
LEGENDRear-End
Backed Into
Head On
Angle
Left-TurnHead-On
Sideswipe
Fixed Object
Parked Vehicle
Pedestrian
Other
Injury
Fatality
**
Hu
bb
ell
Ro
ad
Puritan Road
Collision Diagram for Hubbell Street and Puritan Street from November 2001 –December 2001 (2 months After Period)
1

Yearly Trend Analysis for Total and Injury Crashes for the Intersection of Hubbell Road
and Puritan Road
Comparison of ‘Before and After’ Crashes for the Intersection of Hubbell
Road and Puritan Road
35.0
37.0
18.0
11.0
16.0
14.0
12.013.0
15.0
2.0 2.4
33.0
14.0
2.0
8.07.0
0.0
5.0
10.0
15.0
20.0
25.0
30.0
35.0
40.0
1993-1994 1994-1995 1995-1996 1997- 1998 1998-1999 1999-2000 2000-2001 *2001-2002
Time* Represents annual average of 10 Months (November 2001 - August 2002 ) data.
Ann
ual A
vera
ge C
rash
Fre
quen
cy
Annual Average of Toatal Crashes
Annual Average of Injury Crashes
Before
After
4.3
20.3
35.0
1.01.9
4.34.03.7
13.3
2.7
14.7
2.5 3.1
6.2
0.0
5.0
10.0
15.0
20.0
25.0
30.0
35.0
40.0
Rear End Angle (Intersection) Left-Turn Head-On SideSwipe Others TOTAL InjuryPredominant Types of Crashes
* Represents Annual Average of 58 Months ( November 1997 -August 2002) data
An
nu
al A
ver
age
Cra
sh F
req
uen
cy
Annual Average of 3 years BeforeData * Annual average of after data