side guards for trucks and trailers phase 1: background ... · side guards for trucks and trailers...
TRANSCRIPT
National Research Conseil national Council Canada de recherches Canada
Centre for Surface Centre de technologie des Transportation Technology transports de surface
Side Guards for Trucks and Trailers Phase 1: Background Investigation
Prepared for:
Road Safety and Motor Vehicle Directorate Transport Canada 275 Slater Street, Ottawa Ontario K1P 5H9
Prepared by: J. D. Patten, P. Eng.
C. V. Tabra, P. Eng. Project 54-A3861 Projet 54-A3861
Technical Report Rapport technique
March 1, 2010 CSTT-HVC-TR-158
UNLIMITED ILLIMITÉE
UNCLASSIFIED NON CLASSIFIÉE


CSTT-HVC-TR-158 i
National Research Council Canada Centre for Surface Transportation Technology
SIDE GUARDS FOR TRUCKS AND TRAILERS
PHASE 1: BACKGROUND INVESTIGATION
Prepared for /Prepare pour: Road Safety and Motor Vehicle Directorate Transport Canada 275 Slater Street, Ottawa Ontario K1P 5H9 Centre for Surface Transportation Technology Centre de technologie 2320 Lester Rd. des transports de surface Ottawa, Ontario K1V 1S2 Canada Technical Report Rapport technique CSTT-HVC-TR-158 CSTT-HVC-TR-158 Copyright 2010. This document contains confidential information that is proprietary to NRC�’s Centre for Surface Transportation Technology. No part of its contents may be used, copied, disclosed or conveyed to any party in any manner, in whole or in part, whatsoever without prior written permission from NRC�’s Centre for Surface Transportation Technology.

ii CSTT-HVC-TR-158
National Research Council Canada Centre for Surface Transportation Technology
This report reflects the views of its authors, and not necessarily those of Transport Canada.

CSTT-HVC-TR-158 iii
National Research Council Canada Centre for Surface Transportation Technology
ABSTRACT A study was conducted by NRC-CSTT to understand the state of heavy vehicle side guard use in the European Union (EU), Australia, Japan and North America. Publicly available information relating to side guard design, strength and installation was gathered and analyzed for countries currently requiring the devices. Collision data records were also analyzed to determine the effectiveness of the guards. Finally, heavy vehicle considerations and aerodynamic effects were reviewed to better understand how side guards would affect Canadian road users and operators.

iv CSTT-HVC-TR-158
National Research Council Canada Centre for Surface Transportation Technology
Any mention of specific vehicle make, model or brand in this document is done so as a means to present factual information that was obtained from publicly available sources. Neither vehicle testing nor model-to-model comparisons were conducted by NRC-CSTT as part of this study. As such, no comment is made on the suitability of any particular vehicle or commercial product for any particular application, use or task.

CSTT-HVC-TR-158 v
National Research Council Canada Centre for Surface Transportation Technology
EXECUTIVE SUMMARY Purpose and Methodology Vehicle side guards (also referred to as �“lateral protective�” and �“side underrun protection�” devices) are intended to provide protection to vulnerable road users (VRUs) such as pedestrians and cyclists, and in some instances motorcyclists, against the risk of falling under the sides of the vehicle and being caught under the wheels. Additionally, certain flush side fairings (or side skirts) may provide environmental benefit through improved fuel efficiency over a range of operating points, based on the reduction of aerodynamic drag on certain types of vehicles Side guards have been legislated on certain motor vehicles, trailers and semi-trailers in various countries in the EU and Japan. Transport Canada wished to undertake an investigative study of the feasibility of requiring protective side guards on large trucks and trailers operated in urban Canadian environments and also to understand any environmental benefits of flush side fairings. NRC-CSTT performed a background investigation and data collection exercise on side guard use in the EU, Japan, Australia and North America. The review included current use of side guards, types of devices used (including material types, design, attachment mechanisms), the types of vehicles on which they are used, reported effectiveness of side guards, collision statistics and lessons learned from jurisdictions that have legislated the use of these devices. Safety In Canadian urban collisions involving heavy vehicles, bicyclists and pedestrians, the front of the heavy vehicle (front, right front and left front) was the initial point of impact in 42.9% of the cases for bicyclist fatalities and 45.8% of the cases for pedestrian fatalities. The right side of the heavy vehicle (right middle, right rear and entire right side) was the initial point of impact in approximately 28.5% of cases for bicyclist fatalities and 6.3% of cases for pedestrian fatalities. The front of the vehicle was the initial point of impact in 48.5% of the cases for bicyclist fatalities and 71.6% of the cases for pedestrian fatalities in the US heavy truck-VRU collisions. The right side of the vehicle was the initial point of impact in approximately 22.5% of cases for bicyclist fatalities and 7.9% of cases for pedestrian fatalities. Based on data from the EU, the number of deaths and serious injuries for VRUs when involved in an incident with heavy vehicles has been reduced since the introduction of side guards. However, it is not clear if this reduction is entirely related to side guards or if side guards are but one of the contributing factors. The statistical data from the EU revealed there was a greater reduction in severe injuries and death for bicyclists than for pedestrians during the reporting period. UK�’s Transport Research Laboratory (TRL) modelling showed that sideguards offered a potential for improved protection to VRUs.
vi CSTT-HVC-TR-158
National Research Council Canada Centre for Surface Transportation Technology
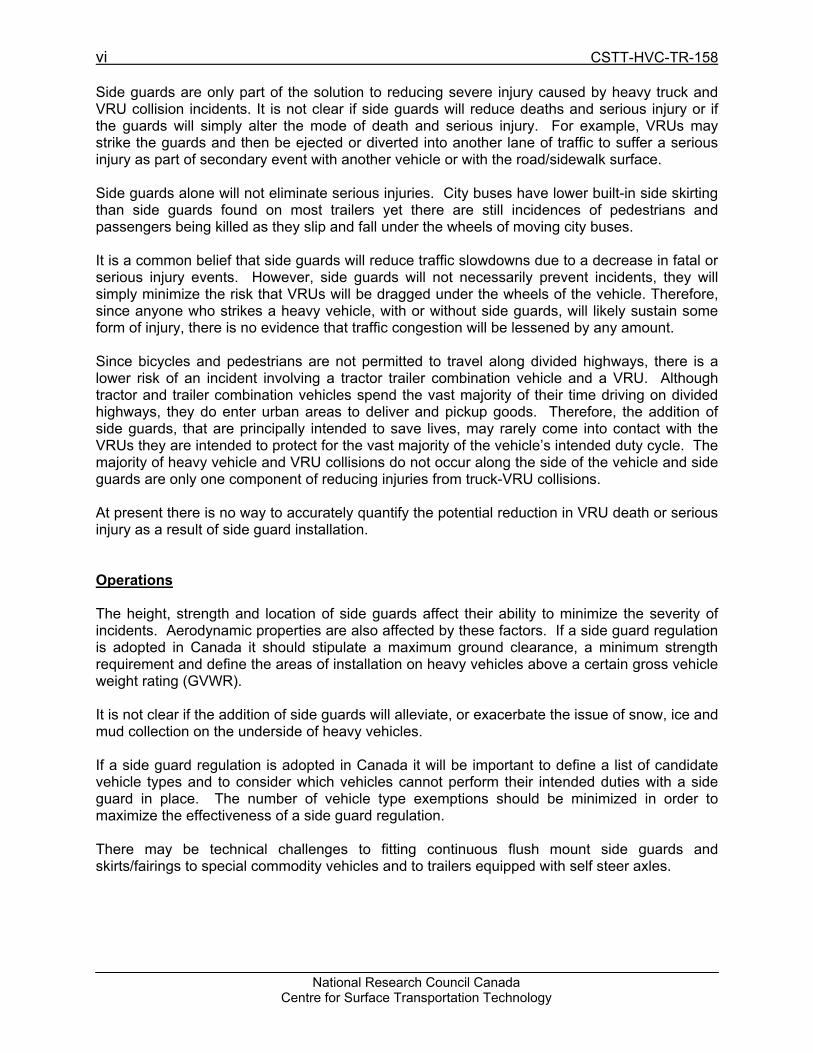
Side guards are only part of the solution to reducing severe injury caused by heavy truck and VRU collision incidents. It is not clear if side guards will reduce deaths and serious injury or if the guards will simply alter the mode of death and serious injury. For example, VRUs may strike the guards and then be ejected or diverted into another lane of traffic to suffer a serious injury as part of secondary event with another vehicle or with the road/sidewalk surface. Side guards alone will not eliminate serious injuries. City buses have lower built-in side skirting than side guards found on most trailers yet there are still incidences of pedestrians and passengers being killed as they slip and fall under the wheels of moving city buses. It is a common belief that side guards will reduce traffic slowdowns due to a decrease in fatal or serious injury events. However, side guards will not necessarily prevent incidents, they will simply minimize the risk that VRUs will be dragged under the wheels of the vehicle. Therefore, since anyone who strikes a heavy vehicle, with or without side guards, will likely sustain some form of injury, there is no evidence that traffic congestion will be lessened by any amount. Since bicycles and pedestrians are not permitted to travel along divided highways, there is a lower risk of an incident involving a tractor trailer combination vehicle and a VRU. Although tractor and trailer combination vehicles spend the vast majority of their time driving on divided highways, they do enter urban areas to deliver and pickup goods. Therefore, the addition of side guards, that are principally intended to save lives, may rarely come into contact with the VRUs they are intended to protect for the vast majority of the vehicle�’s intended duty cycle. The majority of heavy vehicle and VRU collisions do not occur along the side of the vehicle and side guards are only one component of reducing injuries from truck-VRU collisions. At present there is no way to accurately quantify the potential reduction in VRU death or serious injury as a result of side guard installation. Operations The height, strength and location of side guards affect their ability to minimize the severity of incidents. Aerodynamic properties are also affected by these factors. If a side guard regulation is adopted in Canada it should stipulate a maximum ground clearance, a minimum strength requirement and define the areas of installation on heavy vehicles above a certain gross vehicle weight rating (GVWR). It is not clear if the addition of side guards will alleviate, or exacerbate the issue of snow, ice and mud collection on the underside of heavy vehicles. If a side guard regulation is adopted in Canada it will be important to define a list of candidate vehicle types and to consider which vehicles cannot perform their intended duties with a side guard in place. The number of vehicle type exemptions should be minimized in order to maximize the effectiveness of a side guard regulation. There may be technical challenges to fitting continuous flush mount side guards and skirts/fairings to special commodity vehicles and to trailers equipped with self steer axles.

CSTT-HVC-TR-158 vii
National Research Council Canada Centre for Surface Transportation Technology
Environmental Although similar in appearance, a clear distinction should be made between devices that are intended to protect vulnerable road users and devices that are intended to reduce fuel consumption via a reduction in aerodynamic drag. Additionally, there may need to be a clear distinction between devices that would be useful for inner city trucks and those aimed at highway trucks. Many of the aerodynamic benefits of flush side fairings that could be achieved on highway vehicle installations could potentially be detrimental to smaller and slower inner city vehicles. Similarly, many of the safety benefits that could be achieved with the addition of rail style side guards to inner city trucks would be detrimental to the drag coefficient of highway vehicles travelling at higher speeds. There is sufficient test data from other countries to conclude that flush side fairings/skirts on heavy vehicles improve aerodynamics via a reduction in the vehicle�’s coefficient of drag. The amount of the reduction in drag depends highly on the installation, the vehicle and the speed at which the vehicle is travelling. Regardless of safety issues, the use of flush side guards or belly fairings on highway transport trailers could reduce the volume of diesel fuel consumed every year. It is estimated that industry wide use of flush mount side skirts/fairings could result in a total savings of over 400 million litres of fuel every year in Canada, and a total reduction of CO2 of 1.1 million tonnes annually. Installing rail style side guards on highway trailers would be counter productive to other global initiatives that are currently aimed at reducing greenhouse gas emissions and fuel consumption. Since operators may have to pay for the devices and reduce payload by approximately 114 kg (250 lbs), the impact to their operations could be minimized if the devices were sufficiently aerodynamic to provide payback periods of two years or less. Attempts were made to predict the reduction in CO2 levels from traffic congestion if all trucks had side guards, thus reducing injury events requiring emergency vehicles and road closures. Since side guards may only alter the mode of incident or type of injury, it is impossible to predict if traffic slowdowns, and hence engine idling and CO2 production, would be reduced. More importantly, even if the amount could be predicted, it is clear that any reduction in CO2 as a result of fewer truck/VRU injury events would be insignificantly small compared to the total amount of CO2 released in Canada every year from motor vehicles.

viii CSTT-HVC-TR-158
National Research Council Canada Centre for Surface Transportation Technology
TABLE OF CONTENTS Table of Contents........................................................................................................................viii List of Figures ............................................................................................................................... x List of Tables................................................................................................................................ xi Acknowledgements......................................................................................................................xii 1 Introduction ........................................................................................................................... 1
1.1 Purpose......................................................................................................................... 1 1.2 Background ................................................................................................................... 1
2 Methodology.......................................................................................................................... 2 3 Jurisdictional Review............................................................................................................. 3
3.1 Current Regulations ...................................................................................................... 3 3.1.1 European Union ........................................................................................................3 3.1.2 Australia ....................................................................................................................5 3.1.3 Japan.........................................................................................................................6 3.1.4 Canada......................................................................................................................6 3.1.5 U.S. ...........................................................................................................................7
3.2 Types of Devices........................................................................................................... 8 3.2.1 Side Guard Design ....................................................................................................8 3.2.2 Vehicles.....................................................................................................................9 3.2.3 Materials and installation.........................................................................................12
3.3 Collision Statistics ....................................................................................................... 13 3.3.1 European Union ......................................................................................................13 3.3.2 Australia ..................................................................................................................16 3.3.3 Japan.......................................................................................................................17 3.3.4 Canada....................................................................................................................18 3.3.5 U.S. .........................................................................................................................27
3.4 Effectiveness............................................................................................................... 27 3.5 Conclusions of Literature Review................................................................................ 30
4 Vehicle Considerations ....................................................................................................... 33 4.1 Definitions....................................................................................................................33
4.1.1 Tare Weight.............................................................................................................33 4.1.2 Gross Vehicle Weight Rating ..................................................................................33 4.1.3 Gross Vehicle Weight..............................................................................................33 4.1.4 Straight Truck ..........................................................................................................33 4.1.5 Tractor .....................................................................................................................33 4.1.6 Fairing .....................................................................................................................33 4.1.7 CO2 production ........................................................................................................34 4.1.8 Drag and Coefficient of Drag...................................................................................34
4.2 Types of Add on Devices ............................................................................................ 35 4.2.1 Devices Designed Primarily to Reduce Aerodynamic Drag ....................................35 4.2.2 Devices Designed Primarily to Improve Safety .......................................................37
4.3 Variations in Fairing/Side Guard Design and Construction ......................................... 38 4.4 Implementation cost .................................................................................................... 40
4.4.1 Flush mount versus rail style...................................................................................41 4.5 Environmental benefits................................................................................................ 41
4.5.1 How fuel is consumed in a heavy truck ...................................................................41 4.6 Aerodynamics of Side Mounted Devices..................................................................... 42
4.6.1 Drag Coefficient.......................................................................................................43 4.7 Reduced idling due to reduction in collisions .............................................................. 44 4.8 Operator Considerations ............................................................................................. 44

CSTT-HVC-TR-158 ix
National Research Council Canada Centre for Surface Transportation Technology
4.8.1 Access to underbody equipment .............................................................................44 4.8.2 Brake Cooling..........................................................................................................45 4.8.3 Added tare weight to trailers and trucks ..................................................................45 4.8.4 Interference with self steer axles.............................................................................46 4.8.5 Collection of snow, ice, mud and debris..................................................................46 4.8.6 Break angle and Interference around Snow and Ice ...............................................47
4.9 Canadian Statistics...................................................................................................... 47 4.10 Cost benefit, fuel savings and CO2 emissions............................................................. 50 4.11 Fleet replacement and exceptions .............................................................................. 52 4.12 Other safety considerations......................................................................................... 53
5 Conclusions......................................................................................................................... 55 List of Acronyms/Abbreviations................................................................................................... 58 References.................................................................................................................................. 59
x CSTT-HVC-TR-158
National Research Council Canada Centre for Surface Transportation Technology
LIST OF FIGURES
Figure 1: R73 dimension requirements [3]....................................................................................5 Figure 2: Mercedes Atego 1218 (2002 model) .............................................................................8 Figure 3: Volvo FM9-260 (2002 model) ........................................................................................8 Figure 4: Scania tractor and semi-trailer (Japanese market) ........................................................9 Figure 5: Mercedes truck and semi-trailer ....................................................................................9 Figure 6: Volvo truck and semi-trailer .........................................................................................10 Figure 7: DAF CF 65.220 (2002 model)......................................................................................10 Figure 8: Example of bodywork that fulfills the sideguard regulation requirements [3] ...............11 Figure 9: Sideguards installed on a Canadian operated tanker trailer ........................................11 Figure 10: Close-up of a sideguard installed on a Canadian operated tanker trailer ..................12 Figure 11: Fatalities in the opponent party in truck accidents (2001) [19] ..................................15 Figure 12: Scenarios for collisions involving trucks and fatally and severely injured VRUs [21].16 Figure 13: Vehicle types involved in collisions which resulted in bicyclist fatalities, 1996-2000
[24] ......................................................................................................................................17 Figure 14: Accident caused by large trucks, Japan, 2005 [25] ...................................................17 Figure 15: City of Toronto fleet collision data, 2001-2005 [13] ...................................................25 Figure 16 - Canadian Motor Vehicle Fatalities, 2002-2006, all motor vehicles [14] ....................26 Figure 17: Summary of bicyclist casualties, UK, 1980-1982 and 1990-1992 [12] ......................28 Figure 18: Bicyclist injury distribution from specific collisions, UK, 1980-1982 and 1990-1992
[12] ......................................................................................................................................29 Figure 19: HGV models equipped with rail type (left) and smooth (right) sideguards [12]..........29 Figure 20: Future vehicle design for improved VRU safety [27] .................................................32 Figure 21: Various drag coefficients ...........................................................................................34 Figure 22: Examples of aerodynamic add on devices ................................................................35 Figure 23: Example of belly fairing..............................................................................................36 Figure 24: Example of gap fairing mounted to van semi-trailer ..................................................36 Figure 25: Examples of boat tails................................................................................................37 Figure 26: Example of rear underride guard ...............................................................................38 Figure 27: Example of rigid, gapped, flush fairing.......................................................................39 Figure 28: Example of rigid, continuous, flush fairing/side guard ...............................................39 Figure 29: Example of low rider fairing .......................................................................................43 Figure 30: Example of complete aero package ..........................................................................43 Figure 31: Breakdown of distance traveled by truck type ...........................................................50 Figure 32: Fuel consumption by type of vehicle..........................................................................50 Figure 33: Example of gap in combination vehicles....................................................................53

CSTT-HVC-TR-158 xi
National Research Council Canada Centre for Surface Transportation Technology
LIST OF TABLES
Table 1: Annual number of bicycle fatalities by country, 1997-2006 [15]....................................13 Table 2: Annual number of pedestrian fatalities by country, 1997-2006 [15]..............................14 Table 3: Bicyclist casualties, Canada, 2004-2006 [38] ...............................................................18 Table 4: Pedestrian casualties, Canada, 2004-2006 [38] ...........................................................18 Table 5: Bicyclist casualties in bicycle-heavy vehicle urban collisions, Canada, 2004-2006 [38]
............................................................................................................................................18 Table 6: Bicyclist casualties in bicycle-heavy vehicle urban collisions by roadway configuration,
Canada, 2004-2006 [38] .....................................................................................................19 Table 7: Bicyclist casualties in bicycle - heavy vehicle urban collisions by heavy vehicle type, .19 Table 8: Bicyclist casualties in bicycle - heavy vehicle urban collisions by heavy vehicle
manoeuvre, Canada, 2004-2006 [38] .................................................................................20 Table 9: Bicyclist casualties in bicycle - heavy vehicle urban collisions by first impact location on
heavy vehicle, Canada, 2004-2006 [38]..............................................................................21 Table 10: Pedestrian casualties in pedestrian�–heavy vehicle urban collisions,..........................22 Table 11: Pedestrian casualties in pedestrian - heavy vehicle urban collisions by roadway
configuration, Canada, 2004-2006 [38]...............................................................................22 Table 12: Pedestrian casualties in pedestrian - heavy vehicle urban collisions by heavy vehicle
type, Canada, 2004-2006 [38].............................................................................................23 Table 13: Pedestrian casualties in pedestrian - heavy vehicle urban collisions by heavy vehicle
manoeuvre, Canada, 2004-2006 [38] .................................................................................23 Table 14: Pedestrian casualties in pedestrian - heavy vehicle urban collisions by first impact
location on heavy vehicle, Canada, 2004-2006 [38] ...........................................................24 Table 15: Bicyclists and pedestrians killed in urban collisions with heavy vehicles, Canada,
2004-2006...........................................................................................................................26 Table 16: US fatalities, heavy truck-VRU collisions, 2005-2007.................................................27 Table 17: Average bicyclist and pedestrian fatalities, all motor vehicles, selected data.............31 Table 18: Cost of rigid side guards for heavy commercial vehicles and articulated heavy
commercial vehicles............................................................................................................40 Table 19: Distribution of power consumption at various speeds.................................................42 Table 20: Vehicle classifications .................................................................................................47 Table 21: Estimates of number of vehicles in scope for Canada by vehicle body type ..............48 Table 22: Estimates of vehicle-km by vehicle class, type of fuel and body type.........................49 Table 23: Estimates of fuel consumed by vehicle class, type of fuel and body type...................49 Table 24: Vehicle-kilometers driven by type of vehicle ...............................................................49 Table 25: Estimated fuel savings ................................................................................................51 Table 26: Average service life for various types of equipment ...................................................52 Table 27: Results from operation Air Brake in Ontario ...............................................................52
xii CSTT-HVC-TR-158
National Research Council Canada Centre for Surface Transportation Technology
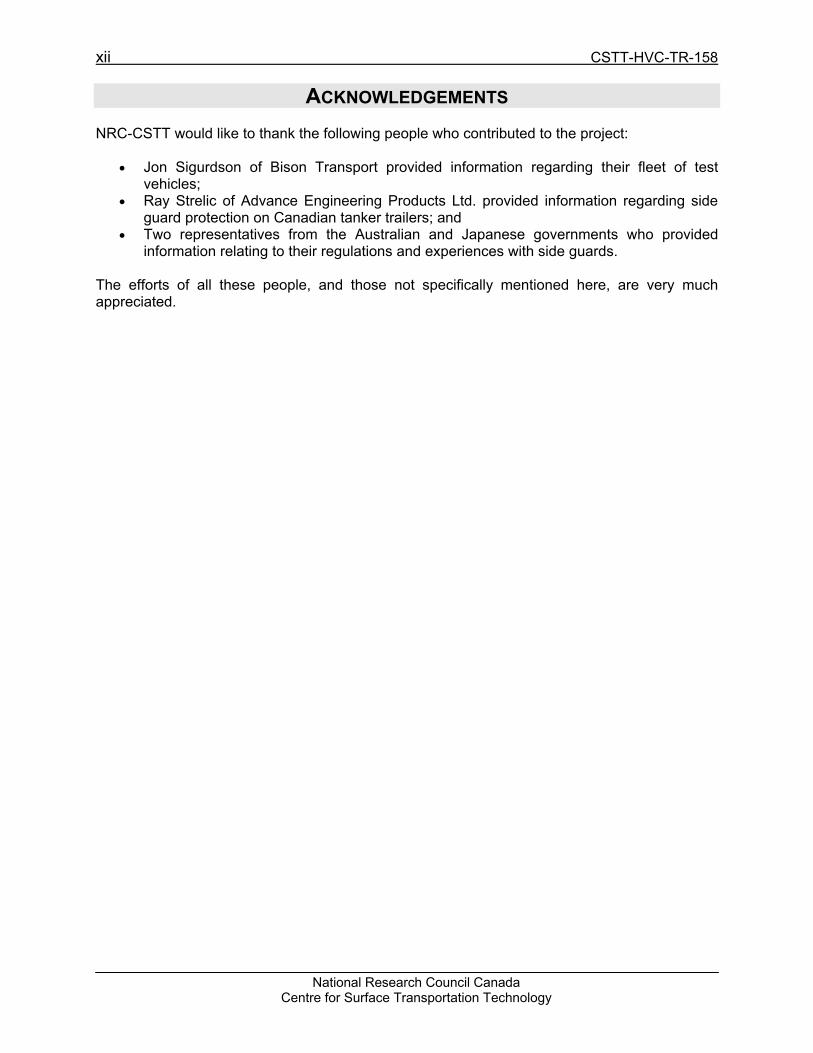
ACKNOWLEDGEMENTS NRC-CSTT would like to thank the following people who contributed to the project:
Jon Sigurdson of Bison Transport provided information regarding their fleet of test vehicles;
Ray Strelic of Advance Engineering Products Ltd. provided information regarding side guard protection on Canadian tanker trailers; and
Two representatives from the Australian and Japanese governments who provided information relating to their regulations and experiences with side guards.
The efforts of all these people, and those not specifically mentioned here, are very much appreciated.

CSTT-HVC-TR-158 1
National Research Council Canada Centre for Surface Transportation Technology
1 INTRODUCTION 1.1 Purpose The purpose of this study is to understand the state of heavy vehicle side guards in Europe, Australia and Japan and to better understand how side guards would affect Canadian heavy vehicle operators and protect vulnerable road users (VRU). It is also of interest to understand the environmental effects of installing side guards on vehicles.
1.2 Background Vehicle side guards (also referred to as �“lateral protective�” and �“side underrun protection�” devices) are intended to provide protection to vulnerable road users (VRUs) such as pedestrians and cyclists, and in some instances motorcyclists, against the risk of falling under the sides of the vehicle and being caught under the wheels. Side guards have been legislated on certain motor vehicles, trailers and semi-trailers in various countries in the EU and Japan. Additionally, certain flush side fairings (also known as side skirts) may provide environmental benefit through improved fuel efficiency over a range of operating points, based on the reduction of aerodynamic drag on certain types of vehicles Transport Canada wished to undertake an investigative study of the feasibility of requiring protective side guards on large trucks and trailers operated in urban Canadian environments and also to understand any environmental benefits of flush side fairings.

2 CSTT-HVC-TR-158
National Research Council Canada Centre for Surface Transportation Technology
2 METHODOLOGY NRC-CSTT performed a background investigation and data collection exercise on side guard use in Europe, Japan, Australia and North America. A multi-faceted approach was used, employing a thorough web-based search and review of publicly available information. The background investigation and data collection exercise was conducted with three specific goals: to produce a synopsis of present side guard regulation and use in order to identify any
safety related issues; to understand vehicle and operator considerations and any environmental effects; and to determine how side guard use is evolving in order to produce a forward-looking image of
the future of side guard use in Canada. During the data collection exercise, emphasis was placed on a number of factors, which included: crash data/statistics involving heavy trucks and pedestrians/cyclists; overall effectiveness; environmental effects; the technical and physical characteristics of side guards that might affect fitment to vehicles;
and other safety issues, such as passive and active collision avoidance systems.
The data was then reviewed and combined with testimonials and experiences from operators who have used the devices to formulate a list of challenges and requirements that may be faced if side guards were implemented in Canada either as a voluntary measure or as a regulation. In addition to safety related aspects, the aerodynamic effects of flush mount side guards were also considered.
CSTT-HVC-TR-158 3
National Research Council Canada Centre for Surface Transportation Technology
3 JURISDICTIONAL REVIEW A jurisdictional study was conducted through web-based literature review. The review focused on the European Union (EU) and Japan, where side underrun protection device regulations have been adopted for over 15 years. Information was also gathered from Australia who has considered introducing such regulations. Collision and statistical transportation data from Canada and the United States were also considered. The purpose of the review was to determine:
The current usage of side guards �– types of devices used (including material types, design, attachment mechanisms) and the types of vehicles on which they are used;
Reported effectiveness of side guards �– including collision statistics, where available; Lessons learned from jurisdictions that have legislated the use of these devices; and The effectiveness of low side skirts on city buses in the prevention of side underride.
3.1 Current Regulations Side underrun protection device (SUPD) regulations currently exist in EU member countries and Japan. While the main purpose of the SUPD regulations is clearly stated [1], the technical requirements differ slightly among different countries. The current regulations, along with specific requirements for each jurisdiction, are presented in the following sections.
3.1.1 European Union
3.1.1.1 Legislative framework In the EU, directives represent legislative acts that have an obligatory character for the member countries. The directives require member countries to achieve certain results without imposing the means through which these results should be achieved. EU regulations are determined based on international consultations by the United Nations (UN) Economic Commission for Europe (ECE). These ECE regulations contain mainly technical requirements and are often adopted by the EU directives. Council Directive 89/297/EEC, adopted on April 13, 1989, defines the legal framework for lateral protection (side guards) for certain motor vehicles and their trailers [1]. ECE Regulation No. 73 defines the uniform provisions concerning the approval of goods vehicles, trailers and semi-trailers with regard to their lateral protection [2]. The directive�’s text clearly defines the purpose for adopting such an act: �“vehicle of categories N2, N3, O3 and O4 shall be so constructed and/or equipped as to offer, when a complete entity, effective protection to unprotected road users (pedestrians, cyclists, motorcyclists) against the risk of falling under the sides of the vehicle and being caught under the wheels�”.

4 CSTT-HVC-TR-158
National Research Council Canada Centre for Surface Transportation Technology
3.1.1.2 Applicability and Technical Requirements The original Council Directive 89/297 applied to the following classes of vehicles: Vehicles for the carriage of goods: N2 (trucks with a gross vehicle weight [GVW] between
3.5 and 12 tonnes) and N3 (trucks with a GVW over 12 tonnes); and O3 (trailers with a GVW between 3.5 and 10 tonnes) and O4 (trailers with a GVW over 10
tonnes). The Directive did not apply to: tractors for semi-trailers; trailers specially designed and constructed for the carriage of very long loads of indivisible
length, such as timber, steel bars, etc.; and vehicles designed and constructed for special purposes where it is not possible, for practical
reasons, to fit such lateral protection. It should be noted that Regulation No. 73 was amended in 2008 (E/ECE/324, E/ECE/TRANS/505, Rev.1/Add.72/Amend.1) to read: This Regulation applies to complete vehicles of categories N2, N3, O3 and O4 with regard to the lateral protection. It does not apply to: (a) tractors for semi-trailers; (b) vehicles designed and constructed for special purposes where it is not possible, for practical reasons, to fit such lateral protection. Therefore trailers specially designed and constructed for the carriage of very long loads of indivisible length are now required to comply with Regulation No. 73. The technical requirements are identified in Regulation No. 73 and include dimensions (e.g. the guard cannot be more than 550 mm above the ground), shapes, testing conditions, attachment methods and certain exceptions. The side guards can consist of a flat panel or of one or more side rails. If rails are used, the spacing is defined for different categories of vehicles. The side guards shall be essentially rigid and be able to withstand a horizontal static force of load of 1 kN applied at any point along the guard. Figure 1 shows a few requirements of the regulation.

CSTT-HVC-TR-158 5
National Research Council Canada Centre for Surface Transportation Technology
Figure 1: R73 dimension requirements [3]
The regulation addresses uncommon types of vehicles, such as extendible trailers, tank-vehicles, vehicles equipped with extendible legs or anchorage points for roll-on/roll-off transport and specifies a different set of requirements for each of these types. In addition, the regulation mentions that �“if the sides of the vehicle are so designed and/or equipped that by their shape and characteristics the component parts together meet the requirements of paragraph 7, they may be regarded as replacing the sideguards�”. Each EU member country can impose further exemptions for vehicles which do not have to comply with side guard regulations. For example, UK regulations provide exemptions for approximately 20% of its heavy vehicles, including side and end tipping vehicles and trailers, naval, military and airforce vehicles, refuse trucks and vehicles designed solely for street cleansing [4].
3.1.2 Australia Australia does not have a regulation for SUPDs on heavy vehicles. The Australian Government has examined the case for regulating Underrun Protection (UP) on heavy vehicles through the Australian Design Rules (ADRs). It was proposed that an ADR be developed that adopts the international standard UNECE R 93 for front underrun protection devices (FUPD) for rigid and articulated heavy vehicles with a Gross Vehicle Mass (GVM) greater than 7.5 tonnes. A Regulation Impact Statement was issued in 2007 [7] for public comment, and a regulation is expected to be in place this year and come into effect by late 2010. It was recommended that SUPDs not be adopted. Australian collision statistics showed that out of the total number of underrun collisions involving heavy vehicles, about 75% of the fatalities occurred as a result of a frontal impact, 10% of a result of rear impact and only a couple of fatalities per year from side impact. The cost was another deciding factor to not recommend the adoption of SUPDs in Australia.

6 CSTT-HVC-TR-158
National Research Council Canada Centre for Surface Transportation Technology
3.1.3 Japan Japan has a general policy to promote the international harmonization of vehicle regulations; however, currently Japan has not decided when and how UNECE R 73 will be introduced [28]. Current side guard regulations in Japan are outlined in two documents: Safety Regulations for Road Vehicle (Ministerial Ordinance) and its subordinate regulation (Announcement) [9]. These documents refer to side guards as Pedestrian Protecting Side Guards. The Ministerial Ordinance mentions in Article 18-2 that �“Ordinary-sized motor vehicles used for the transport of goods or ordinary-sized motor vehicle with a gross vehicle weight of 8 tons or more (except motor vehicles with a passenger capacity of 11 persons or more and motor vehicles having a shape similar to the motor vehicles with a passenger capacity of 11 persons or more) shall be provided, on the both sides, with pedestrian protecting side guards which comply with the requirements prescribed in the Announcement in connection with the strength, shape, etc. so that they are rigid and they are able to effectively prevent pedestrians, bicycle riders, etc. from being caught by the rear wheels of the motor vehicles. However, this provision shall not apply to motor vehicles having a structure stipulated by the Announcement as the one with which pedestrians, bicycle rider, etc., are not likely to be caught by the rear wheels of the motor vehicles.�” With regards to dimensions and shapes, the regulations require that: The pedestrian protection side guard shall be mounted so that, in the unloaded state, the
height of its lower edge is 450 mm or less above the ground and the height of its upper edge is 650 mm or more above the ground.
The pedestrian protection side guard shall be mounted so that the distance between the upper edge of the pedestrian protection side guard and the loading platform, etc. may effectively prevent pedestrians, bicycle riders, etc. from being caught under the rear wheels of the motor vehicle. In this case, pedestrian protection side guards that are mounted in such a way that the distance between the upper edge of the flat section thereof and the loading platform, etc. is 550 mm or less shall be regarded as complying with this requirement.
3.1.4 Canada Under the Motor Vehicle Safety Act, Transport Canada develops, maintains and enforces the Canada Motor Vehicle Safety Regulations. All new and imported vehicles sold in Canada must comply with the Regulations. These Regulations are performance-based to ensure a minimum level of safety for vehicles sold in Canada, and are aimed at making vehicles safer for road users in Canada.
While manufacturers and importers must certify that their vehicles sold in Canada meet the regulations safety requirements, provincial and territorial governments, through their respective highway traffic acts, are responsible for establishing regulations and enforcement strategies for road use, vehicle and driver licensing, as well as operation and maintenance of vehicles. While side guards are regulated in Europe, there are currently no federal requirements to equip heavy trucks and trailers with side guards in Canada. Such side guards are intended to provide protection to vulnerable road users, such as pedestrians and cyclists, against the risk of falling under the sides of the vehicle and being caught under the wheels. Many factors need to be
CSTT-HVC-TR-158 7
National Research Council Canada Centre for Surface Transportation Technology
considered in order to evaluate if such requirements would be effective in Canada and North America. Truck travel patterns in North America are different than in Europe, and a number of trucks are operating in both Canada and United States. Transport Canada would therefore need to determine which type of trucks and trailers would benefit from side guards, and Transport Canada would need to align its requirements with trading partners. Furthermore, while side guards may provide environmental benefits on certain types of vehicles that operate on highways at higher speeds, it may be discriminating to certain vehicles that operate at lower speed in urban areas because of the added weight. In addition, effectiveness of side guards for Canada and operational aspects must be assessed, such as maintenance issues, implementation costs, and operation in Canadian winter conditions, as for example, ice build-up on the guards. Nevertheless, because of the potential benefits to reduce collisions between vulnerable road users and large vehicles, this study, which is financed by Transport Canada, is aimed at evaluating the feasibility of requiring side guards on large trucks and trailers operated in urban Canadian environments. As well, environmental benefits or impact that may result from such guards are also evaluated. Another study carried out by the Transportation Association of Canada (TAC), and in collaboration with Transport Canada, is in the process of being published. The scope of this project is to quantify the magnitude and characteristics of the problem regarding collisions between vulnerable road users and commercial vehicles in selected major Canadian urban areas by analyzing collision reports. It will also identify any solutions that are already available or have been implemented in other jurisdictions in order to reduce these types of collisions.
3.1.5 U.S. There is no regulation for SUPDs on heavy vehicles in the US. However, there have been a number of initiatives across the country to introduce legislation for enhanced protection of vulnerable road users (VRU). For example, Bill 17-981 known as the �“Bicycle Safety Enhancement Act of 2008�” was introduced in October 2008 in the District of Columbia [5], requiring that all District-owned heavy duty vehicles be equipped with blind spot mirrors, reflective blind spot warning signs and side underrun guards to prevent bicyclists, other vehicles or pedestrians from sliding under the rear wheels. A DC Council document [6] explained that funds are not sufficient in the FY 2009 through 2012 to implement the requirement to equip all District-owned heavy duty vehicles with side-underrun guards.

8 CSTT-HVC-TR-158
National Research Council Canada Centre for Surface Transportation Technology
3.2 Types of Devices
3.2.1 Side Guard Design The types of devices used vary among jurisdictions. Typically, the side guards are designed, built and installed by vehicle manufacturers or third party parts suppliers. The literature reviewed presented two types of side guards [10]: Mercedes-Benz Atego side guard: articulated device, allowing rotation about the longitudinal
axis for opening/closing, as shown in Figure 2. Test data showed a maximum permanent deformation of 16mm for a 1kN load applied to the various guard positions.
Figure 2: Mercedes Atego 1218 (2002 model)
Volvo side guard: double rail guard constructed from aluminum extruded section as shown
in Figure 3, with a pivot mechanism for opening/closing.
Figure 3: Volvo FM9-260 (2002 model)

CSTT-HVC-TR-158 9
National Research Council Canada Centre for Surface Transportation Technology
While current side underrun protection devices fall into one of the two categories mentioned in the EU regulations, rail type or smooth type, there have been numerous European studies that recommended several design improvements for side guards. For example, the European Advanced Protection Systems (APROSYS) group sub-project titled �“Project Strategies for Enhanced Pedestrian and Cyclist Friendly Design, AP-SP21-0062�” [11], recommended, among other measures, improvements such as all-surrounding-skirt and side guard systems that sense the initial impact and automatically brake the vehicle.
3.2.2 Vehicles In general, sideguard regulations in the EU and Japan apply to heavy vehicles and trailers with a GVW greater than 3.5 tonnes. The typical vehicles are straight trucks and tractor-trailer combinations. Typical designs are rail type and smooth type, shown in Figure 4, Figure 5, Figure 6 and Figure 7.
Figure 4: Scania tractor and semi-trailer (Japanese market)
Figure 5: Mercedes truck and semi-trailer
10 CSTT-HVC-TR-158
National Research Council Canada Centre for Surface Transportation Technology
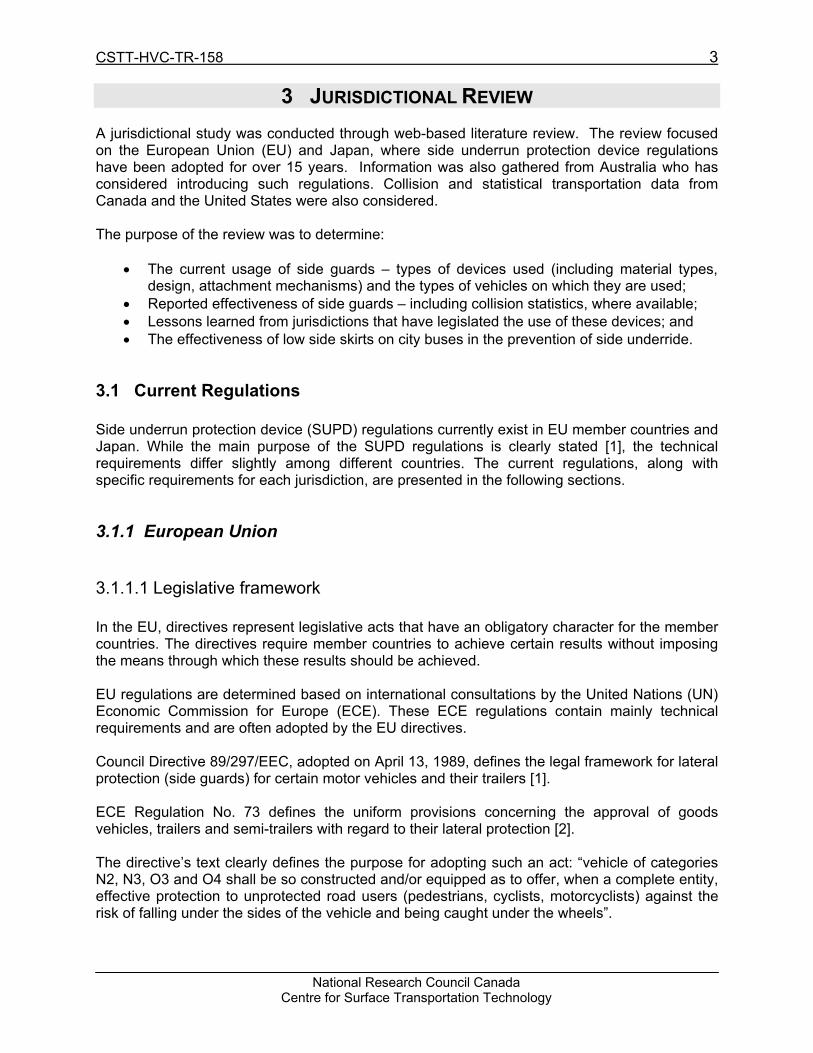
Figure 6: Volvo truck and semi-trailer
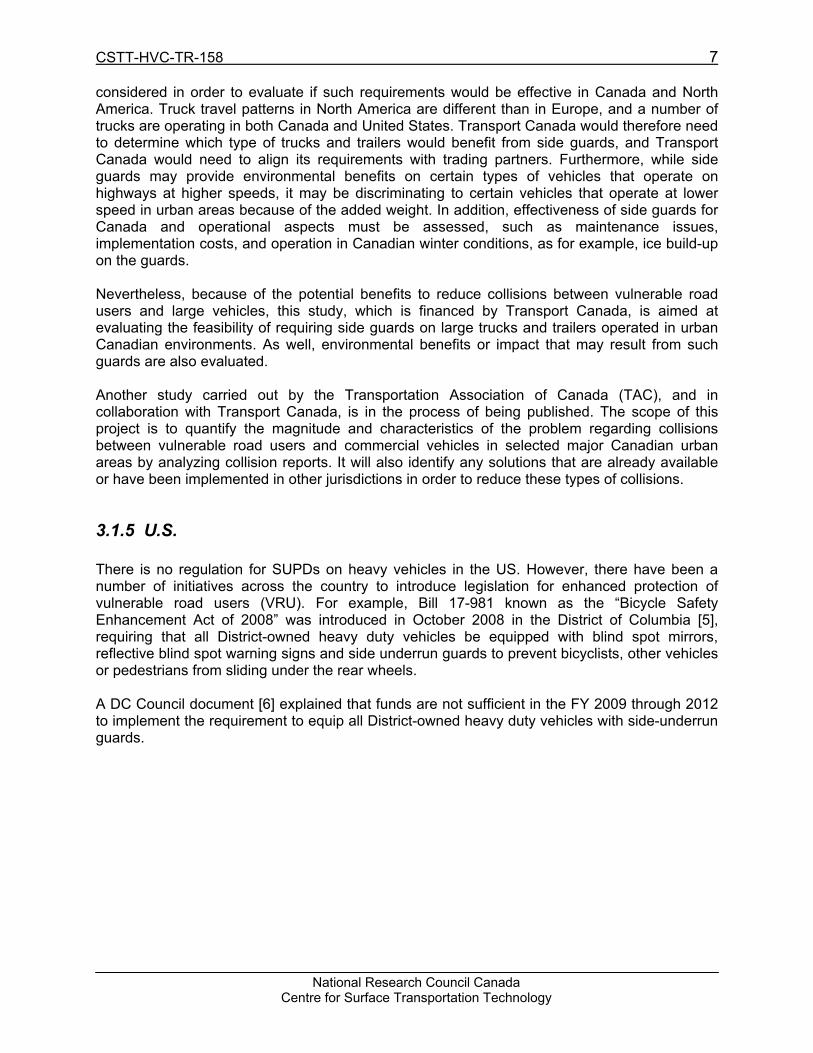
Figure 7: DAF CF 65.220 (2002 model)
Buses are not required to comply with Regulation 73 in EU. The reason is that buses meet the R 73 requirements due to their normal bodywork. The ground clearance of most European and North American city buses is approximately 14 in (355 mm). Other vehicles, such as the straight truck in Figure 8, comply with the regulations due to their inherent design, in this case under- slung storage compartments.

CSTT-HVC-TR-158 11
National Research Council Canada Centre for Surface Transportation Technology
Figure 8: Example of bodywork that fulfills the sideguard regulation requirements [3]
It should be noted that although Canada has no sideguard regulations for heavy trucks, some operators have elected to voluntarily install some form of protection devices on their tank trailers. For example, Exxon requires that all vehicles used for the transport of goods have side underrun protection. This is a worldwide requirement for all vehicles used for transport at Exxon and it is mainly aimed at protecting bicyclist and pedestrians from becoming caught under the wheels. The company calls for �“best design and installation�”, requiring a minimum of 16 to 18 inches (40 cm) of ground clearance and advises the truck owners/operators to consult local and national highway regulations for legal clearance guidelines. Such devices, installed on Canadian vehicles are shown in Figure 9 and Figure 10.
Figure 9: Sideguards installed on a Canadian operated tanker trailer

12 CSTT-HVC-TR-158
National Research Council Canada Centre for Surface Transportation Technology
Figure 10: Close-up of a sideguard installed on a Canadian operated tanker trailer
3.2.3 Materials and installation The most commonly used materials for manufacturing side guards are steel and aluminum. A study conducted by the Transport Research Laboratory (TRL) in UK [12], looked at the feasibility of using alternative materials for side guards and took into account the weight, strength, cost and recyclability of side guards built from such materials. The materials considered by the study were: Steel Aluminum alloys Magnesium alloys Titanium alloys Glass fibre reinforced plastic (GFRP) Carbon fiber reinforced plastic (CFRP)
The purpose was to determine whether or not alternative materials could be used in the construction of side guards in order to reduce the weight penalty and minimize the costs to industry due to reduced productivity. While certain benefits were highlighted for alternative materials, such as light weight, the overall finding was that these materials provided few benefits for such an application and therefore are not a viable option. Side guards are typically installed as a �“bolt-on�” addition. The side guards can be fixed or hinged, depending on the application. Hinged side guards typically pivot about their upper edges to allow the vehicle operators to access vehicle components located underneath the vehicle while the guards are propped in the raised position. The operator is then responsible to lower and lock the guard into position before the vehicle may be driven.

CSTT-HVC-TR-158 13
National Research Council Canada Centre for Surface Transportation Technology
3.3 Collision Statistics The nature of collision reporting dictated that very few side underride collision statistics were identified in the literature review. Collision statistics mainly identified the total number of bicycle and pedestrian fatalities due to an incident involving a heavy vehicle. These data are nonetheless presented as a means to quantify the gross number of collisions.
3.3.1 European Union A 2008 European Road Safety Observatory (ERSO) report [15] based on data obtained from the Community database on Accidents on the Roads in Europe (CARE/EC) shows that in 2006 bicyclist fatalities represented 4.8% of the total number of fatalities in EU-14 and pedestrian fatalities represented 14.4% of the same number. The same ERSO report shows detailed figures about bicyclist fatalities by country between 1997 and 2006 for EU-14, as illustrated in Table 1 and Table 2. In total, 1,188 bicyclists were killed as a result of collisions with motor vehicles in 2006 in the EU-14.
Table 1: Annual number of bicycle fatalities by country, 1997-2006 [15]
Source: CARE Database / EC (Date of query: August 2008) ¹ Using latest data available, i.e. 2006 for all countries except LU (2002), IE and NL (2003), IT (2004), PL (2005) and UK (2006 for GB, 2005 for NI). ² The data from CZ, EE, HU, MT and PL are not considered

14 CSTT-HVC-TR-158
National Research Council Canada Centre for Surface Transportation Technology
The same ERSO report shows detailed figures about pedestrian fatalities by country between 1997 and 2007 for EU-14, as illustrated in Table 2. In total, 3,547 pedestrians were killed as a result of collisions with motor vehicles in 2006 in the EU-14.
Table 2: Annual number of pedestrian fatalities by country, 1997-2006 [15]
Source: CARE Database / EC (Date of query: August 2008) ¹ Using latest data available, i.e. 2006 for all countries except LU (2002), IE and NL (2003), IT (2004), PL (2005) and UK (2006 for GB, 2005 for NI). ² The data from CZ, EE, HU, MT and PL are not considered A report published by the European Commission�’s Transport Road Safety department, based on CARE data, showed that in 2007, the number of bicycle fatalities in UK was 136, or approximately 4.6% of the total number of fatalities which resulted from collisions with all motor vehicles [18]. The number of pedestrian fatalities in the same year was 646, or approximately 22%. The same report showed data for other EU countries. The Netherlands recorded 145 bicyclist fatalities or 20% of the total number of fatalities which resulted from collisions with all motor vehicles. Pedestrian casualties made up for 8% of the total number of fatalities, for a total of 55. Several European studies analyzed the collisions between heavy vehicles and vulnerable road users. One of these studies, titled �“National Statistics Update with Respect to Front, Side and Rear Underrun of Trucks�”, part of the VC-COMPAT program, looked at collision data from six countries: France, Germany, Netherlands, United Kingdom, Spain and Sweden [19]. Only trucks with a GVW greater than 3.5 tons were considered. The analysis was carried out for collisions that occurred from 1995 to 2001, with a special emphasis on 2001 collisions. It can be seen in Figure 11 that the majority of fatalities resulting from collisions with trucks occurred in passenger

CSTT-HVC-TR-158 15
National Research Council Canada Centre for Surface Transportation Technology
cars. Pedestrian casualties represented the second biggest share followed by motorized two-wheel vehicles and bicycles.
Figure 11: Fatalities in the opponent party in truck accidents (2001) [19]
An APROSYS project report, titled �“Characteristics of Heavy Trucks versus Pedestrians and/or Cyclists�” [20] performed an analysis of national and in-depth statistic data for truck-bicyclist and truck-pedestrian collisions that occurred between 1985 and 2003 in five countries: France, Germany, Netherlands, Spain and United Kingdom. This report presented, among others, UK collision data, which showed that in 2002, the collisions between trucks and bicyclists resulted in 18 fatalities and 904 injuries and the truck-pedestrian collisions resulted in 30 fatalities and 1,882 injuries. The same APROSYS report estimated the initial point of contact in collisions between trucks and bicyclists and pedestrians, based on 2001 German data provided by the automotive consultant company DEKRA: The area of the right corner represented the initial point of contact in 47% of the truck-
bicyclist collisions analyzed. The area of the front-left corner was first impacted in 9% of the collisions. The area behind the cabin was impacted by bicyclists in 13% of the cases; and
The front area represented the initial point of contact in 52% of the truck-pedestrian
collisions analyzed. The area of the right-corner was first impacted in 35% of these collisions. The area behind the cabin was impacted by pedestrians in 9% of the cases.
A 2004 report [21] prepared by the Heavy Duty Vehicles eSafety Working Group, presented collision data analyzed by Volvo (Sweden), CIDAUT (Spain), DEKRA (Germany) and IVECO (Italy) which pertained to collisions between trucks and VRUs. The scenarios for collisions between trucks and fatally or severely injured VRUs are shown in Figure 12. It can be seen that in at least 50% of the cases, the initial point of impact was the front or the rear of the vehicle. This report included in the VRU category bicyclists, pedestrians and motorcyclists.

16 CSTT-HVC-TR-158
National Research Council Canada Centre for Surface Transportation Technology
Figure 12: Scenarios for collisions involving trucks and fatally and severely injured VRUs [21]
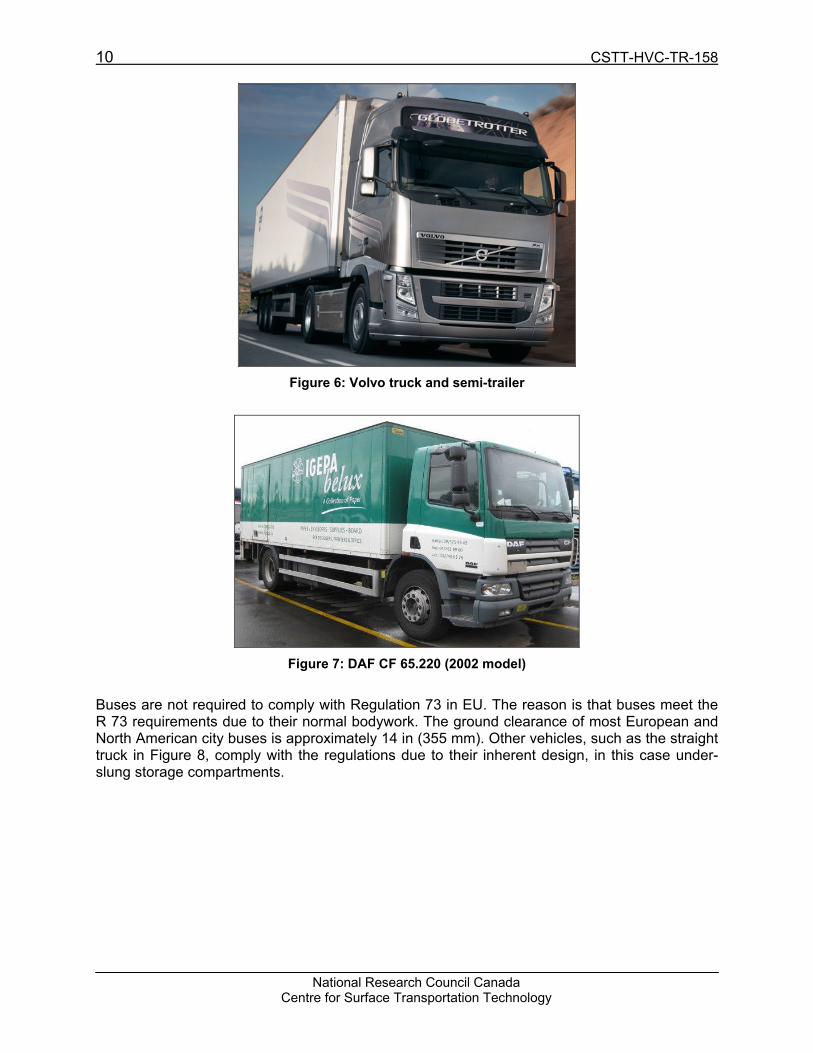
3.3.2 Australia Australian collision data were collected from the �“Road Deaths Australia: 2007 Statistical Summary�” report [23] and the Australian Transport Safety Bureau (ATSB) �“Road Safety Report, Deaths of cyclists due to road crashes�” [24]. The 2006-2007 data [23] shows that the number of bicyclist fatalities that resulted from collisions with all motor vehicles, was on average 40/year, or approximately 2.5% of the total number of motor vehicle collision fatalities per year. The number of pedestrian fatalities that resulted from collisions with all motor vehicles was on average 214/year, or approximately 13% of the total number of fatalities per year. Figure 13 shows the proportions of each vehicle type in collisions which resulted in bicyclist fatalities between 1996 and 2000. It can be seen that articulated and rigid trucks accounted for 33% of the vehicle types.
CSTT-HVC-TR-158 17
National Research Council Canada Centre for Surface Transportation Technology
Figure 13: Vehicle types involved in collisions which resulted in bicyclist fatalities, 1996-2000 [24]
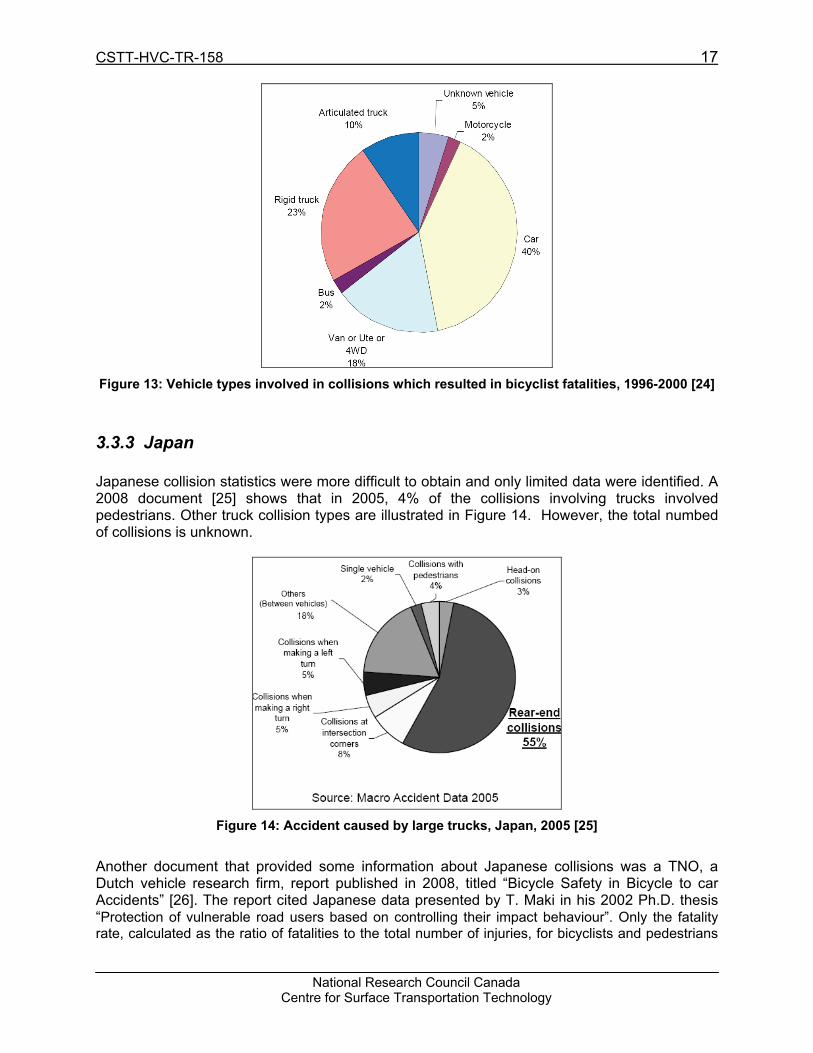
3.3.3 Japan Japanese collision statistics were more difficult to obtain and only limited data were identified. A 2008 document [25] shows that in 2005, 4% of the collisions involving trucks involved pedestrians. Other truck collision types are illustrated in Figure 14. However, the total numbed of collisions is unknown.
Figure 14: Accident caused by large trucks, Japan, 2005 [25]
Another document that provided some information about Japanese collisions was a TNO, a Dutch vehicle research firm, report published in 2008, titled �“Bicycle Safety in Bicycle to car Accidents�” [26]. The report cited Japanese data presented by T. Maki in his 2002 Ph.D. thesis �“Protection of vulnerable road users based on controlling their impact behaviour�”. Only the fatality rate, calculated as the ratio of fatalities to the total number of injuries, for bicyclists and pedestrians

18 CSTT-HVC-TR-158
National Research Council Canada Centre for Surface Transportation Technology
was presented. The fatality rate for pedestrians was calculated to be 3.1% and that for bicyclists 0.75%.
3.3.4 Canada Canadian data on urban collisions involving vulnerable road users and heavy vehicles was provided by Transport Canada. These data were extracted from the National Collision Database (NCDB) and covered the years from 2004 to 2006 for all Provinces except Manitoba. The analysis was limited to fatal and injury collisions only and considered only bicyclist-heavy vehicle and pedestrian-heavy vehicle urban collisions. The bicyclist and pedestrian casualties which resulted from collisions with all motor vehicles from 2004 to 2006 are presented in Table 3 and Table 4.
Table 3: Bicyclist casualties, Canada, 2004-2006 [38]
Year Killed Injured Total 2004 56 7,817 7,873 2005 52 7,687 7,739 2006 73 7,230 7,303 Total 181 22,734 22,915
Table 4: Pedestrian casualties, Canada, 2004-2006 [38]
Year Killed Injured Total 2004 363 12,316 12,679 2005 344 12,918 13,262 2006 382 12,960 13,342 Total 1,089 38,194 39,283
3.3.4.1 Bicyclist-heavy vehicle urban collisions data The bicyclist-heavy vehicle analysis was based on 492 casualties, which resulted from urban collisions. These collisions involved only one bicycle and one heavy vehicle. Collisions involving other vehicle types or pedestrians, collisions involving multiple bicycles and collisions involving multiple heavy vehicles were not taken into consideration. Of the 492 bicycle-heavy vehicle casualties analyzed, 24 resulted in bicyclist fatalities (4.9%) and 468 resulted in bicyclist injuries (95.1%), as shown in Table 5.
Table 5: Bicyclist casualties in bicycle-heavy vehicle urban collisions, Canada, 2004-2006 [38]
Year Killed Injured Total 2004 7 160 167 2005 7 151 158 2006 10 157 167 Total 24 468 492

CSTT-HVC-TR-158 19
National Research Council Canada Centre for Surface Transportation Technology
Table 6 shows bicyclist casualties resulted from bicycle-heavy vehicle urban collisions, by roadway configuration.
Table 6: Bicyclist casualties in bicycle-heavy vehicle urban collisions by roadway configuration, Canada, 2004-2006 [38]
Roadway Configuration Killed Injured Total Percent
killed Percent injured
Percent of total
Non-intersection 8 136 144 34.8% 31.8% 31.9% Intersection with Public Road 14 255 269 60.9% 59.6% 59.6%
Intersection with Private Road 1 22 23 4.3% 5.1% 5.1%
Railroad crossing 0 1 1 0.0% 0.2% 0.2% Bridge 0 6 6 0.0% 1.4% 1.3% Underpass 0 1 1 0.0% 0.2% 0.2% Ramp 0 1 1 0.0% 0.2% 0.2% Other 0 6 6 0.0% 1.4% 1.3% Sub-total 23 428 451 100% 100% 100% Unknown* 1 40 41 Total 24 468 492 *Unknown roadway configuration (missing data)
Overall, 60.9% of all bicyclist fatalities occurred at intersections with public roads. The majority of bicyclist injuries (59.6%) also occurred at intersections with public roads. Table 7 shows bicyclist casualties which resulted from bicycle-heavy vehicle urban collisions, by heavy vehicle type.
Table 7: Bicyclist casualties in bicycle - heavy vehicle urban collisions by heavy vehicle type,
Canada, 2004-2006 [38]
Heavy Vehicle Type Killed Injured Total Percent killed
Percent injured
Percent of total
Unit Truck > 4,536 kg 10 247 257 41.7 52.8 52.2 Truck Tractor 11 62 73 45.8 13.2 14.8 School Bus 0 43 43 0.0 9.2 8.7 Bus - Urban 2 96 98 8.3 20.5 19.9 Bus - Intercity 1 20 21 4.2 4.3 4.3 Total 24 468 492 100 100 100
As shown in Table 7, 45.8% of bicyclist fatalities resulted from collisions involving truck tractors. In addition, a significant number of bicyclists were killed as a result of collisions with unit trucks

20 CSTT-HVC-TR-158
National Research Council Canada Centre for Surface Transportation Technology
with a GVWR greater than 4,536 kg (10,000 lb). The majority of bicyclist injuries (52.8%) occurred as a result of collisions with unit trucks. Table 8 shows bicyclist casualties which resulted from bicycle-heavy vehicle urban collisions, by heavy vehicle manoeuvre.
Table 8: Bicyclist casualties in bicycle - heavy vehicle urban collisions by heavy vehicle manoeuvre, Canada, 2004-2006 [38]
Heavy Vehicle Manoeuvre Killed Injured Total Percent
killed Percent injured
Percent of total
Straight Ahead 9 189 198 39.1% 47.1% 46.7% Left Turn 2 38 40 8.7% 9.5% 9.4% Right Turn 9 109 118 39.1% 27.2% 27.8% Changing Lanes 1 6 7 4.3% 1.5% 1.7% Merge 0 3 3 0.0% 0.7% 0.7% Reverse 2 3 5 8.7% 0.7% 1.2% Passing 0 18 18 0.0% 4.5% 4.2%
Slowing/Stopping in Traffic 0 14 14 0.0% 3.5% 3.3%
Start in Traffic 0 2 2 0.0% 0.5% 0.5% Leave Roadside 0 6 6 0.0% 1.5% 1.4% Stopped/Parked Legally 0 5 5 0.0% 1.2% 1.2%
Swerve 0 1 1 0.0% 0.2% 0.2% Other 0 7 7 0.0% 1.7% 1.7% Sub-Total 23 401 424 100% 100% 100% Unspec.* 0 1 1 Not Provided** 1 66 67 Total 24 468 492 *Unspecified manoeuvre **Alberta does not provide vehicle manoeuvre
Approximately 39.1% of the bicyclist fatalities resulted from collisions where the heavy vehicle was traveling straight ahead just before the collision occurred. In addition, approximately 39.1% of the bicyclist fatalities resulted from collisions where the heavy vehicle was turning right just before the collision occurred. Approximately 47.1% of bicyclist injuries resulted from collisions where the heavy vehicle was traveling straight ahead just before the collision occurred.
CSTT-HVC-TR-158 21
National Research Council Canada Centre for Surface Transportation Technology
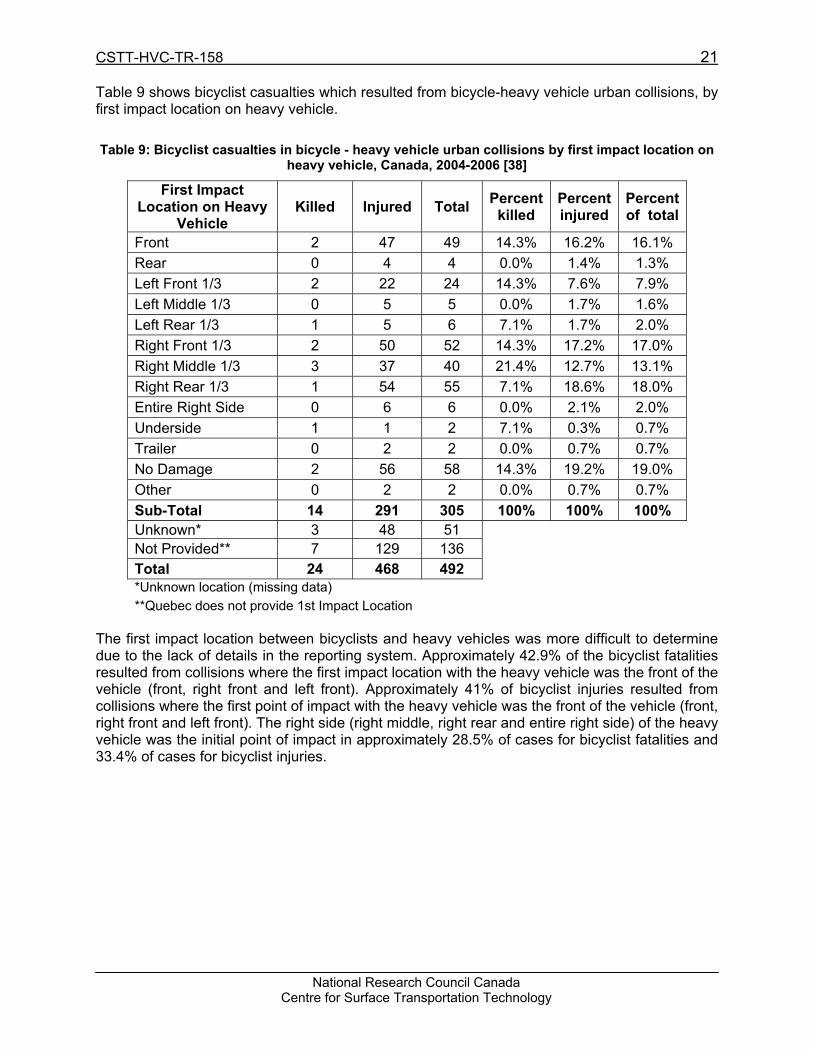
Table 9 shows bicyclist casualties which resulted from bicycle-heavy vehicle urban collisions, by first impact location on heavy vehicle. Table 9: Bicyclist casualties in bicycle - heavy vehicle urban collisions by first impact location on
heavy vehicle, Canada, 2004-2006 [38]
First Impact Location on Heavy
Vehicle Killed Injured Total Percent
killed Percent injured
Percent of total
Front 2 47 49 14.3% 16.2% 16.1% Rear 0 4 4 0.0% 1.4% 1.3% Left Front 1/3 2 22 24 14.3% 7.6% 7.9% Left Middle 1/3 0 5 5 0.0% 1.7% 1.6% Left Rear 1/3 1 5 6 7.1% 1.7% 2.0% Right Front 1/3 2 50 52 14.3% 17.2% 17.0% Right Middle 1/3 3 37 40 21.4% 12.7% 13.1% Right Rear 1/3 1 54 55 7.1% 18.6% 18.0% Entire Right Side 0 6 6 0.0% 2.1% 2.0% Underside 1 1 2 7.1% 0.3% 0.7% Trailer 0 2 2 0.0% 0.7% 0.7% No Damage 2 56 58 14.3% 19.2% 19.0% Other 0 2 2 0.0% 0.7% 0.7% Sub-Total 14 291 305 100% 100% 100% Unknown* 3 48 51 Not Provided** 7 129 136 Total 24 468 492 *Unknown location (missing data) **Quebec does not provide 1st Impact Location
The first impact location between bicyclists and heavy vehicles was more difficult to determine due to the lack of details in the reporting system. Approximately 42.9% of the bicyclist fatalities resulted from collisions where the first impact location with the heavy vehicle was the front of the vehicle (front, right front and left front). Approximately 41% of bicyclist injuries resulted from collisions where the first point of impact with the heavy vehicle was the front of the vehicle (front, right front and left front). The right side (right middle, right rear and entire right side) of the heavy vehicle was the initial point of impact in approximately 28.5% of cases for bicyclist fatalities and 33.4% of cases for bicyclist injuries.

22 CSTT-HVC-TR-158
National Research Council Canada Centre for Surface Transportation Technology
3.3.4.2 Pedestrian-heavy vehicle urban collisions data The pedestrian-heavy vehicle analysis was based on 1,019 urban casualties, which resulted from urban collisions. These collisions involved only one pedestrian and one heavy vehicle. Collisions involving other vehicle types and collisions involving multiple heavy vehicles were not taken into consideration. The 1,019 pedestrian-heavy vehicle urban casualties analyzed resulted in 77 pedestrian fatalities (7.6%) and 942 pedestrian injuries (92.4%) as shown in Table 10.
Table 10: Pedestrian casualties in pedestrian�–heavy vehicle urban collisions,
Canada, 2004-2006 [38]
Year Killed Injured Total 2004 28 275 303 2005 23 374 397 2006 26 293 319 Total 77 942 1,019
Table 11 shows pedestrian casualties resulted from pedestrian-heavy vehicle urban collisions, by roadway configuration.
Table 11: Pedestrian casualties in pedestrian - heavy vehicle urban collisions by roadway configuration, Canada, 2004-2006 [38]
Roadway Configuration Killed Injured Total Percent
killed Percent injured
Percent of total
Non-intersection 23 269 292 31.1% 31.1% 31.1%
Intersection with Public Road 33 459 492 44.6% 53.0% 52.3%
Intersection with Private Road 5 40 45 6.8% 4.6% 4.8%
Railroad crossing 0 3 3 0.0% 0.3% 0.3% Bridge 1 3 4 1.4% 0.3% 0.4% Ramp 0 2 2 0.0% 0.2% 0.2% Other 12 90 102 16.2% 10.4% 10.9% Sub-Total 74 866 940 100% 100% 100% Unknown* 3 76 79 Total 77 942 1019 * Unknown roadway configuration (missing data)
Overall, 44.6% of all pedestrian fatalities occurred at intersections with public roads. The majority of pedestrian injuries (53%) also occurred at intersections with public roads.
CSTT-HVC-TR-158 23
National Research Council Canada Centre for Surface Transportation Technology
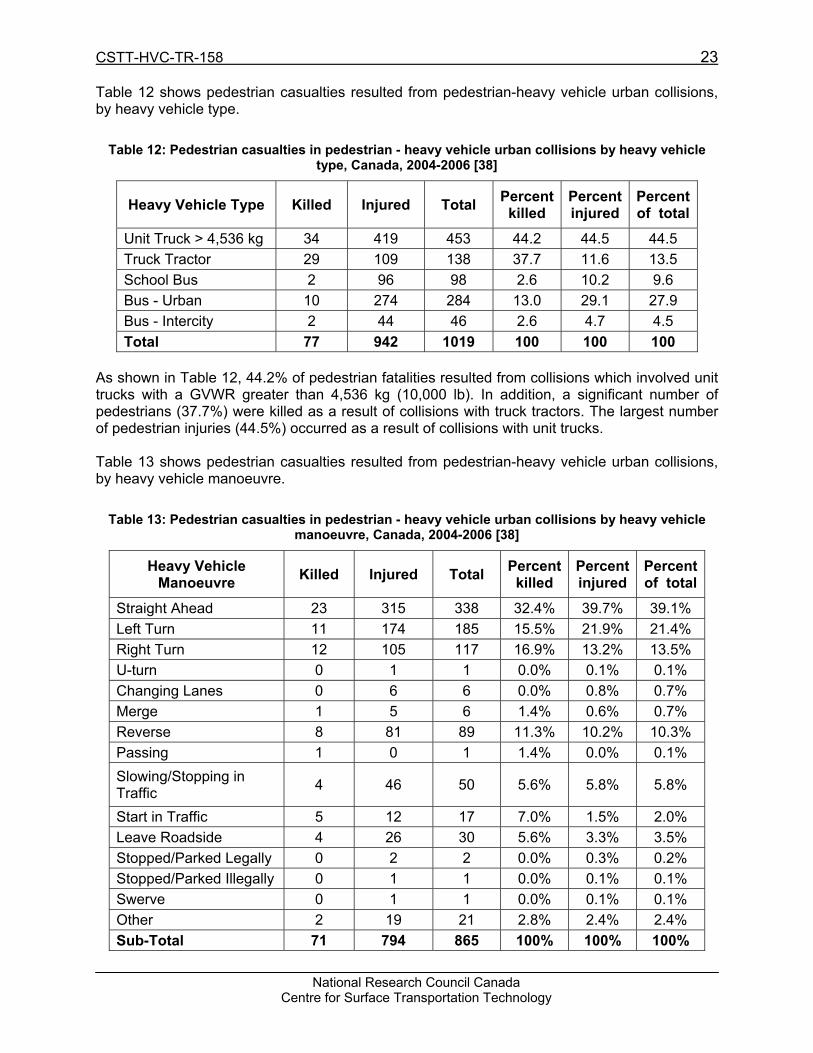
Table 12 shows pedestrian casualties resulted from pedestrian-heavy vehicle urban collisions, by heavy vehicle type.
Table 12: Pedestrian casualties in pedestrian - heavy vehicle urban collisions by heavy vehicle type, Canada, 2004-2006 [38]
Heavy Vehicle Type Killed Injured Total Percent killed
Percent injured
Percent of total
Unit Truck > 4,536 kg 34 419 453 44.2 44.5 44.5 Truck Tractor 29 109 138 37.7 11.6 13.5 School Bus 2 96 98 2.6 10.2 9.6 Bus - Urban 10 274 284 13.0 29.1 27.9 Bus - Intercity 2 44 46 2.6 4.7 4.5 Total 77 942 1019 100 100 100
As shown in Table 12, 44.2% of pedestrian fatalities resulted from collisions which involved unit trucks with a GVWR greater than 4,536 kg (10,000 lb). In addition, a significant number of pedestrians (37.7%) were killed as a result of collisions with truck tractors. The largest number of pedestrian injuries (44.5%) occurred as a result of collisions with unit trucks. Table 13 shows pedestrian casualties resulted from pedestrian-heavy vehicle urban collisions, by heavy vehicle manoeuvre.
Table 13: Pedestrian casualties in pedestrian - heavy vehicle urban collisions by heavy vehicle manoeuvre, Canada, 2004-2006 [38]
Heavy Vehicle Manoeuvre Killed Injured Total Percent
killed Percent injured
Percent of total
Straight Ahead 23 315 338 32.4% 39.7% 39.1% Left Turn 11 174 185 15.5% 21.9% 21.4% Right Turn 12 105 117 16.9% 13.2% 13.5% U-turn 0 1 1 0.0% 0.1% 0.1% Changing Lanes 0 6 6 0.0% 0.8% 0.7% Merge 1 5 6 1.4% 0.6% 0.7% Reverse 8 81 89 11.3% 10.2% 10.3% Passing 1 0 1 1.4% 0.0% 0.1% Slowing/Stopping in Traffic 4 46 50 5.6% 5.8% 5.8%
Start in Traffic 5 12 17 7.0% 1.5% 2.0% Leave Roadside 4 26 30 5.6% 3.3% 3.5% Stopped/Parked Legally 0 2 2 0.0% 0.3% 0.2% Stopped/Parked Illegally 0 1 1 0.0% 0.1% 0.1% Swerve 0 1 1 0.0% 0.1% 0.1% Other 2 19 21 2.8% 2.4% 2.4% Sub-Total 71 794 865 100% 100% 100%

24 CSTT-HVC-TR-158
National Research Council Canada Centre for Surface Transportation Technology
Unspec.* 0 1 1 Unknown* 0 13 13 Not Provided** 6 134 140 Total 77 942 1019 * Unspecified and unknown manoeuvre (missing data) ** Alberta does not provide vehicle manoeuver
Approximately 32.4% of the pedestrian fatalities resulted from collisions where the heavy vehicle was traveling straight ahead just before the collision occurred, while approximately 16.9% of the pedestrian fatalities resulted from collisions where the heavy vehicle was turning right just before the collision occurred. Approximately 39.7% of pedestrian injuries resulted from collisions where the heavy vehicle was traveling straight ahead just before the collision occurred. Table 14 shows pedestrian casualties resulted from pedestrian-heavy vehicle urban collisions, by first impact location on heavy vehicle.
Table 14: Pedestrian casualties in pedestrian - heavy vehicle urban collisions by first impact location on heavy vehicle, Canada, 2004-2006 [38]
First Impact Location on Heavy
Vehicle Killed Injured Total Percent
killed Percent injured
Percent of total
Front 10 113 123 20.8% 19.5% 19.6% Roof 0 3 3 0.0% 0.5% 0.5% Rear 2 18 20 4.2% 3.1% 3.2% Left Front 1/3 2 67 69 4.2% 11.6% 11.0% Left Middle 1/3 1 11 12 2.1% 1.9% 1.9% Left Rear 1/3 0 10 10 0.0% 1.7% 1.6% Entire Left Side 1 2 3 2.1% 0.3% 0.5% Right Front 1/3 10 111 121 20.8% 19.1% 19.3% Right Middle 1/3 1 46 47 2.1% 7.9% 7.5% Right Rear 1/3 2 37 39 4.2% 6.4% 6.2% Entire Right Side 0 2 2 0.0% 0.3% 0.3% Underside 0 4 4 0.0% 0.7% 0.6% Trailer 2 8 10 4.2% 1.4% 1.6% No Damage 16 137 153 33.3% 23.6% 24.4% Not Applic. 0 4 4 0.0% 0.7% 0.6% Other 1 7 8 2.1% 1.2% 1.3% Sub-Total 48 580 628 100% 100% 100% Unknown * 4 96 100 Not Provided** 25 266 291 Total 77 942 1019 * Unknown location (missing data) **Quebec does not provide 1st Impact Location

CSTT-HVC-TR-158 25
National Research Council Canada Centre for Surface Transportation Technology
The first impact location between pedestrians and heavy vehicles was more difficult to determine due to the lack of details in the reporting system. Approximately 45.8% of the pedestrian fatalities resulted from collisions where the first impact location with the heavy vehicle was the front of the vehicle (front, right front and left front). Approximately 50.2% of pedestrian injuries resulted from collisions where the first point of impact with the heavy vehicle was the front of the vehicle (front, right front and left front). The right side of the heavy vehicle (right middle, right rear and entire right side) was the initial point of impact in approximately 6.3% of cases for pedestrian fatalities and 14.6% of cases for pedestrian injuries.
3.3.4.3 Other Canadian data A 2006 report from the City of Toronto [13] presented details about collisions involving city fleet trucks and cyclists and pedestrians between 2001 and 2003, as shown in Figure 15. The city fleet consisted of approximately 1,070 mid-size to large trucks, of which 356 were garbage trucks, 423 dump trucks, 56 utility trucks, 50 tractor-trailers, 40 crane-trucks, 26 aerial trucks and 19 street flushers.
Figure 15: City of Toronto fleet collision data, 2001-2005 [13]
The report shows that �“side guards would not have provided any benefit in two of these collisions. In one collision the cyclist rear-ended the truck and in another, the pedestrian was struck by the front of the truck. In the other two collisions it is not clear that side guards would have reduced the severity of injuries. Both of these collisions resulted in minor injuries. One collision involved a cyclist side-wiped by a truck and the other involved a pedestrian struck by a right-turning truck.�” Canadian collision data collected by Transport Canada in cooperation with the Canadian Council of Motor Transport Administrators (CCMTA) shows that the number of bicyclist fatalities which resulted from collisions with all motor vehicles was on average 60/year, or approximately 2% of the total number of road fatalities per year. The number of pedestrian fatalities which resulted from collisions with all motor vehicles was on average 366/year, or approximately 13% of the total number of motor vehicle collision fatalities per year. Detailed figures for years 2002 through 2006 are shown in Figure 16.

26 CSTT-HVC-TR-158
National Research Council Canada Centre for Surface Transportation Technology
Figure 16 - Canadian Motor Vehicle Fatalities, 2002-2006, all motor vehicles [14]
Based on the data presented in Table 5 and Table 10, the percentage of bicyclists and pedestrians killed in urban collisions with heavy vehicles with respect to the number road users killed as a result of collisions with all motor vehicles was calculated and it is shown in Table 15. Table 15: Bicyclists and pedestrians killed in urban collisions with heavy vehicles, Canada, 2004-
2006
Year Bicyclists Pedestrians 2004 7 (0.26%) 28 (1.02%) 2005 7 (0.24%) 23 (0.78%) 2006 10 (0.34%) 26 (0.87%)
Average 8 (0.28%) 26 (0.89%)

CSTT-HVC-TR-158 27
National Research Council Canada Centre for Surface Transportation Technology
3.3.5 U.S. US collision data were extracted from the Fatality Analysis Reporting System (FARS) on-line database [22]. The 2005-2007 data shows that the number of bicyclist fatalities that resulted from collisions with all motor vehicles, was on average 752/year, or approximately 1.8% of the total number of road user fatalities per year. The number of pedestrian fatalities that resulted from collisions with all motor vehicles was on average 4,331/year, or approximately 10% of the total number of motor vehicle collision fatalities per year. In addition, data were extracted for the same years for collisions which involved heavy vehicles and VRUs. Detailed figures of the analysis are shown in Table 16. It can be seen that bicyclist fatalities which resulted from collisions with heavy vehicles represented approximately 10% (75 vs. 752) of the bicyclist fatalities which resulted from collisions with all motor vehicles between 2005 and 2007. Pedestrian fatalities which resulted from collisions with heavy vehicles represented approximately 6% (263 vs. 4,331) of the pedestrian fatalities which resulted from collisions with all motor vehicles between 2005 and 2007.
Table 16: US fatalities, heavy truck-VRU collisions, 2005-2007
Initial Point of Impact Bicyclists Pedestrians
Front end 36/year (48.5%) 188/year (71.6%)
Right side 17/year (22.5%) 21/year (7.9%)
Left side 6/year (7.7%) 6/year (2.2%)
Rear end 8/year (10.7%) 25/year (9.5%)
Unknown 8/year (10.6%) 23/year (8.8%)
TOTAL 75/year 263/year
3.4 Effectiveness The lack of side specific underride collision data makes it difficult to evaluate the effectiveness of SUPDs. However, one UK study was identified in the literature review which addressed the effectiveness issue. A 2005 UK report titled �“Integrated Safety Guards and Spray Suppression�” evaluated the benefits of improving current sideguards [12]. The authors looked at the potential benefits generated by a smooth surface design and a lower ground clearance than current EU regulations. The evaluation was carried out using two methods: collision data analysis and computer simulation. In order to establish a baseline for future predictions of benefits, a collision data analysis was performed based on data from three distinct UK sources: Road Accidents Statistics (STATS19 Returns), Heavy Vehicle Crash Injury Study (HVCIS) and Truck Crash Injury Study (TCIS). Data

28 CSTT-HVC-TR-158
National Research Council Canada Centre for Surface Transportation Technology
from before the introduction of sideguards were compared with data from ten years later, when sideguards would have been installed on the majority of the UK fleet. The data in Figure 17 were extracted from that report and shows the distribution of injury severity for bicyclist involved in all types of collision with a Heavy Goods Vehicle (HGV). In addition, the data in the table shows how the distribution has changed.
Figure 17: Summary of bicyclist casualties, UK, 1980-1982 and 1990-1992 [12]
Data in Figure 17 shows that the number of fatally and seriously injured bicyclists in collisions with HGVs decreased, which suggests that there have been improvements in secondary safety during that period. It can be seen that the total number of injured bicyclists after the sideguards were introduced decreased by 18.7%. It is well understood that sideguards are primarily designed to protect VRUs in a very specific type of accident, when a VRU falls against the side of a moving heavy vehicle in the area between the wheels. Unfortunately, such collisions could not be identified from UK collision data. To account for such collisions, the authors of the report extracted collision data where both the bicyclist and HGV were going straight ahead in the same direction and the initial point of impact was to the nearside of the HGV. Data for this specific type of collisions is shown in Figure 18.

CSTT-HVC-TR-158 29
National Research Council Canada Centre for Surface Transportation Technology
Figure 18: Bicyclist injury distribution from specific collisions, UK, 1980-1982 and 1990-1992 [12]
The reduction in the number of killed and seriously injured (KSI) bicyclists is substantial: 61% reduction for the fatally injured and 12.8% reduction for the seriously injured bicyclist. The large reduction in the number of KSI bicyclists suggests that the introduction of sideguards has provided substantial benefits to the bicyclists involved in �“going ahead�” collisions with HGV, where the initial point of impact was the nearside of the HGV. The authors noted that in other studied manoeuvres, the proportion of KSI bicyclist was virtually unchanged before and after the introduction of sideguards. This suggests that sideguards are effective for only the specific type of collision previously mentioned. For the cases where pedestrians and HGVs were involved, for the �“going ahead�” type of accident, a reduction of 20% was noted for the fatally injured pedestrians when sideguards were installed, but no reduction was observed for seriously injured pedestrians. The computer simulation of the study took into consideration the specific type of collision where a bicyclist or pedestrian falls against the side of a HGV moving in a straight line and equipped with either traditional rail type or smooth integrated sideguards, as shown in Figure 19.
Figure 19: HGV models equipped with rail type (left) and smooth (right) sideguards [12]
30 CSTT-HVC-TR-158
National Research Council Canada Centre for Surface Transportation Technology
The loads transmitted to, and the injury criteria sustained by bicyclists and pedestrians during the simulations were compared for the two vehicles. The simulation results showed that: The traditional rail type design was effective at preventing the upper body of vulnerable road
users from being run over by the rear wheels; however, the results also showed that the VRUs can still sustain severe injuries which could be fatal, particularly head injuries resulting from contact with the ground; and
For the model representing a VRU and an HGV fitted with smooth integrated sideguards,
the general finding was that the VRU fell close to the moving HGV, which provided a greater potential for the upper VRU model appendages to fall under the sideguard and be crushed by the trailer wheels.
The analysis of national collision data of the UK report provided considerable evidence to support the simulation findings with regards to the effectiveness of current sideguards for HGV-bicyclist collisions. The report showed that while there are benefits to refining the design of current sideguards, these estimated benefits are small in comparison with those obtained by introducing sideguard regulations: �“It was found, through computer simulation and accident analysis that using a flat panel sideguard reduced the forces applied to vulnerable road users that collided with the side of an HGV. This reduction in forces was predicted to translate to a reduction in the number of pedal cyclists killed of between 0.2 and 1.5 per year with serious injuries reduced by 3.9 per year and slight injuries increased by 17.5 per year. It was also predicted that pedestrians may benefit from the changes with a predicted reduction of between 0 and 2.91 fatalities per year. Using DfT casualty cost figures (RAGB, 2001) this translates to a financial benefit of between £0.581 million and £5.609 million per year.�” The benefits arising from ending vehicle exemptions included in current regulations was also evaluated. Based on STATS19 data, the authors predicted that approximately two VRU fatalities per year can be prevented if vehicle exemptions are eliminated. In UK, approximately 20% of HGV are exempted from sideguard regulations due to various clauses contained in the regulations.
3.5 Conclusions of Literature Review Sideguard legislation for heavy vehicles was introduced in the EU 20 years ago with the specific purpose of protecting VRUs such as bicyclists and pedestrians from falling under the wheels and being run over by the wheels; similar legislation exists in Japan. Australia has contemplated the possibility of requiring sideguards for heavy vehicles, but based on collision statistics and implementation costs it could not justify this requirement. Canada and U.S. have no legislation regarding sideguards on heavy vehicles but there has been an increased interest in evaluating the benefits and drawbacks of considering legislation similar to the one that exists in the EU. Even though sideguard legislation exists in many countries, a large number of heavy vehicles are still exempted from its requirements. There are many heavy vehicles which cannot have sideguards installed, due to their specific operational requirements. For example, it is estimated that in UK approximately 20% of the heavy vehicles are exempted. Such a situation will likely occur in other jurisdictions, based on the fleet characteristics. In North America for example, the

CSTT-HVC-TR-158 31
National Research Council Canada Centre for Surface Transportation Technology
number of snow ploughs is significant and the diversity of these trucks will require careful consideration regarding sideguard design and installation. Few changes have been made to sideguard regulation requirements in the past 20 years. Numerous studies related to various heavy vehicle systems, including sideguards, have been undertaken and several recommendations have been made so that effectiveness of the sideguards is improved. One of the recommendations was to lower the height of the sideguards. However, understanding the effects of such modifications requires extensive analysis so that the new designs do not interfere with the operation of the vehicles. It is anticipated that a lower sideguard will improve the protection of VRUs involved in collisions with heavy vehicles. However, the lower the sideguard, the more likely it is that it will affect the operation of such vehicles. A known issue in Canada is certain rural rail crossings, where some heavy vehicles equipped with rear guards encountered difficulties in the past. The sideguard design falls into two categories: rail type and smooth type. Each has its advantages and drawbacks and considering the operating environment is a key requirement for evaluating the best alternative in terms of strength, aerodynamic and material characteristics. While collision data have been collected from different jurisdictions, a direct comparison cannot be performed due to significant differences, such as structural (country size, density and quality of the road network, population, etc) and socio-economic differences (vehicle composition, user behaviour, etc.) and road users composition (number of bicyclists, pedestrians, mopeds, etc.). Nonetheless, the collected data clearly shows a much higher fatality rate for bicyclists in the EU, as presented in Table 17.
Table 17: Average bicyclist and pedestrian fatalities, all motor vehicles, selected data
Bicyclists Pedestrians Comments
Canada 60/year (2%) 366/year (13%) 2002-2006, all motor vehicles
USA 752/year (1.8%) 4,331/year (10.2%) 2005-2007, all motor vehicles
Australia 40/year (2.5%) 214/year (13.3%) 2006-2007, all motor vehicles
EU-14 1,204/year (4.7%) 3,661/year (14.1%) 2004-2006, all motor vehicles
While data for collisions involving heavy vehicles and VRUs are often difficult to obtain, Canadian data provided by Transport Canada [38] showed that between 2004 and 2006, the number of bicyclist fatalities that resulted from heavy vehicle-bicyclist urban collisions represented on average 13% of the total number of bicyclist fatalities resulted from heavy vehicle-bicyclist collisions and approximately 0.28% of the total number of road user fatalities. Similarly, the number of pedestrian fatalities that resulted from heavy vehicle-pedestrian urban collisions represented on average 7% of the total number of pedestrian fatalities resulted from heavy vehicle-pedestrian collisions and approximately 0.9% of the total number of road user fatalities. In urban collisions involving heavy vehicles, bicyclists and pedestrians, the front of the heavy vehicle (front, right front and left front) was the initial point of impact: in 42.9% of the cases for

32 CSTT-HVC-TR-158
National Research Council Canada Centre for Surface Transportation Technology
bicyclist fatalities and 45.8% of the cases for pedestrian fatalities. The right side of the heavy vehicle (right middle, right rear and entire right side) was the initial point of impact in approximately 28.5% of cases for bicyclist fatalities and 6.3% of cases for pedestrian fatalities. U.S. data obtained from FARS showed that between 2005 and 2007 the number of bicyclist fatalities that resulted from heavy vehicle-bicyclist collisions represented on average 10% of the total number of bicyclist fatalities resulted from all motor vehicle-bicyclist collisions and approximately 0.18% of the total number of road user fatalities. Similarly, the number of pedestrian fatalities that resulted from heavy vehicle-pedestrian collisions represented on average 6% of the total number of pedestrian fatalities resulted from heavy vehicle-pedestrian collisions and approximately 0.62% of the total number of road user fatalities. The front of the vehicle was the initial point of impact in 48.5% of the cases for bicyclist fatalities and 71.6% of the cases for pedestrian fatalities. The right side of the vehicle was the initial point of impact in approximately 22.5% of cases for bicyclist fatalities and 7.9% of cases for pedestrian fatalities. Details regarding the exact location of the impact of the right side were not available. The effectiveness of the sideguards on heavy vehicles has been demonstrated by a UK study, which showed significant reductions in the number of bicyclist fatalities from before the sideguards were introduced to after the sideguards were introduced. The study was performed using UK data and the extrapolation of the results may not be appropriate. The general consensus is that sideguards are only part of the solution for improving the safety of VRUs in collisions with heavy vehicles. Numerous other measures have been proposed for improving the safety of VRUs involved in collisions with such vehicles. Some of these measures, presented at an APROSYS workshop in 2008, are illustrated in Figure 20.
Figure 20: Future vehicle design for improved VRU safety [27]

CSTT-HVC-TR-158 33
National Research Council Canada Centre for Surface Transportation Technology
4 VEHICLE CONSIDERATIONS Section 3 defined how side guards were conceived, designed and installed in Europe and Japan and presents some collision statistics relating to heavy vehicles and VRUs. Section 4 outlines the possible effects to Canadian truck and trailer operators and to VRUs if side guard devices were fitted to trailers and straight trucks in Canada.
4.1 Definitions
4.1.1 Tare Weight The empty weight of a container or trailer.
4.1.2 Gross Vehicle Weight Rating The gross vehicle weight rating (GVWR) is the is the maximum allowable total weight of a road vehicle or trailer when loaded including the weight of the vehicle itself plus fuel, passengers, cargo, and any trailer tongue weight.
4.1.3 Gross Vehicle Weight The gross vehicle weight (GVW) is the actual weight of a truck, trailer, or tractor including the tare weight and the weight of the fuel, passengers, cargo and any added tongue load.
4.1.4 Straight Truck Vehicle which carries cargo in a body mounted to its chassis, rather than on a trailer towed by the vehicle.
4.1.5 Tractor The tractor, or power unit, is the towing vehicle in a combination vehicle. It generally does not have any inherent cargo carrying capacity.
4.1.6 Fairing An accessory mounted to the body of a vehicle or aircraft designed to reduce aerodynamic drag.

34 CSTT-HVC-TR-158
National Research Council Canada Centre for Surface Transportation Technology
4.1.7 CO2 production Engine and exhaust after-treatment manufacturers use many methods to reduce the levels of pollutants that are released from a diesel powered vehicle�’s tailpipe. All but one of the major pollutants can be reduced by using combinations of exhaust gas re-circulation (EGR), variable geometry turbo chargers, catalysers, selective catalytic reduction (SCR), alternate fuels, particulate traps and computer controlled engine management that alter timing and combustion temperatures. However, the only way to reduce the amount of CO2 from an engine�’s exhaust stream is to reduce the amount of fuel burned in that engine or to change the type/grade of fuel being burned in that engine. An engine burning conventional diesel fuel will produce approximately 2.73 kg of CO2 for every litre of fuel burned. There is no amount of catalysing or engine management that can reduce CO2 production.
4.1.8 Drag and Coefficient of Drag All vehicles have an inherent drag coefficient (CD). This is a unitless number that describes the amount of aerodynamic drag caused by fluid flow over any body. More streamlined bodies have lower CD, whereas more blunt bodies have higher CD. Figure 21, taken from Scania trucks, illustrates some examples of CD. It is estimated that every reduction of 0.02 in CD provides a 1% fuel consumption savings for highway transport vehicles [29].
Figure 21: Various drag coefficients
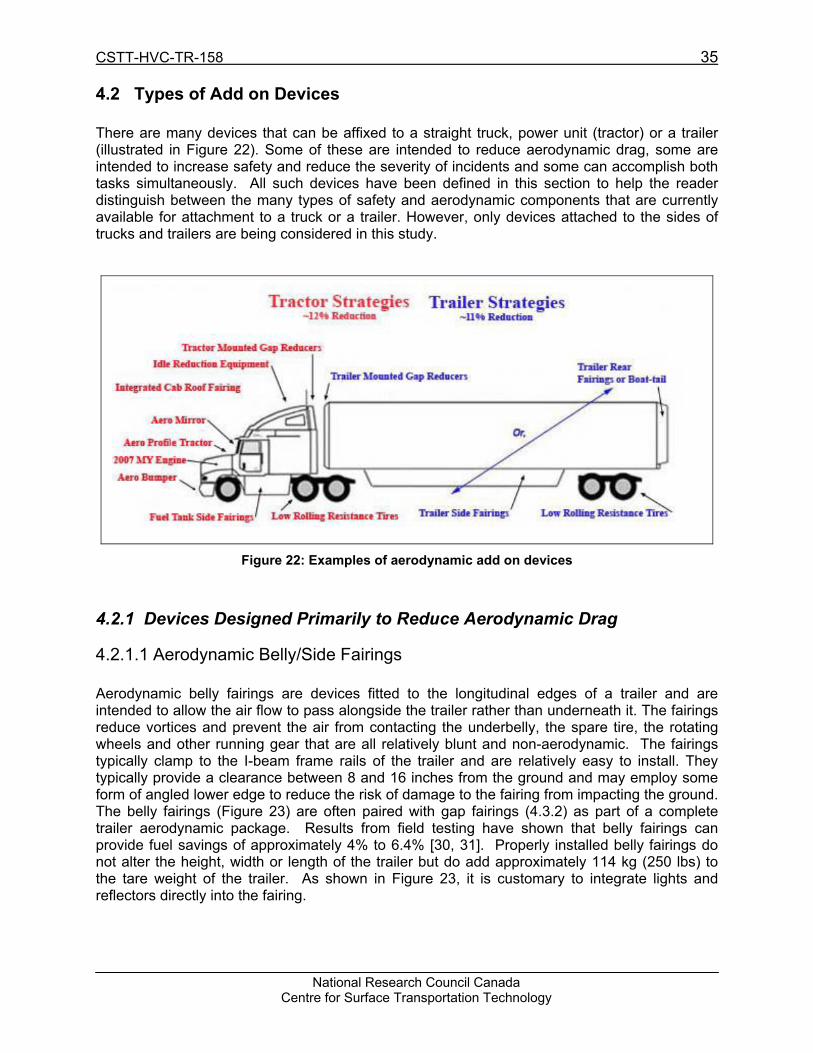
CSTT-HVC-TR-158 35
National Research Council Canada Centre for Surface Transportation Technology
4.2 Types of Add on Devices There are many devices that can be affixed to a straight truck, power unit (tractor) or a trailer (illustrated in Figure 22). Some of these are intended to reduce aerodynamic drag, some are intended to increase safety and reduce the severity of incidents and some can accomplish both tasks simultaneously. All such devices have been defined in this section to help the reader distinguish between the many types of safety and aerodynamic components that are currently available for attachment to a truck or a trailer. However, only devices attached to the sides of trucks and trailers are being considered in this study.
Figure 22: Examples of aerodynamic add on devices
4.2.1 Devices Designed Primarily to Reduce Aerodynamic Drag
4.2.1.1 Aerodynamic Belly/Side Fairings Aerodynamic belly fairings are devices fitted to the longitudinal edges of a trailer and are intended to allow the air flow to pass alongside the trailer rather than underneath it. The fairings reduce vortices and prevent the air from contacting the underbelly, the spare tire, the rotating wheels and other running gear that are all relatively blunt and non-aerodynamic. The fairings typically clamp to the I-beam frame rails of the trailer and are relatively easy to install. They typically provide a clearance between 8 and 16 inches from the ground and may employ some form of angled lower edge to reduce the risk of damage to the fairing from impacting the ground. The belly fairings (Figure 23) are often paired with gap fairings (4.3.2) as part of a complete trailer aerodynamic package. Results from field testing have shown that belly fairings can provide fuel savings of approximately 4% to 6.4% [30, 31]. Properly installed belly fairings do not alter the height, width or length of the trailer but do add approximately 114 kg (250 lbs) to the tare weight of the trailer. As shown in Figure 23, it is customary to integrate lights and reflectors directly into the fairing.

36 CSTT-HVC-TR-158
National Research Council Canada Centre for Surface Transportation Technology
Until recently, belly fairings were not commonly found on Canadian trailers; however, various pilot projects have been introduced to determine the effectiveness of these devices on highway vehicles.
Figure 23: Example of belly fairing
4.2.1.2 Gap Fairing
Gap fairings are devices that are fitted to the front of van semi-trailers. These devices prevent air vortices from developing as air enters between the tractor and the trailer hence reducing aerodynamic drag. These devices have no impact on safety and are designed to minimize any interference with operations. Tests have shown that gap fairings can reduce fuel consumption by as much as 2% [30]. When combined, gap fairing and belly fairings have been shown to reduce fuel consumption by as much as 9% [30]. Gap fairings do not increase the height, length or width of the vehicle to which they are attached. An example is shown in Figure 24.
Figure 24: Example of gap fairing mounted to van semi-trailer

CSTT-HVC-TR-158 37
National Research Council Canada Centre for Surface Transportation Technology
4.2.1.3 Boat Tails Boat tails are devices that are fitted to the rear of van semi-trailers (Figure 25). These devices shed vortices as they leave the trailing edge of the trailer hence reducing aerodynamic drag and are designed to minimize any interference with operations. Tests performed at Clarkson University have shown that boat tails can reduce trailer drag by as much as 9% and fuel consumption between 4% and 8% [32]. Boat tails increase the effective length of a trailer therefore they are typically only mounted to 48 foot trailers. However, some jurisdictions do allow two foot boat tails on the more common 53 foot semi trailers.
Figure 25: Examples of boat tails
4.2.2 Devices Designed Primarily to Improve Safety
4.2.2.1 Side Underride Guards Side underside guards are similar in appearance to belly fairings; however, their purpose is primarily to prevent other road users from slipping under the sides of the vehicles. Side under ride guards as used in the EU must comply with strength requirements in order to qualify as a side guard whereas belly fairings currently used in Canada do not. Side guards are generally classified as being either flush mounted (similar to belly fairings) or rail type which have no aerodynamic benefits. A rail style guard is shown on the Scania truck in Figure 4. Side underride guards are intended to protect vulnerable road users such as pedestrians and bicyclists and in some instances motorcycles but not passenger vehicles. It would not be practical to mandate that side guards be strong enough to prevent the ingress of passenger vehicles or trucks. There is simply not enough material or structure on the sides of trailers to attach a guard that could be made strong enough, or absorb enough energy, to prevent a passenger car from riding under the side of the trailer. Additionally, the amount of material required to fabricate such a guard would add so much weight to the tare weight of the trailer it would drastically reduce the amount of payload that could be carried on such a trailer. Front and rear impact guards have been purposely built to prevent a passenger vehicle from riding

38 CSTT-HVC-TR-158
National Research Council Canada Centre for Surface Transportation Technology
under the truck or trailer because the width is so much less than the length of the trailer and because there is so much more structure to which the guards may be attached.
4.2.2.2 Rear Underride Guards The purpose of rear underride guards is to prevent other vehicles from driving underneath the rear of trailers. Although they can provide protection from bicycles and other road users, they are designed principally to prevent passenger vehicles from becoming pinned underneath the rear end of the trailer as a result of a rear end collision. The design, construction, testing and use of the rear underride guards in Canada are defined by regulations CMVSS 223. Rear underride guards (shown in Figure 26) do not provide any aerodynamic benefits and usually add approximately 44 kg (100 lbs) to the tare weight of a trailer, depending on the choice of material. The guards are usually attached to the strongest structural sections of the trailer in order to provide maximum strength and energy absorption.
Figure 26: Example of rear underride guard
4.2.2.3 Front Under-ride Guards Front under-ride guards are similar to rear under ride guards except they protect other vehicles in the event of a head on collision. Front under-ride guards are not mandated in Canada.
4.3 Variations in Fairing/Side Guard Design and Construction There are a variety of side mounted options for heavy vehicles that may be mounted alone or in combination with other components as part of an aerodynamic package. The distinguishing features for side guards are:
Inherent to vehicle design (Figure 8); Flush/smooth type (Figures 27 and 28); Rail type (Trailer in Figure 2); Continuous (Figure 28); and

CSTT-HVC-TR-158 39
National Research Council Canada Centre for Surface Transportation Technology
Gapped (Figure 27) Additionally, the purpose and installation of side guards may vary between highway transport and inner city delivery trucks and indeed the method of installation will vary between different styles of trailers (e.g. tankers versus vans).
Figure 27: Example of rigid, gapped, flush fairing
Figure 28: Example of rigid, continuous, flush fairing/side guard

40 CSTT-HVC-TR-158
National Research Council Canada Centre for Surface Transportation Technology
4.4 Implementation cost According to the study conducted by Freightwing and Transport Canada [31], the costs for conventional belly fairings was $1,825 and the cost for low rider belly fairings was $2,450. These are costs that must be added to the price of a new trailer and borne by the consumer. It is estimated that the fairings will add between 0.2% and 5.0 % to the capital costs of a new trailer. This results in a pay back period of 1.2 to 2.2 years under normal operating conditions and assuming a fuel price of approximately $1.00 per litre. Various calculation tools have already been established to determine the payback period for aerodynamic devices. The inputs to the calculator are:
Current or projected price of fuel; Estimated percentage fuel savings for device; Vehicle average fuel consumption; Annual mileage for vehicle; and Price of device.
The cost to install side guards intended to provide under run protection on trucks and trailers varies from installation to installation. Table 18, taken from an Australia study [33], illustrates the range of costs from approximately $574 to nearly $2,500 AD. Guards intended to provide side under run protection are sufficiently rare in Canada that installation costs in Canadian dollars could not be found. Table 18: Cost of rigid side guards for heavy commercial vehicles and articulated heavy commercial
vehicles
Vehicle Type Cost
3 axle semi-trailer $872 5 axle semi-trailer $872 6 axle semi-trailer $872 7 axle B-Double $1,147 8 axle B-Double $1,147 9 axle B-Double $1,147 Double Road Train $1,675 Triple Road Train $2,455 2 axle rigid commercial vehicle $574 3 axle rigid commercial vehicle $574 4 axle Twin-Steer rigid commercial vehicle $574 2 axle rigid commercial vehicle with 2 axle dog trailer $872 3 axle rigid commercial vehicle with 3 axle dog trailer $872 Fleet average $847
Source: VBG (component supplier), Sweden and Scania, Sweden

CSTT-HVC-TR-158 41
National Research Council Canada Centre for Surface Transportation Technology
4.4.1 Flush mount versus rail style The safety guard literature review was intended to update a previous review carried out by TRL [12], on behalf of the DfT, in 1995, and to attempt to identify any research to demonstrate any benefits of, or difficulties with, an integrated approach to underrun protection. The review revealed that there had been little new research into the safety aspects of sideguards since the previous review in 1995 and the principles of good design remained the same, that is, low ground clearance and minimizing gaps. More recent research showed that substantial additional benefits can be gained by replacing the traditional rail type sideguards with solid flat panels enclosing as much of the space between the wheels as possible. Research by De Coo et al (1994) [34] suggested that with the appropriate ground clearance, run over by the rear wheels could be eliminated in overtaking manoeuvres. Research by Stöcker (1990) [35] suggested that other injury criteria can also be reduced by removing the possibility of entanglement with the guard, collision between the victim and any protruding structure and a more gentle collision with the ground.
4.5 Environmental benefits
4.5.1 How fuel is consumed in a heavy truck Fuel is consumed by the engine as it propels the vehicle down the road. There are five major factors that the engine must overcome that contribute to this fuel consumption. In general, these can be categorized as follows:
Aerodynamic drag; Rolling resistance; Changes in grade or elevation; Internal power train losses; and Accessory losses (e.g. air conditioning, alternator loads and air compressors etc)
The percentage contribution to fuel burn for each of the five categories varies from vehicle to vehicle, and certainly the contribution from aerodynamics rises steeply with speed. The contribution to fuel burn from internal losses is generally modeled as a constant and the grade portion is obviously only present while the truck is ascending or descending a grade. At 40 km/h, the power needed to overcome rolling resistance and accessory losses is nearly twice as great as the power needed to overcome aerodynamic drag. At 80 km/h, the power necessary to overcome aerodynamic drag is roughly equal to that of rolling resistance and accessories. At 121 km/h, the power necessary to overcome aerodynamic drag is approximately 2.5 times greater than rolling resistance and accessory losses. Table 19 illustrates the contributions to fuel burn at various speeds, assuming a zero grade and properly inflated tires etc and assuming that the internal power train losses can be modeled as a constant and independent of vehicle speed.

42 CSTT-HVC-TR-158
National Research Council Canada Centre for Surface Transportation Technology
Table 19: Distribution of power consumption at various speeds
Loss 40 km/h (25 mph)
80 km/h (50 mph)
121 km/h (75 mph)
Aerodynamics 35% 47% 72% Rolling 53% 41% 18% Accessory 17% 12% 10%
Since there is more than one form of energy drain, it stands to reason that reducing aerodynamic drag by, say, 10% will not result in a 10% reduction in overall fuel consumption. Rather, it will be 10% multiplied by the percentage contribution of aero effects at that particular speed. For example, a 10% reduction of aerodynamic drag via the use of an aerodynamic package would have an overall effect of reducing fuel consumption by 4.7% at 80 km/h. These fuel savings would rise as speed increased to a maximum value of approximately 7.2% at 120 km/h.
4.6 Aerodynamics of Side Mounted Devices The addition of flush mount side fairings to highway trailers tends to smooth airflow and reduce cross-flow along and below the bottom edges of the trailer. Fairings entrain the air more efficiently under the trailer and keep crosswinds from causing turbulence under it. Many tests have been conducted with the aim of quantifying the potential fuel savings from the addition of side guards or fairings. A study [36] jointly performed by Technical University Delft in the Netherlands and TNT transport concluded the following: Initial driving tests with a trailer equipped with the aerodynamic side skirts over a straight stretch of public road revealed a cut in fuel consumption of between 5% and 15%. Subsequent research comprising long-term operational tests by TNT displayed a fuel reduction of 10%. These results confirm the calculations and findings from the wind tunnel tests: these had already established that the observed 14 - 18% reduction in air resistance led to 7 - 9% less fuel consumption. In practice, the figures are in fact even better. Other tests have resulted in fuel savings in the 4% to 6% range based on the improved aerodynamic shape of the vehicles. A similar study [31] was conducted jointly between Freightwing Inc, Transport Canada, the National Research Council and three major Canadian carriers. The aim of this project was to quantify any potential fuel savings as a result of installing belly fairings and low rider fairings (Figure 29) mounted on 53 foot van semi trailers. Although all three carriers used their vehicles differently, the overall average fuel savings was 6.4% using both types of fairings.
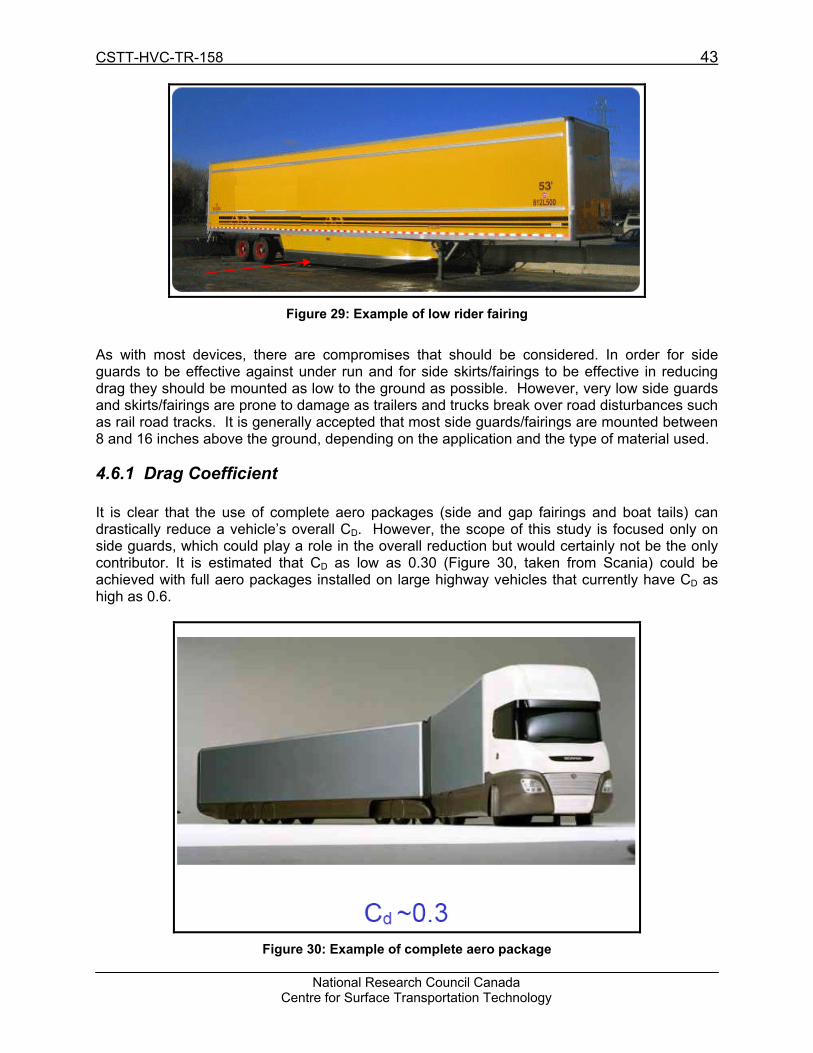
CSTT-HVC-TR-158 43
National Research Council Canada Centre for Surface Transportation Technology
Figure 29: Example of low rider fairing
As with most devices, there are compromises that should be considered. In order for side guards to be effective against under run and for side skirts/fairings to be effective in reducing drag they should be mounted as low to the ground as possible. However, very low side guards and skirts/fairings are prone to damage as trailers and trucks break over road disturbances such as rail road tracks. It is generally accepted that most side guards/fairings are mounted between 8 and 16 inches above the ground, depending on the application and the type of material used.
4.6.1 Drag Coefficient It is clear that the use of complete aero packages (side and gap fairings and boat tails) can drastically reduce a vehicle�’s overall CD. However, the scope of this study is focused only on side guards, which could play a role in the overall reduction but would certainly not be the only contributor. It is estimated that CD as low as 0.30 (Figure 30, taken from Scania) could be achieved with full aero packages installed on large highway vehicles that currently have CD as high as 0.6.
Figure 30: Example of complete aero package

44 CSTT-HVC-TR-158
National Research Council Canada Centre for Surface Transportation Technology
4.7 Reduced idling due to reduction in collisions A common misconception identified in the literature review is that side guards reduce the number of collisions between vehicles and VRUs and thus reduce the number of times, or at least the duration of time, that traffic is backed up while emergency vehicles attend to the victim(s) and clear the area. However, side guards will not prevent all incidents from occurring but may simply minimize the risk that VRUs will be dragged under the wheels of the vehicle after coming into contact with a heavy vehicle. Therefore since most VRUs who strike a heavy vehicle, with or without side guards, will likely sustain some form of injury and thus require treatment from an emergency vehicle, traffic congestion will not necessarily be lessened by any amount. As a result, it is not clear if side guards will reduce the number of incidents or if the guards will simply cause VRUs to strike the guards and then be ejected or diverted into another lane of traffic to suffer a serious injury as part of secondary event with another vehicle or with the road/sidewalk surface. Evidence supporting this theory may be seen in Figures 16 and 17 where serious injury rates dropped but the proportion of slight injuries rose. Even slight injuries may still require emergency vehicles and cause traffic delays. Despite these factors, NRC-CSTT attempted to create rudimentary models to calculate the amount of CO2 that is currently released as a result of traffic congestion due to serious side impact injury events. Additionally, attempts were made to predict the reduction in CO2 levels from traffic congestion if all trucks had side guards, thus reducing injury events requiring emergency vehicles and road closures. However, the historical data required for inputs to such a model are scattered and unreliable and, more importantly, the potential reduction of injury and need for road closures cannot reliably be predicted at this time. Therefore, a model based on currently available data is not worth considering at this time. It is not known if side guards would reduce the total amount of CO2 as a result of fewer traffic slowdowns and the actual amount of any potential reduction is impossible to predict. More importantly, even if the amount could be predicted, it is clear that any reduction in CO2 as a result of fewer truck/VRU injury events would be insignificantly small compared to the total amount of CO2 released in Canada every year. Significant reductions in CO2 emissions from diesel powered trucks could be more easily predicted and achieved via other methods, such as proper tire maintenance and anti-idling strategies.
4.8 Operator Considerations Many aspects of side guards affect other users on the road and potentially the environment. However, there are certain aspects and side effects that will impact the operators and maintainers of the fleets.
4.8.1 Access to underbody equipment The side guards must not interfere with the normal operation of the landing gear or prevent access to the spare tires, load securement points, twist lock levers, connection points for ferries, the diesel fuel tanks for the refrigeration unit nor should they prevent a driver from adding air to the tires. Additionally, the side guards should not prevent a driver or mechanic from inspecting the brakes, particularly the brake slack adjusters as operators are currently required to inspect their
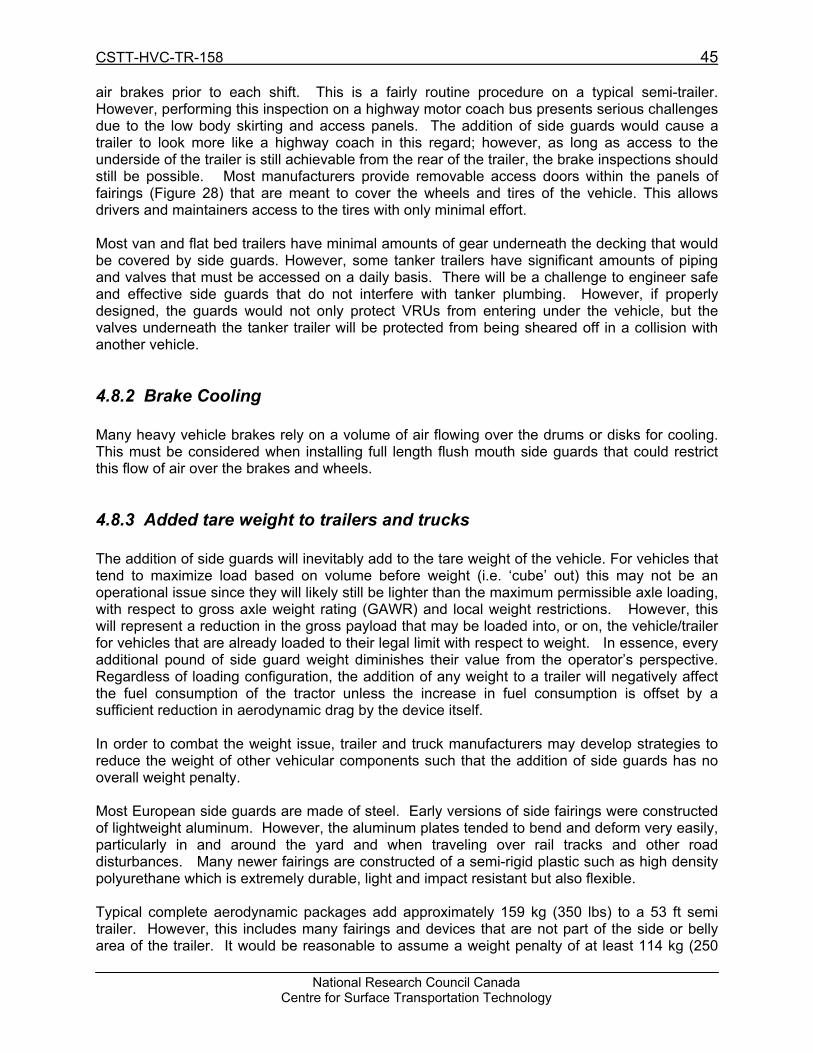
CSTT-HVC-TR-158 45
National Research Council Canada Centre for Surface Transportation Technology
air brakes prior to each shift. This is a fairly routine procedure on a typical semi-trailer. However, performing this inspection on a highway motor coach bus presents serious challenges due to the low body skirting and access panels. The addition of side guards would cause a trailer to look more like a highway coach in this regard; however, as long as access to the underside of the trailer is still achievable from the rear of the trailer, the brake inspections should still be possible. Most manufacturers provide removable access doors within the panels of fairings (Figure 28) that are meant to cover the wheels and tires of the vehicle. This allows drivers and maintainers access to the tires with only minimal effort. Most van and flat bed trailers have minimal amounts of gear underneath the decking that would be covered by side guards. However, some tanker trailers have significant amounts of piping and valves that must be accessed on a daily basis. There will be a challenge to engineer safe and effective side guards that do not interfere with tanker plumbing. However, if properly designed, the guards would not only protect VRUs from entering under the vehicle, but the valves underneath the tanker trailer will be protected from being sheared off in a collision with another vehicle.
4.8.2 Brake Cooling Many heavy vehicle brakes rely on a volume of air flowing over the drums or disks for cooling. This must be considered when installing full length flush mouth side guards that could restrict this flow of air over the brakes and wheels.
4.8.3 Added tare weight to trailers and trucks The addition of side guards will inevitably add to the tare weight of the vehicle. For vehicles that tend to maximize load based on volume before weight (i.e. �‘cube�’ out) this may not be an operational issue since they will likely still be lighter than the maximum permissible axle loading, with respect to gross axle weight rating (GAWR) and local weight restrictions. However, this will represent a reduction in the gross payload that may be loaded into, or on, the vehicle/trailer for vehicles that are already loaded to their legal limit with respect to weight. In essence, every additional pound of side guard weight diminishes their value from the operator�’s perspective. Regardless of loading configuration, the addition of any weight to a trailer will negatively affect the fuel consumption of the tractor unless the increase in fuel consumption is offset by a sufficient reduction in aerodynamic drag by the device itself. In order to combat the weight issue, trailer and truck manufacturers may develop strategies to reduce the weight of other vehicular components such that the addition of side guards has no overall weight penalty. Most European side guards are made of steel. Early versions of side fairings were constructed of lightweight aluminum. However, the aluminum plates tended to bend and deform very easily, particularly in and around the yard and when traveling over rail tracks and other road disturbances. Many newer fairings are constructed of a semi-rigid plastic such as high density polyurethane which is extremely durable, light and impact resistant but also flexible. Typical complete aerodynamic packages add approximately 159 kg (350 lbs) to a 53 ft semi trailer. However, this includes many fairings and devices that are not part of the side or belly area of the trailer. It would be reasonable to assume a weight penalty of at least 114 kg (250

46 CSTT-HVC-TR-158
National Research Council Canada Centre for Surface Transportation Technology
lbs) for aerodynamically designed belly fairings and the attaching hardware. The added weight of the fairings can be offset with the installation of alloy wheels (unless the trailer is already so equipped) which can reduce a trailer�’s weight by 116 kg (256 lbs) for a tandem trailer, and more for each additional axle.
4.8.4 Interference with self steer axles The United States has relatively conservative axle load regulations and thus the vast majority of trailers operated in the US are equipped with a tandem non-steerable axle. This provides a large expanse of the trailer with which to mount a continuous flush mouth side guard (Figure 28). However, Canada�’s higher allowable axle loads allow the use of tri-axle, tridem and quad axle configurations that may include at least one liftable axle to allow multi axle trailers to negotiate tight corners. The use of lift axles is known to damage roads and bridges since the load that was carried by the lift axle must be distributed to the other axles when the lift axle is raised. Therefore, many provincial governments, including Ontario, have instituted freight policies that will eliminate the use of lift axles within the next 10 to 20 years. Therefore, the only way to maintain current vehicle loading is to replace straight lift axles with steerable lift axles. Steerable lift axles cannot be raised by the driver in the cab and are capable of steering as much as 20 degrees when the vehicle is turning. Fitting continuous flush mount side guards (as shown in Figure 28) may pose serious technical challenges to the vehicle manufacturers due to the need to allow self steer axles to steer outside the lateral envelope of the trailer. Trailers with multiple self steer axles may be required to carry gapped side guards; or complicated panels that move with the self steer axles will have to be designed and integrated onto the trailers.
4.8.5 Collection of snow, ice, mud and debris Another possible side effect of side guards that should be considered, particularly in Canada, is their tendency to collect snow, ice, mud and other debris. During winter months, Canadian truckers must be aware that their vehicles could be trapping hundreds, if not thousands, of extra pounds of snow and ice. This increases GVW and increases braking distances since the driver may not be aware their vehicle has taken on unwanted weight. It is still not clear if side guards will prevent snow from entering under the vehicle or if snow will accumulate on the panels themselves, particularly on the backsides which will have structural elements that may naturally trap foreign objects and snow/ice. A literature search did not reveal any test data or results on this topic. A representative from one of the fleet operators involved in the Transport Canada belly fairing project [31] indicated that (anecdotally via teleconference with NRC-CSTT) when comparing trailers with and without belly fairings, the trailers with the fairings tended to collect less snow and ice than the baseline trailers which did not have any side guards or fairings. The brackets for the fairings tended to collect some snow and ice, however, the trailer as a whole retained less snow and ice due to the snow plow effect of the side fairing. The fairings on these particular trailers were mounted with less than 12 inches of ground clearance which is considered relatively low. It is likely that guards with more ground clearance would allow more snow to enter underneath the trailer.
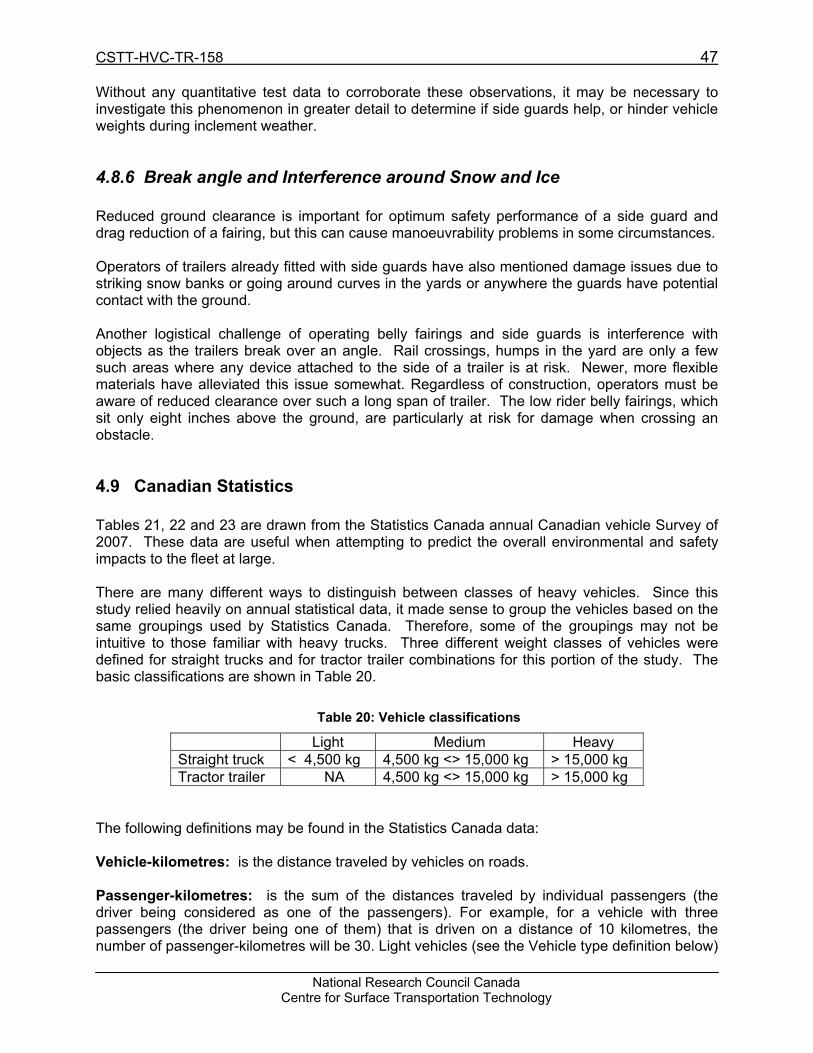
CSTT-HVC-TR-158 47
National Research Council Canada Centre for Surface Transportation Technology
Without any quantitative test data to corroborate these observations, it may be necessary to investigate this phenomenon in greater detail to determine if side guards help, or hinder vehicle weights during inclement weather.
4.8.6 Break angle and Interference around Snow and Ice Reduced ground clearance is important for optimum safety performance of a side guard and drag reduction of a fairing, but this can cause manoeuvrability problems in some circumstances. Operators of trailers already fitted with side guards have also mentioned damage issues due to striking snow banks or going around curves in the yards or anywhere the guards have potential contact with the ground. Another logistical challenge of operating belly fairings and side guards is interference with objects as the trailers break over an angle. Rail crossings, humps in the yard are only a few such areas where any device attached to the side of a trailer is at risk. Newer, more flexible materials have alleviated this issue somewhat. Regardless of construction, operators must be aware of reduced clearance over such a long span of trailer. The low rider belly fairings, which sit only eight inches above the ground, are particularly at risk for damage when crossing an obstacle.
4.9 Canadian Statistics Tables 21, 22 and 23 are drawn from the Statistics Canada annual Canadian vehicle Survey of 2007. These data are useful when attempting to predict the overall environmental and safety impacts to the fleet at large. There are many different ways to distinguish between classes of heavy vehicles. Since this study relied heavily on annual statistical data, it made sense to group the vehicles based on the same groupings used by Statistics Canada. Therefore, some of the groupings may not be intuitive to those familiar with heavy trucks. Three different weight classes of vehicles were defined for straight trucks and for tractor trailer combinations for this portion of the study. The basic classifications are shown in Table 20.
Table 20: Vehicle classifications
Light Medium Heavy Straight truck < 4,500 kg 4,500 kg <> 15,000 kg > 15,000 kg Tractor trailer NA 4,500 kg <> 15,000 kg > 15,000 kg
The following definitions may be found in the Statistics Canada data: Vehicle-kilometres: is the distance traveled by vehicles on roads. Passenger-kilometres: is the sum of the distances traveled by individual passengers (the driver being considered as one of the passengers). For example, for a vehicle with three passengers (the driver being one of them) that is driven on a distance of 10 kilometres, the number of passenger-kilometres will be 30. Light vehicles (see the Vehicle type definition below)

48 CSTT-HVC-TR-158
National Research Council Canada Centre for Surface Transportation Technology
report the number of passengers for each trip (see the Trip definition below). The number of passengers in heavy vehicles with gross vehicle weight of 4.5 tonnes or more (see the Vehicle type definition below) is calculated as the average of the number of passengers at the beginning of each trip and the number of passengers at the end of each trip (see the Trip definition below). Fuel consumed: is the amount of fuel used to operate vehicles. This variable is derived for each vehicle using the reported fuel purchases and distance driven. The number of vehicles on the registration lists: is the average number of the registered vehicles in the registration lists at the beginning and at the end of the reference period. The number of vehicles in scope: is an estimate of the average number of vehicles registered during the quarter based on the lists from jurisdictions and the survey responses. This number slightly differs from the previous one because we incorporate into it all our findings from the survey. Note that this number includes vehicles used and not used on the roads during the reference period. Quality indicator: To assist the user in evaluating the potential effect of nonresponse, imputation and sampling error, an all-embracing quality indicator accompanies every estimate. The quality indicator is a function of the CV, which takes into account the variability due to sampling and the variability due to non-response and imputation. Letter and significance Coefficient of variation A Excellent Less than 5% B Very good 5% to 9.9% C Good 10% to 14.9% D Acceptable 15% to 19.9% E Use with caution 20% to 34.9% F too unreliable to be published 35% or more The quality of counts (direct from registration lists) not accompanied by a quality symbol is good or better.
Table 21: Estimates of number of vehicles in scope for Canada by vehicle body type
Source: Table 3-3, CVS 2007

CSTT-HVC-TR-158 49
National Research Council Canada Centre for Surface Transportation Technology
Table 22: Estimates of vehicle-km by vehicle class, type of fuel and body type
Source: Table 7-1, CVS 2007
Table 23: Estimates of fuel consumed by vehicle class, type of fuel and body type
Source: Table 7-2, CVS 2007 Table 24 and Figures 31 and 32 are taken from the Natural Resources Canada 2005 vehicle survey results and support the information found in the Statistics Canada data.
Table 24: Vehicle-kilometers driven by type of vehicle

50 CSTT-HVC-TR-158
National Research Council Canada Centre for Surface Transportation Technology
Figure 31: Breakdown of distance traveled by truck type
Figure 32: Fuel consumption by type of vehicle
4.10 Cost benefit, fuel savings and CO2 emissions It is estimated that the costs to install a set of fairings on a 53 foot semi trailer would range between approximately $1,500 and $2,400. Various studies have concluded that the resultant fuel savings from the reduction in aerodynamic drag on a full size tractor trailer traveling at 100 km/h would provide a pay back period of less than two years on the capital investment [30, 31, 32]. However, these savings could only be realized using the flush mount fairings/skirts. The

CSTT-HVC-TR-158 51
National Research Council Canada Centre for Surface Transportation Technology
rail style side guards provide no aerodynamic benefits, and in some situations, could actually increase fuel consumption due to air buffeting and increased drag and weight. Using the Statistics Canada data, shown in Section 4.9, the following calculations have been made: In 2005, 232,489 tractor trailer combinations consumed 7,222 million litres to drive 20,957 million kilometers. This equates to an average annual distance of 90,141 km per tractor and an average annual fuel consumption rate (diesel) of 34.5 l/100 km. Using these figures, a typical tractor and van semi trailer that travels 100,000 km/year will consume 34,500 litres without any type of side guards. If the addition of a flush side guard provides a 5% decrease in fuel consumption as a result of lowered drag, the same combination would burn 32,775 litres, for a total savings of 1,725 litres, or $1,725 using a price of $1 per litre of diesel. Therefore, it is likely that operators would achieve pay back periods of between one and two years for each trailer that receives flush side guards. This payback period will vary depending on the number of kilometers driven and the price of fuel. Table 25 illustrates an example of the potential fuel and GHG emission savings for a tractor trailer combination traveling at divided highway speeds of 100 km/h equipped with flush mount side guards.
Table 25: Estimated fuel savings
Without guards With guards Savings Distance/year 100,000 km 100,000 km 0 km Fuel consumption 34.5 L/100 km 32.8 L/100 km 1.73 L/100 km Volume burned 34,500 litres 32,775 litres 1,725 litres Cost** $34,500 $32,775 $1,725 CO2 emissions 92,460 kg 87,837 kg 4,623 kg
*Estimate based on 5% reduction in fuel consumption from various studies ** Based on a cost of $1.00 per litre of diesel
Although the calculations depend on some assumptions relating to the fleet at large, it is estimated that the addition of flush mount side guards to all trailers being pulled by class 8 tractors could potentially reduce the amount of fuel being consumed by as much as 401 million liters ($401 million) annually if a modest overall gain in aerodynamics of 5% is achieved. The CO2 emissions would be reduced by an estimated 1.1 million tonnes. The reduction in fuel consumption would be 561 million litres and the amount of CO2 would be reduced by 1.5 million tones with a 7% reduction in aerodynamic drag, which is consistent with the TU Delft study [36]. It is assumed that there would be virtually no fuel savings and CO2 reduction with inner city straight trucks since they generally do not achieve speeds that would cause aerodynamic drag to be an issue. In fact, any small decrease in fuel consumption due to aerodynamics would be offset by the increase in fuel consumption caused by carrying the extra tare weight of the devices.
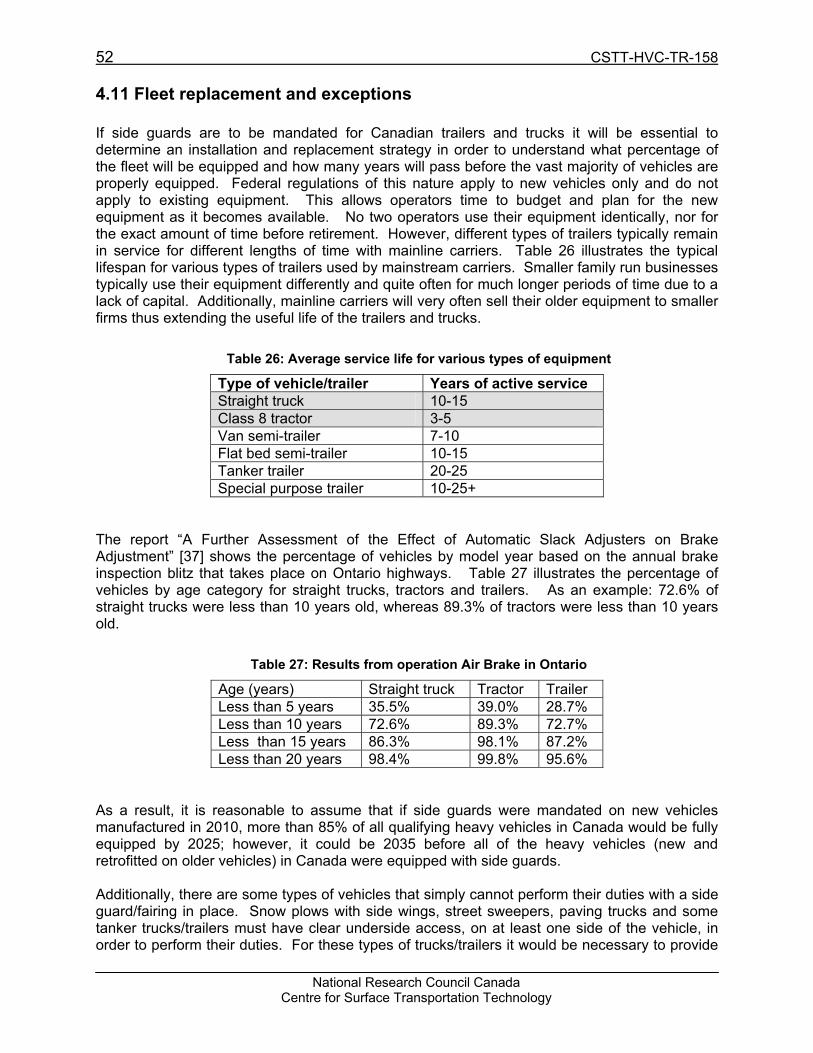
52 CSTT-HVC-TR-158
National Research Council Canada Centre for Surface Transportation Technology
4.11 Fleet replacement and exceptions If side guards are to be mandated for Canadian trailers and trucks it will be essential to determine an installation and replacement strategy in order to understand what percentage of the fleet will be equipped and how many years will pass before the vast majority of vehicles are properly equipped. Federal regulations of this nature apply to new vehicles only and do not apply to existing equipment. This allows operators time to budget and plan for the new equipment as it becomes available. No two operators use their equipment identically, nor for the exact amount of time before retirement. However, different types of trailers typically remain in service for different lengths of time with mainline carriers. Table 26 illustrates the typical lifespan for various types of trailers used by mainstream carriers. Smaller family run businesses typically use their equipment differently and quite often for much longer periods of time due to a lack of capital. Additionally, mainline carriers will very often sell their older equipment to smaller firms thus extending the useful life of the trailers and trucks.
Table 26: Average service life for various types of equipment
Type of vehicle/trailer Years of active service Straight truck 10-15 Class 8 tractor 3-5 Van semi-trailer 7-10 Flat bed semi-trailer 10-15 Tanker trailer 20-25 Special purpose trailer 10-25+
The report �“A Further Assessment of the Effect of Automatic Slack Adjusters on Brake Adjustment�” [37] shows the percentage of vehicles by model year based on the annual brake inspection blitz that takes place on Ontario highways. Table 27 illustrates the percentage of vehicles by age category for straight trucks, tractors and trailers. As an example: 72.6% of straight trucks were less than 10 years old, whereas 89.3% of tractors were less than 10 years old.
Table 27: Results from operation Air Brake in Ontario
Age (years) Straight truck Tractor Trailer Less than 5 years 35.5% 39.0% 28.7% Less than 10 years 72.6% 89.3% 72.7% Less than 15 years 86.3% 98.1% 87.2% Less than 20 years 98.4% 99.8% 95.6%
As a result, it is reasonable to assume that if side guards were mandated on new vehicles manufactured in 2010, more than 85% of all qualifying heavy vehicles in Canada would be fully equipped by 2025; however, it could be 2035 before all of the heavy vehicles (new and retrofitted on older vehicles) in Canada were equipped with side guards. Additionally, there are some types of vehicles that simply cannot perform their duties with a side guard/fairing in place. Snow plows with side wings, street sweepers, paving trucks and some tanker trucks/trailers must have clear underside access, on at least one side of the vehicle, in order to perform their duties. For these types of trucks/trailers it would be necessary to provide

CSTT-HVC-TR-158 53
National Research Council Canada Centre for Surface Transportation Technology
an exemption such that the side guard could be temporarily removed or stowed while the vehicle is performing its intended duties and the guard must be returned to its active position when the vehicle is ferrying between jobs. The TRL study [12] concluded that an additional two lives could be saved every year in the UK if vehicle exemptions were removed. The combination of replacement time and exemptions will certainly mean that many vehicles will not be equipped with side guards in the near future and possibly some vehicles, such as snow plows, that are considered high risk for under-ride, may never be equipped with side guards while performing their duties in close proximity to VRUs.
4.12 Other safety considerations Most regulations pertaining to side guards stipulate that the guard must be fitted ahead of the rear axle group but not so far towards the front of the trailer to interfere with the articulation angle that the trailer makes with the tractor while turning. Although some guards do extend aft of the rear axle group, this is typically for aerodynamic purposes and not part of any safety regulation. Consider a full trailer that is being towed by a straight truck. The truck would have side guards ahead of the rear axle and the trailer would have side guards ahead of its rear axle. However, a gap would exist between the truck�’s rear axles and the leading edge of the trailer�’s axles as seen in Figure 33. If a VRU were to strike that area of the combination vehicle there would be no protection and that person could certainly make contact with the front axle of the trailer. There is no practical way to avoid this situation since trailers are sometimes towed by straight trucks with converter dollies and sometimes by tractors and the front section of any trailer must remain clear for the articulation angle.
Figure 33: Example of gap in combination vehicles
Since bicycles and pedestrians are not permitted to travel along divided highways, there is lower risk of an incident involving a heavy truck and a VRU. Although tractor and trailer combination vehicles spend the vast majority of their time driving on divided highways, they do enter urban areas to deliver and pickup goods. Therefore, the addition of side guards that are principally intended to save lives may rarely, if ever, come into contact with the VRUs they are intended to protect for the vast majority of the vehicle�’s intended duty cycle. It would therefore be more

54 CSTT-HVC-TR-158
National Research Council Canada Centre for Surface Transportation Technology
sensible to fit highway trailers and trucks with guards that are principally intended to reduce drag on highway operations but could also provide the same impact strength as guards used in Europe and Japan when required in higher risk VRU collision areas. The installation of side guards will not completely eliminate serious injury or death to pedestrians who come into contact with heavy vehicles. City buses typically have skirting and inherent side guards that are as low as 10 inches from the ground, which is lower than most guards found on highway transport. Yet despite these lowered guards, NRC-CSTT�’s literature review uncovered several incidents (the UK, Canada and the Netherlands to name a few) where passengers who were standing beside or exiting buses slipped under the chassis of the bus and were killed a result of being dragged by the bus while being pinned under the wheels.
CSTT-HVC-TR-158 55
National Research Council Canada Centre for Surface Transportation Technology
5 CONCLUSIONS Based on data from the EU, the number of deaths and serious injuries for VRUs when involved in an incident with heavy vehicles has been reduced since the introduction of side guards. However, it is not clear if this reduction is entirely related to side guards or if side guards are but one of the contributing factors. The statistical data from the EU revealed there was a greater reduction in severe injuries and death for bicyclists than for pedestrians during the reporting period. The effectiveness of the sideguards on heavy vehicles has been demonstrated by a UK study, which showed significant reductions in the number of bicyclist fatalities from before the sideguards were introduced to after the sideguards were introduced. In Canadian urban collisions involving heavy vehicles, bicyclists and pedestrians, the front of the heavy vehicle (front, right front and left front) was the initial point of impact in 42.9% of the cases for bicyclist fatalities and 45.8% of the cases for pedestrian fatalities. The right side of the heavy vehicle (right middle, right rear and entire right side) was the initial point of impact in approximately 28.5% of cases for bicyclist fatalities and 6.3% of cases for pedestrian fatalities. In the US heavy truck-VRU collisions, the front of the vehicle was the initial point of impact in 48.5% of the cases for bicyclist fatalities and 71.6% of the cases for pedestrian fatalities. The right side of the vehicle was the initial point of impact in approximately 22.5% of cases for bicyclist fatalities and 7.9% of cases for pedestrian fatalities. Side guards are only part of the solution to reducing severe injury caused by heavy truck and VRU collision incidents. It is not clear if side guards will reduce deaths and serious injury or if the guards will simply alter the mode of death and serious injury. For example, VRUs may strike the guards and then be ejected or diverted into another lane of traffic to suffer a serious injury as part of secondary event with another vehicle or with the road/sidewalk surface. Side guards alone will not eliminate serious injuries. City buses have lower built-in side skirting than side guards found on most trailers yet there are still incidences of pedestrians and passengers being killed as they slip and fall under the wheels of moving city buses. The height, strength and location of side guards affect their ability to minimize the severity of incidents. Aerodynamic properties are also affected by these factors. If a side guard regulation is adopted in Canada it should stipulate a maximum ground clearance, a minimum strength requirement and define the areas of installation on heavy vehicles above a certain gross vehicle weight rating (GVWR). It is not clear if the addition of side guards will alleviate, or exacerbate the issue of snow, ice and mud collection on the underside of heavy vehicles. If a side guard regulation is adopted in Canada it will be important to define a list of candidate vehicle types and to consider which vehicles cannot perform their intended duties with a side guard in place. The number of vehicle type exemptions should be minimized in order to maximize the effectiveness of a side guard regulation.
56 CSTT-HVC-TR-158
National Research Council Canada Centre for Surface Transportation Technology
Although similar in appearance, a clear distinction should be made between devices that are intended to protect vulnerable road users and devices that are intended to reduce fuel consumption via a reduction in aerodynamic drag. Additionally, there should be a clear distinction between devices that would be useful for inner city trucks and those aimed at highway vehicles. Many of the aerodynamic benefits of flush side fairings/skirts that could be achieved with highway installations could potentially be detrimental to smaller and slower inner city vehicles. Similarly, many of the safety benefits that could be achieved with the addition of rail style side guards to inner city trucks would be detrimental to the drag coefficient of highway vehicles that travel at speeds greater than, say, 70 km/h. Since bicycles and pedestrians are not permitted to travel along divided highways, there is a lower risk of an incident involving a heavy truck and a VRU. Although tractor and trailer combination vehicles spend the vast majority of their time driving on divided highways, they do enter urban areas to deliver and pickup goods. Therefore, the addition of side guards that are principally intended to save lives may rarely come into contact with the VRUs they are intended to protect for the vast majority of the vehicle�’s intended duty cycle. There is sufficient test data from around the world to conclude that flush side fairings/skirts on heavy vehicles/trailers improve aerodynamics via a reduction in the trailer�’s coefficient of drag. The amount of the reduction in drag depends highly on the installation, the vehicle and the speed at which the vehicle is travelling. Regardless of safety issues, the use of flush side fairings/skirts or belly fairings on highway transport trailers could reduce the volume of diesel fuel consumed every year. It is estimated that industry wide use of flush mount side guards could result in a total savings of over 400 million litres of fuel every year in Canada, and a total reduction of CO2 of 1.1 million tonnes annually. It would likely not be useful to install flush aerodynamic guards on vehicles that typically travel at speeds less than about 70 km/h. The minimal reduction in drag on these slower moving vehicles would simply be adding weight without any real payback with respect to fuel or GHG savings. Operators would be unfairly penalized by adding unnecessary weight to their vehicles. Guards designed for slower moving vehicles should be designed with the aim of safety, strength, weight and ease of logistics for the drivers and maintainers. Installing rail style side guards on highway trailers would be counter productive to other global initiatives that are currently aimed at reducing greenhouse gas emissions and fuel consumption. Since operators may have to pay for the devices and reduce payload by 114 kg (250 lbs), the impact to their operations could be minimized if the devices were sufficiently aerodynamic to provide very short payback periods. Consideration should be given to creating a standard that differentiates between inner city straight trucks and highway heavy tractor and trailer combinations. There may be technical challenges to fitting continuous flush mount side guards to trailers equipped with self steer axles. It is a common belief that side guards will reduce traffic slowdowns due to a decrease in fatal or serious injury events. However, side guards will not necessarily prevent incidents, they will simply minimize the risk that VRUs will be dragged under the wheels of the vehicle. Therefore,

CSTT-HVC-TR-158 57
National Research Council Canada Centre for Surface Transportation Technology
since anyone who strikes a heavy vehicle, with or without side guards, will likely sustain some form of injury, there is no evidence that traffic congestion will be lessened by any amount. Attempts were made to predict the reduction in CO2 levels from traffic congestion if all trucks had side guards, thus reducing injury events requiring emergency vehicles and road closures. Since side guards may only alter the mode of incident or type of injury, it is impossible to predict if traffic slowdowns, and hence engine idling and CO2 production, would be reduced. More importantly, even if the amount could be predicted, it is clear that any reduction in CO2 as a result of fewer truck/VRU injury events would be insignificantly small compared to the total amount of CO2 released in Canada every year from motor vehicles. .

58 CSTT-HVC-TR-158
National Research Council Canada Centre for Surface Transportation Technology
LIST OF ACRONYMS/ABBREVIATIONS AD Australian Dollar ADR Australian Design Rules APROSYS Advanced Protection Systems ATSB Australian Transport Safety Bureau CARE Community database on Accidents on the Roads in Europe CCMTA Canadian Council of Motor Transportation Administrators CD Coefficient of Drag CFRP Carbon fiber reinforced plastic CMVSS Canadian Motor Vehicle Safety Standards CO2 Carbon Dioxide CSTT Centre for Surface Transportation Technology DC District of Columbia ECE Economic Commission for Europe ERSO European Road Safety Observatory EU European Union FARS Fatality Analysis Reporting System FUPD Front Underrun Protection Device GCVW Gross Combination Vehicle Weight GFRP Glass fiber reinforced plastic GVM Gross Vehicle Mass GVW Gross Vehicle Weight HGV Heavy Goods Vehicle HVCIS Heavy Vehicle Crash Injury Study Kg Kilogram Km/h Kilometers per hour KSI Killed or Seriously Injured L Litres lbs Pound Mm Millimeters Mt Millions of Tonnes NA Not Applicable NCBD National Collision Database NRC National Research Council Canada NRCan Natural Resources Canada SUPD Side Underrun Protection Device TC Transport Canada TCIS Truck Crash Injury Study TRL Transport Research Laboratory TU Technical University UK United Kingdom UN United Nations UP Underride Protection US United States VC-COMPAT Vehicle Crash Compatibility through the Development of Crash Test
Procedures VRU Vulnerable Road User
CSTT-HVC-TR-158 59
National Research Council Canada Centre for Surface Transportation Technology
REFERENCES [1] Council Directive 89/297/EEC of 13 April 1989 on the approximation of the laws of the
Member States relating to the lateral protection (side guards) of certain motor vehicles and their trailers Official Journal L 124 , 05/05/1989 P. 0001 �– 0007
http://eur-lex.europa.eu/LexUriServ/LexUriServ.do?uri=CELEX:31989L0297:EN:HTML [2] ECE Regulation No. 73, uniform provisions concerning the approval of goods vehicles
trailers and semi-trailers with regard to their lateral protection. http://eur-lex.europa.eu/LexUriServ/LexUriServ.do?uri=OJ:L:2004:095:0056:0066:EN:PDF
[3] J. Lambert, G. Rechnitzer, �“Review of Truck Safety, Stage 1: Frontal, Side and Rear
Underrun Protection�”, MONASH University Accident Research Centre, Australia, 2002 http://www.monash.edu.au/muarc/reports/muarc194.pdf
[4] D. Lowe, �“The Transport Manager�’s and Operator�’s Handbook�”, UK, 1995 [5] J. Graham, Bill 17-981 �“Bicycle Safety Act Enhancement of 2008�”, Council of the District
of Columbia, 2008 http://www.dccouncil.washington.dc.us/images/00001/20081016174009.pdf [6] Government of the District of Columbia, Memorandum, 2008 http://app.cfo.dc.gov/services/fiscal_impact/pdf/spring08/123008_18.pdf [7] World Trade Organization, G/TBT/N/AUS/54, Notification, 2007 http://www.bis.org.in/sf/march2007/gtbtn07AUS54.doc [8] Australian Department of Infrastructure, Transport, Regional Development and Local
Government, e-mail, 2009 [9] International Affairs Office, Road Transport Bureau, Ministry of Land, Infrastructure,
Transport & Tourism JAPAN, e-mail, 2009 [10] J. Anderson, Cranfield Impact Centre, VC-COMPAT Workpackage 1, Task 1.6:
�“Inventory of Current Underrun Devices�”, 2003 [11] APROSYS AP-SP21-0062, �“Project Strategies for Enhanced Pedestrian and Cyclist
Friendly Design�”, 2005 [12] I. Knight, M. Dodd, D. Bowes, W. Donaldson, T. Smith, M. Neale, C. Grover & G. Couper
(TRL Limited), �“Integrated Safety Guards And Spray Suppression �– Final Summary Report�”, 2005
[13] City of Toronto Staff Report, 2006 http://www.toronto.ca/legdocs/2006/agendas/committees/wks/wks060607/it012.pdf [14] Canadian Motor Vehicle Traffic Collision Statistics, Transport Canada, 2006
http://www.tc.gc.ca/roadsafety/tp/tp3322/2006/pdf/stats2006.pdf

60 CSTT-HVC-TR-158
National Research Council Canada Centre for Surface Transportation Technology
[15] European Road Safety Observatory, Annual Statistical Report 2008 http://www.erso.eu/safetynet/fixed/WP1/2008/SafetyNet%20Annual%20Statistical%20Report%202008.pdf
[16] European Road Safety Observatory, Traffic Safety Basic Facts 2007, Bicycles
http://ec.europa.eu/transport/roadsafety_library/care/doc/safetynet/2007/bfs2007_sn-swov-13-bicycles.pdf
[17] European Road Safety Observatory, Traffic Safety Basic Facts 2007, Pedestrians
http://ec.europa.eu/transport/roadsafety_library/care/doc/safetynet/2007/bfs2007_sn-kfv-1-3-pedestrians.pdf
[18] European Commission ,Road Fatalities in EU, 2007
http://ec.europa.eu/transport/roadsafety_library/care/doc/annual_statistics/2007_transport_mode.pdf
[19] J. Gwehenberger, J. Bende, B. Matthiesen, Cranfield Impact Centre, �“National Statistics
Update with Respect to Front, Side and Rear Underrun of Trucks�”, 2003 http://vc-compat.rtdproject.net/
[20] APROSYS project, �“Characteristics of Heavy Trucks versus Pedestrians and/or
Cyclists�”, AP-SP83-D835, 2006 http://www.aprosys.com/Documents/deliverables/AP_SP83_D835.pdf [21] Heavy Duty Vehicles eSafety Working Group, Activity Report for the Year 2004
http://ec.europa.eu/information_society/activities/esafety/doc/esafety_forum/aghdvfinalreport_eng1_2.pdf
[22] Fatality Analysis Reporting System http://www-fars.nhtsa.dot.gov/Main/index.aspx [23] Department of Infrastructure, Transport, Regional Development and Local Government,
Road Deaths Australia: 2007 Statistical Summary http://www.infrastructure.gov.au/roads/safety/publications/2008/pdf/Ann_Stats_2007.pdf
[24] Australian Transport Safety Bureau (ATSB) �“Road Safety Report, Deaths of cyclists due to road crashes�”, 2006 http://www.infrastructure.gov.au/roads/safety/publications/2006/pdf/death_cyclists_road.pdf
[25] Rear-end Collisions Caused by Large Trucks (Statistics in Japan), 2008 http://www.unece.org/trans/doc/2008/wp29grrf/ECE-TRANS-WP29-GRRF-63-inf28e.pdf
[26] TNO, �“Bicycle safety in bicycle to car accidents�”, TNO-033-HM-2008-00354
http://media.fietsersbond.nl/botsvriendelijkeautos/bicycle_safety_in_bicyle_to_car_accidents.pdf
[27] S. Faßbender, M. Hamacher, F. Feist, �“The Future Design of Vulnerable Road User
Friendly Trucks�”, APROSYS workshop, 2008 http://www.aprosys.com/Documents/AP%20SP2%20WS%20on%20VRU%20Protection%20for%20HGV.pdf

CSTT-HVC-TR-158 61
National Research Council Canada Centre for Surface Transportation Technology
[28] International Affairs Office, Road Transport Bureau, Ministry of Land, Infrastructure, Transport & Tourism JAPAN, e-mail, 2009.
[29] Experimental Methods in Vehicle Aerodynamics; Presentation; Elofsson, Per; Scania CV
AB. www2.mech.kth.se/courses/5C1211/Scania_Elofsson_20070330.com [30] Independent Test Results, Freight Wing Inc.
http://www.freightwing.com/sae%20results.htm [31] Freight Wing Fleet Trial Program on Aerodynamic Fairings;
http://www.tc.gc.ca/programs/environment/ecofreight/casestudies/freightwing-eng.htm [32] Drag Reduciton of Tractor Trailers; Visser, Ken; Clarkson University, Potsdam, NY, Nov
2005. http://www.bioage.typepad.com/greencarcongress/docs/Clarkson-Project.pdf [33] Regulation Impact Statement for Underrun Protection; Standards and International
Vehicle Safety Branch; Report Number DOTARS VSS 10/2006; Canberra Australia. [34] Heavy Vehicle Goods Safety Considerations; Proceedings of the 14th International
Conference on Experimental Safety Vehicles, Munich 1994. De Coo, PJA et al. [35] Analysis of Statistical Data on HFV Accidents and Vehicle Measures to Improve Safety;
VTI Rapport 351A. Stöcker, UW, 1990. [36] http://www.tudelft.nl/live/pagina.jsp?id=0f68aa8f-96e0-4d88-98a8-
e965db2e0644&lang=en [37] �“A Further Assessment of the Effect of Automatic Slack Adjusters on Brake Adjustment�”;
National Research Council of Canada, Centre for Surface Transportation Technology; Billing, JR; July 2006. CSTT-HVC-TR-102.
[38] Data extracted by Transport Canada from the National Collision Database, for years
2004-2006.