sickness absence in the civil service - office of the ... · of the level of sickness absence in...
TRANSCRIPT

Comptroller and Auditor General Special Report
Sickness Absence in the Civil Service
August 2009

© Government of Ireland 2009
This report was prepared on the basis of information, documentation and explanations obtained from the public bodies referred to in the report. The draftreport was sent to the Department of Finance. Relevant sections were sent toother departments and agencies. Where appropriate, the comments receivedwere incorporated in the final version of the report.

Report of the Comptroller and Auditor General Sickness Absence in the Civil Service I have, in accordance with the provisions of Section 9 of the Comptroller and Auditor General (Amendment) Act, 1993, carried out an examination on the management of sickness absence in the Civil Service. I hereby submit my report on the above examination for presentation to Dáil Éireann pursuant to Section 11 of the said Act.
John Buckley Comptroller and Auditor General 21 August 2009


Table of Contents
Page Abbreviations Summary of Findings 13 Sickness Absence in the Civil Service 1 Introduction 19 2 Cost of Sickness Absence 23 3 Pattern of Sickness Absence 33 4 Managing Sickness Absence 55 5 Promotion of Attendance 71 Appendices
A Departments and Employee Numbers Covered by Examination
83 B General Sick Leave Arrangements 84 C Support Services 86 D Assumptions underpinning HRMS Data Analysis 89 E Average Cost of Absence per Employee 92 F Overall Summary Statistics by Department 93 G Distribution of Absence Type by Department 94 H Distribution of Absence by Day of the Week 95 I Distribution of Absence by Gender 97 J Approaches to Absence Management used by Departments 98 K Additional CMOD Comments 99

Table of Contents
Case Studies 1 Illness Classifications 48 2 Absence Reduction Targets 49 3 Devolution 56 4 Attendance Management Policy 59 5 Communication of Absence Policy 60 6 Line Management Responsibility for Recording of Absence 64 7 Absence Measurement and Reporting 67 8 Targeted Interventions 69 9 Wellness Programme 76
Abbreviations
CIPD Chartered Institute for Personnel and Development
CMO Chief Medical Officer
CMOD Centre for Management Organisation and Development, Department of Finance
CPI Consumer Price Index
CSOHD Civil Service Occupational Health Department
DFP Department of Finance and Personnel
EAO Employee Assistance Officer
EAS Employee Assistance Service
HR Human Resources
HRD Human Resource Department
HRM Human Resource Management
HRMS Human Resources Management System
HSE Health Service Executive
IBEC Irish Business and Employers Confederation
ICD International Classification of Diseases
IHR Ill Health Retirement
IPA Institute of Public Administration
LBP Lower Back Pain
NAO National Audit Office
Network Personnel Officers’ Network
NIAO Northern Ireland Audit Office
NICS Northern Ireland Civil Service
NISRA Northern Ireland Statistics and Research Agency
PMDS Performance Management and Development System

Abbreviations
SMI Strategic Management Initiative
UK United Kingdom
VAT Valued Added Tax
WHO World Health Organisation
WTE Wholetime Equivalent

Department Abbreviations
Attorney Gen. Office of the Attorney General
Courts Courts Service
CSO Central Statistics Office
CSSO Office of the Chief State Solicitor
DAFF Department of Agriculture, Fisheries and Food
DAST Department of Arts, Sport and Tourism
DCENR Department of Communications, Energy and Natural Resources
DCRAGA Department of Community, Rural and Gaeltacht Affairs
Defence Department of Defence
DEHLG Department of Environment, Heritage and Local Government
DES Department of Education and Science
DETE Department of Enterprise, Trade and Employment
DHC Department of Health and Children
DJELR Department of Justice, Equality and Law Reform
DPP Office of the Director of Public Prosecutions
DSFA Department of Social and Family Affairs
Finance Office of the Minister for Finance
Foreign Affairs Department of Foreign Affairs
Oireachtas Houses of the Oireachtas
Ombudsman Office of the Ombudsman
OPW Office of Public Works
PAS Public Appointments Service
PRA Property Registration Authority
President's Est. President's Establishment

Department Abbreviations
Revenue Office of the Revenue Commissioners
State Lab State Laboratory
Taoiseach Department of the Taoiseach
Transport Department of Transport
Valuation Office Valuation Office
Throughout the text the term department is used to refer to any of the foregoing departments and offices.

Summary of Findings ___________________________________________________________


Summary of Findings Absence due to illness is a normal incidence of working life. However, from the viewpoint of service delivery, predictable patterns of attendance and low levels of absence are key to managing workflow and ensuring the efficient and timely delivery of public services.
There are no recent statistics on the level and cost of absence in the Civil Service. The last review of the level of sickness absence in the Civil Service was published in 1986. Consequently, this examination set out to
identify the financial impact and scale of sickness absence in Civil Service departments
analyse the nature of the absence and its distribution amongst staff
review the arrangements in place to manage, monitor and control absence due to sickness
review the extent to which measures and initiatives have been adopted to promote wellbeing and attendance.
The Department of Finance has ultimate responsibility for the regulation of sickness absence in the Civil Service and day to day management of sickness absence rests with each department. It is the responsibility of departments to take appropriate action to keep absence to a minimum.
Cost of Sickness Absence
The examination estimated that the total remuneration of Civil Service staff during periods of sickness absence was of the order of €64 million. However, the full cost could be considerably higher if indirect costs were factored in. Apart altogether from the non-effective expenditure incurred there are effectiveness implications. Attempting to maintain existing service levels while working around absence inevitably places an additional burden on staff and the organisation generally.
The examination found that there is scope to promote attendance and manage absence better. Improved absence management could lead to efficiency gains. It is estimated that every 5% reduction in days lost due to absence would reduce non-effective expenditure by €3.2 million taking account of salary costs alone.
A survey of Civil Service departments found that most departments do not maintain cost information for sickness absence. Departments need to identify the main causes of sickness absence and put formalised structures in place to identify, capture, monitor and report the associated costs.
Pattern of Sickness Absence
The examination found that there has been a significant increase in the level of sickness absence in the Civil Service since it was previously reviewed in the 1980s when the absence rate stood at 3.3%. Almost 5% of available working time was lost to sickness absence in 2007. On average, 59% of all staff employed availed of sick leave in that year. The average employee was absent, on average, for just over eleven days. The examination also found that there was considerable variation in sick days taken when the pattern of absence by grade, age, gender and work sharing arrangements was analysed. Some key findings on the pattern of absence were
the average number of days that each employee was out sick ranged from almost five and a half days in the Department of the Taoiseach to nearly 16 days in the Property Registration Authority

14 Sickness Absence in the Civil Service
the percentage of staff who took sick leave ranged from 42% of staff in the Department of Arts, Sports and Tourism to 76.5% in the State Laboratory
42% of all instances of absence representing 9% of all days lost were uncertified by a doctor or unauthorised
almost half of all sick days were taken by Clerical Officers and three quarters of all Clerical Officers availed of sick leave. The average number of days taken by each Clerical Officer was 16 days
female staff absence accounted for 68% of all working days lost, the average number of sick days taken by each female employee was almost 14 days, while the average for each male employee was around eight days
the average number of days lost for those working a three day week was almost 80% higher than the average for those who worked a standard week.
The foregoing pattern suggests that management actions need to be tailored after appropriate research in a way that differentiates appropriately between the nature of the organisation, the grades of staff, the gender of employees and the various work patterns.
Managing Sickness Absence
Sickness absence is well governed by Department of Finance rules and regulations. However, there is an ongoing obligation on each department to ensure that regulations are consistently applied and that all absence is accurately recorded, measured, reported on and that appropriate management action is taken as necessary.
The examination found that half of all departments had identified their lost time rate and, where it was done, that there was a lack of consistency in the approaches adopted by departments in identifying the level of absence and in its measurement. Some central guidance could help in this respect.
The examination found that only three of the 29 departments covered by the examination use performance indicators for sickness absence. Each department should identify key performance indicators relating to attendance and set a specific target to achieve each year. There is also scope for departments to share information and good management practices for absence measurement and reduction.
5% of all instances of absence in 2007 lasted longer than 20 days. However, these instances accounted for almost half of all days lost to absence with the average absence lasting 62 days. By focusing initially on long term absence initiatives there could be scope for departments to get better return for their efforts in terms of reducing absence. Timely intervention could help encourage an earlier return to work in these cases. Greater use of return to work interviews following absence could also contribute to improved attendance.
The examination identified a number of specific areas where improvements could be made in managing sickness absence. These include
bringing sickness absence guidance up to date and making it easier to administer
adopting an attendance policy in each department and creating staff awareness of absence policies and rules
extending further the range of responsibilities for absence management that are devolved to line managers.

Summary of Findings 15
Overall, there is a need for comprehensive, composite guidance on absence measurement and management.
Promotion of Attendance
Civil Service departments have not been proactive in determining the underlying factors that prevent people from coming to work. As well as managing absences, departments need to actively encourage good attendance by taking positive measures to promote staff wellbeing, encourage healthy lifestyles and ensure positive working arrangements. In order to do this effectively departments need to consider the reasons for the absences that are occurring. The pattern of absence identified by this examination suggests that each department is likely to confront different underlying factors below the immediate medical cause of absence.
10 of the 29 departments reviewed had identified the measures and practices that have worked well in terms of promoting attendance and reducing absence. There is scope for each department to review existing attendance promotion measures with a view to establishing their efficacy in the department’s environment. In particular, departments should take the following steps
identify any underlying factors which give rise to absence
provide a positive working environment by continuously reviewing the scope to involve staff in job design in order to make work more interesting and enhance staff engagement and commitment
build on the existing attendance promotion measures that are in place and evaluate their contribution from time to time
evaluate work/life balance and other flexible working arrangements to determine whether they have an impact on the level of sickness absence and whether there are mutual benefits accruing to both the department and its staff from their operation
review the effectiveness of health promotion measures adopted.
Measurement and Monitoring
Ultimately, successful attendance promotion initiatives need to be based on information and evidence including evaluations of the impact of those measures. In order to ensure that this type of information is available, departments should
improve recording of absence in order to ensure that information is complete and accurate
regularly report absence statistics at management level and establish targets for absence reduction
publish absence rates in the department’s annual report
maintain overall statistics of absence cases where disciplinary procedures or sanctions are applied and regularly review the effectiveness of sanctions applied.
Good Practice Opportunities
As well as including detailed recommendations for the better management of absence and the promotion of attendance the report outlines a number of case studies that outline initiatives which departments have found work well. While not all such initiatives are transferable to different working environments there clearly is scope for sharing of good practice through a suitable network.


Sickness Absence in the Civil Service ___________________________________________________________

1 Introduction 1.1 Staff are a valuable resource and their health and wellbeing are important. From the viewpoint of the organisation predictable patterns of attendance and low levels of absence are critical in managing workflow and ensuring the efficient and timely delivery of services. Staff sickness absence is the primary contributor to non-attendance.
1.2 This examination reviews attendance patterns across the Civil Service, estimates the cost of non-attendance to the degree possible and considers how attendance might be better managed.
Civil Service Staffing
1.3 At the end of 2007, over 36,200 wholetime equivalent civil servants1 were serving in departments. Non-industrial civil servants account for 95% of staff numbers while industrial civil servants make up the balance.
1.4 Civil Service departments vary considerably in terms of size. The departments covered by this examination range in size from less than 50 employees in the smallest department to over 7,000 employees in the largest department. Appendix A details the departments covered by this report and their employee numbers.
Management of Sickness Absence in the Civil Service
1.5 The Department of Finance has ultimate responsibility for the regulation of sickness absence in the Civil Service. Rules are codified in circulars2 and letters to Human Resource Departments (HRD). In January 1988, the Department of Finance devolved responsibility for the day to day control and monitoring of sickness absence to each department while charging them with taking appropriate action to keep absence to a minimum. This was given formal recognition in the Public Service Management Act, 1997.
Sick Leave Regulation in the Civil Service
1.6 While the granting of sick leave is a matter for the Head of each department, Civil Service sick leave provisions allow employees to avail of up to seven days paid uncertified sick leave in a 12 month period. Full pay for duly certified sickness absence, provided there is no evidence of permanent disability for service, may be allowed up to a maximum of six months in one year and half pay thereafter, subject to a maximum of twelve months paid sick leave in any period of four years3.
Fully paid sick leave includes all sick leave (both certified and uncertified). Entrants to the Civil Service on 12 month probationary contracts can avail of sick leave on a pro rata basis in their first year subject to the approval of the Personnel Officer.
There is provision under Civil Service regulations to grant further leave with pay at pension rate in instances where an officer’s service would render him or her eligible for pension if
1 This figure includes over 3,500 wholetime equivalent staff employed in the prison service, and excludes
almost 2,000 industrial civil servants. 2 The regulations underpinning the circulars are centrally negotiated with the Staff Panel at General Council
under the Conciliation and Arbitration Scheme. 3 Thereafter, pension rate of pay may be made available to eligible employees.

20 Sickness Absence in the Civil Service
retired on ill health grounds at the end of the period of paid sick leave or where there is a reasonable prospect of resumption of duty with ability to render efficient service.
1.7 Employees can avail, subject to approval, of up to 56 paid sick leave days and/or 25 instances of sick leave in a four year period (or pro rata where the service of the officer is less than four years) prior to sick leave impacting on promotion and most transfer options. The general sick leave arrangements are set out in Appendix B.
Reviews of Sickness Absence in the Civil Service
1.8 The last review of the level of sickness absence in the Civil Service “Absenteeism in the Public Service”4 was commissioned by the Department of Finance and published by the Institute of Public Administration (IPA) in 1986. The report calculated an average of 7.66 days lost per person through absence in the Civil Service5. This equated to an absence rate of 3.33%.
1.9 In November 2004, the Department of Finance published a report6 on the results of a survey of Health Promotion Initiatives in departments. An absence management review formed part of this survey. The report showed that a high proportion of departments (60% of respondents) reported that they monitored staff absence regularly. The report also noted that the Department of Finance would be developing guidelines, in conjunction with the Personnel Officers’ Network (the Network), to promote active management in relation to absence management, with the aim, in particular, of identifying and dealing with emerging problems at an early stage.
Support Services
1.10 The two main external support services for departments are the Office of the Chief Medical Officer (CMO) which incorporates the Civil Service Occupational Health Department (CSOHD) and the Employee Assistance Service (EAS). Their roles are outlined at Appendix C. In addition, many departments avail of other remedial interventions in the management of absence including the engagement of external medical expert assistance, referrals to counsellors/psychologists through the EAS, treatment programmes for addictions, rehabilitation programmes and internal human resources (HR) and local management interventions.
Human Resources Management System
1.11 In the late 1990s, a decision was taken under the Strategic Management Initiative (SMI)7 to acquire a common HR computer software package to facilitate a focus on strategic HR management. The system selected was PeopleSoft Human Resources Management System (HRMS). The project to set up a central version of the HRMS began in 2005. To date, the system has been implemented in 398 departments. The roll out of the HRMS in these departments was not completed until June 2007. Absence management is a key function within the HRMS.
4 Absenteeism in the Public Service – Information Systems and Control Strategies, Evelyn Blennerhassett,
Patricia Gorman, IPA, 1986. 5 Civil service statistics are based on an analysis of sickness absence in 1982. 6 Workplace Health Promotion Survey conducted by the Department of Finance, November 2004. 7 The SMI consists of a wide range of measures which are intended to bring about improvement in the
delivery of public services. 8 This includes a number of small departments which did not fall within the scope of the examination.

Introduction 21
1.12 The Department of Finance is currently developing the business case for a shared service model for human resource administration (which may include sick leave administration) for the Civil Service, in accordance with the Report of the Task Force on the Public Service –Transforming Public Services.
Objectives and Scope of the Examination
1.13 There are no recent published statistics on the level and cost of absence in the Civil Service. Consequently, the objectives of the examination were to
identify the financial impact and scale of sickness absence in Civil Service departments
analyse the nature of the absence and its distribution amongst staff
review the arrangements in place to manage, monitor and control absence due to sickness
review the extent to which measures and initiatives have been adopted to promote wellbeing and attendance.
1.14 The examination focused on the management of sickness absence in 29 Civil Service departments that have implemented the HRMS. Accordingly, it did not include certain smaller offices.
1.15 The detailed scope of examination did not extend to
industrial civil servants
certain categories of public servants paid through voted moneys, including Health Service Executive (HSE) employees, teachers, prison officers, the Gardaí and the Defence Forces.
However, certain comparisons are made of performance in other sectors as appropriate.
1.16 The examination focussed in detail on sickness absence in 2007 with a general review of the level of absence in 2006.
Examination Methodology
1.17 The examination was carried out by staff of the Office of the Comptroller and Auditor General. Assistance was provided in identifying good practice and questionnaire design by an independent management consultant company with a competency in the areas of HR, employment law and training9.
1.18 A pilot examination was undertaken in the Department of Social and Family Affairs (DSFA) in order to validate the methodology.
1.19 In the course of the examination, all departments completed a survey on the arrangements they have in place to identify, manage, monitor and control sickness absence, including the measures and initiatives adopted to promote wellbeing and attendance. Where deemed necessary, follow-up interviews were held with officials and written enquiries made to clarify issues arising from the responses to the survey.
1.20 Information and evidence were also gathered through
9 CollierBroderick Management Consultants.

22 Sickness Absence in the Civil Service
statistical analyses of HRMS data for all 29 departments – comments and verification of the factual accuracy were sought from all 29 departments on the HRMS data analysis undertaken by the audit team
interviews with HR officials in four departments
interviews with relevant officials in the Department of Finance
the review of other relevant HR documentation and reports on absence by private sector bodies
the review of absence reports produced by the audit offices in other jurisdictions
interviews with the CMO and members of the EAS
discussions with officials in the Northern Ireland Audit Office (NIAO) and the Northern Ireland Statistics and Research Agency (NISRA).
1.21 The statistical analysis of HRMS data is underpinned by a number of key assumptions. Appendix D details these assumptions.
1.22 The report deals with absence management in Civil Service departments and offices. All references to departments should be taken to encompass both departments and offices.
Absence from Work – Definitions
1.23 While the vast bulk of absence arises due to reported illness, for the purposes of this examination, absence was defined as time lost attributable to sickness or any other cause not excused through statutory entitlements or conditions of employment10.
1.24 Instances of sickness absence are classified as either short term or long term. An absence lasting more than 20 consecutive working days is classified as long term, while all other absences are considered short term11.
1.25 A certified absence is medically certified by a doctor. An uncertified absence is self certified by the employee in accordance with the terms of the relevant Civil Service sick leave circular12. An unauthorised absence is one where the employee is absent without authority.
Structure of the Report
1.26 The report considers the results of the examination in the chapters that follow. Chapter 2 identifies the cost of sickness absence in the Civil Service. Chapter 3 analyses the pattern of absence. Chapter 4 examines the arrangements that departments have in place to manage and monitor sickness absence. Finally, chapter 5 reviews approaches for the promotion of attendance and the extent to which they have been adopted in the Irish Civil Service. Initiatives that departments have found work well in the area of absence management are highlighted throughout the report.
10 Absenteeism: The Missing Facts, Gay Redmond, Irish Management Institute, 1986. 11 No definition of either long term or short term absence has been adopted in the Civil Service. 12 Circular 25/78 is the main circular which sets out the arrangements for sick leave in the Civil Service.
2 Cost of Sickness Absence 2.1 As well as impacting on a department’s service delivery capacity, sickness absence can place a significant financial burden on departments. This chapter attempts to assess the cost of absence. Chapter 3 will outline the trends and patterns underlying the costings.
2.2 While the direct cost13 of sickness absence is relatively easy to quantify there are consequential costs such as the cost of replacement and impacts on productivity that are less amenable to precise quantification.
2.3 The estimated cost of absence is calculated using assumptions set out in Appendix D.
Estimated Cost of Sickness Absence in the Civil Service
2.4 One measure of the cost of absence is the amount of salary paid out during periods of non-attendance. It is not suggested that such absence is avoidable. In fact, legitimate sickness absence is a normal part of employment and ultimately any management interventions can only be directed at excessive and unwarranted absence. The examination estimated that the total salary cost14 of sickness absence in Civil Service departments under review was of the order of €64 million15. The detail is shown in Figure 2.1. The overall findings included
the average cost of absence per wholetime equivalent (WTE)16 head of staff is highest in the Property Registration Authority at an estimated cost of €2,776 and lowest in the Department of the Taoiseach at an estimated cost of €1,173
the average cost per day is highest in the Office of the Attorney General at €28717 and lowest in the Department of Arts, Sport and Tourism at €156.
2.5 When the cost of sick pay is spread across only those employees who took sick leave, the average salary cost per employee was €3,07818. This cost ranged from €2,079 in the Office of the Chief State Solicitor to €3,959 in the Department of Transport. The detail is set out in Appendix E.
2.6 Over 90% of the cost of absence is attributable to certified absence. The cost of casual absence (i.e. uncertified absence) represents almost 10% of the overall estimated cost of absence at €6.2m.
13 Direct cost in this instance refers to the Civil Service sick pay arrangements. 14 Total salary cost is defined as direct salary cost plus an imputed pension contribution. Direct salary cost is
based on the average gross salary paid to an individual plus the associated employers’ pay related social insurance (PRSI) payment.
15 This cost is based on the latest Civil Service payscales to show the current cost of 2007 absence. The cost includes employer PRSI contributions and an imputed pension cost. The imputed pension cost is based on a net contribution of 13% payable by the employer.
16 The WTE is the equivalent number of staff who if working full time would deliver the same number of hours work in a year as the actual workforce with its variation in attendance patterns.
17 It is acknowledged that the average cost per day is a direct result of the grading structure in a department. For instance, in 2007, over 50% of the staff of the Office of the Attorney General were at Assistant Principal level or higher.
18 This is based on headcount only, not WTE status.

24 Sickness Absence in the Civil Service
Figure 2.1 Cost of Sickness Absence by Departmenta
Department WTE Numbers
by Department
Estimated Direct Cost
of Absenceb
Number of Sick Days
Sick Days per WTE
Cost per Dayc
Average Cost per
WTE
€ € € PRA 693.01 1,923,953 11,047 15.94 174 2,776 Transport 477.55 1,274,796 6,796 14.23 188 2,669 DSFA 4,642.03 11,913,204 70,200 15.12 170 2,566 Ombudsman 79.91 204,695 816 10.21 251 2,561 DHC 614.30 1,571,297 8,058 13.12 195 2,558 Attorney Gen. 119.63 303,696 1,060 8.86 287 2,539 PAS 150.30 375,088 2,058 13.69 182 2,496 DPP 192.45 457,799 2,040 10.60 224 2,379 Valuation Office 152.25 354,851 1,739 11.42 204 2,331 DCENR 415.77 952,382 4,840 11.64 197 2,291 CSO 862.74 1,907,386 12,086 14.01 158 2,211 Revenue 6,579.71 14,422,682 77,805 11.83 185 2,192 DETE 1,020.47 2,185,391 11,929 11.69 183 2,142 DES 1,311.28 2,807,198 14,590 11.13 192 2,141 State Lab 89.91 187,622 1,118 12.43 168 2,087 Defence 399.51 813,640 4,597 11.51 177 2,037 DJELR 1,955.40 3,826,341 19,039 9.74 201 1,957 Finance 647.01 1,249,089 5,289 8.17 236 1,931 Courts 1,120.58 2,149,276 10,926 9.75 197 1,918 President's Est. 21.59 40,334 224 10.38 180 1,869 DEHLG 1,281.47 2,285,826 12,173 9.50 188 1,784 DAFF 4,399.80 7,646,420 40,544 9.21 189 1,738 DCRAGA 273.85 456,931 2,122 7.75 215 1,669 OPW 710.54 1,132,706 5,466 7.69 207 1,594 Foreign Affairs 1,268.15 2,021,269 10,857 8.56 186 1,594 CSSO 238.08 376,274 2,332 9.80 161 1,580 Oireachtas 418.79 589,216 2,706 6.46 218 1,407 DAST 160.41 205,223 1,317 8.21 156 1,279 Taoiseach 242.87 284,997 1,331 5.48 214 1,173 Total 30,539.36 63,919,582 345,105 11.30 185 2,093 Source: Analysis by Office of the Comptroller and Auditor General
Notes:
a The estimated cost of absence for each department does not take account of the reimbursement of illness benefit from the DSFA for post 1995 employees (see Appendix D for definition of post 1995 employees).
b This calculation includes sick leave and unauthorised absence. The cost to departments for lost productivity due to unauthorised absence is €93,500 which represents 0.15% of the total cost of absence.
c The average cost per day to nearest euro.

Cost of Sickness Absence 25
Caveats in regard to Comparability
2.7 Eight departments outlined in Chapter 4 reported that a small amount of absence may be unrecorded. This could impact on the results to a limited extent. It would be important for those departments to satisfy themselves that there is complete capture of absence in future.
Factors Contributing to Direct Cost
2.8 As might be expected, the average cost of staff and the average length of sickness absences vary across the Civil Service. The examination sought to distinguish the extent to which the cost of sickness absence was attributable to the length of absence varying from the average and the extent to which it was due to wage levels varying across the service.
2.9 Three populations are distinguishable
departments where both the extent or volume of absences and the staff cost are greater than the average
departments where both the extent of absences and the staff cost are less than the average
departments where the two elements are countervailing – i.e. a variance in one of these factors is partly offset by the variance in the other.
2.10 Of the 29 departments examined, five had unfavourable variances on both counts by comparison with the Civil Service average as shown in Figure 2.2. In these departments, the extent of the variance from the Civil Service average is caused by both a higher number of days taken by each WTE employee and a higher average cost per day.
Figure 2.2 Wage and Extent Variancea (Worse than Average)
0 100 200 300 400 500 600
Revenue
DCENR
Valuation Office
DHC
Transport
Dep
artm
ent
Variance Value (€)
Wage Variance
Extent Variance
Average Cost €2,093
Source: Analysis by Office of the Comptroller and Auditor General Note: a The variance reported is the extent to which an average employee’s cost of absence in the particular
department exceeds that of the Civil Service generally and how much of that variance is accounted for by cost or extent of absence exceeding the Civil Service average.
2.11 At the other end of the scale a further three had both favourable extent and cost variances as shown in Figure 2.3. For these, both the average length of an absence and the average cost per day are lower than the overall Civil Service averages.

26 Sickness Absence in the Civil Service
Figure 2.3 Wage and Extent Variancea (Better than Average)
-900 -800 -700 -600 -500 -400 -300 -200 -100 0
President's Est.
CSSO
DAST
Dep
artm
ent
Variance Value (€)
Wage Variance
Extent Variance
Average cost €2,093
Source: Analysis by Office of the Comptroller and Auditor General Note: a The variance reported is the extent to which an average employee’s cost of absence in the particular
department is less than that of the Civil Service generally and how much of that variance is accounted for by cost or extent of absence being less than the Civil Service average.
2.12 In the remaining 21 cases, the financial impact of salaries and the extent of absences were countervailing as shown in Figure 2.4. This gave rise to situations where the higher average costs for employees were offset by the staff involved taking less than average sick leave and vice versa.

Cost of Sickness Absence 27
Figure 2.4 Wage and Extent Variancea (Better and Worse than Average)
-1,500 -1,000 -500 0 500 1,000 1,500
Taoiseach
Oireachtas
Foreign Affairs
OPW
DCRAGA
DAFF
DEHLG
Courts
Finance
DJELR
Defence
State Lab
DES
DETE
CSO
DPP
PAS
Attorney Gen.
Ombudsman
DSFA
PRA
Dep
artm
ent
Variance Value (€)
Wage Variance
Extent Variance
Source: Analysis by Office of the Comptroller and Auditor General Note: a While in the foregoing graphs the variances were cumulative, in this instance they are countervailing so
the net variance is got by offsetting the wage cost and extent factors.
Cost greater than Civil Service Average
Cost lower than Civil Service Average
Average Cost €2,093
Overall Cost of Absence
2.13 While no work has been done on the overall cost of absence in Ireland and it is difficult to quantify with any precision the financial impact of indirect costs attributable to sickness absence, it has been estimated in the United Kingdom (UK) that the cost of absences can be up to twice the direct cost of those absences.

28 Sickness Absence in the Civil Service
In a report published by the Cabinet Officea in the UK it was estimated that the true cost of absence is likely to be closer to twice the level of salary costs alone. The report noted that some of the less direct cost effects include occupational health and welfare costs, additional management and administrative work in dealing with absence, lower productivity and reduced quality, lower customer satisfaction and increased stress on colleagues. The report acknowledged that these knock on effects would arise to some degree whether or not an organisation arranges cover for absent staff. However, if overtime or cover staff are used, while less output will be lost cash costs will be correspondingly greater. The Cabinet Office’s best estimate of total absence costs, taking account of under recording of absence and poorer quality service, is that the financial impact of sickness absence could be closer to twice the level indicated from direct costs alone. a Working Well Together: Managing Attendance in the Public Sector, Cabinet Office, June 1998.
Opportunity for Value for Money
Efficiency
2.14 Reducing the level of absence in each department can give rise to efficiencies. Every reduction of 5% in the number of days lost due to absence would yield an estimated efficiency gain of €3.2 million to the Exchequer without taking account of the multiplier effect suggested by the UK Cabinet Office. While this assumes a reduction in absence across all levels within a department (based on 2007 absence levels), greater efficiencies could be achieved by those departments where the overall cost of absence is influenced by staff at higher wage levels who avail of high levels of absence.
2.15 However, in order to achieve any efficiency gains by reducing absence, departments would need to critically examine the factors which led to any deviation from the average extent and cost of absence and benchmark performance against comparable departments.
2.16 In order to determine the scope for any intervention and focus their efforts with a view to achieving reasonable cost reductions, departments would need to determine the extent to which
the average length of absence may be susceptible to reduction
the particular staff grades that account for the greatest volume of absence can be targeted.
Effectiveness
2.17 Both staff within an organisation and the public who avail of services are adversely affected by employee absence. The impacts identified by departments included
a negative effect on output and increased time dealing with absence or the consequences of absence
the need to reallocate work to ensure deadlines are met
an increasing workload falling on colleagues
visible de-motivational effect on colleagues providing cover for absence and lower morale generally.
2.18 The impact of these consequences on organisational effectiveness is impossible to quantify in monetary terms. However, it is likely to be substantial when account is taken of the indirect costs associated with delays and lower productivity, reduced work quality, employee morale and work pressure, as well as the additional HR and line management time that are devoted to absence related functions.

Cost of Sickness Absence 29
UK Comparison
2.19 In its 2008 report on the Management of Sickness Absence in the Northern Ireland Civil Service (NICS), the NIAO reported that the cost of direct salary only for 2006-07 was estimated at £25.6 million (€37.66 million19) or £914 (€1,34519) per person20. This cost was calculated on the basis of each individual’s actual salary and not average salaries. In addition, it does not take account of additional costs such as overtime, replacement staff, the cost of managing absence and lost productivity.
2.20 A 2007 report by the Cabinet Office21 found that the estimated cost of absence in the UK Civil Service for the financial period 2006-07 was £393 million (€578 million19) or £764 (€1,12419) per person22. It is not clear from the report how this cost is arrived at23.
2.21 In its 2008 annual survey report on absence management24 the Chartered Institute for Personnel and Development (CIPD) reported that only 40% of respondent departments in the UK monitor the cost of absence. The overall average cost of absence identified for 2007 was £666 (€90825) per employee. However, the average cost identified for the public service was £906 (€1,23525).
2.22 It is not suggested that a direct comparison between the UK and the Irish Civil Service can be made on the bases of these reports because of the degree to which salary costs and study methods may differ. Figure 2.5 details the reported costs for a number of studies.
Figure 2.5 Cost Comparisons
Organisation Cost per Person
€
Base Yeara
Irish Civil Service 1,817b 2008 Northern Ireland Civil Service 1,345 2006/2007 UK Civil Service 1,124 2006/2007 Chartered Institute for Personnel and Development
908 1,235
2007
Source: Analysis by Office of the Comptroller and Auditor General Notes: a This refers to the time period that the cost of absence relates to. b This takes account of all 35,185 employees covered by the examination.
19 This is based on the euro exchange rate of 0.67980 at 30 March 2007 the last working day of the month. 20 This is based on a calculation by the Office of the Comptroller and Auditor General using headcount. The
number of staff in post on a full or part time basis was around 28,000 which is equivalent to some 23,500 full time staff.
21 The report published by the Cabinet Office in November 2007 was based on the analysis of absence in the UK Civil Service for the financial year 2006-07 undertaken by Red Scientific Limited.
22 This increased to £1,370 (€2,015) per person for those with absence only. The cost per staff year was calculated as £888 (€1,306).
23 In the UK Civil Service, (apart from Senior Civil Service pay) the level of pay is set by individual departments and agencies, which varies depending on where an employee works.
24 This report was published in July 2008 and its findings are based on absence data for 2007. 25 This is based on the euro exchange rate of 0.73335 at 31 December 2007.

30 Sickness Absence in the Civil Service
2.23 The Department of Finance pointed out that according to the UK Health and Safety Executive, private sector organisations may under-record sick leave, which means that the public-private sector divide may be exaggerated.
Irish Comparisons
2.24 The Irish Business and Employers Confederation (IBEC) in its publication ‘A Guide to Managing Absence’26 reported that few organisations have mechanisms in place to identify absence costs and fewer still actually examine them systematically. Its 2004 workplace absence survey27 found that around one third (34%) of companies calculated the cost of absence, although only 14% did so in a formal way. In terms of actual costs, only 10% of companies surveyed provided information. On average, the cost per employee in these companies was €882 per annum based on 2002 absence data which is the equivalent of €1,05828 updated to 2008 prices.
Level of Costing of Sickness Absence in the Civil Service
2.25 Only two departments surveyed as part of the examination — the Revenue Commissioners and the President’s Establishment — had cost information for sickness absence. While both provided information on direct costs neither department has identified the total financial cost of sickness absence. Although the Revenue Commissioners has identified the indirect costs for central HR management of long term sickness absence it noted that it is difficult to calculate the indirect costs associated with local management of sickness absence due to the size and scale of the department and the high degree to which it is geographically dispersed. Neither department has set any formal explicit targets to reduce the cost of absence.
Management Information
2.26 While costs vary from one department to another and are influenced to a greater or lesser extent by the volume of absence and the distribution of absence across each staffing level, the lack of costing of sickness absence by Civil Service departments results in little emphasis being put on the significance of the financial impact that this absence places on individual departments and the Exchequer.
26 Employee Absenteeism, A Guide to Managing Absence, IBEC, September 2004. 27 Responses were received from 557 private sector companies employing 147,000 employees. Average
number of days lost per employee was 7.8. 28 This is based on (Consumer Price Index (CPI) 2006 – CPI 2002 + increase to 2008) = (115.7-102.7+7).

Cost of Sickness Absence 31
Conclusions
2.27 The total remuneration of Civil Service staff during periods of sickness absence was estimated at €64 million. The full cost could be considerably higher if indirect costs were factored in.
2.28 Absence due to illness is a normal incidence of working life. However, this does not mean that the level of absence cannot be influenced especially where the illness is work related. Chapters 4 and 5 consider this in more detail.
2.29 This examination estimated that every 5% reduction in days lost would reduce non-effective expenditure by €3.2 million taking account of salary costs alone. Apart from the non-effective expenditure involved the need to maintain existing service levels while working around absence inevitably places an additional burden on staff and the organisation generally.
Recommendations
Departments need to
determine a tolerable level of absence taking account of the contributing factors and set realistic targets to reduce absence that exceeds that level
identify the main cost drivers for sickness absence and put in place formalised structures for identifying, capturing, monitoring and reporting these costs
communicate the cost of absence by reporting in their annual reports the amount of non-effective expenditure paid by way of sick pay
undertake absence impact assessments, following surveys of staff (including absentees) to ascertain the effect of absence on staff and the organisation
benchmark attendance patterns against comparable departments.


3 The Pattern of Sickness Absence 3.1 In order to better manage absence due to sickness departments need to establish the pattern of absence. There has to date been limited reviews of this element of payroll costs. Accordingly, this chapter set out to measure the level and pattern of sickness absence across the Civil Service. Measuring the level of absence is an essential prerequisite for managing absence effectively. Without this information it is not possible to establish whether there is a problem and what the appropriate response might be.
3.2 This chapter analyses sickness absence across the Civil Service, reviewing in particular
overall absence rates in the Civil Service including the frequency and extent of absence
the type of absence distinguishing between certified and uncertified absences
the timing of absence by day of commencement and period of the year
absence by grade, gender and age
the influence of working time arrangements
the duration of absences classified by short term and long term absence
the correlation with location and employment status
absence by illness type.
Sickness Absence in the Civil Service
3.3 Over 345,100 working days were lost through absence due to sickness in 2007 involving over 30,500 WTE employees29. An average of 11.3 days were lost for each WTE employee giving an overall lost time rate in the order of 4.93% (the percentage of time paid for that was lost due to sickness absence). Figure 3.1 sets out the overall pattern for 2007 and 2006. There was a small decrease (0.1%) in the average number of days lost per WTE employee between 2006 and 2007. There was also a small decrease (0.2%) in the overall lost time rate.
29 The WTE employee is based on the estimated contracted time that each of the approximately 35,000
employees was scheduled to work.

34 Sickness Absence in the Civil Service
Figure 3.1 Summary Analysis of Absence in the Civil Service, 2007 and 2006
2007 2006
Number of employees who worked in the Civil Service each yeara 35,185 33,939 Total WTE employeesa 30,539.36 29,805.89 Total working days availableb 6,993,513 6,825,549 Number of working days lost to sickness absencec 345,105 337,234 Number of absences 59,400 58,860 Number of employees who availed of sick leave 20,768 20,723 Percentage of employees who availed of sick leave 59.03% 61.06% Average number of sick days (working days) per employee 9.81 9.94 Average number of sick days (working days) per employee who took sick leave 16.62 16.27 Average number of absences per employee 1.69 1.73 Average number of absences per employee who took sick leave 2.86 2.84 Average length of each absence 5.81 5.73 Average number of sick days per WTE employeec 11.30 11.31 Average number of absences per WTE employee 1.95 1.97 Lost time rated 4.93% 4.94% Source: Analysis by Office of the Comptroller and Auditor General Notes: a For the purposes of distribution of absence above, absence per employee is based on actual head
count while absence per WTE employee takes account of the contracted time that each employee was scheduled to work, including the portion of the year worked by starters and leavers.
b The calculation for total working days available is based on 229 working days multiplied by the total number of WTE employees. The 229 days is net of weekends, bank holidays, privilege days and the statutory annual leave allowance of 20 days.
c This includes days lost to unauthorised absence. d The lost time rate is calculated as the time lost due to sickness absence as a percentage of the
contracted working time in each period.
Extent of Absence
3.4 At 1.95 per WTE the frequency of absence ranges from almost one absence per WTE employee in the President’s Establishment to over three absences per WTE employee in the Property Registration Authority. On average 59% of all staff employed took sick leave in 2007. This ranges from 42% of staff in the Department of Arts, Sport and Tourism to 76.5% in the State Laboratory. This is displayed graphically in Figure 3.2 and the underlying figures are set out in Appendix F.
3.5 The average length of each absence across the Civil Service is almost six days. This ranges from an average length of three and a half days in the Office of the Director of Public Prosecutions to almost eleven days in the President’s Establishment.
3.6 The rate of change in the lost time rate by individual department between 2006 and 2007 varied from a decrease of 24% in the Houses of the Oireachtas to an increase of 30% in the Public Appointments Service. However, factors such as staff turnover (for example, decentralisation and recruitment of temporary staff) and the extent of long term sickness absence may impact on these results.

Pattern of Sickness Absence 35
3.7 Figure 3.2 depicts the percentage of employees (based on headcount) in each department that took sick leave, the number of absences per employee (based on headcount) and the lost time rate which is the lost time expressed as a percentage of time contracted for.
3.8 In general, the pattern suggests that those departments where a greater proportion of staff take sick leave largely coincide with those where the staff who take sick leave take more of it.
3.9 In 2007, the rate of absence varied for each department ranging from 2.39% in the Department of the Taoiseach representing an average of almost five and a half sick days per WTE employee to 6.96% in the Property Registration Authority representing an average of almost 16 days per WTE employee.

36 Sickness Absence in the Civil Service
Figure 3.2 Incidence, Frequency and Lost Time Rate by Department for 2007 compared with Average
Percentage of employees who took sick leave Number of absences per employee
Lost time rate
Average 59.03% Average 1.69 Average 4.93%
41.9%
42.9%
44.2%
45.0%
48.1%
49.2%
50.9%
51.7%
53.7%
53.7%
54.4%
54.7%
55.6%
56.4%
59.7%
60.3%
60.7%
60.9%
61.5%
64.0%
64.8%
64.9%
65.3%
66.3%
66.5%
66.9%
69.2%
76.2%
76.5%
30% 40% 50% 60% 70% 80%
DAST
Taoiseach
OPW
DAFF
President's Est
Foreign Affairs
Oireachtas
Valuation Office
DCENR
DJELR
Courts
DEHLG
DCRAGA
Finance
DETE
DHC
Attorney Gen.
DES
Transport
Defence
Revenue
Ombudsman
DPP
CSSO
CSO
PAS
DSFA
PRA
State Lab
1.1
1.3
1.2
1.2
0.8
1.7
1.2
1.6
1.4
1.4
1.4
1.6
1.5
1.4
1.7
1.8
1.6
2.1
1.8
1.9
1.8
2.5
2.7
1.8
1.8
2.2
2.0
2.7
2.9
0 1 2 3
3.6%
3.4%
4.0%
4.5%
3.7%
5.0%
5.1%
4.3%
4.3%
4.1%
3.4%
3.6%
5.1%
5.7%
3.9%
4.9%
6.2%
5.0%
5.2%
4.5%
4.6%
4.3%
6.1%
6.0%
6.6%
7.0%
5.4%
2.4%
2.8%
2% 3% 4% 5% 6% 7%
Source: Analysis by Office of the Comptroller and Auditor General Note: Refer to list of abbreviations at start of report for full name of departments.

Pattern of Sickness Absence 37
3.10 Figure 3.3. expresses the days lost to sickness absence in terms of the average for each WTE employee.
Figure 3.3 Average Number of Sick Days per WTE Employee
0 2 4 6 8 10 12 14 16
Taoiseach
Oireachtas
OPW
DCRAGA
Finance
DAST
Foreign Affairs
Attorney Gen.
DAFF
DEHLG
DJELR
Courts
CSSO
Ombudsman
President's Est.
DPP
DES
Valuation Office
Defence
DCENR
DETE
Revenue
State Lab
DHC
PAS
CSO
Transport
DFSA
PRA
Average number of sick (working days) per WTE employee
Civil Service Average
11.30 days
Source: Analysis by Office of the Comptroller and Auditor General

38 Sickness Absence in the Civil Service
Staff with Full Attendance
3.11 The emphasis on absence rates in this report should not obscure the fact that that on average, over 40% of staff who served in Civil Service departments during 2007 did not take sick leave. This varied from 58% in the Department of Arts, Sport and Tourism to 23.5% in the State Laboratory as outlined in Appendix F.
3.12 While different factors impact on the extent and frequency of sickness absence, there would be merit in departments reviewing the distribution of absence amongst employees with a view to establishing whether absence is concentrated in particular areas of the department and associated with particular types of work.
Certified and Uncertified Absences
3.13 Although only 9% of days were taken as uncertified or unauthorised leave, these days accounted for over 40% of all instances of sickness absence as shown in Figure 3.4. The average length of each uncertified absence was 1.3 days.
3.14 Nearly 60% of all absences taken in 2007 were certified absences. These absences represented over 90% of the total working days lost due to sickness absence in 2007. The average length of each certified absence was nine days. This varied from almost five days in the Office of the Director of Public Prosecutions to over 14 days in the President’s Establishment. Details for all departments are set out in Appendix G.
Figure 3.4 Distribution of Certified and Uncertified Absence in the Civil Service, 2007
Percentage of Sick Days by Absence Typea Percentage of Instances by Absence Typea
91%
9%
Certified
Uncertified
58%
42%
Certified
Uncertified
Source: Analysis by Office of the Comptroller and Auditor General Note: a Unauthorised absence which represents 0.16% of overall sick days and 0.3% of overall absences is not
reflected above. The average length of an unauthorised absence was 3.1 days.

Pattern of Sickness Absence 39
Timing of Absence
3.15 Over half of all absence taken in 2007 commenced on either a Monday (32%) or a Tuesday (22%) as shown in Figure 3.5.
Figure 3.5 Distribution of Instances of Absence by Day of Commencement, 2007
0%
5%
10%
15%
20%
25%
30%
35%
Monday Tuesday Wednesday Thursday Friday
Percentage of instances of sick leavecommencing on each day of the week
Source: Analysis by Office of the Comptroller and Auditor General
3.16 Of uncertified instances which commenced on a Monday, over half were taken by the Clerical Officer grade. The Clerical Officer grade accounted for 35% of overall staff for 2007. Appendix H sets out more detail in this respect.
3.17 In 2007, the highest number of uncertified sick days and absences were taken in January. These instances represented one eighth of all uncertified absences for the year. Half of all uncertified instances in 2007 were taken in the five winter months from October to February30.
Absence by Grade
3.18 In line with the findings of other research and reports on sickness absence31 – in general, the absence rate is higher in junior grades while it is relatively lower for management grades.
3.19 Almost half of all working days lost due to sickness absence in 2007 were taken by Clerical Officers. Three quarters of all Clerical Officers (WTE) availed of sick leave and the average number of days lost for the year by Clerical Officers was 16 days as shown in Figure 3.6.
30 This analysis is based on absences taken in the year 2007. 31 Management of Sickness Absence in the Northern Ireland Civil Service, NIAO, May 2008 and Cabinet
Office, Analysis of Sickness Absence in the Civil Service for the financial year 2006-07, RED Scientific Limited.

40 Sickness Absence in the Civil Service
Figure 3.6 Distribution of Sickness Absence in the Civil Service by Grade, 2007
Grade Number of WTEs in Gradea
Percentage of Total WTEs
Percentage per WTE that took
Sick Leave
Percentage of Days lost per
Grade Type
Average Days lost
per WTE in Grade
Senior Managementb
1,411 5% 26% 1% 3
Assistant Principal 3,083 10% 39% 5% 6 Administrative Officer
1,791 6% 43% 3% 7
Higher Executive Officer
3,387 11% 58% 9% 9
Executive Officer 6,157 20% 66% 19% 10 Staff Officer 1,417 5% 72% 5% 12 Clerical Officer 10,604 35% 75% 49% 16 Non-payscales 119 0% 12% 0% 4 Professional and Technicalc
1,064 3% 49% 3% 8
Otherd 1,506 5% 52% 6% 13 Total 30,539 100% 61% 100% 11.30 Source: Analysis by Office of the Comptroller and Auditor General Notes: a WTE employees are based on the actual contracted time for each grade which takes account of the
portion of the year worked by starters and leavers. b This covers Principal Officer grade and upwards. c This covers numerous professional and technical posts covering a number of different grades. d This covers Cleaners, Non-Administration Posts, Services Officers and Others.
Sickness Absence by Gender
3.20 In 2007, 55% of staff resources of departments covered in the examination were female as detailed in Figure 3.7. The examination found
70% of female staff and 50% of male staff availed of sick leave in 2007
female staff absence accounted for 68% of all working days lost
the average number of sick days taken by each female employee was almost 14 days, while the average for each male employee was over eight days.

Pattern of Sickness Absence 41
Figure 3.7 Analysis of Civil Service Absence, by Gender, 2007
Female Malea Total
Number of WTE employeesb by grade, 2007
16,873 13,666 30,539
As percentage of total WTE employees 55% 45% 100% Percentage per WTE employee who availed of sick leave
70% 50% 61%
Number of sick days taken 233,741 111,364 345,105 Sick days as percentage of total days 68% 32% 100% Number of instances of absence 40,728 18,672 59,400 Instances of absence as percentage of total absences
69% 31% 100%
Average sick days per WTE employee 13.85 8.15 11.30 Average number of instances per WTE employee
2.41 1.37 1.95
Source: Analysis by Office of the Comptroller and Auditor General Notes: a Includes a small number of cases where gender was not specified. b WTE employees are based on the actual contracted time for each gender which takes account of the
portion of the year worked by starters and leavers.
3.21 These results compare favourably with the NICS where the average working days lost for female employees was almost 18 days for the year 2006-07 and almost 10 days for male employees32. In the UK Civil Service33, the average working days lost for female employees were 10.7 days and 7.8 days for males34.
Sickness Absence and Age
3.22 A discussion paper on ‘Ageing in the Irish Civil Service’ published in 200635 noted that
in the preceding 20 years the proportion of staff in the 40 to 60 age category has increased almost four-fold, while at the same time staff numbers under the age of 30 have declined considerably
the average age of the Civil Service rose from 34 in 1985 to 41 in 2004
the proportion of staff over 50 years is projected to increase from 25% to around 45% within a decade36.
32 Management of Sickness Absence in the Northern Ireland Civil Service, NIAO, May 2008 and Analysis
of Sickness Absence in the Northern Ireland Departments 2006/2007, Northern Ireland Statistics and Research Agency.
33 This includes 115 departments across England, Scotland and Wales. 34 Cabinet Office, Analysis of Sickness Absence in the Civil Service for the financial year 2006-07, RED
Scientific Limited, November 2007. 35 The discussion paper ‘Ageing in the Irish Civil Service: A Human Resource Management Response’
was published by the IPA in 2006 in association with the Committee for Public Management Research. 36 This is based on one set of forecasts prepared by the Department of Finance. However, it is likely to be
impacted on by the May 2009 proposals to introduce enhanced early retirement provisions.
42 Sickness Absence in the Civil Service
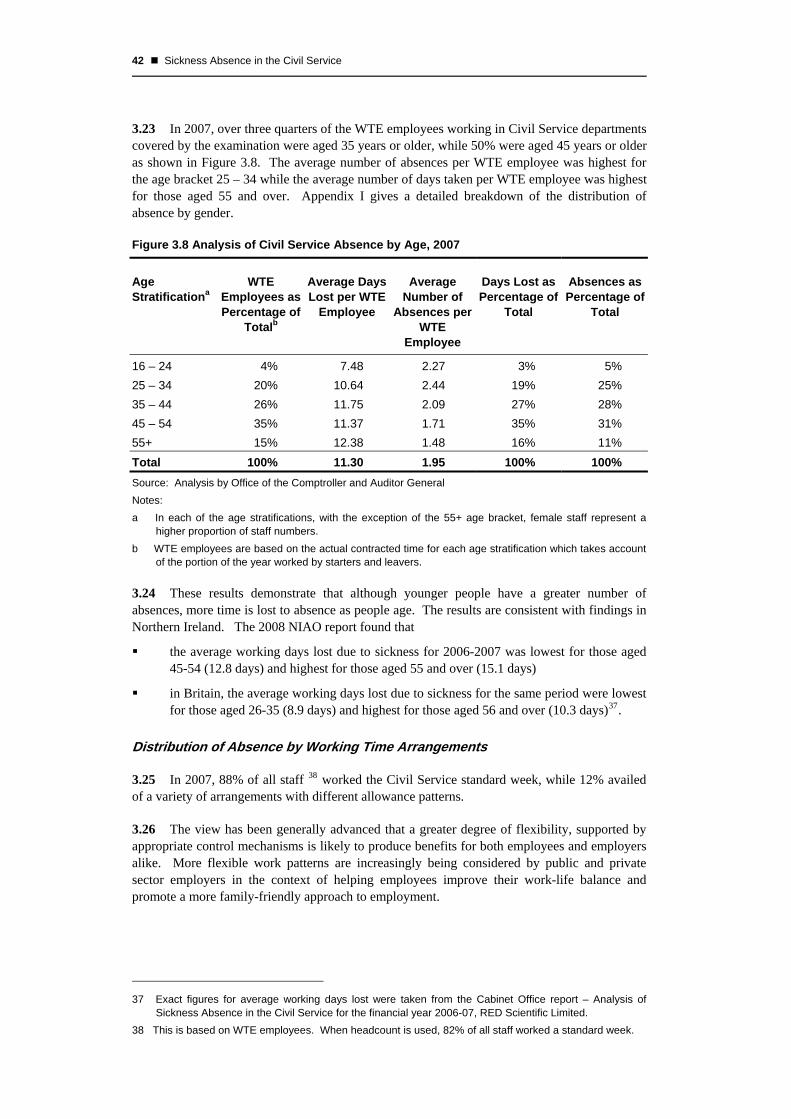
3.23 In 2007, over three quarters of the WTE employees working in Civil Service departments covered by the examination were aged 35 years or older, while 50% were aged 45 years or older as shown in Figure 3.8. The average number of absences per WTE employee was highest for the age bracket 25 – 34 while the average number of days taken per WTE employee was highest for those aged 55 and over. Appendix I gives a detailed breakdown of the distribution of absence by gender.
Figure 3.8 Analysis of Civil Service Absence by Age, 2007
Age Stratificationa
WTE Employees as Percentage of
Totalb
Average Days Lost per WTE
Employee
Average Number of
Absences per WTE
Employee
Days Lost as Percentage of
Total
Absences as Percentage of
Total
16 – 24 4% 7.48 2.27 3% 5% 25 – 34 20% 10.64 2.44 19% 25% 35 – 44 26% 11.75 2.09 27% 28% 45 – 54 35% 11.37 1.71 35% 31% 55+ 15% 12.38 1.48 16% 11% Total 100% 11.30 1.95 100% 100% Source: Analysis by Office of the Comptroller and Auditor General Notes: a In each of the age stratifications, with the exception of the 55+ age bracket, female staff represent a
higher proportion of staff numbers. b WTE employees are based on the actual contracted time for each age stratification which takes account
of the portion of the year worked by starters and leavers.
3.24 These results demonstrate that although younger people have a greater number of absences, more time is lost to absence as people age. The results are consistent with findings in Northern Ireland. The 2008 NIAO report found that
the average working days lost due to sickness for 2006-2007 was lowest for those aged 45-54 (12.8 days) and highest for those aged 55 and over (15.1 days)
in Britain, the average working days lost due to sickness for the same period were lowest for those aged 26-35 (8.9 days) and highest for those aged 56 and over (10.3 days)37.
Distribution of Absence by Working Time Arrangements
3.25 In 2007, 88% of all staff 38 worked the Civil Service standard week, while 12% availed of a variety of arrangements with different allowance patterns.
3.26 The view has been generally advanced that a greater degree of flexibility, supported by appropriate control mechanisms is likely to produce benefits for both employees and employers alike. More flexible work patterns are increasingly being considered by public and private sector employers in the context of helping employees improve their work-life balance and promote a more family-friendly approach to employment.
37 Exact figures for average working days lost were taken from the Cabinet Office report – Analysis of
Sickness Absence in the Civil Service for the financial year 2006-07, RED Scientific Limited. 38 This is based on WTE employees. When headcount is used, 82% of all staff worked a standard week.

Pattern of Sickness Absence 43
3.27 Notwithstanding this, the examination found that the rate of sickness absence is, in general, higher in the case of staff with flexible working arrangements. The average number of days lost for those working a three day week was almost 80% higher compared with those who worked the standard week. Figure 3.9 outlines the relative attendance performance for each work pattern.
Figure 3.9 Distribution of Absence by Working Time Arrangement, 2007
Working Pattern
Number of WTE
Employeesa
Percentage of Total
WTE Employees
Percentage of Total
Sick Days
Percentage of Total
Instances
Average Number of Days Lost per
WTE Employee
Average Number
of Instances per WTE
Employee
Civil Service Standard Week
26,733 88% 82% 81% 10.57 1.81
Four Days a Week
1,350 4% 7% 7% 17.12 2.94
Three Days On / Two Days Offb
572 2% 2% 3% 13.68 2.70
Three Days a Weekb
617 2% 3% 3% 18.81 3.07
Half Day On / Half Day Off
430 1% 2% 3% 15.15 3.83
Subtotal 29,702 97% 96% 97% 11.16 1.93 All Otherc 837 3% 4% 3% 16.21 2.37 Total 30,539 100% 100% 100% 11.30 1.95 Source: Analysis by Office of the Comptroller and Auditor General Notes: a WTE employees are based on the actual contracted time for each working time arrangement which
takes account of the portion of the year worked by starters and leavers. b It is assumed that both these working arrangements are not the same. c This covers 24 different HRMS classifications of work sharing pattern. There may be some overlap
between a number of these classifications which were not considered material.
3.28 The Department of Finance stated that the Civil Service’s HR strategies have to reflect both national law and its general responsibilities as a major public service employer. In particular, it noted that its HR strategies must reflect national policy on diversity and equality, best practice on staff management and a caring attitude towards staff welfare. In the longer term, it is believed that this commitment is beneficial both to the Civil Service, for example by increasing the pool of workers available to it for recruitment and to society in general. The Civil Service actively recruits staff with disabilities and makes significant efforts to retain persons with acquired disability in the workplace. The Department also noted the age and gender profile of staff and the high number of persons with family responsibilities.

44 Sickness Absence in the Civil Service
Short Term and Long Term Absence
3.29 95% of all instances of sick leave taken in 2007 fell into the short term absence category (20 days or less) as shown in Figure 3.10. These absences accounted for 51% of all sick days taken and the average length of each absence was over three days. On the other hand, long term absence (greater than 20 days) accounted for 49% of all sick days taken and the average length of a long term absence was 62 days.
Figure 3.10 Distribution of Short Term and Long Term Absence, 2007
Distribution of Short and Long Term Absence by Percentage of Sick Days
Distribution of Short and Long Term Absence by Percentage of Instancesa
49%
51% Less than or Equalto 20 Days
More than 20 Days
5%
95%
Less than or Equalto 20 Days
More than 20 Days
Source: Analysis by Office of the Comptroller and Auditor General Notes: a Certified instances of absence represent 58% of all absences in 2007.
3.30 Because a small number of staff account for a large number of days absence, a reduction in the level of long term sickness absence would have a relatively greater impact on the level and cost of absence. Implementing good practice absence management initiatives to effectively deal with an absence earlier with a view to reducing the average number of working days lost to absence by each employee and to prevent recurring instances of absence could result in substantial overall reductions.
3.31 The longer a person is out of work, the harder it is to return. In a letter to Personnel Officers in June 2008, the CMO pointed out that medical evidence suggests that even when employees are off work for as little as eight weeks, they begin to become de-conditioned from work and it is harder for them to successfully resume work.
3.32 Timely intervention is key to ensuring that employees on long term absence return to work at the earliest reasonable point. Early occupational health intervention39 after 10-15 days absence has been shown in many instances to have dramatic effects on long term absence40. Early intervention can be very effective in avoiding deterioration into long term absence. In this
39 The provision of occupational health services and rehabilitation programmes were rated as the top two
most effective practices for managing long term absence in the Chartered Institute for Personnel and Development’s annual absence management survey reports for 2007 and 2008.
40 CollierBroderick Management Consultants.

Pattern of Sickness Absence 45
connection, it is acknowledged that while occupational health measures may significantly reduce rates of sickness absence, they themselves carry a cost.
Distribution by Location
3.33 In 2007, of the departments covered by the study, 55% of employees worked in Dublin with the remaining 45% based in different locations outside of Dublin. The examination found that, in general, the distribution of absence and related sick days is broadly in line with the distribution of staff for each location. However, in overall terms, absence in Dublin is lower compared with other locations throughout the country.
Distribution by Employment Status
3.34 Three quarters of all staff employed by Civil Service departments in 2007 who held substantive or confirmed appointments accounted for over 80% of all sick days in that year. The extent of absence of staff by tenure is set out in Figure 3.11.
Figure 3.11 Distribution of Absence by Staff Type, 2007
Employment Class Descriptiona
Number of WTE
Employeesb
Percentage of Total
WTE Employees
Number of Sick Days
Percentage of Total
Days
Number of Instances
Percentage of Total
Instances
Confirmed / Substantive
22,795 75% 278,027 80% 46,301 78%
Probation 5,005 16% 46,786 14% 9,066 15% Acting 1,140 4% 9,382 3% 1,930 3% Otherc 1,599 5% 10,910 3% 2,103 4% Grand Total 30,539 100% 345,105 100% 59,400 100% Source: Analysis by Office of the Comptroller and Auditor General Notes: a Staff hold confirmed or substantive appointments following successful completion of a probationary
period in a new or promoted role. Staff are on probation prior to being confirmed. Other staff can be in acting appointments for a variety of reasons.
b WTE employees are based on the actual contracted time for each staff type which takes account of the portion of the year worked by starters and leavers.
c This covers miscellaneous classifications.
Medical Reasons for Absences
3.35 Almost 490 illness types were recorded for certified absence in 2007. The top eight frequently recorded categories were found to represent 42% of all certified instances of absence and accounted for 46% of sick days. The most common illnesses after linking related illness types together41 were as shown in Figure 3.12.
41 Linking of absences is confined to the top 40 frequently recorded categories in 2007.

46 Sickness Absence in the Civil Service
Figure 3.12 Reasons for Certified Absence in the Civil Service for 2007a
Reason Number of Sick Days
As Percentage of Total
Number of Instances
As Percentage of Total
Stress/Depression 30,376 10% 1,262 4% Respiratory Related 26,990 8% 5,119 15% Surgery 23,795 7% 1,238 3% Pregnancy Related 17,688 6% 1,628 5% Back Ache/Pain 12,558 4% 1,245 4% See Cert on Fileb 11,387 4% 888 2% Viral Infections 11,335 4% 2,059 6% Otherc 10,346 3% 1,137 3% Total 144,475 46% 14,576 42% Source: Analysis by Office of the Comptroller and Auditor General Notes: a These are the top eight certified reasons. b The actual nature of the illness is not recorded in these cases. c The nature of the illness was not specified in these cases.
3.36 Five of the 29 departments record the nature of uncertified absence as ‘non applicable’. Over one third of all instances of uncertified absence for 2007 are classified as ‘non applicable’42. A further 4% is classified as ‘other’ while the remainder is recorded in over 200 different illness classifications. The top five43 causes of uncertified absence for 2007 were stomach complaint (13%), flu/influenza (8%), cold (7%), upset stomach (5%) and migraine (5%) representing over one third of all uncertified sick days availed of.
UK Comparisons
3.37 The findings of this examination are broadly consistent with UK studies in the public sector.
The Health and Safety Executive in the UK found that work-related stress is one of the most common reasons for ill-health in the UK, accounting for over one third of all new incidences of ill-health (Health and Safety Statistics 2007-08).
Psychiatric/psychological illness is recorded as the main cause of absence in the NICS and accounted for 29% of the total working days lost in the period 2006-0744.
An analysis of data carried out by the National Audit Office (NAO) in the UK in its examination of the management of staff sickness absence in the Department for Transport and its agencies found that the main causes of sickness absence during 2005 and 2006 were due to mental health illnesses, including stress, giving rise to the highest number of working days lost each year – around 25%45.
A report by the Wales Audit Office46 commented that senior management have placed an increasing focus on managing stress amongst staff through occupational health
42 A portion of uncertified absence in all departments is classified as ‘non applicable’ with the exception of
the Office of the Director of Public Prosecutions and the Property Registration Authority. 43 These are based on the total number of instances of absence recorded for each illness on the HRMS. 44 Management of Sickness Absence in the Northern Ireland Civil Service, NIAO, May 2008. 45 This was not the main cause of absence in two of the six agencies reviewed. 46 The Management of Sickness Absence in the National Assembly for Wales, Wales Audit Office,
September 2006.

Pattern of Sickness Absence 47
consultations and counselling as well as department wide policies, training and initiatives, such as piloting the Health and Safety Executive’s Stress Management Standards. The steady reduction in absence throughout 2005 was attributable to falling levels of long term and/or psychological related sickness absence (average of eight days lost per member of staff of which less than two days (approximately) was attributable to psychological related absence).
Comparison with Illness Benefit Claims
In the period January to June 2003, the Department of Social and Family Affairs targeted for early intervention new illness benefit and injury benefit claimants, aged 20 to 50 years in Dublin and Cork who were certified by their General Practitioners to be suffering from lower back pain (LBP). This was done as part of a project (the Renaissance Projecta) to determine if early intervention, using international evidence-based guidelines in the assessment of claimants with LBP would decrease the incidence of progression to chronic disability. It was found that employing early intervention resulted in a significant reduction in the progression to chronic disability from simple LBP. The report recommended that ideally, to sustain and improve the effectiveness of early intervention a coalition of disability managers needed to be formed and that this coalition should implement a universally agreed, evidence-based protocol for best management of LBP.
The top 10 medical reasons for all illness benefit payments in 2007bwere
Back/neck/rib/disc 14.5%
Anxiety/depression 12.6%
Stress 5.6%
Post operation/surgery debility 4.7%
Arthritis/Rheumatism/Osteoarthritis 4.2%
Pregnancy related problems 3%
Nervous Debility/Bereavement 2.8%
Post Natal Depression 2.7%
Fracture/Broken 2.7%
Hypertension 2.5%
While differences in the recording and analysis of illness between the HRMS and the Department of Social and Family Affairs will give rise to differences in the distribution of absence between both sets of employeesc, the top reasons for Civil Service absence (per the HRMS) are mirrored in the overall national results for absence. Notes: a The report on ‘The Renaissance Project – Preventing Chronic Disability from Low Back Pain’ was published by the Department of Social and Family Affairs in September 2004. b This information was received from the Department of Social and Family Affairs and is based on a total of
70,404 illness benefit recipients for 2007. Note that almost 5% of cases were classified as ‘other’. This description is used where the client’s doctor has provided an illness/injury which is not classified by the Department.
c Claims for illness benefit made by post 1995 Civil Servants are included in the total for illness benefit recipients which gives rise to some overlap between both sets of employees.

48 Sickness Absence in the Civil Service
Management Information
3.38 The availability of a multitude of illness categorisations on the HRMS hinders a comprehensive analysis of the main reasons for sickness absence. Many categorisations are either interlinked or interchangeable. There is a risk that if absences are not further classified into broad categories that departments will not be in a position to identify the main illness reasons for their employees being out sick. This, in turn, impacts on departments’ ability to develop appropriate strategies to address particular areas of concern, for example, work related stress.
Approaches to Absence Management – Case Study 1
Illness Classifications
The World Health Organisation (WHO) has developed an International Classification of Diseases known as ICD categories. The current version (version 10) consists of 22 different categories of illness. This facilitates the categorisation of sickness absence according to the type of ailment or part of the body affected by the ailment. Analysis of reasons for sickness absence in the UK and NI Civil Services is carried out using the ICD categories. Similarly, the Department of Enterprise, Trade and Employment analysed its 2007 absence data using the ICD categories to facilitate comparative analysis and benchmarking with international governmental publications.
Targets and Performance Reporting
3.39 In general, Civil Service departments do not carry out any benchmarking exercises with similar departments, occupations or internationally in relation to sickness absence. While a few departments indicated that they monitor absence rates in similar type departments, this is not done in a formalised manner. The Department of Enterprise, Trade and Employment finalised a report on sickness absence for 2007 in August 2008. This report provides a comprehensive breakdown and analysis of the distribution of sickness absence across the Department’s main business areas and mirrors best practice criteria for the measurement of absence. It also facilitates comparative analysis and benchmarking with publications on absence in other jurisdictions (see Approaches to Absence Management – Case Study 7).
3.40 Only three departments use performance indicators for sickness absence. Of those, the Public Appointments Service is the only organisation which has set a target.
The Revenue Commissioners produce an annual internal performance report which contains sickness absence performance indicators disclosing the overall percentage of staff time lost to sickness absence and the percentage of time lost by grade. Statistics are also available at regional/divisional level and can be broken down to the level of each business unit led by an Assistant Principal.
The Department of Social and Family Affairs compiles the percentage of available working days lost to sickness absence by area/division led by a Principal Officer and the overall lost time rate for the department.
The Public Appointments Service computes the number of working days lost as a percentage of the total working days. It has set a target of 3%.

Pattern of Sickness Absence 49
Approaches to Absence Management – Case Study 2
Absence Reduction Targets
The Public Appointments Service is the only department that has set a specific target to reduce the level of absence due to sickness in the department. Target setting was introduced following the introduction of a revised absenteeism policy which emanated from a workplace project on a review of absenteeism in the departmenta. Targets for reducing absence were set taking into account the standards set in the private sector. According to the department, the current target of 3% was set at a realistic but stretching level. The aim is to stabilise the absence rate at 3% and then review the target with a view to reducing it further. The department informed the audit team that its average absence rate for 2008 was 3.24%b. Performance management and development planning forms are pre-populated to include adherence to the Absenteeism Policy and this is included in both manager and staff planning forms. a Reviewing absenteeism and developing an absenteeism policy for the Public Appointments Service, May
2004. b This is the Public Appointments Service’s own calculated rate of absence. This rate does not include
unpaid sick leave cases. Also, available working days are not adjusted to take account of annual leave.

50 Sickness Absence in the Civil Service
National and International Public Sector Comparisons
3.41 Figure 3.13 sets out the detail of some national and international public sector comparisons of absence levels.
Figure 3.13 National and International Comparisons of Absence Levels in the Public Sector
Reporting Period
Jurisdiction Source Organisations reported on
Lost Time Rate
Average Working Days
Lost
2007 Ireland OCAG Civil Service 4.93% 11.30
2008 Ireland HSE HSE 5.75%a – 2007/2008 Ireland DES Post Primary
Teachersb 6.3% c 7.74d
2007/2008 Ireland DES Primary Teachers 4.6% c 6.45d 2008 Ireland Prisons
Service Prisonse – 19.8
2007/2008 NI NISRA Civil Service 5.8% 12.9 2007/2008 NI NIAO Local Authorities 6.17% 13.7
2006/2007 UK Cabinet Office/RED Scientific
Civil Service 4.1% 9.3
2006 UK NAO Department of Transport and
Agencies
– 10.2
2005 Wales Wales Audit Office
National Assembly
– 8
2001/2002f Australia Australian National
Audit Office
Australian Public Service
– 8.7
Source: Publications and Relevant Bodies
Notes: a This is the rate for 2008 based on monthly absenteeism returns received from HSE areas of operation.
b These include teachers in secondary and community and comprehensive schools.
c This represents the lost time rate for teachers determined by the Department of Education and Science for the 2007/2008 school year. Teacher WTEs employed during the 2007/2008 school year were used to calculate the rate. The annual number of working days per annum for primary and post primary teachers is based on the number of days which schools are required to be open – 183 days for primary schools and 167 days for post primary schools.
d This is average number of certified sick days per WTE teacher. The Department has also identified that the average number of uncertified days per WTE teacher is 2.81 days and 1.98 days for post primary and primary respectively.
e Sick days recorded include rest days falling within a period of sick leave and therefore do not reflect the actual number of working days lost. Average absence is based on staff WTE numbers at 31 December 2008.
f The study was based on the extent and cost of unscheduled absence in the Australian Public Service. The 8.7 days reflects the average sick leave taken per full time equivalent employee.

Pattern of Sickness Absence 51
Comparison with Irish Public Sector Organisations
HSE
3.42 In February 2008, the HSE issued national guidelines47 setting out reporting requirements and processes for the health services to make monthly absenteeism returns48. This was followed in January 2009 with the issue of a policy on the management of attendance for all HSE employees and managers. The policy sets out the roles and responsibilities of employees and management and the sick leave procedures to be followed. A national absenteeism target rate of 3.5% h 49
as also been set .
3.43 The HSE recently compiled a comprehensive report for all available 2008 absence data. It informed the audit team that coverage for absenteeism across all HSE areas of operation in May 2009 was 99% compared with 80% coverage in Quarter 4 of 2008. The overall level of absence for the HSE (based on returns received) fell from 5.75% for 2008 to 4.54% in May 2009.
3.44 Currently, absenteeism (due to sickness) is not costed nationally for the HSE. In the past a very crude yardstick used by the HSE to cost absence found that nationally each 1% of absence equated notionally to approximately €60 million50.
3.45 However, the National Hospitals Office as part of its work on the development and implementation of a national absenteeism policy across the hospital network has estimated that the financial cost of a 1% increase in absenteeism in a major teaching hospital could be over €1 million per annum.
The Prison Service
3.46 Sickness absence in the Prison Service is governed by the general Civil Service terms and conditions of employment.
3.47 Traditionally the level of sickness absence in the Prison Service has been high and in the past was found to be a major contributing factor to the level of overtime in the Service. Overtime working has since been replaced with a new additional hours attendance system where staff are now contracted for a defined number of additional hours that cannot be exceeded in any year. Migration to an annualised hours system was intended to remove the incentive element of the link between sick leave and overtime. An assumption of a 33% reduction in sick leave was built into the new system. In 2008, a total of 67,988 days sick were availed of, representing 19.84 days per WTE staff member51. However, sick days recorded include rest days falling within a period of sick leave and do not therefore reflect the actual number of working days lost. In the period 2006 to 2008 there was a reduction of 24.4% in sick leave per WTE staff member52.
47 HSE HR Circular 08/2008, 5 February 2008. 48 Returns are submitted to the National Employment Monitoring Unit which forms part of the National
Human Resources Directorate of the HSE. 49 This rate is taken from the HSE’s Healthstat Metrics and Targets for Hospitals. 50 This was based on putting a financial value to ‘lost WTEs’ due to absenteeism using an old average
cost per WTE of €55,000. This cost is now likely to be in the region of €63,000 to €70,000 across HSE services.
51 This represents the average number of days per capita based on the total number of WTE staff serving at the end of 2008.
52 The corresponding decrease in the number of sick days availed of for the same period was 17.7%.

52 Sickness Absence in the Civil Service
3.48 Sickness absence is not currently costed by the Prison Service. In lieu of overtime lost all prison officers were paid a bonus payment of approximately €13,000 per officer, payable over a three year period. This payment was made in recognition of the reduction in earnings consequent on the change associated with the introduction of the ‘Additional Hours System’ and was dependent on full cooperation with the new system. The final payment of this lump sum of €3,750 was paid to all eligible officers in November 2008.
Teachers
3.49 The responsibility for the recording of sick leave rests with the school where the teacher is employed. Once the sick leave has been recorded on the On Line Claims System, the Department of Education and Science has access to the information53.
3.50 In the 2007/2008 school year the overall cost of substitution in primary and post primary schools in respect of both certified and uncertified sick leave was €62 million. This does not include the salary costs of those teachers who availed of sick leave. The Department of Education and Science commenced a review of supervision and substitution and related matters following the 2008 budget. New arrangements were introduced from January 2009. The department has found that there has been a reduction in the levels of uncertified sick leave taken by teachers across schools in the period January to the end of the 2008/2009 school year while levels of certified sick leave remained approximately the same for that period.
53 Reports can be produced from the system by the school and also by the Department of Education and
Science.

Pattern of Sickness Absence 53
Conclusions
3.51 There has been a significant increase in the level of sickness absence in the Civil Service since it was previously reviewed in the early 1980s.
3.52 Almost 5% of available working time was lost to sickness absence in 2007. On average 59% of all staff employed took sick leave in 2007. The average length of each absence across the Civil Service was almost six days. On average each WTE employee was absent for just over eleven days.
3.53 There was considerable variation in the days taken when the pattern was examined between grades, age, gender and work sharing arrangements.
3.54 The reasons for uncertified absence are not recorded by all departments. The non recording of reasons for uncertified absence militates against adopting effective strategies to manage and reduce this type of absence.
Recommendations
The foregoing pattern of absence suggests that management actions need to be tailored after appropriate research in a way that differentiates appropriately between the nature of the organisation, the grades of staff, the gender of employees and the various work patterns.
There would be merit in departments categorising the pattern and distribution of uncertified absence across grade, gender and age. The distribution and the nature of uncertified absence might be reviewed in order to identify any trends and possible causes of this absence. The Department of Finance could consider examining existing arrangements for uncertified absence perhaps considering the introduction of medical certification for all absence that commences on a Monday or on a Tuesday following a bank holiday weekend.
By focusing on long term absence management initiatives, departments may get better return in terms of reducing absence. Timely intervention in these cases with a view to getting people back to work quicker could have a significant impact on absence statistics. The Department of Finance should consider the development of a standard operating procedure on how long term absence should be managed. A first step would be to define long term and short term absence for the Civil Service.
Departments should ensure that all absence, including uncertified absence is recorded in accordance with the nature of the illness. Consideration should be given to the implementation of the WHO ICD categorisations for illnesses. This would facilitate comparison and benchmarking with similar sized departments and other jurisdictions.
Departments should identify key performance indicators for absence and set a specific target to achieve each year. They should also share information and good management practices for absence measurement and reduction.


4 Managing Sickness Absence 4.1 This chapter examines the framework and policies within which sickness absence in the Civil Service is managed, the measures used to discourage unwarranted absences, how well information on attendance is captured as well as the arrangements for its reporting and use. The practice in departments is reviewed in the light of the following good practice criteria.
Good Practice Absence Management
existence of comprehensive, relevant and understandable governing regulations
emphasis on line management responsibility for managing attendance
promulgation of clear policies and procedures
effective communication of policies and procedures to all staff
absence management procedures that distinguish between short and long term absences
appropriate use of disciplinary measures to tackle absence
recording and sharing of absence data with relevant managers
effective use of information to manage absence
production of relevant performance information
reporting of absence performance in order to inform absence management.
The Sickness Absence Regulations
Good Practice
In order to guide departmental administration it is important that rules and regulations governing sickness absence be comprehensive, relevant and understandable.
4.2 The rules and regulations governing sickness absence are set out in Appendix B.
4.3 The vast majority of departments consider that the rules and regulations governing sickness absence are comprehensive. However,
eight of the 29 did not consider them relevant to today’s environment and
ten departments believe that they are not easy to understand.
4.4 Ways suggested by departments for improving the regulation of sickness absence included
the review and consolidation of existing regulations into one composite document to give clearer guidance
a reduction in the existing allowances for sick leave
better support and guidance in handling sick leave
inclusion of certified and uncertified absence in the Disciplinary Code54
54 Disciplinary action may occur because of abuse of the sick leave regulations and not when an official is
genuinely sick.

56 Sickness Absence in the Civil Service
the existence of a help desk in the Department of Finance.
Recommendation
Given the concerns raised by departments concerning the regulatory framework governing sickness absence, there would be merit in taking those concerns on board in any further review of policy. While the ongoing active management of policy by the Department of Finance brings coherence to the process, it is desirable that guidance on absence management be up to date and easy to administer.
Devolving Responsibility for Absence Management
Good Practice
Human resource management (HRM) in many organisations is moving away from centralised management of personnel and towards devolution of key elements including attendance management to line managers. This makes sense because line managers are the people who are aware that a certain employee is absent, are best placed to understand the circumstances around an individual’s absence and to identify a problem at an early stage.
4.5 Notwithstanding this trend, the application of HR policies within departments remains centrally managed. However, to some extent this is a matter of degree. Eleven departments stated that while absence related policies are applied centrally, some aspects55 have been devolved to line management. In all departments, line managers have certain day-to-day responsibility for the management of attendance and communication of instances of absence to HR in line with sick leave regulations.
Approaches to Absence Management — Case Study 3
Devolution
The devolution process in the Office of the Revenue Commissioners is working on the basis of devolving to line management the most straightforward aspects first.
Phase 1 of the programme involved the devolution of annual leave, flexible working hours and special leave. Phase 2 which was rolled out in 2003 included the devolution of the management of sick leave on full pay.
In an organisation the size of Revenue, it is considered that the local manager is best placed to monitor absence levels and to issue letters when trigger points for absence are reached. It is the manager’s responsibility to check compliance with regulations for sick certificates, and notification procedures. Tasks devolved include the issue of warning letters, the monitoring of pro rata entitlements for probationers and jobsharers and instances where sick leave limits are exceeded. Letters are also issued where there is non-compliance with sick leave regulations. Guidelines were published internally to aid local management in carrying out these responsibilities and in the general management of sick leave as part of their managerial responsibilities.
Revenue has devised a suite of sick leave letters based on the procedures enshrined in Department of Finance and CMO guidelines. These letters are available on its intranet site for communal use.
55 Standard line management duties were outlined in some instances.

Managing Sickness Absence 57
For example, if an employee is out on long term sickness absence for 30 consecutive days, a letter is issued signalling that a medical report will be sought should the absence continue for six weeks or more. After 42 days, a letter requesting a medical report is issued. The report must be submitted to the CMOa.
All half pay, pension rate of pay, CMO referrals and ill-health retirement cases are managed centrally by HR.
Revenue intends to carry out a review of devolved HRM in 2009 to establish how the model is working and to establish if it needs modification in advance of the rolling out of the final phase of devolution. a In early 2009, the CMO introduced a new protocol which requires all sickness absence to be notified to the
CSOHD, when 28 consecutive days have been reached.
4.6 Devolution (of functions other than standard line management involvement) has also been implemented in the Department of Foreign Affairs and the Courts Service.
In the Department of Foreign Affairs the recording of absences is devolved in the three Passport Offices – Balbriggan, Dublin and Cork and also in Irish Aid in Limerick.
Regional offices within the Courts Service record all sick leave within their respective areas. They update the HRMS and notify HR of any longer term sickness absence. Managers have responsibility for recording and monitoring the sick leave of the staff reporting to them.
4.7 The Department of Foreign Affairs stated that its experience had been that the devolution of aspects of sickness absence management to line mangers led to better management and helped heighten awareness of absence levels amongst staff.
Recommendation
The devolution of responsibility for absence management to line managers has increased in recent years. Line management’s active involvement in a department’s absence procedures is pivotal to the overall effectiveness and success of an absence policya. The appropriate extension of devolution in departments could lead to more effective absence management. However, the central support to line management would need to be in place in order to ensure that such a change was effective. A clear definition of the roles and responsibilities of line managers and HR should be set. Also, HR should ensure consistency of approach and application across the department. a Employee Absenteeism, a Guide to Managing Absence, IBEC September 2004.

58 Sickness Absence in the Civil Service
Absence Policy
Good Practice
The key to a successful absence policya is one which
demonstrates management’s commitment to the health, safety and welfare of staff
provides for whole of organisation ownership through communication and consultation
demonstrates clarity around roles and responsibilities
provides training to ensure consistency in approach combined with flexibility for individual circumstance
includes the removal of incentives to absence. a Working Well Together, Managing Attendance in the Public Sector, UK Cabinet Office 1998.
4.8 To date, half of all departments surveyed have developed or are in the process of developing an Attendance Management Policy and/or an Absence Management Programme56.
4.9 Steps taken by departments in the policy development process included
ratification of the policy by either the Management Advisory Committee or Senior Management Team or both
input from line managers, widespread consultation throughout the department, and endorsement by staff associations through partnership
research of good practice
research into absence statistics.
4.10 There remains doubt about how comprehensive these policies are
only five departments with a defined policy in place said that the policy set out management’s commitment to reducing sickness absence
four57 departments asserted that the policy was linked to the department’s business objectives
three departments stated that some analysis of the specific causes of absence, including research into factors influencing absence was undertaken as part of the policy development process.
56 While departments replied ‘yes’ to the existence of a policy/programme, not all of these departments have
developed a composite document. 57 This includes three of the departments that stated the policy set out management’s commitment to
reducing sickness absence.

Managing Sickness Absence 59
Approaches to Absence Management – Case Study 4
Attendance Management Policy
In May 2005, the Department of Social and Family Affairs published its first Attendance Management Policy. The main objectives of the policy were to
incorporate existing procedures regarding attendance in one document and
set out a range of practical and balanced approaches aimed at fostering a high level of attendance in the department.
In the foreword to the policy the Secretary General stated that the policy was aimed at addressing the issues causing and arising from absenteeism and that one of its key principles was that managers and staff both have a responsibility to discuss attendance issues in a constructive and fair manner.
The development of the policy involved consultation with support and service delivery areas across the department, discussion and consultation through the partnership process, liaison with similar departments, review of national and international research and taking account of the department’s internal working group report on absenteeism. The policy was advertised extensively throughout the Department and every member of staff received a copy.
The policy clearly sets out the responsibility of the employee, the manager and HR with regard to attendance management. The responsibilities of these key players and those of senior management are also reflected in the critical success factors to the implementation of the policy, including the collection and regular communication of statistical data. The policy clearly outlines that individual line managers will play the lead role in ensuring the effective implementation of the policy and in managing attendance in their areas of responsibility. A set of key performance indicators has also been incorporated into the policy. From HR’s perspective, the policy stands on its own in terms of roles and responsibilities.
4.11 A review by the Department of Social and Family Affairs of its policy was undertaken in March 2009. This focussed on the implementation of the policy and the effectiveness or otherwise of its various elements. The review found that most of the 13 strategy elements in the policy had been initiated at least to some degree but it was considered that the measures introduced in the policy have not had the expected impact. It was also found that most of the absence measures indicate only slight or negligible improvements in certain key statistics since the introduction of the policy.
4.12 Arising from the review, the Department of Social and Family Affairs proposes to take action to raise awareness of the challenges that absence presents and to help foster a culture of attendance as apart of an integrated HR strategy. A number of measures will be effected which will include recognising good attendance where possible, increased communication and awareness of expected standards of attendance, enhanced procedures for return to work meetings, and increased supports for managers.
Recommendation
Departments need to place a greater emphasis on adopting a policy on absence management that includes targets, links to business objectives and clarifies roles and rules.

60 Sickness Absence in the Civil Service
Staff Awareness
Good Practice
Unless staff are aware of the policies and procedures governing absence management and the services made available by departments to promote wellbeing and attendance staff behaviour in these areas will not be influenced in line with HRM objectives. Consequently, communication of absence management policy is key to its successful implementation.
4.13 A number of different approaches are used by departments to create awareness amongst staff of the guidelines, procedures and policies regarding absence management and the initiatives adopted to promote wellbeing and attendance. The main approaches used are
publication of the information on intranet sites
regular information sessions and/or courses on various health related issues, including the issue of office notices
the dissemination of policies and procedures as part of induction training and/or starter packs which are given to new entrants
staff handbooks which detail the relevant information.
Approaches to Absence Management – Case Study 5
Communication of Absence Policy
The Public Appointments Service introduced a revised absenteeism policy in 2004. The policy outlines the sick leave rules and regulations and the procedures to follow when sick leave is availed of. Staff must sign the policy, return the signed copy to HR and retain a copy for reference purposes. It is also clearly stated that failure to comply with the policy may result in disciplinary action, up to and including dismissal.
Prior to the review of absence policies and procedures the absence rate for the Public Appointments Service was 5%a. HR observed that when employees were approached in relation to their sickness absence levels, it was clear that they were not aware their sickness absence was so high. HR now sends a letter to staff members after each instance of sickness absence outlining the rolling total of their sick leave over the previous four year period. This facilitates employee tracking of sick leave and highlights when employees are approaching sick leave limits. HR find that people are now more self-regulating in line with policies. HR also intervene earlier if a doctor’s certificate is not received or if policies and procedures are not followed correctly. While line managers initially carry out this function, HR provide assistance if required. a Public Appointment Service’s own calculated rate of absence.
Recommendation
All departments need to consider whether the practices and measures that they have in place are sufficient to ensure that staff are aware of the attendance policy and that clear absence policies and procedures are communicated both at induction and at regular intervals throughout the year. Clear consequences for failure to notify or follow proper procedure or abuse of sick leave allowances should be set out.

Managing Sickness Absence 61
Absence Management Procedures
Good Practice
Absence management requires the use of different approaches and separate procedures for the management of short and long term absence. The key elements of good practice for each type of absencea are
Short Term Absence Management Long Term Absence Management
Line managers responsible for implementing policy, including original call management, ensuring notification procedure and sick leave procedure are followed, and return to work interviews
Early Intervention
Monitoring trigger points, including notifying employee, monitoring the days absence occurs and absence review meetings
Keeping in Contact
Disciplinary investigation for breach of procedures
Disciplinary Procedures, including breach of Contract Investigations
Investigation/Medical Review Case Management
Sick Pay Restrictions Return to Work and Re-integration Strategies
Fitness to Return to Work Certificates Fitness to Return to Work Certificates
Counselling/Employee Assistance Programme
Occupational Health Involvement/Rehabilitation
Counselling/Employee Assistance Programme
a CollierBroderick Management Consultants
4.14 Civil Service departments have adopted a number of different approaches that mirror the good practice elements above. These approaches are outlined in some detail in Appendix J. The five most effective approaches identified by departments for managing absence are set out in Figure 4.1. Of the departments surveyed, 20 of the 29 consider the referral of cases to the CMO as the most effective approach to managing absence.
Figure 4.1 Most Effective Approaches Used by Departments for Managing Absence
Approach Number of Departments Rating this Approach in their Top 5
Referral to Chief Medical Officer 20 Employee Assistance Service 17 Line Management Involvement 15 Disciplinary Procedures 11 Restricting Pay 9 Source: Survey of departments

62 Sickness Absence in the Civil Service
4.15 Twenty three departments were of the view that procedures used in the management of short term absence were effective while 18 departments were of the view that procedures in place for the management of long term absence worked58.
4.16 In those departments that altered their approaches in recent times (less than half of the 29 surveyed) the main changes were
earlier intervention by the CMO and EAS
greater emphasis on implementation of sick leave procedures
better communication and monitoring of staff on long term absence
return to work interviews
case conferences and reviews.
4.17 In general, these departments were of the view that the changes in procedures had a positive impact and had led to a fall in sick leave. However, some found that, improvement was marginal and the Property Registration Authority was of the view that there had been no change.
4.18 Almost half of the departments concluded that changes were required to enhance absence management. The main changes identified were the need for more line management involvement, early intervention and improvements in absence reporting.
Recommendation
There appears to be scope for Civil Service departments to consider the good practice procedures outlined above including wider use of return to work interviews and share more widely the specific interventions that have been found to work well in practice.
Sickness Absence and Disciplinary Procedures
Good Practice
One of the most direct means of tackling absence is the adoption of disciplinary procedures. The use of disciplinary procedures to tackle unacceptable absence signals to employees that unjustified absence will not be tolerated and that absence policies will be enforced. However, disciplinary action is best built upon a documented performance and development regime.
4.19 The Civil Service Disciplinary Code59 was revised in accordance with the Civil Service Regulation (Amendment) Act60, 2005. This was designed to bring the sanctions for poor performance in the Civil Service up to date.
4.20 The Performance Management and Development System (PMDS)61 is designed to provide an effective tool for managing individual performance in departments. It gives departments before
58 Twenty one departments stated that they apply different procedures in the management of short term and
long term absence. 59 The Code was communicated to departments by way of Department of Finance circular in July 2006. 60 This Act gives the Head of department responsibility for managing all matters relating to performance,
conduct and discipline of civil servants below Principal Officer level. 61 The PMDS focuses on the contribution which each employee makes to the work of a Civil Service
department. While the PMDS focuses on the management and development of employees, it is also used to determine whether performance is at an acceptable level.

Managing Sickness Absence 63
taking disciplinary action in relation to underperformance, the opportunity to satisfy themselves that measures aimed at improving the performance of the employee through training or development have not been effective.
4.21 While half of departments said that they avail of the PMDS process as a means of assessing the impact that absence has on an individual’s performance, the link was tenuous in some cases. Eight departments hold the view that the PMDS does not facilitate monitoring of the impact of sickness absence on individual performance.
4.22 While two thirds of departments indicated that they have invoked disciplinary procedures in sickness absence cases, few were in a position to provide statistics on the number of occasions these procedures were invoked. A number of departments have taken disciplinary steps, such as the removal of self-certification, deferral or withdrawal of increment, deduction of annual leave for excessive uncertified absences and removal from payroll. One department indicated that it had dismissed a member of staff due to excessive sick leave62. Another department informed a staff member that if attendance did not improve, the person would face dismissal. In two departments sickness absence was a factor which led to probationers being dismissed at the end of the probationary period.
4.23 Figure 4.2 profiles the main measures adopted by Civil Service departments to discourage non-attendance. Over half of all departments reduce salary or remove the individual from the payroll where the level of absence is deemed unacceptable.
Figure 4.2 Measuresa Adopted by Departments to Discourage Non-Attendance
Measure Number of Departments
Stopping salary, or salary reduction 16 Suspension / withholding of increment 11 Removal of self certification 9 Ineligibility for transfer or higher scale allowances, denial of acting up or promotion
8
Disciplinary sanctions including application of disciplinary code 7 Extension of probation and/or termination following probationary period 6 Deduction from annual leave 3 Verbal and written warnings 3 Source: Survey of departments
Note: a All departments cited more than one measure.
4.24 While respondents said that it was difficult to measure and quantify the impact that the different measures have on the level of absence, it was generally considered that the application of these measures did lead to an improvement in attendance.
62 Serious misconduct or underperformance is a breach of Civil Service rules and procedures and will justify
disciplinary action as set out in the Disciplinary Code including dismissal in accordance with the specified procedures. Unauthorised absence, unacceptable attendance levels and failure to comply with sick leave regulations are deemed to be serious misconduct issues under the Code.

64 Sickness Absence in the Civil Service
Recommendation
Performance management and development processes and disciplinary actions should be seen as a continuum with disciplinary action grounded on a clear record of developmental initiatives. Departments should maintain overall statistics of the percentage of sickness absence cases that give rise to the use of disciplinary procedures or sanctions. Regular reviews of the sanctions applied should be undertaken with a view to identifying their effectiveness in particular cases.
Management Information
Good Practice
Reliable data provides a firm foundation for successful absence management. Ideally, managers should have real time data on which to take absence management decisions. This positions them to intervene at agreed trigger points.
4.25 While minor variations exist with regard to the type of notification procedures used to record instances of sick leave, only 21 of the 29 departments surveyed were confident that all instances of absence are recorded. The remaining eight departments63 were of the view that although there was a high level of compliance with sickness absence reporting some absence may not be captured. The main reasons given as to why instances of absence may not be recorded in these departments included managers not reporting absence and attendance of staff members not being captured using flexitime systems – for example field staff and grades not covered by flexible working hours.
4.26 Steps taken by departments to ensure that all instances of absence are recorded include
reconciliation of time and attendance and flexitime records
clear procedures for reporting instances and ensuring that procedures are followed
training and creating greater manager awareness.
Approaches to Absence Management – Case Study 6
Line Management Responsibility for Recording of Absence
In the past, the Public Appointments Service had a problem with some sick leave not being recorded. HR found that managers were unsure of their role with regard to employees absent on sick leave. Briefing sessions were held with managers to create better awareness of their responsibilities regarding sick leave including the need to record all instances of sickness absence. Specific guidelines were issued to managers. This approach helped minimise resistance from managers with regard to the ongoing management and monitoring of absence.
4.27 Ten departments carry out quality assurance checks and spot checks to verify the integrity of the data recorded. Unique steps taken by individual departments include
63 The departments are Education and Science, Community, Rural and Gaeltacht Affairs, Environment,
Heritage and Local Government, the Courts Service, the Valuation Office, Foreign Affairs, Taoiseach and Agriculture, Fisheries and Food.

Managing Sickness Absence 65
staff in the Revenue Commissioners have access (under supervision) to their own HRMS record so mistakes should be easily identified
the Department of Justice, Equality and Law Reform has engaged an outside firm to perform regular audits.
4.28 Survey results suggest that departments have satisfactory systems in place to monitor recorded absences with defined trigger points for action in line with Department of Finance regulation – for example, a warning trigger appears when an individual reaches five days of uncertified absence in a 12 month period.
Recommendation
All decisions taken with regard to absence management should be based on accurate, reliable, complete and timely data. Consequently, departments should regularly communicate to staff and line managers the importance of all absence being notified and recorded in a timely manner. This is particularly important where under-recording is recognised as an issue. Departments should also ensure that procedures are in place to validate and quality assure the integrity of data recorded.
Management Information Systems
Good Practice
Reliable data needs to be translated into relevant reports and indicators in order to equip departments to manage absence.
4.29 The primary management information tool used by departments is known as HRMS. This system has been introduced in 39 departments to date64.
Peoplesoft Human Resources Management System (HRMS)
In January 2005, the Department of Finance entered into a master service agreement with BearingPoint Ireland Limited to upgrade the HRMS, set up a single central version of the system in a data centre, implement the system in 39 organisations which consisted of 39 separate data migration projects and provide a three year managed service hosting and application support for the solution. The value of the contract entered into was for a total of €5.3 million plus VAT at 21%. Over €3.4 million of the contract related to the provision of a three year managed service provisiona and the initial set up costs. Total payments ultimately made to BearingPoint were €6.49 million inclusive of VAT. BearingPoint invoiced departments directly for the amounts due. The Centre for Management Organisation and Development (CMOD) in the Department of Finance pays the annual licence fees for the use of the underlying PeopleSoft software and then recoups the amounts from the departments. a While part of the master contract, the specific agreement for this was signed in August 2005 for a period of
three years.
4.30 In the absence management area, the HRMS
64 See Chapter 1, Paragraph 1.11.

66 Sickness Absence in the Civil Service
records absences
allows absence to be monitored by reference to sick leave limits
facilitates the extraction of data to produce reports and statistics on individual absences and departmental absences
provides key triggers for absence management for both short and long term absence
supports the devolution of HR functions to line management.
4.31 One third of departments believe that the HRMS does not provide them with the information required for effective absence management. The main shortcomings identified by these departments were
substantial and time consuming data manipulation required outside of the HRMS to facilitate meaningful statistical information
not facilitating the identification of trends or the production of more complex, useful reports without prior manipulation, auditing and engagement with CMOD
speed of report running is slow
problems with how absence is reported, the non-netting of data to the reporting period required and non-calculation of unpaid leave
not facilitating costing of absence
poor user interface for software leading to lack of staff confidence in the system
quality of data output and viewing is not good.
4.32 Over half of departments considered that the HRMS in its present state does not support the devolution of responsibility for HR to line managers, and, in particular, the devolution of functions in regard to absence management.
4.33 In response, the Department of Finance (CMOD) pointed out that it continually reviews the operation of the HRMS and associated reporting services in a comprehensive and thorough manner by
providing a help desk operated by CMOD staff who give advice and assistance to all 39 departments by phone, e-mail and where appropriate site visits
providing informal training and coaching to staff working on the HRMS in departments
providing formal training on basic and advanced features to newly assigned staff in departments on a regular basis, for example, in 2008, 54 days of training were provided and these were attended by over 100 staff from 32 departments
the provision of 90 reports (23 of which relate specifically to absence) developed by CMOD which are delivered with the system to assist departments in meeting their reporting requirements
providing further assistance through on-site visits (for example, to deliver ‘super-user’ training over the last number of months) to all departments
meeting with HRMS users formally on a quarterly basis on the performance of the managed service provision, to discuss issues that have arisen, and to plan tasks to be undertaken including proposed enhancements65.
65 Additional comments made by CMOD can be found at Appendix K.

Managing Sickness Absence 67
4.34 Since commencement of the service provision, CMOD stated that only one issue has been raised with regard to reporting on absence. This issue relates to how absence for the period under review is captured. To address this, a sick leave working group was convened in January 2009 to agree amendments to the HRMS to allow departments report on sick leave liability. The agreed change is currently being tested and is due to be incorporated in the live HRMS shortly. CMOD further explained that when dealing with requests for additional functionality, it is cognisant of the trade off between the system’s ease of use and the increased system complexity. A major consideration is the implementation of enhancements which are needed by all departments.
Recommendation
Given the level of concern expressed by some departments with regard the use of the HRMS as a management information tool for effective absence management, those issues need to be reviewed in a comprehensive and thorough manner in conjunction with the level of services already provided by CMOD, with a view to putting measures in place to address them where feasible and practicable.
Absence Rate Information
Good Practice
In order to manage absence it is necessary to have relevant performance information. A basic performance indicator is the rate of absence for the organisation.
4.35 Only half of all departments have identified their actual lost time rate for 200766.
4.36 Overall, there was a lack of consistency in the approaches adopted by departments in identifying the level of absence and in its measurement. This lack of consistency can undermine the authenticity of individual departmental results and also inhibits the comparability of results across departments.
Approaches to Absence Management – Case Study 7
Absence Measurement and Reporting
In 2008, the Department of Enterprise, Trade and Employment developed a template for annual reporting on sickness absence based on providing a detailed quantitative and qualitative analysis of absence both at overall departmental and at individual divisional level. The approach facilitates senior management examination of data for their respective areas of responsibility.
The department stated that while the HRMS provides the raw data for sickness absence reporting, substantial, time-consuming data manipulation and analysis has to be carried out outside of the HRMS in order to provide meaningful statistical information. The department also emphasises the importance of the accurate reporting and recording of sickness absence in the department.
A new HRMS report was designed by the department to facilitate the collection and collation of its 2007 absence data. This involved considerable work both in terms of designing the new report and in cleaning-up the raw data, including
66 A further two departments provided information on the total number of sick days while another stated that
although the level of absence had been identified it was not available in the breakdown required.

68 Sickness Absence in the Civil Service
deducting weekends, public holidays and privilege days in order to calculate actual working days lost and sickness absence rates
reducing all work sharing work patterns to calculate actual working days lost and subsequent sickness absence rates based on scheduled-on days
classification of sickness absence into duration categories based on absence length in order to standardise data for reporting and benchmarking purposes
applying a reduction formula to limit long term sickness absence to the reporting period in question
netting staff numbers in order to calculate actual numbers of staff taking sickness absence, transition of sickness absence reports from decentralising staff (former parent department), actual number of spells and duration of absence, total duration of certified and uncertified sickness absence, repeat episodes of absence and divisional variations
manipulating data in order to provide detailed analysis on a divisional basis in terms of average working days lost rates, staffing numbers, gender breakdown, illness type and trends.
The department also categorised the illness reasons for staff availing of sickness absence in line with the WHO ICD categories.
It is the department’s aim to publish a report on the level and distribution of absence throughout the department on an annual basis. It states that this will provide senior managers with accessible information on annual trends, variations and patterns in real-time terms and will also facilitate benchmarking on a corporate level with similar sized departments both nationally and internationally. The collated information will also be used to monitor the success of future departmental sickness absence management policies, to implement early intervention strategies, identify where problems exist and how to tackle them, to examine in greater detail the cumulative impact, consequences and costs of sickness absence to both the individual and the department as a whole and to inform its ability to target specific tailor-made remedies to specific problems.
4.37 In the UK, the Cabinet Office has responsibility for central guidance in the Civil Service on managing attendance. In early 2006, new standards were adopted providing for more robust analysis and reporting of sickness absence across the Home Civil Service. In its statement on sickness absence for the period 2006-07, the Cabinet Office stated that it would be asking departments to monitor their absence figures on a monthly basis and publish annual figures in their departmental reports. In 2008, Civil Service management in the UK agreed a number of measures to assist departments tackle sickness absence. One of the measures included internal quarterly reporting under which information would be provided by departments and collated by the Cabinet Office on a quarterly basis. This information is intended to be used by management to understand and manage sickness absence in all parts of the UK Civil Service.
Recommendation
All departments should publish their absence rate in their annual reports. A comprehensive set of guidelines on how absence data is recorded and collated should be developed. The guidance prepared by the UK Cabinet Office is a good source for this purpose. A steering group representing key stakeholders could be established with a view to identifying the key elements of effective absence measurement.

Managing Sickness Absence 69
Reporting of Absences
Good Practice
Reporting of absence performance is a key prerequisite to inform absence management.
4.38 In general, the frequency and nature of reporting on absence that Civil Service departments adopt vary considerably. One quarter of departments do not report on absence internally. Less than half of departments report externally.
Approaches to Absence Management – Case Study 8
Targeted Interventions
The Central Statistics Office adopted an approach designed to relate emergent trends in absence to underlying causes. Follow up action was initiated — for example — presentations related to the cause in question were given. In particular, the statistics for uncertified sick leave were used to underpin a more robust approach to the implementation of the rules and limits governing this type of absence. This approach commenced in September 2007. HRMS analysis by the Central Statistics Office showed that the total of uncertified sick leave declined by approximately 40% in the period June 2007 to June 2008 when compared with June 2006 to June 2007.
4.39 In general, departments report internally on their overall absence rate, the absence rate or days lost per division/section, absence by age, grade and cause and whether absence is certified or uncertified. Only 10% of departments said that they report externally on their overall absence rate.
Recommendation
Departments need to build regular reporting of absence statistics into their ongoing management of absence and establish targets for absence reduction initiatives and implement associated change in their processes.
General Views of the Department of Finance
4.40 The Department of Finance stated that departments must robustly manage sick leave absenteeism and report on their efforts appropriately, publishing annual figures. The Department accepts that it must also have an important role in the ongoing monitoring of Civil Service absence rates.
4.41 The Department is working with other Civil Service departments to develop appropriate systems of absence management, in line with best practice, and to ensure that departments give a high priority to their proper implementation. To date, policy on ill health retirement has been updated and an updated policy on sick leave absence management is at an advanced stage. This will allow the overall policy relating to sick leave which dates from the 1970s to be reviewed, and revised where necessary. It is intended that all relevant circulars will have been reviewed and updated where necessary by 2010. The Department noted the timeliness of this report to the ongoing development of policy on sick leave and absence management for the Civil Service.

5 Promotion of Attendance 5.1 While Chapter 4 considered how absence is managed this chapter focuses on the positive measures that can be taken to encourage attendance. It considers the approaches that departments can use to promote staff wellbeing, encourage healthy lifestyles and a positive working environment and identify the most effective attendance promotion measures. Attendance promotion practice is examined in the light of the following good practice criteria.
Good Practice Attendance Promotion
understanding job related influences on attendance
creating a positive working environment
active support of attendance through worker-centred policies
encouraging work/life balance
ensuring a safe and healthy workplace
joined up absence management informed by relevant data
identification of local measures that work.
Identifying and Understanding the Causes of Absence
Good Practice
Research suggests that workplace factors influence the overall health of the workforce. Factors identified include monotonous and repetitive work, lack of autonomy and job control, the balance between effort and reward and perceptions of fairness. Where organisations fare badly on a number of these dimensions, the workforce faces a higher risk of illnessa. Understanding the causes of absence related to particular jobs in an organisation and the health impact of changes in work practice or job location facilitates the identification of the risks of sickness absence. a UK Ministerial Task Force on Health, Safety and Productivity, Diagnostic Tools for Handling Sickness
Absence, September 2006.
5.2 The pattern of absence outlined in Chapter 3 suggests that each department is likely to confront different contributing factors below the immediate medical cause of absence.
5.3 Employee absence may be attributable to
individual reasons – underlying medical conditions, episodes of illness, family commitments
job related reasons – monotonous and repetitive work, work lacking scope for development
organisational reasons – the culture of the department, workplace relationships, or physical working environment.
5.4 To date, Civil Service departments have not been proactive in investigating the underlying factors that prevent people from coming to work. Only three departments have attempted to identify such underlying factors. Those that did, identified issues such as the nature of the work and the working environment, bullying and harassment, family problems including child minding issues and commuting.

72 Sickness Absence in the Civil Service
5.5 18 departments surveyed have not identified the main areas of risks in relation to sickness absence. For those who have, the areas of risk most likely to impact on productivity and delivery continuity were reported as
health and safety including poor accommodation
workload burden on staff leading to low morale
mobility and rotation causing anxiety to staff
exposure to viruses
emotional problems.
5.6 Less than one third of departments (nine departments) reported that they have robust mitigation plans in place to address the key risk factors and only five departments have plans to address the absence of key personnel. Training of staff in other job roles, assigning tasks to available staff and prioritising work that needs to be done were cited as the steps taken by departments. Acting up allowances or higher duty allowances are also applied in some departments.
5.7 In general, Civil Service departments have not identified how organisational change and work organisation impact on absence.
The Office of the Ombudsman asserted that it gave rise to increased stress levels.
On the other hand, the Revenue Commissioners stated that while it had gone through major changes and that its organisational structure had been fundamentally altered in recent years due to the integration of three grading streams into one, none of these events were deemed to have had a noticeable effect on the level of absence.
Recommendation
While the certified reason for non-attendance is the immediate cause of absence, in order to ensure the overall effectiveness of attendance promotion initiatives it is important that management identify any underlying factors giving rise to absence through a root cause analysis. Engagement with occupational health services can contribute to the process of identifying risks of non-attendance. Following this, the next step is to conduct participative discussions with the staff concerned to harvest their ideas and identify actions that can be taken to remove those risks. Departments should monitor the risk that ongoing organisational change has on sickness absence rates. Management of this risk should include regular monitoring of attendance rates of those affected by relocation and ensuring that all new line managers are fully aware of and properly trained in the department’s attendance management procedures.
Positive Working Environment
Good Practice
Research shows that high levels of job involvement, job satisfaction, organisational commitment and doing meaningful work tasks all show correlations with high attendance.
5.8 While departments outlined a number of steps that are taken to support staff commitment and engagement, the main ones cited were the partnership process (half of all departments) the PMDS process (13 departments) the business planning process (eight departments), improved training and access to training (seven departments) and staff climate attitudinal surveys (five

Promotion of Attendance 73
departments) all of which are general Civil Service requirements and not initiatives developed by individual departments.
5.9 In over half of departments, employees have been engaged in job design and analysis with a view to identifying better and more interesting ways of undertaking work. Eight of these departments were of the view that this engagement has impacted positively on the work environment while only three held the view that it resulted in increased productivity. While no department expressed the view that such engagement had led to a reduction in absence, three held the view that it has not reduced absence, while seven did not know.
5.10 It is Civil Service policy that every employee has the right to carry out her or his duties free from any form of harassment, sexual harassment or bullying. Where such incidents do take place, these can give rise to instances of work related stress and staff availing of sickness absence to avoid specific work place situations. The creation of a positive working environment in the Civil Service is underpinned by the Civil Service policy ‘A Positive Working Environment – an Anti Harassment, Sexual Harassment and Bullying Policy’67.
5.11 All departments surveyed have carried out a number of steps to promote a positive working environment. While some of the steps cited relate specifically to the Civil Service policy, other steps cited focus on work/life balance, family friendly policies and wellbeing. Some specific steps taken by individual departments are set out below.
Departmental Approaches The Department of Social and Family Affairs trains staff members as investigators and in
mediation in order to process complaints as efficiently and effectively as possible.
The Department of Education and Science organises sessions for staff in stress awareness and sessions for managing staff in a positive working environment.
The Department of Foreign Affairs has support contact people available to provide information and support to employees who feel subjected to harassment or bullying.
The Courts Service provides lunchtime talks on a wide variety of work and wellness topics.
The Department of Enterprise, Trade and Employment has an Equality Facilitator and a Disability Liaison Officer (DLO) to provide information and assistance to staff in relation to equality and disability issues.
The Department of Transport places plants in all staff and common areas in each building, has carried out remedial work on buildings and has reduced the number of buildings from six to three.
The Property Registration Authority reviews business processes with a view to identifying improved methods and, with the aid of technology, to redesign work so that staff have a greater level of decision making.
The Houses of the Oireachtas is engaged in improving communication and transparency within the organisation.
67 Issued by the Department of Finance in July 2005 to ensure compliance with the codes of practice issued
under The Safety, Health and Welfare at Work Act 1989, the Industrial Relations Act 1990 and the Employment Equality Acts 1998 and 2004.

74 Sickness Absence in the Civil Service
The Office of the Chief State Solicitor has a dignity charter and also engages an expert on an annual basis to give a talk on a positive working environment.
5.12 The approaches outlined are illustrative of measures taken by departments to promote a positive working environment and to enhance the working arrangements and conditions for their employees. All departments report engaging in a number of other activities to improve the working environment for their staff.
Recommendation Civil Service departments need to continuously review the scope to involve staff in job design in order to make work more interesting and thus build a sense of commitment and enhance staff engagement. This is particularly relevant in departments where much of the work, may be repetitive and routine. Departments need to evaluate the results of the engagement to determine whether it has a real impact on the level of absence.
Implementing Measures to Support Attendance
Good Practice
Current thinking suggests that good practice attendance promotion is likely to include the measures set out in Figure 5.1.
Figure 5.1 Measures to Support Attendance
Measurea
Good Communication of Absence Management Policy
Occupational Health Services
Employee Assistance Programmes
Long Term Absence Case Management
Health Promotion Activities
Flexible Working
Financially Rewarding Attendance
Recognising Good Attendance
Emergency/Special Leave
Job Design
Positive Organisation Culture Source: UK National Audit Office and CollierBroderick Management Consultants Note: a Attention has already been drawn to a number of these measures in the context of the management
of sickness absence outlined in Chapter 4.
5.13 The results of a ‘Workplace Health Promotion Survey’ carried out by the Department of Finance in 2004 demonstrated that many departments already had significant health promotion policies in place which provided a baseline from which further improvements in workplace health promotion could be planned and delivered across the service. The Department of Finance noted
Promotion of Attendance 75
that the aim was that all departments would adopt activities designed to maintain and promote the health and wellbeing of their employees.
5.14 The report stated that the Department in conjunction with Personnel Officers would be developing guidelines to develop, promote and manage Workplace Health Promotion Policy with the aim of improving health and wellbeing and reducing the impact of ill health service wide. The audit team was informed by the Department of Finance that guidelines in this area were subsequently considered to be unnecessary as many departments are actively promoting workplace health initiatives.
5.15 The majority of the departments surveyed stated that they have direct strategies (either punitive and/or motivating measures) in place to address absence and promote attendance. All respondents have indirect strategies (for example, flexible working, work/life balance arrangements) in place. While 23 departments stated that they adopt punitive measures to address unwarranted absence only eight departments68 pointed to the use of specific motivating measures to promote attendance.
5.16 Motivating measures used by departments include performance awards69, the availability of flexible working arrangements (including flexitime) and working from home. It is an accepted practice across departments that assistive aids are put in place for staff with disabilities. This is one of the functions provided by departments’ DLOs.
Recommendation
Departments need to build on the attendance promotion measures in place and evaluate their contribution from time to time.
Work/Life Balance and Other Initiatives
Good Practice
The availability of flexible working arrangements allows employees to manage their work/life balance better. According to a 2002 National Development Plan Study – the level of family friendliness of the workplace was significantly correlated with the work satisfaction of fathers and mothers.
5.17 All departments offer flexible working arrangements to their staff. The main arrangements offered include job sharing/flexible working arrangements, flexitime, term time and e-working arrangements. While these arrangements are generally made available to administrative staff from Higher Executive Officer downwards, some departments offer arrangements to all staff up to Principal Officer level.
5.18 The benefits of these policies were cited as including, employee satisfaction, reduced absence and improved business results. However, the findings of this examination show that absence is relatively more common amongst staff with flexible work patterns (see Figure 3.9).
68 Seven of these departments also adopt punitive measures. 69 These include attendance awards and other awards which encompass attendance as a measure.

76 Sickness Absence in the Civil Service
5.19 Other initiatives undertaken by departments include career breaks, lectures, promotion and participation in the annual work/life balance day, healthy eating day, family friendly policies, special unpaid leave for domestic difficulties and wellness and wellbeing programmes.
Approaches to Absence Management – Case Study 9
Wellness Programme
In September 2003, the Public Appointments Service introduced a Wellness Programme. The aim of the programme is to balance absence policy enforcement with help offered to employees. Staff are consulted and make suggestions on matters they would like to see included in the programme. The Wellness Programme is not a stand-alone programme – it is incorporated within the HR unit’s business plan. An annual report on the programme is produced. In 2008, different activities were organised for each of the months from February to October inclusive. Activities included healthy lifestyle issues, personal budgeting, making a will, smoking cessation programme, and medical checks, amongst others. Feedback from staff suggests the programme has led to a decrease in absence. While statistics show an overall improvementa in absence levels since the programme commenced, the HR unit acknowledges that this may be due to a number of other factors in conjunction with the programme. a Based on Public Appointment Service’s own calculated statistics.
5.20 Eighteen departments have identified other measures which aid in the prevention of sickness absence. Such measures include
matching the person to the job and suitability of work location, including safety in the workplace
mentoring, coaching and on the job training
flexibility in work roles so that individuals can undertake more than one function
structured training and development
subsidised health screening and specific awareness initiatives such as stress awareness.
Recommendation
Departments have not carried out any evaluation of these initiatives to determine whether they have an impact on the level of sickness absence. Such an evaluation is necessary to ensure that there are mutual benefits accruing to both the department and its staff.
Health and Safety
Good Practice
A preventative approach to accidents and ill health at work should be adopted in line with the policy underlying the Safety, Health and Welfare at Work Act, 2005.
5.21 By and large, safety issues are more actively managed than health issues which tend not to be given the same level of attention. Figure 5.2 details the performance of the departments surveyed under four key safety criteria

Promotion of Attendance 77
Figure 5.2 Level of Compliance with Health and Safety Requirements
26
1821
29
0
5
10
15
20
25
30
Up to date SafetyStatement
Safety Officers oneach floor
Safety Audits Procedures in placefor Incident Reporting
and Review
Source: Survey of departments
Num
ber o
f Dep
artm
ents
Recommendation
There is scope for some improvement in the management of safety at work. The following section considers the extent of proactive health promotion undertaken in departments.
Health Promotion and Screening
Good Practice
The health of the workforce is the proximate cause of sickness absence. Consequently, measures to improve health are central to improvement of attendance and the achievement of wellness and positivity.
5.22 Health promotion consists of three types of activity
raising awareness of health issues
lifestyle change intervention
sustaining a healthy work environment.
5.23 Most departments provide Health Screening Programmes for their employees. Of those departments, 18 stated that screening is generally offered every one to three years while the balance had no defined policy in this regard and offer screening on an irregular basis or a specific programme as required. This screening mainly incorporates basic health checks70. However,
70 The CMO recommends that tests on height and weight (BMI calculation), blood pressure, glucose and
cholesterol form part of tests offered.

78 Sickness Absence in the Civil Service
some offer full health checks including cancer checks. Fifteen provide regular eye testing and four provide the annual flu vaccine. Auditometry testing is also provided in a small number of departments as required. Fourteen departments indicated that they either subsidise or pay the full cost of the screening71.
5.24 Departments have not evaluated whether the provision of screening measures has impacted on the level of absence.
The Central Statistics Office commented that some post-programme analysis was carried out in 2006 to quantify impact. However, this was for internal information purposes only and no follow up actions were initiated.
The Department of Social and Family Affairs said some staff members were referred for further care as a result of the screening and the early intervention in these cases may have reduced future absence rates.
5.25 A number of other initiatives are undertaken by departments to promote staff health and wellbeing. 22 of 29 departments undertake stress awareness programmes as outlined in Figure 5.3. In general, departments have found that the initiatives adopted are effective. However, not all departments expressed an opinion in that regard.
Figure 5.3 Other Health Promotion Initiatives adopted by Departments
Approach Number of Departments using
Approach
Number of Departments that
find Approach Effectivea
Stress Awareness Programmes 22 19 Talks on Health Promotion and or Health Promotion Days 20 16 Diet/Healthy Eating Initiatives 19 12 Healthy Lifestyle Awareness Initiatives 17 12 Blood Pressure Checks 17 11 Smoking Cessation Initiatives 17 11 Facilitation of In House Exercise and Relaxation Courses 12 9 Alcohol and Drugs Awareness Initiatives 7 6 Source: Survey of departments
Note: a The remaining departments using the approach did not comment on effectiveness.
Recommendation
To fully evaluate the effectiveness of the initiatives that are in place, departments need to review the impact of health promotion measures.
71 Other departments did not state whether programmes were subsidised or paid in full.

Promotion of Attendance 79
The Organisation of Absence Management
Good Practice
Approaches to support attendance invariably include measures for managing absence. Effective absence management requires a combined effort between HR, line management and senior management, supported by a good information base.
5.26 Almost all departments were satisfied that their absence policies and procedures clearly set out the roles and responsibilities of HR personnel and members of staff, while most considered that the role of line management was clear. 21 departments were of the view that the role of senior management was sufficiently outlined.
5.27 There was a general view that line managers have enough information to help them promote attendance but seven departments believe that they do not have sufficient knowledge to promote attendance. Respondents outlined the steps that, in their view, need to be taken to equip managers to promote attendance. These include
updating the attendance management policy in the department
training of managers and more involvement by managers in absence management
providing managers with more absence information
back to work interviews.
5.28 Over half of survey respondents reported that their department has a process in place to ascertain the views of line managers in the day-to-day management of sickness absence and the issues that absence presents. This process tends to be informal in most departments and usually involves managers engaging with HR as issues arise. In the Revenue Commissioners, a HR management consultative forum takes place with HR twice a year, while in the Central Statistics Office issues are raised at various presentations and information sessions held by HR and attended by line managers.
Recommendation
Given the ongoing strategic shift towards devolution of HR functions from the centre of the department to line managers, there is a need for departments to move beyond rhetoric and clearly set out the role of line managers and clarify the supports that are available to assist them in the day-to-day management of attendance.
Identification of Effective Measures
Good Practice
Since each organisation is shaped by its own unique task environment it would be useful for organisations to attempt to identify the approaches that are most effective in their own environment.
5.29 Only 10 of the 29 departments surveyed have identified measures and practices that have worked well in terms of promoting attendance and reducing absence. The main measures cited by those that did were
timely HR intervention

80 Sickness Absence in the Civil Service
local management intervention
the deferral of increments
EAS/CMO intervention
individual case management
the availability of work/life balance initiatives
creating awareness of rules and their effective implementation.
Recommendation
The non identification by two thirds of Civil Service departments of the main measures and practices which work well in the promotion of attendance and reduction of absence may call into question the effectiveness of the procedures being used by them. In order to improve effectiveness a good starting point would be a comprehensive review of the existing attendance promotion measures with a view to establishing their efficacy in the department’s environment.

Appendices ___________________________________________________________

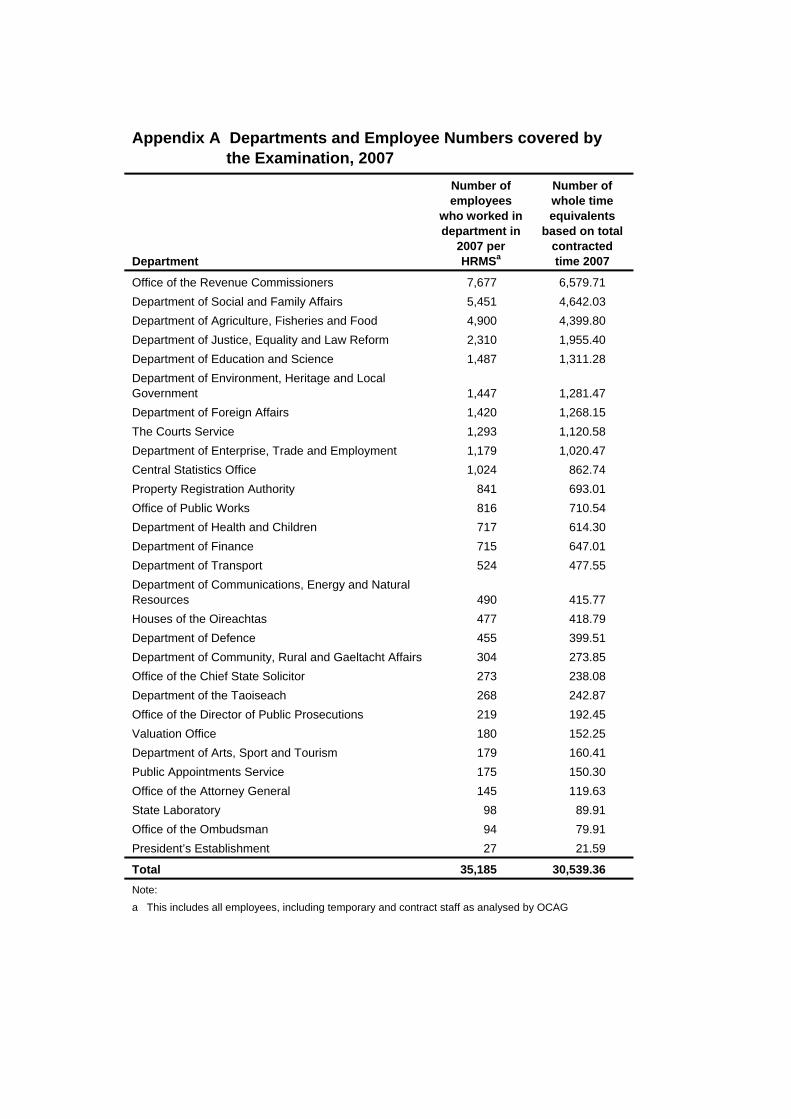
Appendix A Departments and Employee Numbers covered by the Examination, 2007
Department
Number of employees
who worked in department in
2007 per HRMSa
Number of whole time equivalents
based on total contracted time 2007
Office of the Revenue Commissioners 7,677 6,579.71 Department of Social and Family Affairs 5,451 4,642.03 Department of Agriculture, Fisheries and Food 4,900 4,399.80 Department of Justice, Equality and Law Reform 2,310 1,955.40 Department of Education and Science 1,487 1,311.28 Department of Environment, Heritage and Local Government 1,447 1,281.47 Department of Foreign Affairs 1,420 1,268.15 The Courts Service 1,293 1,120.58 Department of Enterprise, Trade and Employment 1,179 1,020.47 Central Statistics Office 1,024 862.74 Property Registration Authority 841 693.01 Office of Public Works 816 710.54 Department of Health and Children 717 614.30 Department of Finance 715 647.01 Department of Transport 524 477.55 Department of Communications, Energy and Natural Resources 490 415.77 Houses of the Oireachtas 477 418.79 Department of Defence 455 399.51 Department of Community, Rural and Gaeltacht Affairs 304 273.85 Office of the Chief State Solicitor 273 238.08 Department of the Taoiseach 268 242.87 Office of the Director of Public Prosecutions 219 192.45 Valuation Office 180 152.25 Department of Arts, Sport and Tourism 179 160.41 Public Appointments Service 175 150.30 Office of the Attorney General 145 119.63 State Laboratory 98 89.91 Office of the Ombudsman 94 79.91 President’s Establishment 27 21.59
Total 35,185 30,539.36 Note: a This includes all employees, including temporary and contract staff as analysed by OCAG

Appendix B General Sick Leave Arrangements
Responsibility rests with individual departments to manage and monitor absence in an efficient and effective manner.
Heads of departments may pay civil servants who are absent from work due to illness, subject to certain maximum limits. The amount of sick leave an employee takes can impact on that officer’s
confirmation of appointment
eligibility for promotion.
In January 2008, the Department of Finance issued a staff information booklet72 which sets out the terms and conditions of employment in the Irish Civil Service. The booklet sets out the arrangements for sick leave. It also sets out the procedure that an officer should follow when ill and unable to attend work. A summary of the procedure and the main sick leave provisions are set out below.
Summary of Sick Leave Procedure and Main Sick Leave Provisions
The officer should contact the local manager by telephone (or get someone else to do so), before noon on the first day of absence.
Written confirmation of inability to attend due to illness should be sent as soon as possible afterwards.
If sickness absence lasts more than two working days a medical certificate from a doctor, stating the nature of the illness and the length of the absence, must be provided to the HR Unit. (In some circumstances a certificate from a dentist is acceptable).
The certificate should be sent in on the third day of the absence.
Normally a certificate will be accepted for a period of one week only. Therefore, unless informed otherwise, the officer should arrange to submit a certificate at weekly intervals during a continuous sickness absence.
Officers absent on sick leave who were appointed on or after 6 April 1995, are required to make the necessary claims for illness benefit to the Department of Social and Family Affairs within the required time limits and to comply with whatever requirements are laid down by that Department as a condition of claiming benefit.
Up to seven days uncertified sick leave may be permitted in any period of twelve months.
The decision whether sick leave is to be granted and whether it is to be with or without pay is a matter for the Head of each department.
Full pay during properly certified sickness absence (provided there is no evidence of permanent disability for service) may be allowed up to a maximum of six months in one year and half pay thereafter, subject to a maximum of twelve months’ paid sick leave in any
72 The predecessor to this booklet – ‘A Guide to the main conditions of service in the Irish Civil Service’ was
published in 1990.

General Sick Leave Arrangements 85
period of four years or less.
In assessing performance and in determining suitability for promotion and eligibility for competitions, the sick leave limits applied are not more than 56 days and not more than 25 periods of sickness absence in four years.
Abuse of sick leave arrangements may lead to severe penalties including dismissal, withholding of salary increments and the withdrawal of sick pay privileges. Particular attention is paid to the way in which the concession of uncertified sick leave is used.
Many of the circulars underpinning the arrangements for sick leave and sick pay have their origins in the 1970s. While a number of circulars have emanated in the last twenty years on different aspects related to sick leave, the main circular underpinning the current arrangements in place for sick leave is over 30 years old – ‘Circular 25/78 Sick Leave’.
While various amendments have been effected to provisions in relation to the clearance of candidates for promotion or establishment, there have been no changes to the overall sick leave allowances available to civil servants.
Guidance from the Department of Finance
In its letter to Personnel Officers in January 1988, the Department of Finance set out the four basic activities underpinning absenteeism control – recording, analysis, feedback and action. The letter specifically stated that
control of absenteeism is the responsibility of each department
it is primarily for line managers with the help of HR Units to be sensitive to unwelcome trends and to take early remedial action where necessary.
The letter included suggestions for effective measures for control of absence acknowledging the need for departments to adapt them to local needs as required.

Appendix C Support Services
The two main external interventions used by Civil Service departments in the management of sickness absence are the services of the Office of the Chief Medical Officer (CMO) and the Civil Service Employee Assistance Service (EAS).
Role of the CMO
The Office of the CMO which also incorporates the Civil Service Occupational Health Department (CSOHD) is part of the Department of Finance. The CMO’s Office provides policy advice on occupational health matters to civil and public servants73. The CSOHD provides occupational health services which includes pre-employment medicals, sickness absence assessments, workplace rehabilitation, ill health retirement assessments, health screening, immunisations and workplace health promotion. The overall aim of the CMO’s office is to provide policy advice and deliver a proactive cost effective occupational health service.
In his 2007 annual report, the CMO reported that over 10,000 work items were dealt with74. This
represented a 46% increase compared with 2003 as shown below. The CMO has said that there was no increase in the level of staff resources in this period. The number of persons dealt with by the CMO’s Office in 2007 was 4,800, compared with 3,500 in 200375.
Number of Work Items dealt with by CMO, 2003 – 2007
6,889 6,590 6,612
7,970
10,052
0
2,000
4,000
6,000
8,000
10,000
12,000
2003 2004 2005 2006 2007
Year
Wor
k Ite
ms
Work Items
Source: CMO Annual Reports
With regard to sickness absence, the primary aim of a medical review by the CMO’s Office is to help facilitate the workplace rehabilitation of an employee who has had a health problem. While
73 This includes civil servants, teachers and prison officers as well as some other public sector workers, for
example, HSE Consultant pre-employment advice. 74 This includes over 3,500 work items in relation to the Irish Prison Service (2,793) and teachers (755). 75 Many individual cases are only dealt with on one occasion (e.g. pre-employment medicals) but some cases
may be dealt with on multiple occasions in the course of a one year period (e.g. sickness absence cases and persons receiving immunisation courses). Around 30% of individual cases in 2007 were teachers or prison officers.

Support Services 87
the responsibility for maintaining a reasonable level of attendance lies with management, the CMO’s Office can provide assistance by advising on medical fitness for work and on work adjustments and accommodations that may be required to help facilitate this. An opinion on fitness for work is then given (while maintaining medical confidentiality) to the referring department.
In 2007, the CMO published a report on ill health retirement (IHR) in the Civil Service76. It was found that during the period 2003 – 2006 inclusive, 394 civil servants were recommended for IHR (comprising 300 general civil servants and 94 industrial civil servants). This represented an overall rate of 2.7 IHRs for every 1,000 civil servants. The report noted that the rate of IHR is similar to that in the UK Civil Service and that it was significantly lower than that in the NICS. The single most common medical cause of IHR was mental disorders, which accounted for 39% of all retirements, followed by musculoskeletal disorders representing 17% of retirements. In his report, the CMO states that it is important that preventative measures are in place to reduce a department’s IHR rate. These include promoting a healthy workplace and sick leave absence management.
The EAS
The Civil Service EAS77 is an independent work-based confidential support service co-ordinated by the Department of Finance. It is designed to assist employees manage personal difficulties, which, if left unattended, may adversely affect their work performance and/or attendance and their quality of life.
In 2007, over 6,000 contacts were made to the EAS which included over 3,100 individuals seeking assistance with either work related or personal issues and a similar number of information queries. Employee Assistance Officers (EAOs) also provided confidential consultation to managers concerned with employees experiencing problems. Over one fifth of all contacts were made by managers where the health and wellbeing of their staff were of concern.
In 2007, 55% of the EAS’s casework was work related, while 45% was of a personal nature. Although there has been a decrease in the number of contacts with the EAS in the period 200378 to 2007, there has been an increase of almost 45% in the number of work related cases dealt with by the EAS in this period. In 2007, almost two thirds of work related issues related to interpersonal difficulties (20%), work/life (19%), retirement issues (14%) and stress (13%). Over 60% of personal issues related to physical health (25%), mental health (20%) and family relationships (17%).
A review of the EAS to examine and make recommendations on the service post decentralisation was recently carried out by a sub-group of the Personnel Officers’ Network. The main recommendations arising from the review were that
the Personnel Officers’ Network engage with the Department of Finance to pursue devolution of responsibility for the provision of a departmental welfare programme to departmental heads, facilitating flexibility to develop and enhance such programmes to meet departmental needs
76 Ill Health Retirement in the Irish Civil Service 2003-2006, Office of the Chief Medical Officer for the Civil
Service, 2007. 77 The service has been provided in the Civil Service since 1974. 78 In 2003, over 8,300 contacts were made with the EAS, of which over 3,200 people sought assistance. The
decrease is attributed to increased usage of the internet for health related forms.

88 Sickness Absence in the Civil Service
the Department of Finance retain a policy and monitoring involvement regarding the provision of employee welfare programmes to ensure that policy and agreed standards are adhered to
a combined internal and external EAS offered the potential for a considerably enhanced EAS for employees that is both progressive and cost effective.
The best structure for delivery of the EAS is the subject of active consideration by the Department of Finance.
In its 2008 report on the Management of Sickness Absence in the NICS, the NIAO commented that the Department of Finance and Personnel (DFP) contracted with a single provider in September 2006 to provide employee assistance services to the whole of the NICS. A telephone service is provided 24 hours a day, 365 days a year and staff can have up to six face-to-face counselling sessions a year.
The NIAO also commented that the provision of an effective welfare service is considered to be of great importance in supporting attendance in the NICS. At the time of the NIAO report the service was being provided by each department and involved the provision of a confidential support and information service to staff giving them the opportunity to discuss problems which affect their work and/or their ability to be at work. However, the DFP was reviewing options on the most effective delivery model for a centralised welfare service with links to an employee assistance programme, with a view to centralising the welfare service in DFP. This centralisation has since taken place.

Appendix D Assumptions Underpinning HRMS Data Analysis Staff absence count is based on staff employed by the 29 departments at any time during
the years 2007 and 2006 as included in the HRMS data files provided by CMOD79.
Analysis has been based on actual working days lost (excluding weekends and taking account of flexible working patterns).
The actual working days lost field in HRMS was not fully populated for 2006 data. Actual working days lost to sickness absence for 2006 are derived by applying a formula to the gross sick days to estimate the number of actual working days lost to sickness absence taking into account weekends and work sharing patterns. A weekend multiplier has been applied to all instances of absence that are equal to or greater than six gross sick days to estimate the portion of the week that staff were required to work.
Both ‘employee headcount’ and ‘WTE employee’ are used as appropriate throughout the report.
Employee headcount includes all staff who were employed over the course of the calendar year regardless of whether they joined or left during the year
WTE employee refers to the contracted time that each employee was employed for during the year taking account of each employee’s fulltime equivalent status and adjustments for starters and leavers within the period80.
The total number of instances of absence includes 705 instances where no actual working days were lost per the HRMS. This is due in part to worksharers who have instances of absence in the reporting period but were not due to attend work, which result in no loss of actual working days. The net impact on the results reported is negligible.
The figures shown in the report include data for all staff as recorded on the HRMS, including those whose ‘Employment Class Description’ or ‘Regular/Temporary Description’ is classified as
Staff on Leave
Temporary Staff
Temporary Staff on Contract
Regular on Contract
Those with an ‘*’ or a ‘N/A’.
Where instances of absence span a number of years, only actual working days attributable to the year under review are included in the calculation of absence for that year.
79 Temporary and contract staff including staff who have left the Civil Service are included in this count. 80 WTEs are displayed in some instances to the nearest full number for presentational reasons throughout
the report.
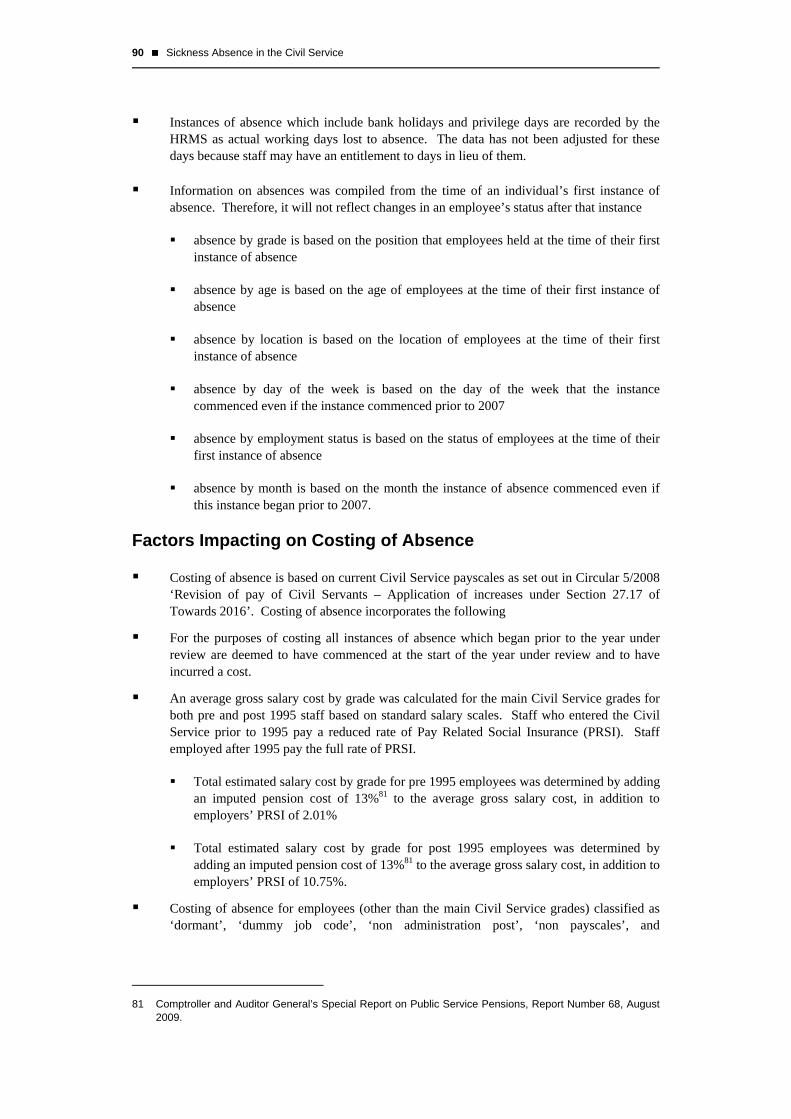
90 Sickness Absence in the Civil Service
Instances of absence which include bank holidays and privilege days are recorded by the HRMS as actual working days lost to absence. The data has not been adjusted for these days because staff may have an entitlement to days in lieu of them.
Information on absences was compiled from the time of an individual’s first instance of absence. Therefore, it will not reflect changes in an employee’s status after that instance
absence by grade is based on the position that employees held at the time of their first instance of absence
absence by age is based on the age of employees at the time of their first instance of absence
absence by location is based on the location of employees at the time of their first instance of absence
absence by day of the week is based on the day of the week that the instance commenced even if the instance commenced prior to 2007
absence by employment status is based on the status of employees at the time of their first instance of absence
absence by month is based on the month the instance of absence commenced even if this instance began prior to 2007.
Factors Impacting on Costing of Absence
Costing of absence is based on current Civil Service payscales as set out in Circular 5/2008 ‘Revision of pay of Civil Servants – Application of increases under Section 27.17 of Towards 2016’. Costing of absence incorporates the following
For the purposes of costing all instances of absence which began prior to the year under review are deemed to have commenced at the start of the year under review and to have incurred a cost.
An average gross salary cost by grade was calculated for the main Civil Service grades for both pre and post 1995 staff based on standard salary scales. Staff who entered the Civil Service prior to 1995 pay a reduced rate of Pay Related Social Insurance (PRSI). Staff employed after 1995 pay the full rate of PRSI.
Total estimated salary cost by grade for pre 1995 employees was determined by adding an imputed pension cost of 13%81 to the average gross salary cost, in addition to employers’ PRSI of 2.01%
Total estimated salary cost by grade for post 1995 employees was determined by adding an imputed pension cost of 13%81 to the average gross salary cost, in addition to employers’ PRSI of 10.75%.
Costing of absence for employees (other than the main Civil Service grades) classified as ‘dormant’, ‘dummy job code’, ‘non administration post’, ‘non payscales’, and
81 Comptroller and Auditor General’s Special Report on Public Service Pensions, Report Number 68, August
2009.

Assumptions underpinning HRMS Data Analysis 91
‘professional/technical staff’ is based on the overall average daily cost of absence for all other defined grades.
For the purposes of this exercise it is assumed that all absence incurs a cost and that absence which exceeds 120 working days (greater than six months) in a calendar year results in payment at half the normal rate of pay – this absence has been costed accordingly.
The daily cost of absence by grade is based on 229 available working days.
Absence for temporary staff who may not be entitled to sick pay has been costed. Temporary staff absence for 2007 accounts for 1.5% of total sick days. The estimated cost of this absence is in the order of €860,000.
Unauthorised absence has also been costed. Unauthorised absence accounts for 0.15% of total sick days. The estimated cost of this absence is €94,000.

Appendix E Average Cost of Absence per Employee (Headcount) Department Estimated direct
cost of absence Number of
working days lost
Average cost per
daya
Number of sick days
per employee (all staff)
Average cost per employee
(all staff)
Sick days availed of
by employee
(those who took sick
leave only)
Average cost per
employee (those who took sick
leave only)
Transport 1,274,796 6,796 188 12.97 2,433 21.11 3,959
Valuation Office 354,851 1,739 204 9.66 1,971 18.70 3,816
DHC 1,571,297 8,058 195 11.24 2,191 18.65 3,637
DCENR 952,382 4,840 197 9.88 1,944 18.40 3,621
DAFF 7,646,420 40,544 189 8.27 1,560 18.38 3,466
Attorney Gen. 303,696 1,060 287 7.31 2,094 12.05 3,451
Ombudsman 204,695 816 251 8.68 2,178 13.38 3,356
PAS 375,088 2,058 182 11.76 2,143 17.59 3,206
DPP 457,799 2,040 224 9.32 2,090 14.27 3,201
DSFA 11,913,204 70,200 170 12.88 2,186 18.61 3,158
OPW 1,132,706 5,466 207 6.70 1,388 15.14 3,138
DETE 2,185,391 11,929 183 10.12 1,854 16.94 3,104
President's Est. 40,334 224 180 8.30 1,494 17.23 3,103
Finance 1,249,089 5,289 236 7.40 1,747 13.12 3,099
DES 2,807,198 14,590 192 9.81 1,888 16.10 3,098
DJELR 3,826,341 19,039 201 8.24 1,656 15.34 3,083
Courts 2,149,276 10,926 197 8.45 1,662 15.52 3,053
PRA 1,923,953 11,047 174 13.14 2,288 17.23 3,001
Revenue 14,422,682 77,805 185 10.13 1,879 15.63 2,897
Foreign Affairs 2,021,269 10,857 186 7.65 1,423 15.55 2,896
DEHLG 2,285,826 12,173 188 8.41 1,580 15.37 2,886
CSO 1,907,386 12,086 158 11.80 1,863 17.75 2,801
Defence 813,640 4,597 177 10.10 1,788 15.80 2,796
DAST 205,223 1,317 156 7.36 1,146 17.56 2,736
DCRAGA 456,931 2,122 215 6.98 1,503 12.56 2,704
State Lab 187,622 1,118 168 11.41 1,915 14.91 2,502
Taoiseach 284,997 1,331 214 4.97 1,063 11.57 2,478
Oireachtas 589,216 2,706 218 5.67 1,235 11.14 2,425
CSSO 376,274 2,332 161 8.54 1,378 12.88 2,079
Total 63,919,582 345,105 185 9.81 1,817 16.62 3,078
Analysis by Office of the Comptroller and Auditor General
Note: a The average cost per day to nearest euro.

Appendix F Overall Summary Statistics by Department, 2007 (Headcount and WTE Employee)
Department Percentage of
employees (headcount) who availed of sick leave
Percentage of
employees (headcount) who didn't
avail of sick leave
Average number of sick
days per employee
(headcount)
Average number of
absences per employee
(headcount)
Average number of sick days per WTE
employee
Average number of absences per WTE employee
Average length of each absence
Lost time rate per OCAGa
State Lab 76.53 23.47 11.41 2.93 12.43 3.19 3.90 5.43
PRA 76.22 23.78 13.14 2.69 15.94 3.26 4.88 6.96
DSFA 69.20 30.80 12.88 2.02 15.12 2.37 6.37 6.60
PAS 66.86 33.14 11.76 2.23 13.69 2.60 5.26 5.98
CSO 66.50 33.50 11.80 1.81 14.01 2.15 6.52 6.12
CSSO 66.30 33.70 8.54 1.80 9.80 2.06 4.75 4.28
DPP 65.30 34.70 9.32 2.67 10.60 3.03 3.49 4.63
Ombudsman 64.89 35.11 8.68 2.46 10.21 2.89 3.53 4.46
Revenue 64.84 35.16 10.13 1.77 11.83 2.06 5.73 5.16
Defence 63.96 36.04 10.10 1.91 11.51 2.17 5.30 5.02
Transport 61.45 38.55 12.97 1.76 14.23 1.93 7.37 6.21
DES 60.93 39.07 9.81 2.08 11.13 2.35 4.73 4.86
Attorney Gen. 60.69 39.31 7.31 1.63 8.86 1.97 4.49 3.87
DHC 60.25 39.75 11.24 1.84 13.12 2.15 6.10 5.73
DETE 59.71 40.29 10.12 1.68 11.69 1.94 6.02 5.10
Finance 56.36 43.64 7.40 1.43 8.17 1.58 5.17 3.57
DCRAGA 55.59 44.41 6.98 1.54 7.75 1.71 4.54 3.38
DEHLG 54.73 45.27 8.41 1.57 9.50 1.78 5.34 4.15
Courts 54.45 45.55 8.45 1.39 9.75 1.60 6.08 4.26
DJELR 53.72 46.28 8.24 1.41 9.74 1.67 5.83 4.25
DCENR 53.67 46.33 9.88 1.39 11.64 1.64 7.09 5.08
Valuation Office 51.67 48.33 9.66 1.58 11.42 1.87 6.10 4.99
Oireachtas 50.94 49.06 5.67 1.21 6.46 1.38 4.70 2.82
Foreign Affairs 49.15 50.85 7.65 1.69 8.56 1.89 4.53 3.74
President's Est. 48.15 51.85 8.30 0.78 10.38 0.97 10.67 4.53
DAFF 45.02 54.98 8.27 1.22 9.21 1.36 6.78 4.02
OPW 44.24 55.76 6.70 1.20 7.69 1.38 5.59 3.36
Taoiseach 42.91 57.09 4.97 1.27 5.48 1.40 3.91 2.39
DAST 41.90 58.10 7.36 1.11 8.21 1.23 6.65 3.59
Overall Average 59.03 40.97 9.81 1.69 11.30 1.95 5.81 4.93
a OCAG refers to the Office of the Comptroller and Auditor General

Appendix G Distribution of Absence Type by Department
Department Number of certified
sick days
Number of certified
absences
Average length of certified
absence
Number of uncertified sick days
Number of uncertified absences
Average length of
uncertified absence
Number of unauthorised
days
Number of unauthorised
absences
Average length of
unauthorised instance
Total number of working days lost
Total number of absences
Average length of overall
absence
Presidents Est. 215 15 14.33 9 6 1.5 0 0 0.0 224 21 10.67
Transport 6,354 545 11.66 442 377 1.2 0 0 0.0 6,796 922 7.37
DCENR 4,350 408 10.66 490 275 1.8 0 0 0.0 4,840 683 7.09
DAFF 37,525 3,675 10.21 2,995 2,295 1.3 24 14 1.7 40,544 5,984 6.78
DAST 1,247 146 8.54 70 52 1.3 0 0 0.0 1,317 198 6.65
CSO 10,974 998 11.00 1,091 848 1.3 21 9 2.3 12,086 1,855 6.52
DSFA 63,874 6,008 10.63 6,093 4,929 1.2 233 86 2.7 70,200 11,023 6.37
Valuation Office 1,623 189 8.59 113 95 1.2 3 1 3.0 1,739 285 6.10
DHC 7,326 781 9.38 700 537 1.3 32 3 10.7 8,058 1,321 6.10
Courts 10,049 1,107 9.08 877 691 1.3 0 0 0.0 10,926 1,798 6.08
DETE 10,713 1,119 9.57 1,216 861 1.4 0 0 0.0 11,929 1,980 6.02
DJELR 17,404 2,031 8.57 1,635 1,233 1.3 0 0 0.0 19,039 3,264 5.83
Revenue 70,425 7,752 9.08 7,339 5,787 1.3 41 31 1.3 77,805 13,570 5.73
OPW 5,012 613 8.18 454 365 1.2 0 0 0.0 5,466 978 5.59
DEHLG 10,986 1,280 8.58 1,187 999 1.2 0 0 0.0 12,173 2,279 5.34
Defence 4,132 494 8.36 465 374 1.2 0 0 0.0 4,597 868 5.30
PAS 1,882 256 7.35 166 134 1.2 10 1 10.0 2,058 391 5.26
Finance 4,729 563 8.40 560 460 1.2 0 0 0.0 5,289 1,023 5.17
PRA 9,813 1,364 7.19 1,081 885 1.2 153 13 11.8 11,047 2,262 4.88
CSSO 2,059 261 7.89 273 230 1.2 0 0 0.0 2,332 491 4.75
DES 13,020 1,831 7.11 1,555 1,242 1.3 15 14 1.1 14,590 3,087 4.73
Oireachtas 2,385 317 7.52 321 259 1.2 0 0 0.0 2,706 576 4.70
DCRAGA 1,906 297 6.42 216 170 1.3 0 0 0.0 2,122 467 4.54
Foreign Affairs 9,698 1,462 6.63 1,158 933 1.2 1 1 1.0 10,857 2,396 4.53
Attorney Gen. 913 116 7.87 147 120 1.2 0 0 0.0 1,060 236 4.49
Taoiseach 1,146 197 5.82 185 143 1.3 0 0 0.0 1,331 340 3.91
State Lab 969 173 5.60 137 113 1.2 12 1 12.0 1,118 287 3.90
Ombudsman 697 135 5.16 119 96 1.2 0 0 0.0 816 231 3.53
DPP 1,780 371 4.80 259 212 1.2 1 1 1.0 2,040 584 3.49
Total 313,206 34,504 9.08 31,353 24,721 1.3 546 175 3.1 345,105 59,400 5.81

Appendix H Distribution of Absence by Day of the Weeka
Sick leave instances commencing by day of the week
Certified Sick Leave Unauthorised Absence Uncertified Sick Leave Total Sick Leave
First Day Sick Number of Instances
Percentage of Total
Number of Instances
Percentage of Total
Number of Instances
Percentage of Total
Total Number of Instances
Percentage of Total
Monday 11,894 35% 44 25% 7,048 28% 18,986 32%
Tuesday 7,660 22% 35 20% 5,083 21% 12,778 22%
Wednesday 6,315 18% 25 14% 4,660 19% 11,000 19%
Thursday 5,101 15% 34 20% 4,576 19% 9,711 16%
Friday 3,453 10% 37 21% 3,273 13% 6,763 11%
Saturday 53 0% 0 0% 42 0% 95 0%
Sunday 28 0% 0 0% 39 0% 67 0%
Total 34,504 100% 175 100% 24,721 100% 59,400 100%
Sick leave instances commencing on a Monday, by grade
Certified Sick Leave Unauthorised Absence Uncertified Sick Leave Total Sick Leave
Grade Description Number of Instances
Percentage of Total
Number of Instances
Percentage of Total
Number of Instances
Percentage of Total
Total Number of Instances
Percentage of Total
Senior Management 136 1% 0 0% 53 1% 189 1%
Assistant Principal 529 4% 0 0% 280 4% 809 4%
Administrative Officer 332 3% 0 0% 187 3% 519 3%
Higher Executive Officer 1,007 9% 0 0% 574 8% 1,581 8%
Executive Officer 2,407 20% 13 30% 1,452 21% 3,872 21%
Staff Officer 612 5% 0 0% 377 5% 989 5%
Clerical Officer 6,093 51% 26 59% 3,751 53% 9,870 52%
Non-Payscales 4 0% 0 0% 5 0% 9 0%
Professional/Technical Post 241 2% 1 2% 148 2% 390 2%
Other 533 5% 4 9% 221 3% 758 4%
Total 11,894 100% 44 100% 7,048 100% 18,986 100%

96 Sickness Absence in the Civil Service
Sick leave instances commencing on a Monday, by age stratification
Certified Sick Leave Unauthorised Absence Uncertified Sick Leave Total Sick Leave
Age Stratification Number of Instances
Percentage of Total
Number of Instances
Percentage of Total
Number of Instances
Percentage of Total
Total Number of Instances
Percentage of Total
16 – 24 502 4% 3 7% 425 6% 930 5%
25 – 34 2,794 23% 13 30% 2,003 28% 4,810 25%
35 – 44 3,398 29% 19 43% 1,977 28% 5,394 28%
45 – 54 3,822 32% 9 20% 2,015 29% 5,846 31%
55 - 65 and over 1,378 12% 0 0% 628 9% 2,006 11%
Total 11,894 100% 44 100% 7,048 100% 18,986 100% Note: a Percentages shown may not match due to rounding of figures.

Appendix I Distribution of Absence by Gender, 2007
Age Stratificationa
Male WTE employees as percentage of
total
Female WTE employees as percentage of
total
Average days lost per
WTE male employee
Average days lost per WTE female
employee
Average number of instances per WTE
male employee
Average number of instances per WTE female
employee
16 – 24 34% 66% 5.32 8.62 1.97 2.42 25 – 34 37% 63% 6.98 12.78 1.86 2.78 35 – 44 42% 58% 7.75 14.60 1.55 2.48 45 – 54 45% 55% 8.36 13.86 1.16 2.17 55+ 63% 37% 9.68 16.94 1.03 2.24
45% 55% 8.15 13.85 1.37 2.41 Source: Analysis by Office of the Comptroller and Auditor General Notes: a The information is presented on the basis of WTE employee which takes account of the portion of the year worked
by starters and leavers.

Appendix J Approaches to Absence Management used by Departments
Approach Number of Departments using
Approach
Departments using approach as
Percentage of Total
Number of Departments using the Approach that
find it Effective
Percentage of Departments using the Approach that
find it Effective
Number of Departments using the Approach that did not express an
opinion on effectiveness
Percentage of Departments using the Approach that did not express an
opinion on effectiveness
Gradual return to work in cases of long-term absences 29 100% 26 90% 3 10% Services of the Office of the Chief Medical Officer 29 100% 25 86% 4 14% Regular communication with employees on long-term absence 29 100% 21 72% 8 28% The use of "trigger points" to engage with employees when they reach a certain level of absence
28 97% 24 86% 4 14%
Employee Assistance Services 28 97% 19 68% 9 32% Disciplinary procedures for unacceptable absences 27 93% 22 81% 5 19% Line management involvement in absence management 26 90% 18 69% 8 31% Health promotion 26 90% 16 62% 10 38% Leave for family circumstances 25 86% 16 64% 9 36% Providing line managers with sickness absence information 23 79% 17 74% 6 26% Restricting sick pay 20 69% 17 85% 3 15% Stress counselling 18 62% 10 56% 8 44% Occupational Health Professional Involvement 17 59% 14 82% 3 18% Return-to-work interviews for longer-term absences only 17 59% 13 76% 4 24% Removal of self-certification 15 52% 14 93% 1 7% Attendance record is a recruitment criterion 15 52% 13 87% 2 13% Rehabilitation programme 14 48% 9 64% 5 36% Disability leave not counted as sickness absence 13 45% 5 38% 7 54% Nominated absence case manager/management team 10 34% 9 90% 1 10% Managers trained in absence handling 7 24% 5 71% 2 29% Return-to-work interviews for all absences 3 10% 1 33% 2 67% Attendance bonuses or incentives 2 7% 2 100% 0 0% Physiotherapy services 1 3% 1 100% 0 0% Source: Survey of Departments

Appendix K Additional CMOD Comments
(Paragraph 4.33 refers)
CMOD stated that it should be noted that the HRMS is not a bespoke system but a complex system containing over 20,000 tables. The purpose of the system is to record information about all areas of HR including the absence management function.
For its successful operation, CMOD pointed out that it requires
staff in HR Units to have attended the appropriate HRMS training courses that it has provided
staff in HR Units to have attained a satisfactory level of skill in IT and HR related matters
departments to assign only suitably skilled staff to HRMS duties so that any updates, additions and other interventions are properly made to ensure system and data integrity are maintained
the appropriate business processes to be in place to ensure timely input of data, which in turn, will result in accurate reporting.
CMOD further pointed out that in relation to reporting, the system is delivered with a data extraction tool with basic reporting functionality, such as ordering, sorting, and selection. It stated that if richer reporting functionality is required, for example, statistical or trend analysis, a reporting software package needs to be used locally to carry this out. CMOD stated that this further requirement has been outlined to departments since the start of the system implementation process and is reiterated at every report writing training course.