sick textile units-a comparative study of cost and ... · mills (kanpur, up, india) through the...
TRANSCRIPT

SICK TEXTILE UNITS-A COMPARATIVE STUDY OF COST AND PROFITABILITY OF THE
QAEMSHAHR (MAZANDARAN, IRAN) AND KANPUR (UP., INDIA) UNITS
ABSTRACT T H E S I S
SUBMITTED FOR THE AWARD OF THE DEGREE OF
Bottor of $I|iIojB;opf)|> IN
COMMERCE
By
KHOSRO FAGHANl MAKRANI
Under the Supervision of
DR. S. HUSAIN ASHRAF (READER)
DEPARTMENT OF COMMERCE AUGARH MUSLIM UNIVERSITY
ALIGARH (INDIA)
2005

INTRODUCTION
A study of the various textiles developed and used by different
nations through ages, provides an excellent commentary on the progress
of civilization and a fair glimpse of the industrial life and economic
condition of the people. Man from his birth to the last moment of his life
and even for burial is in need of products, produced by the textile
industr}. The various uses of the products of textile industry speak of
their imj^oriance in human life.
Iran and .India have been the home of textile from times
immemorial. The fabrics which their handicraftsmen produced were
unequalled for their beauty and delicacy and found way into every part of
the world. It was therefore, appropriate in a sense that the first large scale
industr)' to be developed in these countries should have been opncemed
with the manufacture of textile. The textile industry in Iran and India has
many similarities both economic and non-economic.
In view of the increasing population, the demand for textiles
products are increasing. \ mere increase in the number of textile units
and sudden enhancement of investment in the industry cannot beget
progress unless they ultimately result in a steady increase in production
and also in profitability. Moreover, study of production and profitability

is important as it gives an insight in to the effective utilization of
productive resources and economic health of various units of the textile
industry.
For quality product and better profitability working should be
based on prescribed standard and also on better utilization of resources. It
is, therefore, imperative to evolve a system to obtain more information of
income and expenditure for the textile unit, because information is the
root for development process of any business entity. This information
will contribute to the growth of textile industry by evolving a system of
accounting including cost, financial and management accounting,
pertaining to different aspects of textile products output and marketing.
Accounting is the key to management information system as it
provides financial database. It is the only system that furnishes financial
information to the various user groups to become more effecti\e and
efficient. Accounting as a decision making system has enormously grown
over the centuries. It has given rise to three broad branches of financial,
cost and management accounting. The object of financial accounting is to
find out the profitability and to provide information about the financial
position of the concern. Cost accounting is the body of concepts, methods
and procedures used to measure, analyse or estimate the cost, profitability

and performance of individual products, departments and other segments
of a company's operations for either internal or external use or both and
to report these informations to the interested parties. Management
Accounting is the term used to describe the accounting methods, systems
and techniques which coupled with special knowledge and ability, assists
management in its task of maximizing profit or minimizing losses.
SICK UNIT
The meaning of 'sick unit' is easy to understand but difficult to
define. It has different meanings to different people. The workers in a unit
may take the functioning as sick if they are not getting their wages and
increments in time. The management and investors may measure this in
term of inadequate return on their investment and dividend declared by
the company. The financial institution/banks give importance to the
repayment of their loans and units ability to pay interest regularly.
There are a number of definition of the sick unit based on different
norms viz. generation of surplus, erosion of equality, liquidity. To an
investor the sick unit is one which skip dividends. To an industrialist it
means recurring losses and tottering on the brink of closure. So, the
meaning of sick unit is based on different norms such as generation of

surplus, liquidity and solvency position, erosion of equity, the amount
and the period of irregularities etc,
CONCEPT OF PROFIT
In a general term, profit is the excess of revenue, proceeds, or
selling price over related costs. The primary objective of a business
undertaking is to earn profits. Profit earning is considered essenfial for the
survival of the business. Profit is the engine that drives the business
enterprise. A business needs profit not only for its existence but also for
expansion and diversification. A business enterprise can discharge its
obligation to the various segments of the society only through earning of
profits. Profits are, thus, a useful measure of overall efficiency of a
business. Profit to the management are the test of efficiency and a
measurement of control; to owners, a measure of worth of their
investment; to the creditors, the margin of safety; to employees, a source
of fringe benefits; to government, a measure of tax-paying capacity and
the basis of legis!ati\e action; to customers, a hint to demand for better
quality and price cuts; to an enterprise, less cumbersome source of
finance for growth and existence.

CONCEPT OF PROFITABILITY
Profitability refers to the ability of a firm to generate earnings of
revenues in excess of expenses. Continuing profitability is a primary
measure of the overall success of a company, it is a necessary condition
for survival. Analysis of profit is vital concern to various participants of
the organization from their own points of views.
Further, increased profit can cause a rise in the market price of the
share leading to capital gains. Profits are also important to creditors as
profits are one source of funds for debt coverage. Management is vitally
interested in profits as it is often used as a performance measure. Test of
profitability focus on measuring the adequacy of income by comparing it
with one or more primar>' activities or factors that are measured in the
financial statements.
CONCEPT OF COST
The term 'cost' has a varying meaning depending upon the context
in which it is used. Cost are the resources sacrificed or foregone to
achieve a specific objecnve. Cost is defined as the benefits given up to
acquire goods or services. It is an exchange price, a sacrifice made to
secure some benefit. The benefits (goods or services) given up are
measured in money by the reduction of assets or incurrence of liabilifies.

When benefits are actually received, the cost becomes an expense. An
expense is defined as a cost that has given a benefit and has now expired.
Un-expired cost that can give future benefits are classified as assets. In
management terminology the term cost refers to expenditure and not the
price. For our purposes, cost is not the same as price. Thus, cost refers to
something that must be sacrificed to obtain a particular thing.
COSTING
Costing is the technique and process of ascertaining cost. It consist
of the principles and rules which are used for ascertaining the cost of
production and services. The process of costing is the day-to-day routine
of ascertaining cost. Costing can be carried out by the process of
arithmetic, by means of memorandum statement or by the methods of
integral accounts. The main object of costing is to ascertain the cost of
each product, process, department, service or operation. In every
manufactured product or operation, there are three elements. There are
materials, labors and overheads. These primary elements provide
management with information necessaiy for income measuring and
product pricing.

COST ANALYSIS
Cost analysis refer to the break up of total cost into certain
elements or sub-divisions, such analysis is essential for the purpose of
management and control over costs. The cost analysis play a dominant
role in setting the framework of managerial decision. But the information
provided in the profit and loss statement and cost of goods solds
statement (Reports) is not an end in itself as no meaningful conclusions
can be drawn from these statement alone. However the information
provided in these statement is of immense use in making decision through
analysis and interpretation. Cost analysis is the process of identifying the
cost and profitability of the firm by properly establishing relationship
between the items of the profit and loss statement and cost of goods sold
statement. There are various methods or techniques used in analyzing
cost, such as break-even point analysis, cost-volume-profit analysis
margin of safety and profit volume ratio.
OBJECTIVE OF THE STUDY
The main objectives of this study are:
- To study definition, process, phases, signs, detection sick textile
unit and reason of textile units sickness.
- To study the concept of cost and profitability.

- To investigate the financial position of Taharastan Textile
corporation (Qaemshar, Marandaran, Iran) and Swadeshi Cotton
Mills (Kanpur, UP, India) through the balance sheet and profit and
loss statement.
- To analysis the cost and profitability, cost volume profit and
liquidity ratio and the two mills.
- To compare the cost and profitability of Tabarestan Textile
corporation and Swadeshi Cotton Mills.
HYPOTHESIS OF THE STUDY
Hypothesis of the study is as follows:
Tabarestan Textile corpoj-ation and Swadeshi Cotton Mills are sick
- These textile mills are working under break even point.
- Liquidity and solvency of these textile mills are unsatisfactory.
- These textile mills are unprofitable, but they could overcome their
losses.
RESEARCH METHODOLOGY
To arrive at specific conclusions, a judicious use of conventional
approaches of both the deduction and induction methods have been made.
Further, to highlight the problems reliance has been placed on
interpreting data and information with economic reasoning. This has been

helpful in chartering a meaningful and coordinated approach to the whole
issue of industrial development in Iran and India.
For information and data pertaining to the industrial development,
particularly the development of textile industry, infrastructure and the
whole economy, the researcher has relied upon the publications of the
Plan and Budget Organization, Iranian textile magazines, cost audit
reports, accounting review, auditing and accounting magazine of Iran,
Bank-e-Markazi Iran (Centural Bank of Iran), and other relevant
publications on Iran both in English and Persian. However, other sources
of information viz., the daily and periodicals published in Iran and other
countries, have also been consulted. Thus, the researcher has relied upon
different sources. Relevant data and information ha\'e also been obtained
from the Embassy of the Islamic Republic of Iran, New Delhi, India;
though it may be remarked that the study does not base itself on
conclusions and interpretations drawn from official information and data
alone. Effort have been made to deduce logic in the light of conclusions
drawn in the course of this study. Similarly, while studying the sick
textile units of Kanpur (India) the researcher has relied upon the reports
of the Textile Corporations, Mills at Kanpur and other reports and
publications including:

- Cost Audit Repots for the financial years 1996-2001.
- Northern India Textile Research Association.
- Progress in Textiles: Science and Technology.
- The Textile Association of hidia.
- U.P. Industrial Consultants Ltd. Kanpur
These have been of great help in increasing the validity of the data
collected as well as its reliability.
THE SCOPE OF INQUIRY
The scope of the research pertains to the period from 1996 to 2001
on the textile units of Qaemshahr (Mazandaran, Iran) i.e., the Tabarastan
Textile Corporation, and the textile unit of Kanpur (U.P. India) i.e., the
Swadeshi Cotton Mills.
FINDINGS
The researcher gives the brief points about the major important
findings of his study. They are as follows:
1. The total assets of the Tabarestan Textile Corporation decreased
during the five years under study over previous year except in
2001.

2. Total liabilities of the Tabarestan Textile Corporation and
Swadeshi Cotton Mills increased during the five years under
study over previous year.
3. Owners' equity of the Tabarestan Textile Corporation and
Swadeshi Cotton Mills decreased during the five years under
study over previous year.
4. Net sales of the Tabarestan Textile Corporation decrease during
the years 1998 and 1999 over previous year. The Concern was
non operative in 2000, and net sales of the concern was very
low in 2001.
5. The net sales and job convention charge of the Swadeshi Cotton
Mills increased during 1998 and 1999 over previous year, but
decrease during 2000 and 2001 over previous year.
6. The cost of goods sold of the Tabarestan Textile Corporation
and Swadeshi Cotton Mills was more than the net sales during
the five years under study.
7. Return on shareholder investment and return on equity capital
of the Tabarestan Textile Corporation and Swadeshi Cotton
Mills were negative during the five years under study.
11

8. Current ratio of the Tabarestan Textile Corporation was less
than 1 except in 1997.
9. Quick ratio of the Tabarestan Textile Corporation was less than
0.5 except in 1997.
10. The Current ratio and Quick ratio of the Swadeshi Cotton Mills
were less than 0.4 during the five years under study.
CHAPTER SCHEME
The present work has been divided into six chapters.
Chapter (i) - Research Methodology
In the first chapter, an attempt has been made to trace the
importance of textile. The growth of textile industry can be gauged in
terms of trends in its production, profitability and productivity.
Information is prerequisite to success of an organization and
accounting is the key to management information system for providing
financial database. The importance of financial, cost and management
accounting has been briefly discussed in this chapter.
The objective of the study, hypothesis, literature survey, research
methodology, scope of inquiry and framework has been elaborated in this
chapter.
Chapter (ii) - History of Textile
In the second chapter, an attempt has been made to highlight the
historical background of textile, because any study of textile is
12

incomplete without a historical perspective. Historical stages in textile
such as definition of textile, textile in pre-historic, early civilization,
classical antiquary, textile in middle ages, textile in 19"' and 20*
centuries, growth of the industry. British textile industry (the birth place
of modern textile industry), European textile industry, Asian textile
industry, Iranian textile industry and Indian Textile Industry has been
briefly discussed in the chapter.
Chapter (iii) - Sickness in Textile Units
In the third chapter, we have discussed the definition of sickness,
process of sickness of textile units, phases of sickness in textile units,
signs of sickness, detection of sick textile units and reasons of textile
sickness.
Chapter (iv) - Cost and Profitability, A Concept
In the fourth chapter, v/e have discussed about cost and
profitability. A detailed discussion on concept of cost, concept of
profitability, significant of profitability, profitability and financial
viability, profitability performance measure, concept of cost, Costing,
cost analysis, cost volume profit analysis, liquidity rafios as a tool for
assessing the cost and profitability of cotton mills has been done.
13

Chapter (v) - Analysis of Cost, Profitability and Financial Position of
Textile Mills
In the fifth chapter we analyzed the financial position, liquidity and
solvency of Tabarestan Textile Corporation and Swadeshi Cotton Mills
through the balance sheets. We also analyzed cost, cost volume profit and
profitability of Tabarestan Textile Corporation and Swadeshi Cotton
Mills through their income statements (Profit and loss account).
Chapter (vi) - Finding and Suggestions
In the last chapter, we have discussed our findings and also main
problems faced by the textile industry of Iran and India. In the end
suggestions are being given to improve the performance of textile
industry in Iran and India.
A H O S R O F A G H A N I MAKRAr>JI DR. S.HUSAIN ASHR4J RhSh-AKCH SCHOLAR SUPERVISOR
14

SICK TEXTILE UNITS-A COMPARATIVE STUDY OF COST AND PROFITABILITY OF THE
QAEMSHAHR (MAZANDARAN, IRAN) AND KANPUR (U.P.. INDIA) UNITS
T H E S I S
SUBMITTED FOR THE AWARD OF THE DEGREE OF
Boctor of $t)tlos;opI)i^ IN
COMMERCE
By
KHOSRO FAGHANI MAKRANI
Under the Supervision of
DR. S. HUSAIN ASHRAF (READER)
DEPARTMENT OF COMMERCE ALIGARH MUSLIM UNIVERSITY
ALIGARH (INDIA)
2005

T6291

Reader
)'lZ\lcrnal : ® Intcmal
0091-571-2703661 3010/3505/3506
DEPARTMENT OF COMMERCE ALIGARH MUSLIM UNIVERSITY
ALIGARH - 202002 (U.P.) INDIA.
Dated:
Certificate
This is to certify that Mr. Ehosro Faghani Makrani has
completed his thesis entitled *Sick Textile Units - A
Comparative Study of Cost and Profitability of the
Qaemshahr (Mazandaran, Iran) and Kanpur (U.P. India)
Units*, under my supervision. To the best of my knowledge and
belief the work is of original nature. R also fulfils the requirements
for the award of Ph.D. Degree at the Aligarh Muslim University,
Aligarh, India.
{Dr. S. Husain Ashraf) Supervisor
Resilience :JM-AKB^R, DIGCI ROAD, ALlGARH-2()20(n P h o n e No. : 0 091-5 71-2703989
E-Mail - [email protected]

CONTENT
Dedication Certificate
S.No. Chapter Description Page No.
1. - Acknowledgement i-ii
2. - List of Tables iii-iv
3. Chapter-I Research Methdology 1-27
4. Chapter-ll History of Textile 28-57
5. Chapter-Ill Sickness in Textile Units 58-90
6. Chapter-IV Cost and Profitability, a Concept 91-118
7. Chapter-V Analysisof Cost, Profitability and Financial
Position of Textile Mills 119-180
8. Chapter-VI Finding and Suggestions 181-208
9. - Bibiliography 209-218
10. - Appendix 219-253

ACKNOWLEDGEMENT
In the name of Allah the most beneficent and merciful who showed
me the path and blessed me with the strength to complete the present
study.
I express my deep sense of gratitude to my teacher and supervisor
Dr. S. Husain Ashraf, Reader, Department of Commerce, A.M.U.,
Aligarh, for his valuable and painstaking guidance throughout all stages
of my work. Without his guidance, inspiration and encouragement, this
work would have never been completed.
My sincere thank are due to Prof M. Mushtaq Ahmad, Chairman,
Department of Commerce, A.M.U., Aligarh for providing research
facilities and taking interest in the progress of my work. I am also
thankful to Prof Qamaruddin Khan, Dean Faculty of Commerce for his
encouragement.
I acknowledge with thanks the kind of help I received from Prof
S.M. Waseem who with his vast Imowledge of Iran has enable me to
complete this work.
I am thankful to all learned teachers and staff member of the
Department for their cooperation and encouragement throughout this

study. I am also thankful to all the non-teaching staff of the Seminar
Library of the Department for their help and cooperation during the
course of this study.
I woe much to my family, my wife Fatemeh Soghra Sina, my son
Amin and my daughter Atena v/ho should have suffered a lot for two
years during my absence from Iran. They deserve a word of gratitude for
shouldering the burden of my problems due to my preoccupations.
[Khosro Faghani Makarani]

LIST OF TABLES
Table No.
Table-1
Table-2
Table-3
Table-4
Table-5
Table-6
Table-7
Table-8
Table Description Page No
Comparative Balance Sheet of the Tabarestan Textile
Corporation "Increase or Decrease in Term of
Percentage"
Comparative Balance Sheet of the Tabarestan Textile
Corporation "Absolute Figure"
Comparative Balance Sheet of the Tabarestan Textile
Corporation "Increase or Decrease over previous year"
Common Size Balance Sheet of the Tabarestan Textile
Corporation "Absolute Figure and Percentage Share"
Comparative Income Statement of the Tabarestan
Textile Corporation "Increase or Decrease in Term of
Percentage"
Comparative Income Statement of the Tabarestan
Textile Corporation "Absolute Figure and Percentage of
Increase and Decrease Over Previous Year"
Common size Income Statement of the Tabarestan
Textile Corporation "Percentage on the Base of Net
Sales"
Profitability Performance Measures, Cost value Profit
Analysis and Liquidity Ratio of the Tabarestan Textile
Corporation.
125
128
131
137
141
145
147
148
I I I

Table-9 Comparative Balance Sheet of the Swadeshi Cotton
Mills "Increase or Decrease in Term of Percentage"
Table-10 Comparative Balance Sheet of the Swadeshi Cotton
Mills "Absolute Figure"
Table-11 Comparative Balance Sheet of the Swadeshi Cotton
Mills "Increase or Decrease Over Previous year"
Table-12 Common Size Balaace Sheet of the Swadeshi Cotton
Mills "Absolute Figure and Percentage Share"
Table-13 Comparative In Statement of the Swadeshi Cotton Mills
"Increase or Decrease in Term of Percentage"
Table-14 Comparative Income Statement of the Swadeshi Cotton
Mills "Absolute Figure and Percentage of Increase or
Decrease Over Previous year"
Table-15 Common size Income Statement of the Swadeshi
Cotton Mills "Percentage on the Base of Net Sales and
Job Conversion Charge"
Table-16 Profitability performance Measures, Cost Volume
Profit Analysis and Liquidity Ratio of the Swadeshi
Cotton Mills
155
158
159
165
166
168
173
174
IV

CHAPTER-1
RESEARCH METHDOLOGY 1.0
1.1
1.2
1.3
1.4
1.5
1.6
1.7
Introduction
Objective of the Study
Hypothesis of the Study
Literature Survey
Research Methodology
The Scope of Inquiry
Framev/ork
Reference
2
6
8
8
16
18
22
24

1.0 Introduction
A study of the various textiles developed and used by different
nations through ages, provides an excellent commentary on the progress
of civilization and a fair grasp of the industrial life and economic
condition of the people. Some knowledge of textile is necessary to every
one, because textiles have an important bearing on our daily life.
The history of covering the body or for that matter the necessity of
clothes, goes back to the period when mankind entered into society.
Kermani (1995) said that "man needed two things from the very
beginning of his existence on this earth."'
Firstly, the food for his existence and health. Secondly, covering of
his body to protect himself against the weather. Thus, the need of clothing
is one of the essential needs of human being.
Textile industry as compared to other industries, has more scope
from the view point of usage of its products. Man from his birth to the
last moment of his life and even for burial is in need of products,
produced by the textile industry. This is the only industry the products of
which are used in various stages of life. Its products are required in
different varieties and in different seasons of the year. Products of textile
industries are needed in various shapes and in various moments of needs.

e.g., office dresses, formal dresses for formal occasion, informal dresses
and sleeping dresses etc. These various uses of the products of textile
industries speak of their importance in human life.
Development of textile has been a strange pattern of trial and
errors. Ever since textile were used for making apparel, climate seems to
have had much to do with textile utilization. In view of the increasing
population, the demand of the products of textile industries are also in the
increase. To meet day-to-day requirements, a concentrated effort is
needed. Reorientation of the existing textile industries and creation of
new textile industries are also a must for increasing the output of dynamic
levels of adequacy. Production which is conceived as transformation of
inputs into output, is taken as an index of progress. A mere increase in the
number of textile units and sudden enhancement of amount of investment
in the industry cannot beget progress unless they ultimately result in a
steady increase in production and also in profitability. Moreover, study of
production and profitability is important for it gives an insight into the
effective utilization of productive resources and economic health of
various units of the textile industry.
The growth of textile industry can be gauged in terms of trends in
its production, productivity and profitability. A textile unit which exhibits

such trends would be able to reduce per unit cost, face competition in
both the domestic and international markets and thereby succeed in
expanding markets for its product while generating surpluses to meet its
expansion programme. For better results in favour of the investors,
products and profitability of the textile industries, working should be
based on the prescribed standards, and better utilization of the facilities.
Experts say a vague knowledge of expenditures and incomes is the big
impediment in the development and expansion of textile industries. It is,
therefore, imperative to evolve a system to obtain exact information of
income and expenditure in the field of textile output. This information
will contribute to economic growth by evolving a system of accounting
including cost, financial and management accounting, pertaining to
different aspects of textile products output and marketing, because this is
an information age, and information is the root of development process of
business entities. It has been recognized an important business resource.
Decision making is based on the assimilation and interpretation of
information. Therefore, in a textile unit, provision of information is basic
to it success. Accounting is the key of management information system of
provides financial database. It is the only system that furnishes financial
information to the various user groups to help achieve effectiveness and

efficiency. Accounting as a decision support system has enormously
grown over the centuries. It has given rise to three broad branches of
financial, cost and management accounting. The basic principles
applicable to all the three streams are the same and the difference is
mainly one of emphasis. According to the American Accounting
Association (1996) "Accounting, essentially, is financial information." It
is the process of identifying, measurement and communicating economic
information to permit informed judgements and decisions by the users of
the information." R.K. Sharma (2003) stated that "the object of financial
accounting is to find out the profitability and to provide information
about the financial position of the concern."" Shillanglaw (1971) opined
"Cost accounting is the body of concepts, methods and procedures used
to measure, analyse or estimate the cost, profitability and performance of
individual products, departments and other segments of a company's
operations for either internal or external use or both and to report on these
questions to the interested parties." According to J. Betty (2003)
"Management Accounting is the term used to describe the accounting
method, systems and techniques which coupled with special knowledge
and ability, assists management in its task of maximizing profits or
minimizing losses."^ Since costing enables a textile unit not only to find

out what cost the various jobs or processes have but also what they
should cost. Therefore, it indicates where losses and wastes are occurring
before the production is finished. Costing is also a tool of management
that is used in day-to-day control and supervision of manufacturing,
distribution and administrative activities. The information regarding cost
of each unit produced or service rendered by systematic accounting
would enable a textile unit to know where to economise on cost, how to
fix prices, how to maximize profits and so on.
1.1 Objective of the Study
All economic units according to the nature of their functions, can
be classified in three sections or groups.
Section One: Under this section those units are grouped that earn
by serving the society. In general these units are known as service
agencies viz., transport agencies.
Section Two: Under this section those units come that earn through
trading and selling commodities.
Section Three: Counted under this section, are the manufacturing
units.
Textile industry is classified under the manufacturing units and the
success of these economic units is determined by their output, marketing.

finance, personnel, management and finally by their profitability. Their
profitability is determined through the financial statements, that include
balance sheet, income statement (profit and loss statement). Today,
Economic units whether small or big confi-ont more complex situation,
because of competifion in the market, fluctuation in prices, crises in
business relations, swift change and development in technology, and
growing economic consciousness amongst the people. Increase of the
profit sharing has become a major target of the economic units. This
target can be achieved by raising the profitability of the economic units
and decreasing the cost of goods sold and services rendered. So, it is a
must for the texfile industries to take care of a proper system of
accounting. It should not depend on insignificant and incomplete
financial information. All the information have to be accurate, clearly
giving the advantages and benefits. It is, therefore, essential for the
managers to create a clear information and accounting system. So, the
main objective in this thesis:
1. To investigate the definition and history of textile.
2. To study definifion, process, phases, signs, detecfion sick texfile
unit and reason of texfile unit's sickness.
3. To study the concept of cost and profitability.

4. To investigate the financial position of the Tabarestan Textile
Corporation, (Qaemshahr) and Swadeshi Cotton Mills, (Kanpur)
through the balance sheet and profit and loss statement.
5. To analysis the cost and profitability, cost volume profit and
liquidity ratio of Tabarestan Textile Corporation and Swadeshi
Cotton Mills.
6. To compare the cost and profitability of Tabarestan Textile
Corporation, (Qaemshahr) and Swadeshi Cotton Mills, (Kanpur).
1.2 Hypothesis of the Study
Hypothesis of the study is as fellows:
- Tabarestan Textile Corporation, (Qaemshahr) and Swadeshi Cotton
Mills, (Kanpur) are sick.
- These Textile Mills are working under break even point.
- Liquidity and solvency of these Textile Mills are unsatisfactory.
- These Textile Mills are unprofitable, but they could overcome their
losses.
1.3 Literature Survey
Since the topic of thesis is about the sick textile units, their cost
and profitability, it is necessary to historically survey the textile units,
causes of their sickness and also their cost, structure, their profitability

and costing methods in order to use the data for making the strategy to
reduce their cost and increase their profitability.
For this purpose, we have divided the worii into two parts: First
part comprises the review of textile unit's sickness and the related studies
along with the researches unden:akes in relation to Iran and India textile
units. The second part covers the researches done on cost and costing
techniques, cost estimation and ascertainment, cost accounting practices
and also the studies conducted abroad. The purpose of this survey is to
review the relevant research done on the subject.
Nowadays, Textile industries are considered as the biggest
casualties of industrial sickness. Richa Mihra (2003) said that "the
industrial trends show that textile continues to be a major area where
incidence of industrial sicl<ness was felt most severely due to the changes
witnessed in the liberalization era."^
N.K. Singh (2003) stated that "the incidence of sickness and
closure of the textile units has been a matter of concern, and the one main
reason for sickness is low productivity due to lack of modernization,
stagnation in demand, inability to expand in the export market, and
difficulties in getting timely and adequate working capital."^ According
to the Annual Report (December, 1988) of the Board for Industrial and

Financial Eeconstruction (BIFR), the textile sector lias been the most
affected by industrial sickness, followed by metallurgical, paper and
pulp. According to the Report, the reasons for sickness in the textile
industry are government policy, management problems, production and
technical problems and marketing glitches. Dipankar Mukherjee (1998)
said that "the genuine reason for sickness of industrial units are the
technological obsolescence, lack of planning, timely modernization, loss
of market and over and above all the work culture, which comprises good
corporate and good management culture."^ Kranti Nagvedcar (2000)
stated that "the textile industry has been plagued with one problem or the
other at different points in time. '° One of the problems has been that of
growing sickness in this industry; though this is not uncommon in other
sectors also. The main reasons for sickness in the textile industry could be
attributed to the structural transformation in the mill sector and
competition faced from power looms, having greater advantage. The
other reason could be excess capacity, lower productivity of labour and
machines, lack of modernization and technological upgraduation,
increase in expenses of inputs particularly the key raw materials as well
as lack of adequate working caphal. Dave (1987) in her published Ph.D.
thesis on the topic "Industrial Sickness and Some Key Areas of

Management, A Study of Textile Industry of Gujarat", examined the
strengths and weaknesses of management practices against the norms laid
down by various authorities of management science. She significantly
examined the linkage between quality of management practices and the
problem of industrial sickness. Quality of management in sick units has
been found to be lower than that in healthy units i.e., there is a close and
important relationship between the quality of management and health of
industrial units. However, the study was mainly confined to the
management view point.
According to research of Hadi Reza Khan (2000) "the textile
industries had been occupying a pivotal place due to their size,
employment, their contribution to the domestic product and exports, and
also due to their significant share in industrial production." Most of the
people were directly or indirectly supported, deriving partial or full
subsistence from the cultivafion of cotton or production of textiles. The
textile industry had a high linkage and hence there were wide range of
industries and activities which in various measures, depended on and
derived their substance from the texfile sector. Textile industry morever
was more job oriented than other industries including the oil industry. In
comparison to other industries, it was least dependent on non-native

recourses. Mozaffar Chalamghani (2000) said that "the added value of
1 -7
only dress material from amongst its products were more than 500%."
But Marjan Arab (2001) stated that "now the textile industries are at the
verge of closure and disappearance.""'* Labour problem in this industry in
different parts of the world has also been noticed during the last few
years. Scholars have carried researches and investigations regarding the
decline and fall of textile industries. Eghbali (2002) stated that "the
problems faced by the textile industry, is divided into two types: Internal
Problems and external problems. The internal problems are as follows:
1. Structural and management problems.
2. Non-availability of and also negligence towards information
technology.
3. Low output of labour force.
4. Poor quality of the products.
5. Management weakness.
6. Improper utilization of the investments. 7. More concentration on quantity and least care for quality.
8. Least attention towards the need of repairs and renovation.
The external problems are also as follows:
- Lack of definite industrial strategy.
12

- Privatisation of foreign exchange policy and non-availability of
requisite funds for importing raw material and apparatus.
- Non availability of cash due to restrictive policy of banks.
- Inconsistency of labour laws and unemployment insurance in
relation to production.
- Smuggling of foreign textiles.
- High tax rates and non co-operation of the government in accepting
the ledger accounts.
- National and provincial duties."'^
The problems of textile industries and trend of the production of
cloth and yarn, employment, exports and the causes of low productivity,
have been discussed in detail by Hadi Reza Khan. He has stressed that the
problems of the textile industries are as follow:
- Change in consumer preferences.
- Heterogeneity.
- Under-utilization of Capacity.
- Raw materials availability
- Defective plant layout and planning
- Obsolete machinery affecting productivity.

The above scholars had not taken into account an assessment
system related to the cost and profitability of textile industries.
Now, the researcher reviews the literature covering the work done
relating to different aspects of cost. Skinner (1978) has discussed the
problems which businesses face in using absorption costing for
determining their profit and valuing their stocks. These problems such as
the profit figures computed by means of cost-volume profit techniques,
are variable costing not absorption costing.'^ Vangundy (1973) has
explained that "the method selected for costing within a specific
company, should be the one most likely to provide the most usable
information."'^ Harvery has discussed a new approach of costing system
called life-cycle costing system and has presented the many advantages of
this approach like reducing life-cycle cost, increasing profitability and
plant efficiency, while providing a major decision making and profit
improving system. Matsuda (1976) has explained that the standard cost
system reflects the effect of rapid and significant changes of raw material
I O
prices enabling to make the calculation of annual profits precisely.
Walker (1972) explained in his article the advantage of the application of
simple form of standard cost system, such as monthly statements and
other operating data are easily obtained for making comparison between
14

actual and estimated hours.'^ Mura (1991) has showed that the success in
development of principles and practices in cost management and its
implementation in almost all sectors of the economy, is bound to yield
immense benefits. Smith (1965) has discussed the considerable
developments in technology and management techniques, due to this
there has been a tendency for the indirect cost burden to increase and
prime cost to decrease. It adds further that indirect costs now account for
as much as 50 percent of total costs, making it much more important to
get proper control of indirect cost to carry out programmes of cost
reduction. Guttikonda and Cook (1992) have studied the relationship
between general and administrative expenses and cost of production and
accordingly the general administrative expenses be included in cost of
production. They emphasized that due to rapid increase in the relating
size of general and administrative experience of many firms, it should be
included in cost of production. " Laszlo (1978) in his study emphasised
that the actual practice differ from the traditional elementary principles of
costing. He realized that the fundamental change in costing practice
would have an effect on the valuation of stocks as well as management
accounting. Razaee and Elmore (1993) have conducted a study to
determine the effectiveness and efficiency of the cost accounting system.
15
used by defence contractors. The study revealed that the cost accounting
systems are mainly used to provide cost estimation. They are not used for
performance evaluation or management decision making. '* Pencras
(1991) has explained that the cotton textile companies maintain a costing
system based on detailed performa statement. He says that a couple of
them are applicable to textile industry. ^ Dey (1989) has conducted a
running survey of cost accounting practices in cotton textile industry in
India. In this survey he concentrated on the progressive growth of
accountability in the cost accounting record in India. Murty (1979) in
his study discussed how to control and reduce cost by studying the cost
behaviour of each item of the element of cost.
Most of the above studies are concentrated on different types and
techniques of cost accounting, saying that cost estimate techniques, cost
accounting system and cost control techniques aim at increasing
profitability and decreasing cost through control of various elements of
cost.
1.4 Research Methodology
To arrive at specific conclusions, a judicious use of convenfional
approaches of both the deduction and induction methods have been made.
16

Further, to highlight the problems reliance has been placed on
interpreting data and information with economic reasoning. This has been
helpful in chartering a meaningful and coordinated approach to the whole
issue of industrial development m Iran and India.
For information and data pertaining to the industrial development,
particularly the development of textile industry, infrastructure and the
whole economy, the researcher has relied upon the publications of the
Plan and Budget Organization, Iranian textile magazines, cost audit
reports, accounting review, auditing and accounting magazine of Iran,
Bank-e-Markazi Iran (Centural Bank of Iran), and other relevant
publications on Iran both in English and Persian. However, other sources
of information viz., the daily and periodicals published in Iran and other
countries, have also been consulted. Thus, the researcher has relied upon
different sources. Relevant data and information have also been obtained
from the Embassy of the Islamic Republic of Iran, New Delhi, India;
though it may be remarked that the study does not base itself on
conclusions and interpretations drawn from official information and data
alone. Effort have been made to deduce logic in the light of conclusions
drawn in the course of this study. Similarly, while studying the sick
textile units of Kanpur (India) the researcher has relied upon the reports
17

of the Textile Corporations, Mills at Kanpur and other reports and
publications including:
- Cost Audit Repots for the financial years 1996-2001.
- Northern India Textile Research Association.
- Progress in Textiles: Science and Technology.
- The Textile Association of India.
- U.P. Industrial Consultants Ltd. Kanpur
These have been of great help in increasing the validity of the data
collected as well as its reliability.
1.5 The Scope of Inquiry
The scope of the research pertains to the period from 1996 to 2001
on the textile units of Qaemshahr (Mazandaran, Iran) i.e., the Tabarastan
Textile Corporation, and the textile unit of Kanpur (U.P. India) i.e., the
Swadeshi Cotton Mills.
Iran's textile industry has a history that stretches, when this Gulf
State was one of the premier exporters of textile and silk to Europe, Asia
and the rest of the World.
About a hundred years ago the first textile mill was started with
European machinery. It was established in Tehran, and today over 17% of

Iran's work-force is covered by the industrial sector, and 25% of this total
i.e., 4,000,00 is covered by Iran's textile industry.
However, a large number of Iranian textile units are old and less
than 30% of the workers in the textile industry who work in modem units,
produce more than 60% of textiles. So, labour productivity in the modem
factories is four times more than that of the old ones. With its population
of 60 million set to rise to 100 million in the next few years, Iran is facing
difficulty in the domestic clothing and apparel market. 38 million people
are between the ages of 15 and 64, and the labour force is set to grow
from 19 million in 1999 to 28 million by 2010. 61%) of the people live
urban areas. Iran produces 250,000 tonnes of cotton, 200,000 tonnes of
synsthic fiber and 100,000 tonnes of polyester fiber each year. With the
Govemment investment of $20 million many of the plants today are
sophisticated employing hi-tech machinery. Needless to say that
resurgence of Iran's textile industry could provide an exciting new base
for expansion of the economy. One of the main problems in Iran's textile
units is the low rate of productivity. Iran's Textile Magazine (2002)
announced that due to people's low purchasing power, the demand for
textile products has gone down. ' On account of these two factors, many
problems have been created for the textile mills, especially for the old
19

units. To encourage output of consumer goods the Government has been
import capital goods.
Textile industry occupy an importance place in the India economy
also by virtue of its size, employments, its contribution to the gross
domestic product, exports, its significant share in the industrial
production and private final consumption expenditure. The industry
comprise the organized mill sector and the decentralized powerlooms,
handlooms and khadi.
Handloom industry is the oldest industry in India. It was organized
around 1850. The textile sector of India is the second largest sector of the
economy, next only to agriculture, in term of production, employment,
exports and consumption. About one-tenth of India's population depends
on it for their livelihood. It is the largest manufacturing industry,
contributing about one-fourth (24%) to the value added of by the
manufacturing sector. It continues to remain so in spite of considerable
diversification of the industrial base since independence in 1947. The mill
sector contributes a fifth to the value added by the organized industry.
The decentralized texfile sector contributes one-third to the value added
by unregistered manufacturing units. Bulk of India's textile production
emanates from the unorganized and decentralized sector which forms a
20

significant part of the rural production base. The Indian textile economy
is also characterized by high cost, high price, low production, low
productivity and low per capita consumption of cloth.
The QAEMSHAHR units like the textile units in KANPUR have
been suffering from a number of problems falling within the area of
management, finance, labour, productivity, cost, financial control,
profitability and marketing, etc. These have been discussed to arrive at
the conclusions to give appropriate suggestions to help remove sickness,
so that the capital invested in these units may start yielding profit.
Needless to say that profitability may be increased by maximizing
production to help reduce the unit cost. Thus, the research aims to
analyzing and interpret data and information pertaining to SWADESHI
COTTON MILLS, KANPUR, (U.P. INDIA) and TABARESTAN
TEXTILE CORPORATION, QAEMSHAHAR (MAZANDARAN,
IRAN). Points of lapses as in the sick units will be identified as also the
responsiveness of management to help solve the problems adversely
affecting the fiancfioning of the mills. After all the scarce resources must
be judiciously employed to maximize returns of the stakeholders.
21

1.6 Framework
The present work has been divided into six chapters.
In the first chapter, an attempt has been made to trace the
importance of textile. The grov/th of textile industry can be gauged in
terms of trends in its production, profitability and productivity.
Information is prerequisite to success of an organization and
accounting is the key to management information system for providing
financial database. The importance of financial, cost and management
accounting has been briefly discussed in this chapter.
The objective of the study, hypothesis, literature survey, research
methodology, scope of inquiry and framework has been elaborated in this
chapter.
In the second chapter, an attempt has been made to highlight the
historical background of textile, because any study of textile is
incomplete without a historical perspective. Historical stages in textile
such as definition of textile, textile in pre-historic, early civilization,
classical antiquary, textile in middle ages, textile in 19 ^ and 20*
centuries, growth of the industry. British textile industry (the birth place
of modern textile industry), European textile industry, Asian textile
industry, Iranian textile industry and Indian Textile Industry has been
briefly discussed in the chapter.
22

In the third chapter, we have discussed the definition of sickness,
process of sickness of textile units, phases of sickness in textile units,
signs of sickness, detection of sick textile units and reasons of textile
sickness.
In the fourth chapter, we have discussed about cost and
profitability. A detailed discussion on concept of cost, concept of
profitability, significant of profitability, profitability and financial
viability, profitability performance measure, concept of cost. Costing,
cost analysis, cost volume profit analysis, liquidity ratios as a tool for
assessing the cost and profitability of cotton mills has been done.
In the fifth chapter we analyzed the financial position, liquidity and
solvency of Tabarestan Texfile Corporation and Swadeshi Cotton Mills
through the balance sheets. We also analyzed cost, cost volume profit and
profitability of Tabarestan Textile Corporation and Swadeshi Cotton
Mills through their income statements (Profit and loss account).
In the last chapter, we have discussed our findings and also main
problems faced by the textile industry of Iran and India. In the end
suggestions are being given to improve the performance of textile
industry in Iran and India.
23

1.7 References
' Kermani, Saffarzadeh, 1995, A Picture of Textile and Clothes Industry,
The Ministry of Industries, Tehran, Iran, p.85.
^ American Accounting Association, 1966, A Standard of Basic
Accounting Theory, p. 1.
^ Sharma, R.K., Gupta, Shasl i K, 2003, Management Accounting,
Kalyani Publisher, New Delhi, India, p. 1.2.
^ Shallanglaw, G., 1971, Cost Accounting, Analysis and Control,
Homewood, Irwin, Richard D.
^ Sharma, R.K. and Gupta, Shashi K., 2003, Management Accounting,
Kalyani Publishers, New Delhi, India, p. 1.12.
^ Mishra, Richa, 2003, Textile majors feel the heat, www.blonnet.com.Feb.l2.
Singh, N.K., 2003, Member Planning Commission, Steering Group
Report on Investment and Growth in Textile Industry, Ministry of
Textiles, November 7.
* Mishra, Richa, www.hindubusinessiine.com/businessline/2001/02/13/storeis/03136999.html.
^ Mukherjee, Dipankar, 1998, Industrial Sickness and Work Culture,
www. ganashakti. com
24

'° Nagvedcar, Kranti, 2000, United State-Environmental Resource Center,
www.us.erc.org.
" Dave Natini, V. 1987, Industrial Sickness and Key Areas of
Management, Peep and Deep Publication, New Delhi.
' Khan, Hadi Reza, 2000, "Impact of Absenteeism on Cotton Textile
Industry of U.P. with Special Reference to Kanpur Mills",
unpublished Ph.D. Thesis, 2000, Dept of commerce, A.M.U.,
Aligarh, India.
'• Chalamghani, Mozaffar, 2000, The Iranian Textile Magazine,
February-March published in collaboration with the Association of
Iran Textiles, Tehran, Iran, No. 102, p.53.
"* Arab, Marjan, 2001, The Iranian Textile Magazine, Tehran, Iran,
No.l08,p.53.
' Eghbali, 2002, The organization of Industries and Mines Director, The
Iranain Textile Magazine, Published in collaboration with the
Association of Iran Textiles, Tehran, Iran, No. 105, p. 13.
'^ Skinner, R.C., 1978, Volume Variance under Variable and absorption
Costing, Management Accounting, USA, April.
25
1 -7
Vangundy, Shyaron E., 1973, Cost Accounting Standards and the
Management Accountant, Management Accounting, USA,
September.
'^ Matsuda, Hiromu, 1976, Introduction of Standard Cost Accounting in
Japan, Management Accounting, USA, January.
'^ Wailker, Charles W, 1972, Standard Cost Accounting for Contracting,
Management Accounting, USA. July.
° Mura, Bahadur, 1991, Cost Management, the Emerging Profession,
Management Accounting, Calcutta, India. February.
^' Smith J.E., 1965, Reduction in Indirect Cost, Management Accounting,
U.K., May.
^ Guttikonda, Ramamohan. R. and Cook, Dohis M., 1992, Should
general and Administrative Cost be Treated as Product Cost
Theoretical and Empirical Study, Management Accountant,
Calcutta, India, January.
Laszlo, Petter J., P. 1978, How Variable are Direct Wages
Management Accounting, USA, October.
^ Rezaee, Zabihollah and Elmore Robert C.E., 1993, The Use of Cost
Management System in Different Industries, Management
Accountant, Calcutta, India, July.
26

^ Pencras, U. 1991, Cost Accounting Records of Cotton Textile-Some
Issues, Management Accountant, Calcutta, India, November.
Dey, Nirajan, Development of Cost Accounting Practices in Cotton
Textile Industry, 1989, Management Accountant, Calcutta, India,
January.
^ Murty, M. Vishnu, 1991, Uses of Cost Audit Report, Management
Accountant, India, April.
^ The Iranian Textile Magazine, December-January, 2002-2003,
Published in collaboration with Association of Iran Textile
Magazine, Tehran, Iran, No. 112, p. 120.
27

CHAPTER-2
HISTORY OF TEXTILE 2.1 Definition of Textile 29
2.2 History of Textile 30
2.3 Textiles in Pre-historic Period 33
2.4 Textile in Early Civilizations 34
2.5 Classical Antiquity 35
2.6 Textiles in Middle Ages 36
2.7 Textiles in 19th and 20th Centuries 38
2.8 Growth of the Industry 39
2.9 Britain: the Beginning of the Modern Textile Industry 40
2.10 European Textile Industries 41
2.11 Asian Textile Industries 42
2.12 Iranian Textile Industries 42
2.13 Indian Textile Industries 48
2.14 Reference 56
28

In order to have a better understanding of textile industry, it is
necessary to iiave an insight iato it. So, this Chapter deals with the
definition, process and history of textile.
2.1 Definition of Textile
The word textile comes from the Latin word, Textile and the
French world, Texere, which mean activity pertaining to weaving of
fabrics, woven or capable of being woven; formed by weaving, that may
be woven; a woven fabric. Hence the textiles are the materials that can be
converted into yarns and fabrics of any nature or character. Technically
they must be of spinnable length. Only then they can be made into spun
yarns. The word Textile when used as a noun means anything woven or
suitable for weaving. In other words it applied to any fabric or product
manufactured from fabrics, filament or yams; natural or artificial by
means of interlacing, interloping, felting or stitching the fibre web, for
example, threads ropes, knitted fabrics, nets, felts etc.
Hence textile is a very comprehensive term that includes all
clothing, carpets, curtains tapes and upholstery, etc. When used as an
adjective textile refers to manufacture of raw materials, processing
machinery, personnel used in the organization connected with the
technology of their manufacture. This, it includes the following: Textile
29

Mill, Textile Institute, Textile Engineer, Textile Research. Textile
Printing, Textile Designered, Textile Technologist, etc. The use of
textiles for clothing and furnishing depend upon a unique combination of
properties. Textile are warm, they are soft to touch; they are completely
flexible and thus take up any desired shape without resistance; and they
are usually hardwearing.
The reason for these properties is to be found in the structure of
textile materials. Textiles are derived from threads or yarns which have
been interlaced in one way or other. The threads themselves are flexible,
and in their loose interweaving they remain flexible, conferring this
property on the cloth itself
In their turn, the threads or yarns are made by twisting together the
long, thin, flexible but strong things we call fibres. Ultimately, properties
of any material must depend very largely on the properties of the fibres
from which it is made. The spinning and weaving processes obviously
have their effect on the final textile.
2.2 History of Textile
In most part of the world, clothing is as basic a human need as food
and shelter, and when fabrics replaced the animal skins of the earliest
men, textile became a main factor in economic history. They have
30

affected, and have been affected by political, cultural, military, and even
religious history. To give a representative example of their importance,
textile wool was the basis for prosperity of the most important medieval
city states in Italy and Fladers, for the trading activities of the Hanseatic
league, and for the rise of England as a commercial nation.
Silks have ranked with jewels and spices as the most converted
imports from the East since the days of the Roman Empire.
Silk manufacture played an important role in the French economy
in comparison of the European countries in the 16' century.
Cotton was of such an irresistible importance in 18 century
Europe that it contributed to the downfall of the merchantile system.
In the southern United States the replacement of tobacco with
cotton as the chief crop served to perpetuate the slave system.
th
In the 18 century first factories was built to make textile and their
production, distribution and mechanization first on a capitalistic basis.
The desire to produce textiles quickly of different qualities was one of the
main causes of the industrial revolution.
In the 20' Century the replacement of natural fibers by synthetics
may have equally far-reaching consequences.
31

Textiles are among the most perishable of major artifacts. This
characteristic is most important for the prehistoric period, since, like
wooden implements, textile can not survive burial unless the soil is very
dry or very wet.
Even in later ages the complete disintegration of most discarded
fabrics has caused historical distortions, for always only the most
precious textile were not thrown away.
Generally speaking, it may be said that surviving fabrics are those
made with much mental and physical labor. Silk on the other hand, was
less used for purely utilitarian purposes. Consequently, a written account
of its history, illustrated by actual specimens of material, is far more
possible than for wool. This is so, even though in most countries much
more wool than silk must always have been woven, and its economic
importance was at least equally great. The rarity of ancient specimens of
wool is also due to the fact that of all fabrics it is the most liable to
destruction by insects.
The study of fine textiles can be one of the branches of history of
art. Owing, however, to the extreme difficulty of the craft of cloth
making, and the consequent conservatism of its masters, there is often a
time lag between the introduction of a new style by artists and its
32

acceptance by weavers. Names of fabrics are notoriously vague and
frequently change their meanings. Thus, dimity, now the name of a thin,
sheer cotton fabric, was used for a heavy cotton in the 18" Century.
Pictorial evidence, though it provides fairly reliable information about the
patterns used at different periods, and, more rarely, about the types of
looms and other tools, seldom shows how the pattern was placed on, or
incorporated into the cloth. It is often not possible to determine whether
that design was produced on the draw loom, weaving, by tapestry by
embroidery, by knotting (as in rugs), or even by painting or printing.
2.3 Textiles in Pre-historic Period
Textile were invented by Neolithic man. Fragments of woven linen
and wool have been excavated from Swiss lake village and other very
damp prehistoric sites. Among the nations all over the world a great
variety of techniques are found to be used for basketry as well as for
flexible fabrics. Many of these techniques undoubtedly antedate the loom,
for example, coiling, a one-thread technique known in Tasamania, Peru
and Scandinavia. Spinning, to hold the fibers together, is often considered
a necessary preliminary to weaving, but there are tribes that weave with
knotted threads. With the invention of the warp beam a bar that holds taut
the far ends of the warps, can be said to have been invented. However,
33

there are many widespread primitive techniques using stretched threads
that are not actually weaving. Then, the mechanical methods of forming
the shed (separation of warps), using the sword and heddle rods, were
added to the loom. With this can true weaving be said to have begun. Felt
is also, probably older than woven fabrics, and it is especially frequent
among nomadic tribes. The tapa cloth of Polynesia made from bark, is
another successful substitute material for woven fabric, produced by
people who had no fibers suitable for weaving.
2.4 Textiles in Early Civilizations
By the time men began to live in cities, all the natural fibers were
in use, and textile production was certainly extensive. Unfortunately,
there are only two early civilizations, those of Egypt and Peru, from
which large amounts of actual fabrics have been preserved. Woven linen,
between 6,000 and 7,000 years old, has been found in Egypt, as have
patterned design in tapestry technique, dating from the 15' century B.C.
in Peru, cotton and the wool of the llama and similar animals were used,
and fabrics woven from them have been found in the earliest cultural
levels. In addition, cotton has been woven in India from 2000 B.C. silk in
China from 500 years earlier. Minute fragments of woven and
34

embroidered silk have been found embedded in the patina of bronzes of
the Shang dynasty (1523-1028 B.C.)
2.5 Classical Antiquity
Very few textiles have survived from the period of Roman Empire
in the West and the Han Dynasty (202 B.C.-220 B.C.) in the East. Silk
fragments have been found in excavations at the Chinese frontier station
of Loulan, on the 3,000 mile (4,800 Km) Silk Road across Asia, at
Palmyra in Syria, and at Noinula in Siberia, showing that the Chinese
were using an elaborate loom in the V^ Century B.C. This may have been
invented in China early in the Christian era; though some authorities
believe it was first used in Syria. It enabled elaborately patterned fabrics
to be made in great quantities, instead of by the slow method of tapestry
weaving. The use of cotton on cloth from India was widespread all over
the world at the time of Roman Empire. The only extensive extent group
of old world fabrics of this period are the "Coptic" textiles found in the
graves of Roman Egypt. The textiles of Egypt are of wool and linen,
usually in tapestry weave, and are coarse in design and technique. The
few silk fragments that have been found in Egypt, are draw loom fabrics
and have been woven in Syria. The remarkable textiles excavated from
ice-filled tombs in Giberia in the second quarter of the 20" Century are
35

thought to date from about 400 B.C.; though some authorities place them
much earlier. They include knotted rugs, tapestries, and much applique
embroidery in felt.
2.6 Textiles in Middle Ages
The Persian textile from Sassanid era (224: 642 A.D.) on huge rock
carvings in Persian, and fragments of silk that came to Europe, were
preserved as wrappings for relics, endpapers for bookbindings, and other
uses. These are among the earliest textiles that have never been buried,
such as the Shoso-in collection at Nara. Some of the latter are strongly
influenced by Sassanid designs, which also greatly affected the silk
weavers of the Byzantine Empire in 552. The first silk fabrics were made
from 10* to the 12" Century, and the first great Islamic silk was made in
Baghdad, Syria, Persia, Egypt and Spain. Sicily was also an Islamic
center until it felt to the Normans in the 11" Century.
The cultivation and weaving of silk confinued there for 200 years,
the fabrics showing a mixture of Muslim and Byzantine motifs. It is
customary to attribute the rise of the silk industry on the Italian mainland
to the decline of Sicilian weaving in the mid 13* Century. But over 100
years before that decline set in, the silk industry was already flourishing
at Lucca. They are remarkable works. The Mongol conquests of the 13*
36

century temporarily reopened the overland silk routes, which had been
closed by the Muslims for 600 years. By the time when Marco Polo
reached the Court of the Great Khan in 1275, Chinese silk once more
entered Europe in quantities, causing extraordinary changes in Italian
textile design. Unfortunately, no silk of the period has been identified in
China, but their influence on the weavers of Lucca is unmistakable. The
lively, fantastic creatures of the asymmetrical Chinese designs replaced
the Stiff, Heraldi Romanesque animals and, when treated with typical late
Gothic spirit and naturalism, produced fabrics like illustrations to fairy
tales. They were three types of textiles in Europe in 14" Century that
have never been surpassed: the woven silks of Lucca, the woolen
tapestries of France, and the silk embroideries, opus anglicanum, of
England. From this period the history of luxury fabrics in Europe can be
followed in paintings, and many complete vestments, alter frontals, and
other church furnishing have survived. Italian and Spanish silk were
weaving throughout the Middle Ages. In 15* Century fabrics most of the
designs were based on the so-called pomegranate which may be derived
ultimately from the Egyptian Lotus, as transformed by the Chinese and
Persian weavers and most of the extant fabrics are silk velvets. Velvet
was the last weave to be invented, perhaps in Italy or Persia in the 12
37

Century. Wool is found in the tapestries of Northern Europe. Some linen
pieces of the period are still in existence, the most notable being the
towels made in Perugia, ornamented with Gothic designs in blue cotton.
2.7 Textiles in 19*" and 20*" Centuries
The Industrial Revolution in this field may be traced back to 18*
and early 19 Centuries. The most important one was the Jacquared
attachment to the draw loom, which made the weaving of elaborately
patterned fabrics a mechanical process. But even more destructive of
artistic quality and quantity production were the rising standard of living
and the increase in population. Textile, like all other decorative arts, felt
the effect of the unprecedented gulf that suddenly opened between the
fine and the applied arts. The 19* Century is, therefore, the first period in
history for which there is no evidence of a relationship between the work
of the great artists and that of the designers for the applied arts. The great
artists themselves were seldom appreciated by their contemporaries until
the end of the century when some types of luxury fabrics were produced
that testify to a normal relationship. William Morris in England designed
tapestries and printed cloths in a neomedival style related to that of the
pre-Raphaelites, and founded the arts and crafts movement. Hector
Guimard in France, soon after the turn of the century, designed
38

embroideries as well as subway stations in the style called art nouveau. In
the first half of the 20' Century a number of centers, such as the Wiener
Werk State in Austria produced textiles in harmony with contemporary
style. In France, tapestry, a nadir of banality and zenith of technical
perfection in the 19* Century, v/as restored to the status of an art form.
By the mid-century there was some evidence that the challenge of the
machine had been met and that mass-produced textiles could hold their
own alongside the contemporary architecture, sculpture and painting.
2.8 Growth of the Industry
Throughout centuries of recorded history, textile workers grouped
together, sometimes because they practised the same craft, such as dyeing
or weaving, or because they worked with the same type of fiber: cotton in
India, and silk in China, etc. During the middle ages the grouping of
textile artisans was formalized by guilds that regulated the education and
working conditions of craftsmen and set product quality standards. Yet,
throughout this period professional craftsmen worked mainly in their own
homes or individual workshops. Only a few factories, such as the
Gobelins tapestry works in Paris, operated with a variety of skilled
craftsmen working under the same roof, carrying out many processes and
transforming raw materials into finished products.
39

2.9 Britain: The Beginning of the Modern Industry
About 1760 the profound changes that began to stir the textile
industry, erupted into the century which was still going on in newly
emerging nations throughout the world. The Industrial Revolution
originated in Britain and later extended to the United States, both the
nations contributing a series of time and labor-saving inventions that
mechanized spinning, weaving, and other textile-making processes.
Among the reasons, economy dictated that groups of the new machines
be assembled near their source of power first animals, then water, then
steam, and finally electricity. In 18" Century development of the British
textile industry included the following:
(1) They increasing demand for more textiles was created by active
trade between Britain and her colonies.
(2) The technical readiness of the various textile processes for the
changeover to mechanization was forth coming.
(3) There was availability of workers previously engaged in
processing textiles at home.
(4) Britain provided damp climate for processing cotton, a fiber whose
strength improves under moist conditions.
40

(5) There was comparative ease with which cotton fibers could be
spun by mechanical means.
(6) Due to inventions mechanization of process as was possible.
However, there was an increase in the speed.
2.10 European Textile Industries
The British were partially responsible for the early spread of the
Industrial Revolution to Belgium, through their establishment of machine
shops and textile factories in Liege. France, though maintaining
supremacy in luxury branches of the textile trades such as silks, which
required highly trained workers and more time-consuming production
methods, did not become an industrial power until the mid-19 Century.
One of France's major contributions to the growth of the textile
industry was the Jacquard mechanism, a loom attachment utilizing an
endless chain of punched cards that enabled a weaver, unaided, to make
complex patterned fabrics. The method Jacquard mechanism first used in
silk manufacture was applied to shawl weaving in Britain in 1818
approximately, and then to the weaving of coverlets, carpets, and table
linens in the United States around 1820. Political turmoil in Germany and
other European countries proved hindrance to industrial growth. Once
this was resolved, Germany's textile industry grew very rapidly. Between
41

1870 and World War I, it developed as the world's leading synthetic dye
industry. Russia was exporting linen as early as the 19^^ Century but East
European countries in general lagged behind until after the first 5-year
plans brought them into the circle of industrial powers.
2.11 Asian Textile Industries
Although both had long been famous for their fine textiles, China
and Indian did not begin modernizing until the 20" Century and Japan,
which produced cotton and silk mainly by hand methods, until it opened
its commerce to Western trade in the 1850s. Even as late as in 1890s
draw looms were used for weaving complex patterned silks. After Japan
recovered from the effects of World War II, its textile industries advanced
so much that the United States and other big producers enacted tariffs and
other measures to help reduce Japanese competition.
2.12 Iranian Textile Industries
The first textile factory established in Iran was Vatan (Kazerouni)
factory in Isfahan. It was established in 1925 by the private sector with
the support from the government. Later on, other textile factories were
established in the cities of Yazd, Kerman and Kashan and in the
provinces of Khorassan, Gilan, Mazandaran and Azarbaijan. During the
pre-World War II era, there were 40 textile factories active in Iran,
42

producing 60 million meters of cotton, silk, wool and cannabis cloths
annually four of these factories had been established by the government.
During that period, the main policy of the government was to
industrialize the country, expand textile industries and encourage private
investors to set up knitting and spinning factories. The textile industries
made progress at a low pace during the 1941-1955 period as a result of
which foreign made fabrics captured a large portion of the Iranian market,
causing a large amount of foreign exchange to flow out of the country.
During the first development plan before the victory of the
revolution, despite the reduction in hard currency revenues, a major part
of public credits and capital was channeled to the textile industry. In
keeping up with the government efforts the private sector embarked on
removing deficiencies in the textile industry and modernizing machinery
to an extent that the existing textile factories underwent drastic changes.
The number of cotton textile factories in the country rose from 30 to 41
and the number of spinning and wearing machines climbed to 333,840
and 4,337 respectively. The state owned textile factories operating in the
First Development Plan were the textile factory of Behshahr, textile
factory of Qaemshahr, silk factory of Chalous and jute processing plant of
Quemshahr. The Second Pre-revolution Development Plan once again
43

paid attention to the expansion of textile industry. At the beginning of the
plan in 1955, a three billion Riyals credit was allocated for this purpose.
Subsequently, the textile factories of Qaemshahr and Behshahr were
renovated and their annual production was risen from 5 million meters to
17 million meters and from 14 million meters to 30 million meter per
year respectively. With other investment made in the textile industry, the
production capacity of Tehran's Chintz factory jumped from 5 million
meters to 36 million meters. Then, a new plant with an annual capacity of
25 million meters was established in Qaemshahr. A new Chintz factory
with an annual production capacity of 7 million meters was constructed in
the place of the old factory. During the said Second Plan, the private
sector invested as much as 7 billion Riyals in the textile industry. The
production of textiles substantially increased at the end of the Second
Plan compared to the beginning of the Plan. The production of cotton
cloths increased from 62 million meters to 262 million meters, that of
woolen cloth from 1 million meters to 4 million meters and that of
cannabis products from 2,000 tons to 4,000 tons. The production of
woolen and cotton products experienced an upward trend particularly
from 1933 onwards so much so that by the year 1966, Iran did no longer
needed import of foreign made cotton cloths. In that year, two thirds of
44
woolen cloths and blankers needed by people were provided by the
domestic industry and the remaining one third was imported from abroad.
The production of woolen and cotton textile increased from 304 million
meters and 3,184,000 meters in 1962 to 480 million meters and 8 million
meters respectively in 1969. In 1969, a total of 11 factories with a total
capital investment of 1,446 million Riyals were established. Of the total
fund, 933 million Riyals were spent on buying machinery. Some 826 job
opportunities were provided by the plants. During the year under study,
62 large cotton textile mills and 15 woolen textile factories were
operating in the four corners of he country. Two important factors,
effective in the expansion and booming of textile industry in Iran in the
years under study were: (i) giving workers a share in the profits of
factories which encouraged them to work harder and improve their skills
so as to produce high quality products, and (ii) offering of training in two
forms: i.e., (a) providing training courses for workers of textile factories,
and (b) setting up vocational schools and colleges. Apart form these two
factors, the political and economic stability of the country served to
attract a large amount of investments in various domestic industries.
Other factor which have effectively contributed to the development of
industries particularly textile industry were provision of social welfare.
45

health care and insurance and formation of workers and employers
syndicates and Unions.
In the course of war years (1980-1988, Iran, Iraq war), domestic
textile industries were plagued by numerous problems such as ageing
equipment, lack of spare parts, inability to import their needed parts and
raw materials and labour problems. In this period no new investments
were made, nor were any extension plan in the textile sector
implemented.
After the Iran- Iraq war, during the First Five Year Plan (1989-
1993) and Second Five Year Plan (1994-1998) there was no structural
reform has been made in the textile industry. Therefore, the Iranian textile
industry was facing numerous problems such as:
> Lack of liquidity.
>• Lack of foreign exchange budget for import of raw materials and
spare parts.
> Existence of outdated and ageing machinery and need to renovate
production lines.
> Hike in the prices of raw materials, wages and services and finally
the increase in the cost.
46

> Lack of sale of products as a result of the reduction in people's
purchasing power.
> Receiving the differences in the rates of foreign exchanges
(official, competitive and floating rates) by the banking system.
> Obstacles impeding the export of textile (stabilization of foreign
exchange rate at 3,000 Rails against Dollar, the need to sign accord
to return foreign exchange revenues earned from exports, the short
deadline set for return of foreign exchanges earnings to the banking
system, instability of laws and regulations, failure to make use of
expert views in compiling regulations and pricing of goods
destined for foreign countries, levying various duties on goods
produced for export and so on, and
> The labor problems and so on.
In the Third Five Year Plan, measures for the reconstruction and
revival of different industries including textile industry were approved
and sanctioned. The following provisions were provided.
• Exporters of textile received Rls. 400 billion as a reward of export.
• An amount of $ 5 million with 3 percent interest rate was
sanctioned for reconstruction and revival of textile industry.
47

• The units which completed the process of reconstruction and
revivalism, were exempted from the direct taxes for four years.
These measures had improved the performance of textile industry
in the private sector and the were able to increase their productivity and
profitability.
2.13 Indian Textile Industry
The idea of establishing the cotton mill industry in India was
conceived in the early decades of the nineteenth century. The main
sources of attraction to set up the cotton mills were cheap laboar, low
freight charges, and the availability of raw material on the spot. As a
result of these facilities, in 1817 or thereabout, Messrs. Fergusson and
company, a leading firm of English traders in Calcutta, put up the first
cotton mill in India. The mill was equipped with 20,000 spindles and 100
looms, and it was run by steam power. This mill, known as the Bowreah
mill, was a complete failure due to high cost of transport before the
advent of railways. The proprietors of this mill, therefore, sold it to Henry
Gouger for $60,000, less than one-third of the original cost. Since the mill
could not compete with the English products, working was ceased in the
1840's. Although the unfortunate experience of the first enterprise created
skepticism in the mind of the enthusiastic industrialists, their hopes and
48

aspirations could never be buried in oblivion. Hence, undeterred by the
failure of the first mill, Mr. Patrick, another Englishman, projected a mill
on the banks of the River Hooghly, a few miles away from Calcutta. This
mill was loiown as the fort Gloster mill and was in existence in 1854
when concrete steps were being taken towards the formation of cotton
mills in Bombay and Broach.
Before Mr. Patrick set up the cotton mill in Calcutta, Mr. Monsieur
Desbassyus, Administrator general of the French Settlement in
Pondicherry had already made a start with the erection of a composite
mill in Pondicherry during 1826 and 1828. This mill was started as a joint
stock company with a nominal capital of five million France and was
subsidized initially by the French Government. The mill started working
in 1929 or 1930 with 22,800 spindles and 454 looms.
At a time when industrial venture was growing in Calcutta, the
industrialist in Bombay also felt the trial of starting cotton mills. The
main source of attraction was the shipping facilities and moist atmosphere
offered by Bombay. The first step was taken by Mr. Cawosji Nanabhai
Davar who floated the Bombay spinning and weaving company in 1854.
Later on in 1858 Mr. Manekji Nasarwanji Petit founded the orient mill
with about 30,000 spindles. Soon Mr. Jamashedji Tata also came in the
49

picture and by the end of December 1857, 28 mills had sprung up in
Bombay with a paid up capital of Rs.3,58 crores providing employment
to about 13,350 workers.
Meanwhile, Ahmedabad which was in olden days a center of
artistic cloth produced by handloom weavers had also begun to take
interest in this industry. On May 30, 1861, the first cotton mill in
Ahmadabad was founded by Rao Bahadur Ranchodlal Chhotalal. It was,
indeed, a modest venture in the form of a factory with 2,500 spindles
employing just 63 workers. Rao Bahadur Ranchodlal Chhotalal later in
1859 founded the Ahmadabad spinning and weaving company with an
initial capital of Rs. One lakh. In 1871 came the second mill of Rao
Bahadur Bechards Ahmadabad.
These early efforts were followed by many Hindus, parses and
Mohammedans, besides the Englishmen. By 1875, there were 15 mills in
Bengal around the Calcutta industrial area and 28 mills in Bombay area.
Since then progress in the mill industry was rapid.
At the close of the 19* century, the total number of mills in the
country was 156 with 36,000 looms and over 4 million spindles. This rose
to 257 with 90,000 looms and over 6 million spindles when the first
world war broke out.
50

The industry consolidated its position during the two world war
and continued making steady progress till the partition of the country in
1947. During the war periods, production increased tremendously,
imports were restricted and the industry was called upon to meet the
needs of the armed forces.
In the pre-war period (1909-1913), there were at an average 265
mills with 6,333,390 spindles and 85,620 looms employing 234,924
hands. In 1914, the number of mills increased to 271 while the number of
spindles and looms increased to 6,778,895 and 104,179 respectively. The
average number of workers employed also increased to 260,276. The
First and Second World War witnessed a tremendous rise in the installed
capacity and the number of hands employed in the industry. By 1944, the
number of spindles rose to 10,222,107 and the number of looms to 21,761
while the average number of workers employed to 505,562 in 407 cotton
textile mills. The war periods also witnessed a sharp rise in the volume of
production.
The average production (1909-10 and 1913-14) of grey and
bleached piece goods stood at 854.1 million yards and that of coloured
piece-goods at 251.4 million yards. Thus the total production turned out
was of the order of 1,105.6 million yards. In 1942-43, the production of
51

grey and bleached piece-goods shot up to 3,020 million yards and of
coloured piece-goods to 1,088.8 million yards, thus making a total of
4,109.3 million yards. In 1943-44, the total figures rose to 4,870.7 million
yards of cloth.
Therefore, the Indian textile industry is one of the oldest industries
in the country and displays a very complex sectoral dispersal matrix with
hand-spun and hand-woven sector on one end of the spectrum and the
capital intensive sophisticated mill sector at the other, with the
decentralized power loom and knitting sectors coming in between. The
fibre specific configuration of the textile industry includes almost all
types of textile fibres from natural fibres like cotton, jute, silk and wool to
synthetic/man-made fibres like polyester, viscose, nylon, acrylic,
polypropylene and the multiple blends of such fibres and filament yams.
The diverse structure of the industry coupled with its close linkage with
Indian ancient culture and tradition provides it with the unique capacity to
produce, with the help of latest technological inputs and design
capability, a wide variety of products suitable to the varying consumer
tastes and preferences, both within the country and overseas. It is perhaps
the only industry in the Indian industrial arena, which is self-reliant and
complete in value chain, i.e., from raw material to the highest value added
52

products, i.e. garments/made-ups. The Indian textile industry has a
significant presence in the Indian economy as well as in the international
textile economy. Its contribution to the Indian economy is manifested in
terms of its contribution to the industrial production, employment
generation and foreign exchange earnings.
As per data released by Information Textile Manufactures'
Federation (ITMF) for the year 1999. The Indian textile industry also
contributes significantly to the world textile capacity and availability of
textile fibres/yarns. This industry contributes about 21 percent to the
world spindleage and 6 percent to the world rotorange. With China's
dismantling of 10 mn spindles India has emerged as a country with
highest spindlage in the world. With almost 5.64 mn Looms (including
3.89 mn handlooms) this industry has also the highest loomage (including
handlooms) in the world and contributes about 57 percent to the world
loomage. Even excluding handlooms, this industry contributes 33 percent
to the world loomage. This industry also contributes significantly to the
world production of textile fibres and yarns including jute. In the world
textile scenario, it is the largest producer of jute, second largest producer
of silk, thired largest producer of cotton and cellulosic fibre/yarn and fifth
53

largest producer of synthetic fibre/yarn. It is also the third largest
producer of cotton yarn.
The textile policy of 1985 and economic policy of 1991 focusing in
the direction of liberalization of economy and trade had in fact
accelerated the growth in 190s. The growth during this period was
spearheaded by the spinning and man-made fibre industry in the
organized sector and decentralized weaving sector. In the last about ten
years from 1990-91 to 2000-01, The annual production of cotton from
117.00 lakh bales has now reached 140.00 lakh bales, silk production
increased from 12.56 mn. kg. to 15.85 mn. kg, wool production increased
from 42.70 mn. kg. to 47.00 mn. kg, man-made fibre production
increased from 337.85 mn. kg. to 904.28 mm. kg.
Simultaneously, with the growth in the production of textile fibres,
the textile industry also achieved a remarkable growth. The number of
spinning mills has risen from 777 in 1990-91 to 2561 in 2001, with
increase in spindleage from 26.67 mn. to 37.91 mn. and rotorage to 4.54
lakh during the corresponding period. As a consequence, the production
of spun yarn has increased at the rate of about 5.65 percentage to 3160
mn. kg. in 2001 of which cotton yarn is about 72 percent.
54

The number of looms has increased from 13.13 lakh in 1991 to
18.02 lakh in 2001. During the period loomage in the organized sector
declined from 1.78 lakh to 1.40 lakh. Aditionaly handloom has grown to
a loomage of 38.91 lakh taking the total lomage to 56.93 lakh. Production
of fabrics has grown from 23330 mn sq. mtrs to 40256 mn sq mtrs during
the period, with increase in the production of man-made fibres and
fabrics, the fabric mix has also been changed. Cotton, earlier was about
66 percent of the fabric production, has fallen to 49 percent, the balance
coming from blended and synthetic fabric. Fabric production profile,
earlier showing II percent as coming from the organized mills has
changed with the growth of power looms to show 4 percent from the
mills, 59 percent from power looms, 17 percent from kintting and 19
percent from handlooms.
Despite growth of the industry and also textile in India according to
the Reserve Bank of India in 1985 all sick industrial units were 597 and
the sick textile units were 162, in 2000, all sick industrial units were 2742
and the sick textile units were 514.
It is clear from the above analysis that the textile industry has been
playing an important role both in Indian and Iranian economy. But what
is of concern, is the increasing number of sick mills in both countries. In
the next Chapter, we will give an analyse of sickness of the textile
industry and its causes. •- • ;'* X . ' ... > »
55
Af - jj-'

2.14 References
1. Hossein Alaqeband, 1997, A Review of the Status of Production,
Packing, Distribution and Export of Iranian Cotton, November 8.
2. Andrew, Delores, 1986, Italian Renaissance Textile Designs, Stemmer
House.
3. Beridbury, A.R., 1982, Medieval English Cloth Making: An
Economic Survey, Gower Publications.
4. Caraway, Garen, 1983, Peruvian Textile Designs, Stemmer House.
5. Garlano, Marianne, 1985, French Textiles, from the Middle Ages
through the Second Empire Wadsworth Publication.
6. Rowe, Ann P., 1982, A Century of Change in Guatemalan Textiles,
University of Washington Press.
7. Newton, Stella M, 1986, The Dress of the Venetians, Gower
Publication.
8. Pettit, Florence, 1970, America's Printed and Painted Fabrics, 1600-
1900 Hastings House,.
9. Boon, Gerard K, 1981, Technology Transfer in Fibres, Textile and
Apparel, Klumer.
56

10.Gross, Laurence F., 1993, The Course of Industrial Decline: The Boott
Cotton Mills of Lowell. Massachusetts, 1835-1955, Johns Hopkins
University Press.
11.The Iranian Textile Magazine, 2002, Published collaboration with
association of Iran Textile Magazine Serial No.240, No. 124.
12.The Iranian Textile Magazine, 2003, Published collaboration with
association of Iran Textile Magazine Serial no. 237, No. 121.
13.The Iranian Textile Magazine, 2002, Published collaboration with
association of Iran Textile Magazine, Serial No. 237, No. 121.
14.Mehta, S.D.,1954, The Cotton Mills of India, Textile Association
Bombay, pp.5-6.
15.Mehta, S.D.,1954, The Cotton Mills of India, Textile Association
Bombay, pp.6-7.
16.The Financial Express, dated August 24, 1963, p.6.
57
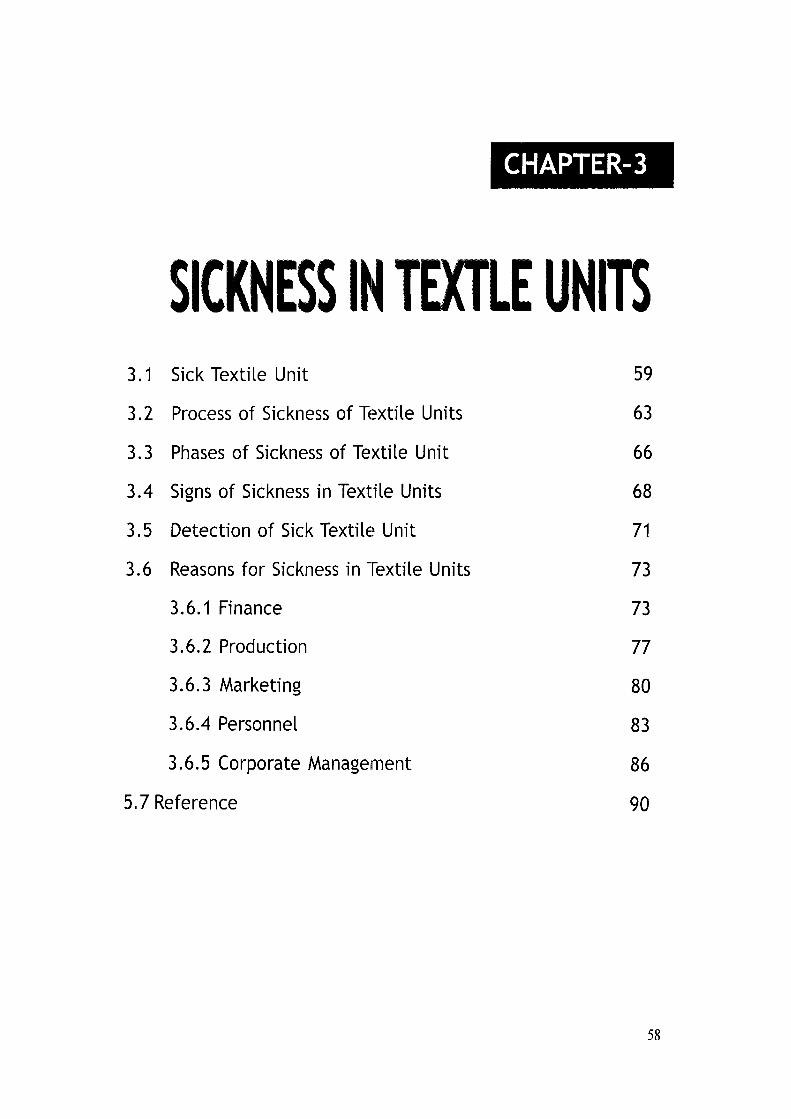
CHAPTER-3
SICKNESS IN TEXTLE UNITS 3.1 Sick Textile Unit 59
3.2 Process of Sickness of Textile Units 63
3.3 Phases of Sickness of Textile Unit 66
3.4 Signs of Sickness in Textile Units 68
3.5 Detection of Sick Textile Unit 71
3.6 Reasons for Sickness in Textile Units 73
3.6.1 Finance 73
3.6.2 Production 77
3.6.3 Marketing 80
3.6.4 Personnel 83
3.6.5 Corporate Management 86
5.7 Reference 90
58

In the previous chapter we have discussed the definition, process
and history of textile, this chapter deals with the definition, process,
phases, signs, detection and reasons of sickness of textile units.
3.1 Sick Textile Unit
In order to have a better understanding of sick textile unit, it is
necessary to have an insight into the anatomy of human body. Here we
shall draw an analogy from medical science. Before a pathologist learns
about the nature, reasons and treatment of a disease he has to study the
anatomy of the human body. Thereafter he studies as to how certain
bacteria or virus affects these systems or sub-systems thereby retarding
their functioning. Then he learns the different signs and symptoms of
diseases for proper recognition. It is only after identifying the disease that
he is able to prescribe proper treatment.
Bindani and Mitra (1982) said that "A person is treated as 'sick' if
any part of his body does not function normally. Similarly, if any
functional area of an industrial unit (viz. finance, production, marketing,
personal and corporate management) develops any abnormality, the
whole unit may become sick."'
The meaning of 'sick unit' is easy to understand but difficult to
define. It has different meanings to different people. The workers in a unit
59

may take the functioning as sick if tliey are not getting their wages and
increments in time. The management and investors may measure this in
term of inadequate return on their investment and dividend declared by
the company. The financial institution/banks give importance to the
repayment of their loans and units ability to pay interest regularly.
S.H. Ashraf (1990) in his Ph.D. thesis stated that, "There are a
number of definition of the sick unit based on different norms viz.
generafion of surplus, erosion of equality, liquidity. To an investor the
sick unit is one which skip dividends. To an industrialist it means
recurring losses and tottering on the brink of closure." So, the meanmg
of sick unit is based on different norms such as generation of surplus,
liquidity and solvency posifion, erosion of equity, the amount and the
period of irregularities etc. The study group report of SBI in 1975 defined
"sick unit as one which fails to generate internal surplus on continuing
basis and depends upon its survival on frequent infusion of external
funds." Thus, the study groups found that the industrial unit is sick when
its internal capabilities are exhausted and it began to seek external
financial help for its survival.
The study group set up by the Reserve Bank of India (RBI) to
frame guidelines for follow-up of bank credit defined the sick units as,
60

"with a steady eroson of profitability, the borrower's liquidity declines
and the first sign of difficulty is delayed payment to creditors, leading
ultimately to default. With further deterioration in profitability, followed
by losses, current liabilities exceed current assets, in other word, a net
working capital surplus become a net working capital deficit." The team
rightly paid emphasis on liquidity of a firm. If the firm declines to meet
the obligations of creditors when current liabilities exceed current assets.
The sick industrial companies Act 1985 defined it as an industrial
company (being a company registered for not less than seven years)
which has at the end of any financial year accumulated losses equal to or
exceeding its entire net worth and has also suffered cash losses in that
financial year immediately preceding it.
The definition of sick units adopted by the term-lending financial
institutions is based on the criteria of continuous cash losses, defaults in
debt servicing requirements and irregularities in meeting statutory and
other liabilities. Thus, an industrial unit is classified as sick by type.
Term-lending institutions declare a unit sick after taking into account any
of the following symptoms: (i) continuous defaults in meeting four
consecutive half yearly installments of interest or principal in respect of
the institutional loans, (ii) continuous cash losses for a period of 2 years
61

or continued erosion in the net wortli by 50 percent or more, and (iii)
mounting arrears on account of statutory or other liabilities for a period of
one or two years.
Reserve Bank of India (]RBI; 1988) announced (i) a unit may be
considered sick, if it has incurred cash losses for one year and, in the
judgement of the Bank, it is likely to continue to incur cash losses for the
current year as well as the following year, (ii) the unit has an imbalance
in its financial structure such as current ratio is less than 1:1 and
worsening debt-equity ratio i.e. the ratio of total outside liabilities to net
worth, and (iii) when the cumulative losses exceed capital and reserves.
Thus, the emphasis is the RBI's definition of sickness is on
profitability, liquidity and solvency.
Sick textile unit may be defined as one which fails to generate
internal surplus on continuing basis, which has not been able to finance
even margin money for borrowing capital and where part of the capital
has been lost because of the losses already made. Sudarshan Lai (1979)
stated that "A unit can be considered sick if it is operating at less that
break-even point, that is, where it is unable to meet its cost and
depreciations, the unit, which has eroded its capital and reserves, should
be considered to have reached an advanced stage of sickness."^
62

All the above definitions are based on equity, profits and financial
viability. Definition of a sick unit emerges from the definition of a
healthy unit. In other words a healthier unit is one which is earning
profits, its current ratio is more than one, the net worth is positive and
debt ratio is sound. Hence all units not satisfying the criteria of a healthy
unit can be stated to be sick. It may however, be stated that all units
which are not healthy may not be sick so long as they do not wipe out
their equity, because in this case they can live a debilitated existence, that
is they may not grow. Thus these units even though they are not sick, can
be at the stage of incipient sickness. However, in case where a unit does
not generate any surplus or is working below breakeven point it is going
to be sick. Thereafter if the unit incurs cash losses and would erode its
capital and reserves it will be a sick unit.
3.2 Process of Sickness of Textile Units
Sickness of textile units does not occur all of a sudden in the life
history of a textile unit. In fact, it is a gradual process with distinct phases
taking from 5 to 7 years to corrode the health of a unit. A textile unit just
like a human body. Bindani and Mitra (1982) said that, "The human body
is a healthy biological organism which, before it becomes sick, generally
passes through various phases. If the sickness continues for a long period.
63

it may become chronic. In case no treatment is given at the initial stage it
may go beyond control and result in the death of the organism. Likewise,
a textile unit also passes through various stage before it become sick."'*
Sickness does not develop at once except due to accidents, natural
catastrophies or other external factors causing heavy irrecoverable loss to
the unit. In most of the cases, sickness is bred within the unit itself A
healthy unit may grow sick temporarily and recover or vice-versa.
Factors that cause sickness in a textile unit could be internal or
external. The external factors generally affect all units in the same group
while the internal factors affect a particular unit only. NCAER (1988)
stated that "sickness is defined in terms of financial viability consisting of
three independent elements of equal emphasis and weight, viz.,
profitability, liquidity and solvency represented by cash profit or loss; net
working capital, and net worth respecfively. When all these parameters
show positive figures, the unit's financial viability will be sound and
normal. When one of them shows a negative figure, the unit could be
regarded as tending towards sickness, when two of them show negafive
figures, it would be a case of incipient sickness; when all of them show
negafive figures, the unit may be termed as sick."^ On the basis of above
64

mentioned, the organ process, which generally passes through various
stages of sickness in a Textile units illustrated in the following Table.
Organic Process of Sickness of Textile Units
Healthy Unit
Cash
profit/loss='+'
Net working
capital = '+'
Net worth = ' + '
Stage-I Tending towards sickness
4 _ )
Stage -II Incipient sickness
Two or more is
i _ )
Stage-Ill sick unit
All is ' - '
Total sickness or closure
It is evident that in healthy phase, the key parameters like cash
profit, net working capital and net worth are positive values. As it tends
toward sickness, the parameter cash profit may become negative but the
textile unit will still continue to pay its installments to the termlending
institutions, when it moves towards higher intensive zones, two or more
financial parameters may become negative. At this juncture, the financial
analyst or the financing agency should review the overall situation and
take appropriate corrective measures to prevent texfile unit from
becoming sick. If the above trend is not arrested, this lead to total failure
or closure of the textile unit. An understanding of the process of sickness
can help in its timely detection and corrective action. Any delay treatment
65

at early phase can lead to the textile unit becoming gravely sick. In such a
phase, the treatment may be for more costly and time consuming. So it
can be said that, if the problem is detected at an early phase, corrective
measure can be taken easily and effectively. This would help in tackling
the grave results.
3.3 Phases of Sickness of Textile Unit
A textile unit may become sick at any time from the date of
establishment. There are various reasons for sickness at different phase.
A textile unit may be sick before sanction and disbursement of loan
and establishment as textile unit. In this manner, that is a project. This
may be due to faulty product selection, wrong location, dependence on
foreign collaboration, false investment decision and conflict among the
entrepreneurs etc. Here, if the situation is beyond control, it is justifiable
to close the textile's project, because of low risk and cost involvement, or
a textile unit may become sick in the project implementation phase. This
may be due to installation of defective machinery, failure to bring
promoter's contribution or the share of financial institutions, complexity
in obtaining capital etc. Some appropriate preventive measures are
required to save the unit from going to the next phase of sickness, or a
textile unit may be sick after the commencement of commercial
66

production but before starting of marketing operations. This may be due
to accident in factory, major defect in plant and machinery, defect in
production planning, inadequate working capital, liquidity crunch etc. At
this phase management should pay more attention and take corrective
action or, a textile unit may become sick just after starting of marketing
operation. This may be due to easy availability of similar goods in the
market, inefficiency in marketing strategy, shortage of raw materials,
power failure etc. At this phase management should remain aware of the
overall situation and take suitable corrective measures to prevent the
textile unit from becoming real sick, and also, a textile unit may become
sick in fully operation phase. This is the final phase of sickness. After the
commencement of commercial operations and marketing, if corrective
measures are not taken the situation adversely affect the functional areas
of the textile unit and ultimately it finally become sick. This may be due
to easy availability of similar goods at a cheaper price, sudden change in
the government policy, natural disaster, increase in the cost of raw
material, power, labour etc., shortage of working capital, unfavourable
labour laws and adverse industrial relafions, mis management, frequent
break down of plant and machinery, change in demand of customers etc.
67

An understanding of the various phase of sickness with various financial
characteristics can help in its timely detection and corrective action.
3.4 Signs of Sickness in Textile Units
Sickness of textile unit is a time phenomenon, all of a sudden a
textile unit does not become sick unless there is a major accident, or
catastrophe, causing heavy irrecoverable loss to the textile units.
Normally sickness does not set in overnight or develop all at once. It is a
gradual phase which corrodes the textile units in several phases. It shows
some signs of sickness and if they are not removed, they get settled. The
v/arning signs in several functional areas are termed as symptoms.
Normally, in the initial phase, the management of a textile unit does not
pay heed to the early warning signs of sickness but they become aware
and serious only when the sickness is in the advanced phase. In fact, the
timely identification of various signs makes the detection of sickness
easier. Therefore, the various signs need to be identified and monitored at
an early phase of sicloiess. The signs which are persistent/neglected over
a long period of time, become symptoms of sickness. The symptoms are
the initial red signs which if identified in the incipient phase, could avert
the unit from sickness and divert them towards improvement.
68

The symptoms of a textile unit's sicloiess are first noticed by the
management. Subsequently, they are observed by others like employees,
creditors, customers and the government. It is also a point to remember
that no one symptom by itself would be an indicator of weakness and it is
only when several of these factors appear simultaneously, there should be
a cause for equiry.
Some sick textile units are bom sick, some live in sickness and
some die in sickness. To find out the nature of weakness by observing its
symptoms whether sickness exists or not in a textile unit, there are a
number of signs/symptoms which may be as follows.
1. Continuous shortage of cash;
2. Deteriorating financial ratios;
3. Delay in the audit of annual accounts;
4. Failure to pay statutory dues to employees, creditors, financial
insfitution and banks;
5. Shortage and non-availability of raw materials, water, gas,
electricity, technical personnel and labour;
6. Decline in capacity utilization and stoppage of production;
7. Continuous fall in sales and market share
8. Frequent breakdown of plant and machinery;
69

9. Increase in inventories which may include large number of slow or
non-moving items;
10.Decrease in working capital;
11.Higher rate of rejection of goods manufactured and increase in
customer complaints;
12.Continuous cash losses.
When the signs are noticed and symptoms are exhibited, it is
necessary to analyses the trends of these signs and symptoms for
determining the level of sickness in the light of their nature.
For early detection of signs and symptoms of textile unit sickness,
it is important to know its sources. Generally, the information on early
warning signs can be obtained from two sources, viz., internal and
external. The most relevant source of symtomes of sickness is internal i.e.
operating results of the textile unit. Internal sources include ledger data,
stock statement, factory visits, discussion with borrowers and analysis of
financial statements. External sources of early warning signs include
market reports, press reports, other firms dealing in the same units and the
transacting banks. In order to take signs or textile unit sickness and then
take appropriate preventive action, it is essential to use certain techniques
with some important information. Sources of such information are stock
70

statement, ledger data, quarterly operating statement, market reports,
financial statements, fund flow and cash flow statements.
3.5 Detection of Sick Textile Unit
Before a policy is evolved and successfully implemented to deal
with the problem of textile unit's sickness, it is absolutely necessary to
have a correct detection of the problem. If factors that are responsible for
causing textile unit's sickness are correctly distinguished, it will be
possible to prevent the sickness in the initial phase itself. Actually, the
detection is invariably the first step in the phase of treatment, but before
undertaking a study on detection, it is essential to know the different
causes of textile unit's sickness. The causes of sickness are numerous.
One single reason for sickness, if not effectively controlled, may create
some new problems resulting in chronic sickness or clousure of the textile
unit.
A sick textile unit causes much hardship in terms of production
disruption, loss of employment and income. "Prevention is better than
cure", so in order to prevent the incidence of sickness, it should be
properly detected at an early phase through its financial and non-financial
symptoms. It is possible to distinguish textile unit's sickness by used of
two criteria. They are: (i) cash losses of the previous year, the current
71

year and anticipated for the next year and (ii) the deteriorating debt-
equity ratio. In order to diagnose the phase of sickness of textile unit, the
cash profit, networking capital and net worth are the important indicators,
financial symptoms which distinguished a healthy textile unit from a sick
textile unit. Non-financial symptoms are also distinctly marketed in a sick
textile unit. Low morale of management and employees, deterioration in
the quality of product or raw materials supplies, resistance to pay increase
and other benefits indicate the depressing climate of a failed textile unit.
If the nature of sickness of textile unit by observing its symptoms reveals
that the factors of sickness are uncontrollable and the textile unit is
incurable i.e. beyond revival, it is mostly justifiable to close it down
without spending any more amount of money on it, on the other hand,
nursing program may be taken for textile units which are potentially
viable. So it is necessary to undertake proper diagnose of the root causes
of sickness of a textile unit through examination and review of the
operations almost from its very inception. The main results of textile
unit's sickness on an economy have been locking up the country's limited
financial resources, loss of textile's production, wastage of capital, assets,
reducing employment potential. According to Khanka (1995) "loss of
production in sick units bear two adverse effect on the economy as a
72

whole. Firstly, it results in a decline in production and secondly, it also
blocks up valuable savings and capital equipments which otherwise
invested would have yield substantial returns on the economy."^
3.6 Reasons of Sickness in Textile Units
In order to analyse the reasons of textile sickness, it is essential to
clearly understand the functional areas of a textile unit, analysis of its and
their critical elements before analyzing textile unit's sickness.
A textile unit is divided into four parts which represent the four
functional areas viz. finance, Production, Marketing and Personnel. There
is also a central part which indicates corporate management, responsible
for coordinafing these four functions.
3.6.1 Finance
When we look at this functional area in terms of a system, we fined
that there are other critical elements with in this system viz. financial
structure, financial planning and budgeting, assets utilization, working
capital management, costing, pricing, accounting systems procedures etc.
and their proper functioning is essential for the overall performance of the
fi.nancial system. Financial structure involve decisions about the ratio in
which debt and equity should be structured to maximize share holders
wealth. Financial planning and budgefing look at future financial
73

requirements establishment of departmental budgets and a continuous
comparison of the actual with budgeted results is another critical element
for improving productivity. Efficient and effective utilization of
investment in current assets is ensured through working capital
management. Costing and pricing decision are important in minimizing
costs and ensuring anticipated profits. Without an effective accounting
system and control procedures it may be difficult to find out the financial
health of a texfile unit on a day to day basis.
If these critical elements are malfunctioning the reason of textile
unit's sickness will obviously be as under:
a) Depletion of resources. A texfile unit which continues to incur
losses in its operations will find its capital, deposits and reserves
eroded. Its current liabilifies generally would tend to become
higher than its current assets comprising inventories trade debtors
etc. Its creditors would sense the financial difficulty and would
pressurize the firm to pay back the dues which the latter might be
unable to do. The banks may also not meet his credit requirements
as the textile unit is already in a financially bad shape.
b) Poor ufilizafion of assets. A texfile unit should be able to achieve
maximum turn over with a particular amount of fixed and current
74

assets held by it. It means that a textile unit is utilizing the assets in
the best possible manner. Therefore, poor utilization of assets of a
textile unit is a reason of sickness. This can be judged by
comparing the capacity utilization with the installed capacity and
by comparing assets turnover ratios.
c) Inefficient working capital management. A textile unit has to
manage its working capital portfolio effectively for its smooth
running. An inefficient working capital management will be
apparent if:
The textile unit is unable to meet its day to day requirement and,
the textile unit finds its difficult to raise additional funds when they may
be needed immediately.
d) Absence of costing and pricing. Cost control is an important area
which needs attention in any textile unit. If the costs are kept at a
minimum level, a competitive price can be offered for the
commodity and profit planning can also be made. If the costs are
rising, the margin of profit will come down or the textile unit may
even start incurring losses.
e) Absence of financial planning and budgeting. A textile unit which
does not undertake the exercise of financial planning and budgeting
75

may find it difficult to meet it financial obligations when they
arise. This may adversely affect the textile unit's reputation and
business.
f) Improper utilization or diversion of funds. Financially disciplined
company uses the long term funds for long term needs, short term
funds for short terms or working capital needs and ploughs back
the profits earned into the business. If a textile unit is diverting
funds from short temi to long term uses and vice versa, it may get
sick.
g) Credit restraints. There are occasions when the credit institutions
follow a policy of credit restraint in accordance with the national
objectives. This may happen at a time when the textile unit may be
in urgent need of funds. Alternatively, there may be delay in
getting fiands on account of rigidity of the commercial bank in
providing additional credit, Inadequate finance, at a time when it is
needed most, may reason sickness.
h) Delay in disbursement of loans. Imposing unrealistic conditions
while sanctioning loans by bankers which promoters are not able to
comply with, may result in delay in disbursement of loan. This in
turn, may adversely affect the liquidity and may result in sickness.
76

i) Unfavourable investment climate. When the investment climate in
the country is favorable a textile unit can raise funds by floating
shares and debentures in the market or by way of public deposits.
However, if the investment climate is unfavourable, public may not
like to invest in the textile companies,
j) Fear of nationalization. Fear regarding nationalization of industry
has also been responsible in many cases for entrepreneurs
siphoning funds from the textile units and for avoiding efforts to
modernize renovate plant and machinery.
3.6.2 Production
Within this system too we have various sub-systems, such as site
selection, plant and machinery product design, production planning and
control, purchase and inventory control, quality control, research and
development etc. The selection of the site of a textile unit depends upon a
number of factors including infra-structure, raw material, etc. choice of
appropriate plant and machinery as regards its size, capacity and cost is
another important element. Production planning and control regulates the
production process in such a manner that the actual behaviour
corresponds to the plans. The sub-system of maintenance helps in
optimism utilization of machinery. Quality of production must be ensured
V\' r' > \
^( A., )J

through quaHty control. Finally research and development efforts enable a
textile unit to innovate and bring improvement in its products and keep
pace with technological changes. The critical elements in the production
function, give ideas about the reasons of textile unit's sickness.
a) Site selection. The wrong selection of site for a textile unit can
become a great contributing factor in its failure. If site selection
does not take into account various factors like availability of
infrastructure facilities like power, transport system and other
factor like nearness to market or source of supply of raw material,
etc. the textile unit may experience unwanted difficulties sooner or
later.
b) Plant and Machinery. Textile unit's sickness may also result if the
size of the plant and machinery is uneconomical, obsolete and
inefficient. Sometime a textile unit installs very high capacity in
the initial stages but is not able to maintain this capacity for a long
time. This imbalance in the asset structure later becomes a reason
of sickness.
With the advancement of science and continued research and
development, technologies or processes of manufacture adopted in the
past are continuously being replaced by new techniques and methods of
78

manufacture. This bring change in the minimum scale of operations
which continue to remain economic, change in quality of products and
invariably bring down the cost of production. A textile unit which is
unresponsive to such change finds itself in an uncomfortable position as
productivity in the enterprise would be low and costs high as compared to
those following a newer technology.
c) Inadequate materials control. Material control is a generic term for
techniques concerned with controlling the price, usage, quality,
supply or other aspects of materials performance. This is a critical
element of the production function and if materials control is
inadequate, it may become a reason of textile unit's sickness.
d) Inadequate maintenance. Inadequate maintenance of plant and
machinery brings down the efficiency of the plant as the number of
breakdowns go up resulting in lesser output. Simultaneously the
quality of production also gets affected. It is, therefore, one of the
reason of textile unit's sickness.
e) Lack of quality control. Quality control is an effective system for
integrating the quality development, maintenance and improvement
efforts of the various groups in an organization so as to enable
production and service at the most economic levels for full
79

customer satisfaction. Generally the system of quality is based on
statistical methods. The items manufactured are continuously
checked by inspection to ensure that the qualitative and
quantitative aspects are within the limits of the standards or
specification. Absence of quality control may therefore, reason of
textile unit's sickness.
f) Lack of emphasis on research and development. In the modem
competitive environments, all progressive units go in for research
and development on a continuous basis. This enables development
of new designs, cost reductions, improvement in performance and
innovations in the products. Lack of emphasis on research and
development in a textile unit in the present day may ultimately lead
to sickness.
g) Shortage of inputs and restriction on imports. If any textile unit is
unable to get essential inputs like raw materials, power, fliel etc. it
may become sick. The supply of these inputs is beyond the control
of management.
3.6.3 Marketing
Any textile unit must know in advance, the demand and supply
position of the products to be manufactured by it so that it can plan its
80

production and finance accordingly. Demand forecasting is necessary in
this respect. Choice of an appropriate product mixable a textile unit to
maximize its earning with the available production capacity. A study of
market segments enables a textile unit to know its consumers better and
to bring appropriate modifications in its product to suit their
requirements.
Marketing is an important functional area. The aberrations in this
function which can reason of textile unit's sickness, are listed below:
a) Selection of inappropriate product-mix. If a textile unit is not aware
as to what is the contribution (sales income less variable cost) of
each product, it shall not be able to adopt suitable produce-mix for
profit maximization. An inappropriate product mix, therefore,
initiates sickness.
b) Absence of product planning. In some of the industries
development and marketing of new products on a planned basis is
essential to maximize profitability on a long term basis. This is
essential as the old product may become obsolete or inappropriate
in the long run. This technique is called as product planning and
absence of this may reason sickness of the textile unit.

c) Dependence on a few buyers. For any textile unit, dependence on a
few select buyers is always fraught with risk. If these particular
buyers stop buying goods for some reasons, the textile unit will run
risk of become sick. Similarly, if a textile unit is supplying a
majority of its products to government departments, the delayed
realization of sales proceeds may be reason for sickness.
d) Lack of market research. Market research is necessary to discover
customer habits, desires, needs and also the acceptability of
product or service on the basis of such a research, a textile unit is
able to frame a strong and imaginative marketing policy. Absence
of market research, therefore, may lead the textile unit to sickness.
e) Defective pricing. Pricing of a product determines the gross margin
available to the enterprise to meet its various overhead costs. The
direct and indirect cost of different enterprises may vary, and
therefore, break even point of one textile unit may be different
from that of the other textile unit. If a manufacturer offers more
favorable terms either to push the sales of his products or to enter
closed market, he would be placed at a further disadvantage. This
may be reason for sickness.
82

f) Inappropriate sales promotion. The sales promotion of a particular
product depends upon its nature, usage, market segment, nature of
the consumer and his habits, etc. A textile unit has, therefore, to
formulate appropriate sales promotion policy keeping in view all
the above factors as inappropriate sales promotion may be reason
for sickness.
g) Change in international marketing scene . International markets are
governed by a host of factors like variety, design, quality, price
competitiveness, packaging, quickness in compliance of orders,
exchange rate variations etc. A textile unit which can not keep pace
with the changes in the international market, is likely to face
problems.
3.6.4 Personnel
The critical elements of this sub-systems are selection, recruitment
and training, manpower planning, wage and salary administration, labour
relations etc. choosing the right people, placing them accordingly to the
job requirements training them to be of better use in the present job or
grooming them to take up higher responsibilities is experimentally
important. Manpower planning enables an organization to estimate future
manpower requirements, its deployment needs and development. A
83

judicious policy regarding wage and salary is another critical element.
Last but not the least good labour relations are important to improve
productivity, upkeep maintenance and reduce wastes. The reasons of
textile unit's sickness due to malfunctioning of this system are as follows:
a) Poor wage and salary administration. If a textile unit is paying
wages and salaries much less than what is relevant in the industry
in general, it may loss experienced employees and adversely affects
productivity. Alternatively, if the textile unit is paying high wages,
it will increase the cost of production. Inappropriate wage and
salary administration therefore, promotes sickness.
b) Unhealthy labour relations: Bad labour relations may result in
lower productivity, poor quality of product, inadequate
maintenance of plant and machinery, increase in wastage and
sometimes in strikes and lockouts, etc. thereby causing sickness.
c) Absence of manpower planning. For any textile unit it is necessary
to estimate further manpower requirements and deployment or
development needs. Manpower planning is concerned with
forecasting the needs of the organization for specified personnel of
different types and at different levels. Absence of this may lead to a
chaotic situation and reason sickness.
84

d) Overstaffing. Many a time in siclc textile unit it would be observed
that there are more men than the jobs available for them. This
could happen because right persons with appropriate skill and
training had not been recruited. This deficiency is sought to be
made up by recruitment of more persons similarly ill equipped.
Overstaffing does not only lead to wastage in wages paid to such
excess staff but also impedes work of others hereby lowering the
production and causing sickness.
e) Absenteeism and labour turnover. Absenteeism and labour turnover
is a common feature. In many textile units, labour hails from far off
places and on religious and festive occasions go back to their home
town. Absenteeism would render the machine idle. In those textile
units where absenteeism and labour turnover is high, it would be
difficult to ensure uninten'upted working of the unit. It may cause
sickness.
f) Non-availability of skilled manpower. A textile unit located in a
certain area may get abundant supply of unskilled labour, but it
may be difficult to get skilled manpower. The engineers, middle
level and senior execufives are sometimes not available as they
may not like to work in a remote and backward places.
85

g) Wage disparity in similar unit. An efficiently managed unit can
offer better salary and wages to its employees. A skilled worker
who has experience in a particular field, will shift to an employer
who will offer better remuneration. If there is a considerable wage
disparity the unit will not be able to retain experienced workers. A
high rate of loss of experienced employees may land the textile unit
into difficulty,
h) General labour unrest and inter-union rivalry. In some areas labour
situation may be volatile and the unrest may led to low
productivity, deterioration in quality, increases of wastes, rise in
overhead costs resulting in decline in profitability of the textile
units. Textile units in these areas are prone to sickness. Multiplicity
of unions within textile units and inter-union rivalry are responsible
for landing textile units into difficulty.
3.6.5 Corporate Management
The various critical elements of corporate management are
organisation, planning, leading, measuring, controlling and development
etc.
Organisation involve assignment of various tasks to different
people and departments for getfing work done as per schedule. Planning
86

involves setting up of the goals and sub-goals for each functional areas
and also establishing policies and standard methods. Controlling is an
integrated efforts for measuring the progress and taking corrective action,
where ever necessary. Organization development involve bringing a
planned change in the organization to enable it to face the challenges of
tomorrow. Corporate management with all its critical elements as
discussed above, works as the brain of a textile unit.
After having dissected and discussed the various systems and sub
systems of a textile unit we have a fair idea about its ftinctioning. A
normal or healthy textile unit is one where all the systems and sub
systems are working efficiently. These systems and sub-systems should
also be able to cope up with the changes in the external environment. As
long as a textile unit is able to do so it continues to have normal health.
But if any functional area of a textile unit develops any abnormality the
whole unit may become sick. The reasons of textile unit's sickness in the
corporate management area are as under.
a) Improper corporate planning and weak organizational set up. Large
textile companies which restore to corporate planning which helps
in integration of all planning activities of unit or achieving the over
all objectives. In the absence of this, a textile unit is not able to
87

harmonise and integrate the policies, procedures and plans and may
cause sickness.
b) Lack of co-ordination and control. Lack of co-ordination in the
various functional areas and absence of control in performance of
these functional areas cause sickness.
c) Resistance to change. In the present dynamic world there is a
continuous change in consumer habits and product decision. A
particular product much in demand today may become obsolete
tomorrow. A good management shall take note of such changes
and has to prepare itself to cope up with all these changes.
A management with weak response to change or with resistance to
change may lead the textile unit to sickness.
d) Strife and lack of integrity in top management. For smooth
function of a textile unit, the top management has to work as a
cohesive group. There have been reason of failure of textile units
where there was a dispute among the top management.
In many instances the integrity of top management is doubtful.
There is a willful mismanagement and dishonesty which is the
main reason for bad performance ending in sickness.
88

e) Poor managerial talent. Successful managers possess certain traits
such as supervisory ability, intelligence initiative, self-assurance,
decisiveness, maturity and achievement motivation. Persons not
having these qualities may not be able to solve the problems and
would fail to give a sense of direction.
The above discussion has highlighted the concept of sickness, its
causes, process and development in an industrial unit. In the next
Chapter, we will discuss the modus operandi for conducting financial
investigation of a sick industrial unit. Such study is essential to form a
basis for taking a decision regarding rehabilitation of sick textile units.
89

5.6 References
' Bidani; SN and Mitra PK (1982): Industrial Sickness-Identification and
Rehabi Litation, Vision Boosk Pvt. Ltd., New Delhi, p.2.
^ Ashraf, S.H. 1990, "A Study of the Managerial Problems of sick
Textile Mills with Special Reference to Utter Pradesh,"
unpublished Ph.D. Thesis, Department of Commerce, A.M.U.,
Aligarh, p.81.
Lai, Sudershan (1979): How to prevent industrial sickness, Navrang,
New Delhi, p.91.
" Bidani; SN and Mitra PK (1982): Industrial Sickness-Identification and
Rehabi Litation, Vision Boosk Pvt. Ltd., New Delhi.
^ National Council of Applied Economic Research (NCARE) (1986):
Report on the Activities of National Society for Prevention of
Industrial Sickness, New Delhi.
^ Khanka, SS (1995): Industrial Sickness in India (causes; consequences
and cures) common wealth publish. New Delhi, p.55.
90

CHAPTER-4
COSTANDPR0FITAIIILITY,ACONCEI>T 4.1 Concept of profit 93
4.2 Concept of Profitability 94
4.3 Significance of Profitability 95
4.4 Profitability and Financial Viability 95
4.5 Profitability Performance Measures 95
4.6 General Profitability 96
4.6.1 Gross Profit Ratio 96
4.6.2 Operating Ratio 97
4.6.3 Operatong Profit F atio 99
4.6.4 Expenses Ratio 99
4.6.5 Net profit Ratio 101
4.7 Over Profitability 102
4.7.1 Retun on Shareholders Investment of Net Worth 102
4.7.2 Retun on Equity Capital 103
4.7.3 Earning Per Share (E.PS.) 104
4.8 Concept of Cost 105
91

4.9 Costing 106
4.10 Material 106
4.10.1 Direct Material 106
4.10.2 Indirect Material 107
4.11 Labor 107
4.11.1 Direct Labor 107
4.11.2 Indirect Labor 107
4.12 Overhead 108
4.12.1 Production Overhead 108
4.12.2 Office and Administration Overhead 108
4.12.3 Selling and Distribution Overhead 108
4.12.4 Research and Development Overhead 109
4.13 Cost Analysis 109
4.14 Cost Volume Profit Analysis 110
4.14.1 Break-Even Point Analysis 111
4.14.2 Profit/Volume Ratio 112
4.14.3 Margin of Safety Ratio 113
4.15 Liquidity Ratio 115
4.15.1 Current Ratio 116
4.15.2 Quick Ratio 116
4.16 References 118
92

In the previous chapter we have discussed the concept and meaning of
sickness, process of sickness of textile units, phases of sickness, signs of
textile unit's sickness and diagnosis of sick textile unit. In this chapter we
will discuss the meaning and concept of profit, profitability, assessment of
profitability and analysis of profitability through the financial statement
analysis, ratio analysis, and also deals with the meaning and concept of cost,
costing, cost analysis for applying to analyse the cost and profitability of
Tabarstan Textile Corporation and Swedish Cotton Mills through their
financial statements.
4.1 Concept of Profit
In a general term, profit is the excess of revenue, proceeds, or selling
price over related costs. The primary objective of a business undertaking is to
earn profits. Profit earning is considered essenfial for the survival of the
business. Profit is the engine that drives the business enterprise. A business
needs profit not only for its existence but also for expansion and
diversification. The investors want an adequate return on their investments,
workers want higher wages, creditors want higher security for their interest
and loan and so on. A business enterprise can discharge its obligafion to the
various segments of the society only through earning of profits. Profits are,
thus, a useful measure of overall efficiency of a business. Profit to the
93

management are the test of efficiency and a measurement of control; to
owners, a measure of worth of their investment; to the creditors, the margin
of safety; to employees, a source of fringe benefits; to government, a measure
of tax-paying capacity and the basis of legislative action; to customers, a hint
to demand for better quality and price cuts; to an enterprise, less cumbersome
source of finance for growth and existence.
4.2 Concept of Profitability
Profitability refers to the ability of a firm to generate earnings of
revenues in excess of expenses. Continuing profitability is a primary measure
of the overall success of a company, it is a necessary condition for survival.
Analysis of profit is vital concern to various participants of the organization
from their own points of views. For example, it is important to the
stockholders as it provides revenue in the form of dividends, when paid from
profit.
Further, increased profit can cause a rise in the market price of the
share leading to capital gains. Profits are also important to creditors as profits
are one source of funds for debt coverage. Management is vitally interested in
profits as it is often used as a performance measure. Test of profitability focus
on measuring the adequacy of income by comparing it with one or more
primary activities or factors that are measured in the financial statements.
94

4.3 Significance of Profitability
Profitability represent the earning of a healthy unit, ensuring long term
viability of the unit irrespective of its sectoral affinity and subsidized status.
Viability is determined by the units' ability to cover at least its variable costs
in the short run and its total costs, plus earn normal profits in the long run.
Profitability measures the unit's ability to earn a reasonable return on
investment in the context of financial viability.
4.4 Profitability and Financial Viability
The pursuit of social objectives in production dilutes the profit motive.
Profitability, however, remains a social responsibility of the entrepreneur, as
a user of scarce resources. In the present context, profitability measures the
unit's ability to earn a reasonable return on investment in the context of
financial viability and serves as a means of ensuring financial discipline.
Further, industrial sickness has in most cases been defined in terms of
recurring cash losses and the poor financial status of the firm. Therefore, the
health of the unit would ultimately be reflected in its ability to earn a
reasonable return on investment.
4.5 Profitability Performance Measures
The profitability performance can be measured through general
profitability and overall profitability. The basis of general profitability's
95

measure is profit and loss account and deals to measure gross profit,
operating profit, expenses and net profit but the basis of overall profitability
are balance sheet and profit and loss account and deals to measure return on
shareholder's investment or net worth, return on equity capital, earning per
share, return on capital employed, capital turnover, dividend yield, dividend
pay-out and price earning.
4.6 General Profitability
4.6.1 Gross Profit Ratio
Gross profit ratio measures the relationship of gross profit to net sales
and is usually represented as a percentage. It is calculated by dividing the
gross profit by sale.
^ r. r-.r. *• Gross Profit ,^. Gross Profit Ratio = x 100
Net Sales
The gross profit ratio indicates the extent to which selling prices of goods per
unit may decline without resulting in losses on operations of a firm. It reflects
the efficiency with which a firm produces its products. As the gross profit is
found by deducting cost of good sold from the net sales, higher the gross ratio
better the result. There is no standard norm for gross profit ratio and it may
vary from business to business but the gross profit should be adequate to
cover the operating expenses and to provide for fixed charges, dividend and
accumulation of reserves. A low gross profit ratio, generally indicates high
96

cost of good sold due to unfavourable purchasing policies, lesser sales, lower
selling prices, excessive competition, over-investment in plant and
machinery, etc.
A comparison of gross profit ratio over time or for different firms in
the same industry is a good measure of profitability. But any significance
change in the ratio should be thoroughly investigated because an increase in
the gross profit ratio occurs not only by a change in economic factors like
increase in selling price without any corresponding propionate increase in
cost or decrease in cost without any decrease in selling price but also due to
certain misleading factors like overvaluation of the closing inventories or
under valuafion of the opening inventories, etc., yet the gross profit ratio is
one of the very important ratios for measuring profitability of a firm.
4.6.2 Operation Ratio
Operating ratio establishes the relationship between cost of goods sold
and other operating expenses on one hand and the sales on the other. The
ratio is calculated by dividing operating costs with the net sales and its
generally represented as a percentage.
^ , n, X- Operating Cost . „ „ Operating Ratio—^^ 2 x100
^ Net Sales
97

The two basic elements of this ratio are operating cost and net sales.
Operating cost can be found by adding operating expenses to the cost of
goods. Operating expenses consist of:
(i) Administrative and office expenses like rent, salaries to staff,
insurance, directors' fees, etc.
(ii) Selling and distribution expenses like advertisement, salaries of
salesmen, etc. Operating ratio indicates the percentage of net sales
that is consumed by operating cost it would have a small margin
(operating profit) to cover interest, income tax, dividend and
reserves.
There is no rule of thumb for this ratio as it may differ from firm to
firm depending upon the nature of its business and its capital structure.
However, 75 to 85 percent may be considered to be a good ratio in case of a
manufacturing undertaking. To get a better idea of the ratio, either a trend
should be found by calculating operating ratio for a number of years or a
comparison of the fimi should be made with another in similar business or in
the same industry.
Operating ratio is considered to be a yardstick of operating efficiency
but it should be used cautiously because it may be affected by a number of
uncontrollable factors beyond the control of the firms. Moreover, in some
98

firms, non-operating expenses form a substantial part of tiie total expenses
and in such cases operating ratio may give misleading results.
4.6.3 Operating Profit Ratio
This ratio is calculated by dividing operating profit by sales. Operating
profit is calculated as:
Operating Profit = Net Sales- Operating Cos;
Or
Operating Profit = Net sales - (Cost of goods sold + Administrative and Office Expenses + Selling and Distributive Expenses)
Operating profit can also be calculated as:
Operating Profit = Net Profit + Non-Operating Expenses - Non-Operating Income
So, Operating Profit Ratio = - ? E 5 * a f ^ x , o o Sales
This ratio can also be calculated as:
Operating Profit Ratio = 100- Operating Ratio
4.6.4 Expenses Ratio
Expenses ratio indicate the relationship of various expenses to net sale.
The operating ratio reveals the average total variation in expenses. But some
of the expenses may be increasing while some may be falling. Hence,
expense ratios are calculated by dividing each item of expenses or groups of
expenses with the net sales to analyse the causes of variation of the operating
ratio. The ratio can be calculated for each individual item of expenses or a
99
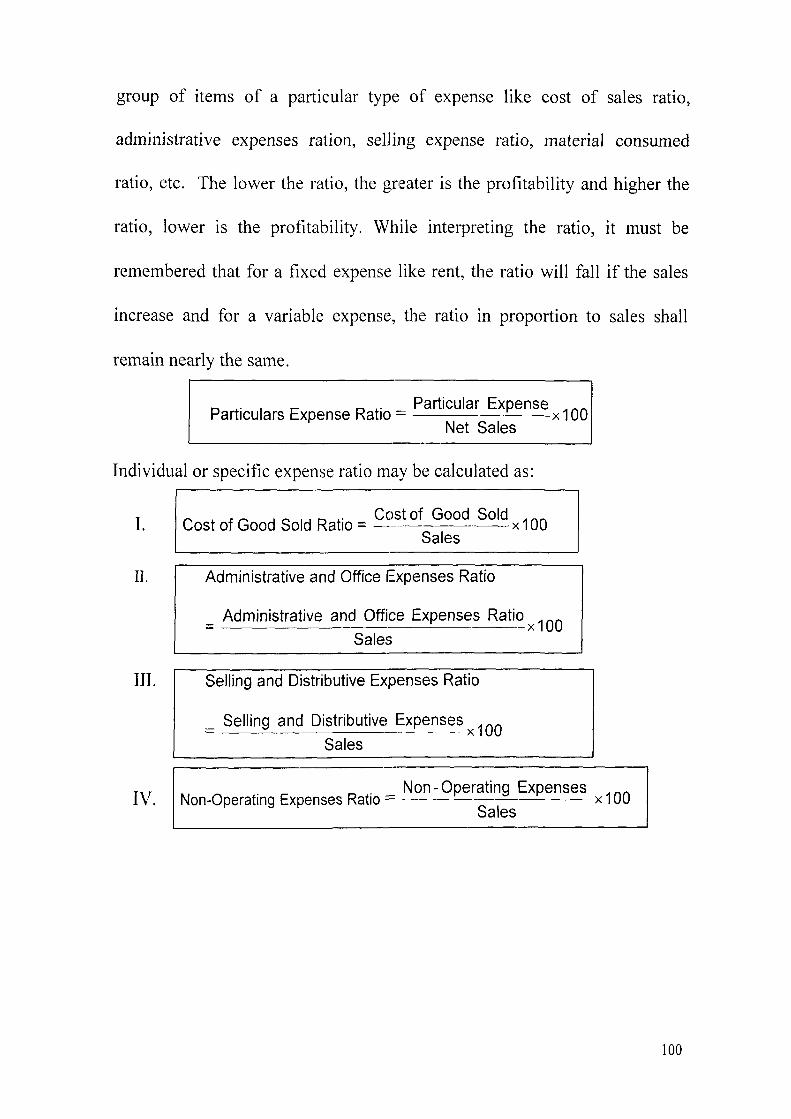
group of items of a particular type of expense like cost of sales ratio,
administrative expenses ration, selling expense ratio, material consumed
ratio, etc. The lower the ratio, the greater is the profitability and higher the
ratio, lower is the profitability. While interpreting the ratio, it must be
remembered that for a fixed expense like rent, the ratio will fall if the sales
increase and for a variable expense, the ratio in proportion to sales shall
remain nearly the same.
n, - , r- r - PailiGular Expense ^„„ Particulars Expense Ratio = xlOO
Net Sales
Individual or specific expense ratio may be calculated as:
II.
o , tr- ^ o i j n f Cost of Good Sold ,_^ Cost of Good Sold Ratio = x 100
Sales Administrative and Office Expenses Ratio
Administrative and Office Expenses Ratio Sales
III. Selling and Distributive Expenses Ratio
^ Selling and Distributive Expenses Sales
100
IV. Non-Operating Expenses Ratio -_ Non-Operating Expenses
Sales ;100
100

4.6.5 Net Profit Ratio
Net profit ratio establishes a relationship between net profit (after
taxes) and sales, and indicates the efficiency of the management in
manufacturing, selling, administrative and other activities of the firm. This
ratio is the overall measure of firms profitability and is calculated as:
(i)
(ii)
K, .n. rxr^ .• Net Pfofit AftepTsx , „ „ Net Profit Ratio = x100
Net Sales
M * • f,n *• Net Operating Profit . . . Net Profit Ratio = ^ x100
Net Sales
The two basis elements of the ratio are net profits and sales. The net
profits are obtained after deducfing income-tax and, generally, non-operating
income and expenses are excluded fi-om the net profits for calculating this
ratio. Thus, incomes such as interest on investment outside the business,
profit on sale of fixed assets, etc., are excluded. The ratio is very useful as if
the profit is not sufficient, the firm shall not be able to achieve a satisfactory
return on its investment. This ratio also indicates the firms' capacity to face
adverse economic conditions such as price competition, low demand, etc.
Obviously, higher the ratio, the better is the profitability. But while
interpreting the ratio, it should be kept in mind that the performance of profits
must also be seen in relation to investment or capital of the firm and not only
in relation to sales.
101

4.7 Overall Profitability Ratios
4.7.1 Return on Shareholder Investment or Net Worth
Return on shareholders' investment, popularly known as ROI or return
on share holder/proprietors' funds is the relationship between net profits
(after investment and tax) and the proprietors' ftinds. Thus, the ratio is
generally calculated as a percentage. This ratio is calculated as:
_ , c-u u ,^ ,, X X Net Profit (after Interest and Tax) , „ „ Return on Shareholders Investment = ^ ^x100
Shareholders Funds
The two basic components of this ratio are net profits and
shareholders' funds. Shareholders' funds include equity share capital,
preference share capital, free reserves such as share premium, revenue
reserve, capital reserve, retained earnings and surplus, less accumulated
losses, if any. Net profits are visualized from the viewpoint of owners i.e.,
shareholders. Thus, net profits are arrived at after debiting interest on long-
term borrowing and income-tax, because those will be the only profits
available for shareholders. To sum up
Shareholders' Investment Equity Share Capital + Preference Share Capital + Reserve and
Surplus - (Accumulated Losses, if any).
This ratio is one of the most important ratios used for measuring the
overall efficiency of a firm. As the primary objective of business is to
maximize its earnings, this ratio indicates the extent to which this primary
102

objective of business is being achieved. This ratio is of great importance to
the present and prospective shareholders as well as the management of the
company.
As this ratio reveals how the resources of a firm are being used, higher
the ratio, better are the results. The return on shareholders' investment should
be compared with the return of other similar firms in the same industry. The
inter-firm comparison of this ratio determines whether the investments in the
firms are attractive or not as the investors would like to invest only where the
return is higher. Similarly, trend ratios can also be calculated for a number of
years to get an idea of the prosperity, growth of deterioration in the
company's profitability and efficiency.
4.7.2 Return on Equity Capital
In real since, ordinarily shareholders are the real owners of the
company. They assume the highest risk in the company. Preference
shareholders have a preference over ordinary shareholder in the payment of
dividend as well as capital. Preference shareholders get a fixed ratio of
dividend irrespective of the quantum of profits of the company. The rate of
dividend varies with the availability of profits in case of ordinary shares only.
Thus, ordinary shareholders are more interested in the profitability of a
company and the performance of a company should be judged on the basis of
103

return on equity capital of tiie company. Return on equity capital, which is
the relationship between profits of a company and its equity capital, can be
calculated as:
^ . , _ . , , Net Profit After Tax-Preference Dividend ..,„ Return on Equity Capital = x100
tquity Share Capital
A small variation of the above ratio is to calculate return on
shareholders' total equity which is equal to the paid-up equity share capital
plus reserves and surplus plus share premium minus accumulated losses, if
any. This ratio is more meaningful to the equity shareholders who are
interested to know profits earned by the company and those profits which can
be made available to pay dividend to them. Interpretation of the ratio is
similar to the interpretation of return on shareholders' investments and higher
the ratio, better it is.
4.7.3 Earning Per Share (E.P.S.)
Earning per share is a small variation of return as equity capital and is
calculated by dividing the net profit after taxes and preference divided by the
total number of equity shares. Thus,
j ^ _ Net Profit After Tax-Preference Dividend
No. of Equity Shares
The earning per share is a good measure of profitability and when
compared with Earning Per Share of similar other companies, it gives a view
104

of the comparative earnings or earnings power of a firm. E.P.S. calculated for
a number of years indicates whether or not earning power of the company has
increased.
Now we deals the meaning and concept of cost, element of the cost,
costing, and cost analysis for applying these to analyse the cost and
profitability of Tabarestan Textile Corporation and Swedish Cotton Mills.
4.8 Concept of Cost
The term 'cost' has a varying meaning depending upon the context in
which it is used. Lai Nigam and Jain (2000) stated that "cost are the resources
sacrificed or foregone to achieve a specific objective."' Cost is defined as the
benefits given up to acquire goods or services. It is an exchange price, a
sacrifice made to secure some benefit. The benefits (goods or services) given
up are measured in money by the reduction of assets or incurrence of
liabilities. When benefits are actually received, the cost becomes an expense.
An expense is defined as a cost that has given a benefit and has now expired.
Un-expired cost that can give future benefits are classified as assets. The term
'cost' has a wide variety of meaning. Different people use this term in
different senses for different purposes. For example, while buying a book,
you generally ask "how much does it cost? Here the word cost means price.
But in management terminology the term cost refers to expenditure and not
105

the price. For our purposes, cost is not the same as price. Thus, cost refers to
something that must be sacrificed to obtain a particular thing.
4.9 Costing
Costing is the technique and process of ascertaining cost. It consist of
the principles and rules which are used for ascertaining the cost of production
and services. The process of costing is the day-to-day routine of ascertaining
cost. Costing can be carried out by the process of arithmetic, by means of
memorandum statement or by the methods of integral accounts. The main
object of costing is to ascertain the cost of each product, process, department,
service or operation. In every manufactured product or operation, there are
three elements. There are materials, labors and overheads. These primary
elements provide management with information necessary for income
measuring and product pricing.
4.10 Materials
Materials indicate principal substances used in production. Material
cost is the cost of commodities supplied to an undertaking. The cost of
material is further divided into direct and indirect materials.
4.10.1 Direct Materials: These include all material directly used in
production and easily traceable to a finished product. In other words, it is the
106

material which can be measured and charged directly to the cost of the
product.
4.10.2 Indirect Materials: These are materials which are used ancillary to
manufacture and cannot be traced into the finished product. I.M. Pande
(1992) said that "indirect materials are those materials that are used in the
manufacturing operations, but do not become part of a finished product.
These materials do not enter into the finished goods and cannot be idendfied
with them."^
4.11 Labor
Labor is the physical or mental effort expended on the production of
item. It is the active factor of production as against material which is a
passive factor. The cost of labor is further divided into direct and indirect
labor.
4.11.1 Direct Labor: Direct labor cost consist of wages paid to workers
directly engaged in manufacturing or handling a product or engaged in a
particular job or process. It can be associated directly with the product.
4.11.2 Indirect Labor: This includes wages paid for all labor, which is not
directly engaged in changing the shape or composition of raw material. It
cannot be traced directly to the product.
107

4.12 Overhead
Overhead are the aggregate of indirect materials, indirect labor and
indirect expenses. Thus, all indirect cost are overheads. These cannot be
associated directly with specific products. Hence, the amount of overheads
has to be allocated and apportioned to products and services on some
reasonable basis. M.N. Arora (1997) stated that "overhead is the aggregate of
indirect material cost, indirect labor and indirect expenses."^ Overhead are
usually divided into following groups:
4.12.1 Production Overhead: The production overhead comprises all
indirect manufacturing cost which cannot be identified with specific units of
the finished products. All manufacturing costs, except direct materials and
direct labor, are included in production overhead.
4.12.2 Office and Administration Overhead: This is the indirect
expenditure incurred in general administrative function i.e., the
administration overhead is incurred for carrying the administrative function
of the organization i.e., cost of policy formulation and its implementation to
attain the objectives of the organization.
4.12.3 Selling and Distribution Overhead: Selling overhead is the cost of
promoting sales and retaining customers. Distribution overhead includes all
108

expenditure incurred from the time the product is completed until it reaches
its destination. It refers to all expenses incurred in executing orders.
4.12.4 Research and Development Overhead: Research overhead is the
cost of searching for new products, new manufacturing processes of
equipment. The development overhead is the cost of putting research result
on commercial basis.
4.13 Cost Analysis
Cost analysis refer to the break up of total cost into certain elements or
sub-divisions, such analysis is essential for the purpose of management and
control over costs. The total cost of production can be found without such
analysis, but in many instances an average unit cost could be obtained but
none of the advantages of an analysed cost would be available. The cost
analysis play a dominant role in setting the framework of managerial
decision. But the information provided in the profit and loss statement and
cost of Goods solds statement (Reports) is not an end in itself as no
meaningful conclusions can be drawn from these statement alone. However
the information provided in these statement is of immense use in making
decision through analysis and interpretation. Cost analysis is the process of
identifying the cost and profitability of the firm by properly establishing
relationship between the items of the profit and loss statement and cost of
109

goods sold statement. There are various methods or techniques used in
analyzing cost, such as break-even point analysis, cost-volume-profit analysis
margin of safety and profit volume ratio.
4.14 Cost Volume Profits Analysis
Cost volume profit analysis is a technique for studying the relationship
between cost, volume and profit. Profit of an undertaking depend upon a
large number of factors. But the most important of these factors are the cost
of manufacture, volume of sales and the selling prices of the products. The
Cost Volume Profit relationship is an important tool used for the profit
planning of a business.
The three factors of Cost Volume Profit analysis i.e., cost, volume and
profit are interconnected and dependent on one another. For example, profit
depends upon sales, selling price to a large extent depends upon cost and cost
depend upon volume of production as it is only the variable cost that varies
directly with production, whereas fixed cost remains fixed regardless of the
volume produced. In cost-volume-profit analysis an attempt is made to
analyse the relationship between variations in cost with variation in volume.
The cost-volume-profit relationship is of immense ufility to
management as it assists in profit planning, cost control and decision making.
In decision making, management pays a great deal of attention to the profit

opportunities of alternative courses of action. The price of a product depends
upon so may external and internal factors such as market demand,
competitive conditions of the market, management's marketing policies etc.
Cost of the product is influenced by numerous factor such as volume, product
mix, price of inputs, size of lot or order, size of plant, efficiency in production
and marketing, accounting methods etc. The alternatives that involve changes
in the level of business activity profit does not usually vary in direct
proportion to these changes in volume. This is as a result of the cost
behaviour patterns. Better evaluation can be made of profit opportunities by
studying the relationships among cost, volume and profit. Profit is clearly a
function of sales volume, selling prices and costs. The non-uniform response
of certain cost to changes in the volume of business can have a serious impact
upon profit. The study of cost volume profit analysis referred to as break
even analysis, profit/volume ratio and margin of safety.
4.14.1Break-Even Point Analysis
One point of interest in the cost-volume-profit analysis is break-even
point. It is incidental to the broader scope of Cost Volume Profit study. It is
defined as the output level which evenly breaks-even the cost and revenues.
Break even analysis refers to ascertainment of level of operations where total
revenue equals to total cost. It is an analysis used to determine the probable

profit or loss at any level of operations. Break-even analysis in a method of
studying the relationship among sales revenue, variable cost and fixed cost to
determine the level of operation at which all the costs are equal to its sales
revenue and it is the no profit no loss situation. This is an important technique
used in profit planning and managerial decision making. The break-even
point can be computed in term of:
a) Units of sales volume
b) Money value.
n I r- o • * • 11 •* Fixed Cost Break-Even Point in Unit = Selling Price Per Unit-Variable Per Unit
D 1 IT r, • .• k/. x/ I Fixed CostxSales Break-Even Point in Money Value = Sales-Variable Cost
Break-even point can be stated in the form of an equation.
Sales Revenue at Break-Even Point = Fixed Cost + Variable Cost.
4.14.2 Profit/volume Ratio
The profit/volume ratio, reveal the rate of contribution per product as a
percentage of turnover. Profit/volume ratio, which establishes the relationship
between contribution and sales is of vital importance for studying the
profitability of operations of a business. It reveals the effect on profit of
changes in the volume. Higher the p/v ratio, more will be the profit and lower
12

the p/v ratio lesser will be the profit. Thus, every management aims at
increasing the p/v ratio. In the other hand, better profit volume ratio is an
index of sound financial health of company's product. Profit volume ratio can
be improved, if contribution is improved. This can be done by:
(i) Increasing the selling price per unit.
(ii) Reducing the variable or marginal cost.
(iii) Changing the sales mixture and selling more profitable products for
which the profit volume ratio is higher.
The concept of profit volume ratio is also useful to calculate the break
even point, the profit at a given volume of sales, the sales volume required to
earn a given (or desired) profit and the volume of sales required to maintain
the present profits if the selling price is reduced by a specified percentage.
The profit volume ratio can be calculated as follows:
n f^x/ 1 o r Sales-Variable Cost . „ „ Profit Volume Ration = xlOO
Sales Or
„ , , , , , , o ,. Contribution ,^. Profit Volume Ration = xlOO
Sales
4.14.3Margin of Safety Ratio
The margin of safety refers to sales in excess of break-even volume. It
represents the difference between sales at a given activity level and sales at
break-even point. It is important that there should be a reasonable margin of
safety to run the operations of the company in profitable position. A low
13

margin of safety usually indicates high fixed overheads so that profits are not
made until there is a high level of activity to absorb the fixed costs. A margin
of safety provides strength and stability to a concern. The margin of safety is
an important measure, especially in times of recording sales, to know the real
position to operate without incurring losses and to take steps to increase the
margin of safety to improve the profitability.
Margin of safety is calculated by using the following formulae:
Margin of Safety = Actual Sales - Break-Even Sales
Margin of safety can also be expressed in percentage. Margin of safety
calculated in percentage is also known as margin of safety ratio and can be
expressed as:
, , r o * . D+- Actual sales-Sales at B.E.P . . . Margin of Safety Ratio = xlOO
Sales The size of the margin of safety is an important indicator of the
strength of a business. The large margin of safety indicates that the business
is sound and even if there is a substantial fall in sales, there will still be some
profit. On the other hand, small margin of safety indicates that position of the
business is comparatively weak and even a small decline in the sales would
adversely affect the profit of the business and may result into losses. The
margin of safety can be improved by taking the following steps:
1. By increasing the level of production
114

2. By increasing ttie selling price
3. By reducing the fixed cost
4. By reducing the variable cost
5. By substituting unprofitable product with profitable products
6. By increasing contribution by changing the sales mix or by dropping
unprofitable products.
4.15 Liquidity Ratios
It is extremely essential for a firm to be able to meet its obligation as
they become due. Liquidity ratio, measure the ability of the firm to meet its
current obligations. In fact, liquidity ratio by establishing a relationship
between cash and other current assets to current obligations, provide a quick
measure of liquidity. A firm should ensure that it does not suffer from lack of
liquidity, and also that it is not too much highly liquid. The failure of a
company to meet its obligations, due to lack of sufficient liquidity, will result
in bad credit image, loss of creditor's confidence, or even in law suits
resulting in the closure of the company. A very high degree of liquidity is
also bad, idle assets earn nothing. The firm's funds will be unnecessarily fied
up in current assets. Therefore, it is necessary to strike a proper balance
between liquidity and lack of liquidity. The most common ratio which
15

indicate the extent of liquidity or lack of are: (i) current ratio and (ii) quick
ratio.
4.15.1 Current Ratio
The current ratio is calculated by dividing current assets by current
liabilities:
^ ^ o .• Current Assets Current Ratio Current Liabilities
current assets include cash and those assets which can be converted into cash
within a year, such as marketable securities, debtors, inventories and prepaid
expenses.
All obligations maturing within a year are included in current
liabilities. Thus, current liabilities include creditors, bills payable, accrued
expenses, short-term bank loan, income-tax liability and long-term debt
maturing in the current year. The current ratio is a measure of the firm's
short-term solvency. A ratio of greater than one means that the firm has more
current assets than current claims against them. As a conventional rule, a
current ratio of 2 to 1 or more is considered satisfactory.
4.15.2 Quick Ratio
This ratio establishes a relationship between quick, or liquid assets and
current liabilities. An asset is liquid if it can be converted into cash
immediately or reasonably soon without a loss of value. Cash is the most
116

liquid assets. Other assets which are considered to be relatively liquid and
included in quick assets are debtors and bills receivables and marketable
securities. The quick ratio is found out by dividing the total of the quick
assets by total current liabilities.
_ . , _ , . Current-Inventories Quick Ratio =
Current liabilities
Generally a quick ratio of 1 to 1 is considered to represent a satisfactory
current financial condition.
Thus, the above are the tools which we will use in the next chapter for
assessing the cost and profitability of the Tabarestan Textile Corporation,
Qaemshahr and the Swadeshi Cotton Mill, Kanpur to identify the causes of
sickness in the two mills.
.17

4.16 References
' Lai Nigam B.M. and Jain, I.C, 2000, Cost Accounting, Published by Asoke
K. Ghosh, New Delhi.
Pande J.M., 1992, Financial Management, Vikas Publishing House Pvt.
Ltd., New Delhi.
^ Arora, M.N. 1997, Cost Accounting, Vikas Publishing House, Pvt. Ltd.,
New Delhi.
Vishwanthan, S.S., 1974, Essentials of Financial Management, Prentice-
Hall of India Ltd.
^ Pandey, LM., 1986, Financial Management, Vikas Publishing House, Pvt.
Ltd., New Delhi.
^ Lewis, R.B., 1959, Financial Analysis for Management, Engle-wood Clif,
Prentice-Hall.
• Kulkami, P.K., 1985, Financial Management Himalaya Publishing House,
Bombay.
^ Kishore, Parvin M., 2004, Management, Accounting and Financial
Analysis, Taxaman Allied Service (P) Ltd., New Delhi.

CHAPTER-5
ANALYSIS OF COST, PROFITIBALITYAND FINANCIAL
POSITION OF TEXTILE MILLS
5.1 Tabarestan Textile Corporation, (Qaemshahr) 121
5.2 Analysis of Financial Position of the Tabarestan
Textile Corporation, (Qaemshahr) 125
5.3 Analysis of Cost and Profitability of the Tabarestan
Textile Corporation, (Qaemshahr) 140
5.4 Swadeshi Cotton Mills, (Kanpur) 153
5.5 Analysis of Financial Position of the Swadeshi
Cotton Mills, (Kanpur) 155
5.6 Analysis of Cost of Profitability of the Swadeshi
Cotton Mills,(Kanpur) 166
5.7 References 180
119

Since, the fourth and fifth objectives of this study pertain to the
investigation of financial position of Tabarestan Textile Corporation
(Iran) and Swadeshi Cotton Mills (India) respectively, we have studied
the Balance Sheets and Income Statements to analyse Cost, Profitability,
Cost Volume Profit and Liquidity during the five years from 1997 to
2001. However, we have given the objectives and the brief history of
Qaemshahr and Tabarestan Textile Corporation and then proceeded to
investigate the financial position, of course keeping in view the
objectives. Similarly we have given a brief history of Kanpur's Swadeshi
Cotton Mills and have proceeded to investigate the financial posifion with
an analysis of the same above mentioned items.
According to material used we have done the type of external
analysis, based upon secondary data as we did not have access the
detailed internal accounting records of these concerns. Thus, our analysis
depends almost entirely on the published financial statements. On the
basis of the method of operation followed in the analysis, we have done
horizontal analysis and vertical analysis both. On the horizontal analysis
we compared financial data by studying the balance sheet and Income
Statements of each of the two concerns separately for five years,
comparing these with the base year (1997) data.
120

We employed comparative statement tools in horizontal analysis.
On the vertical analysis, we studied the relationship of various items in
the financial statements of five years' accounting period. Common-size
financial statements and financial rafios are the two tools that we
employed in vertical analysis. For financial analysis purpose we prepared
balance sheet and Income Statements in comparative form, to show the
figure in percentage terms, because the currency used is different in
Tabarestan Texfile Corporation and Swadeshi Cotton Mills.
5.1 Tabarestan Textile Corporation, (Qaemshahr)
Now, first we take to describe the brief history of Qaemshahr and
Tabarestan Textile Corporation. Then we will deal with the calculafions
regarding to Balance Sheets and Profit and loss accounts.
Qaemshahr is one of the most important cities of Mazandaran
Province in Iran. The area of this city is 13102 square k.m.. Its climate is
humid. The northern alfitude is 36°.27 (sec.) and eastern attitude is 52.33°
(sec). Rabino (1997) said that "Qaemshahr previously was known as
Aliabad."' Qaemshahr due to its fertility of the land and its moderate
climate, has been declared as industrial area. In addition to industries,
Qaemshahr has also become a center of Handicrafts, Bed sheets. Carpet
Weaving, Coarse Weaving, Roof Covering, Agricultural, Instruments,
12]

Scythe, and Axe. Qaemshahr is well known for food and textile
industries. The history of industries in Qaemshahr goes back to the days
of First World War to meet the exigencies of the army concentrated there.
Pesyan and Motazed (1999) stated that "The first canning factory was
executed by major Mahmod Afshar Toos, and the technology was
imported from Europe."
The largest textile finn was established in Qaemshahr in 1931, and
it started functioning in 1932. This was a private firm, owned by Reza
Shah. This mill is still regarded as the first grade firm of Qaemshahr.
Paysan and Motazed (1999) stated that Reza Shah in order to
industrialize the country. "... invest into the industries. The spinning and
weaving industry of Qaemshahr came into existence due to his efforts."^
According to Manchester Gardian Newspaper (1934) "Qaemshahr
is an ideal place for cotton crop and that is why the largest textile mills is
situated there. The textile industry of Qaemshahr has the largest number
of workers employed there, working in two shifts. The factory pays its
workers at the rate of 25 shilling per head per month which is the highest
wage in the country. The thread is spinned in surplus, and the surplus is
sold in the market. Clothes for military uniform are produced in this
factory."
122

The second textile mill known as "Mazandaran Textile
Corporation" was established in Qaemshahr in 1963. This mill was a kind
of public-held Corporation. Mazandaran Textile Corporation has two
sections: Section One has spinning mill and Section Two has weaving
mill, where woolen and cotton clothes are produced. This factory is
known as second factory of Qaemshahr. This mill is equipped with 33000
spindles for cotton spinning and 1630 spindles for spinning the wools.
This mill has a capacity of producing 5,000,000 meter per annum. On 17
March 1996, a private Corporation known as Tabarestan Textile
Corporation (private corporation) under Registration No. 1022 in the
registration office of Qaemshahr, came into existence. This Corporation
on 20 March 1996, purchased the above mentioned factory along with
the property, plant and equipments. At the beginning, 2100 workers were
employed. In 1999, the Exports Council of the Corporation decided to
curtail the number of employees due to the poor performance of the
personnel concerning the quality and quantity of the products.
Unfortunately, this decision frustrated the mill management. Higher
Council of Work and Organization of Social Security helped the
dismissed workers by securing dole for them from the insurance
organization. They did so to damage the factory. All the dismissed
123

workers, nearly 2000 personnel, started receiving unemployment benefit
beginning from 05.03.1999. They continued to receive this
unemployment benefit for 18 months. After the said period, the factory
again started working with 650 workers. The remaining 1450 workers
continued to receive the unemployment benefit for another 12 months.
Department of accounting is responsible for cost and budgetary
control. A number of function are performed to achieve the stipulated
ends, particularly cost analysis and cost control.
Needless to say that for the assessments of cost relevant
information is needed. This falls in two categories:
A. Statistical information (the informations not recorded in the
accounting ledger). This information is gathered through the
production centers and daily service centers.
B. Information through Record Section, (the informations recorded in
the accounting ledger). This kind of information is sent to the Cost
accounting section from the accounting department for control of
the above information at the end of every fiscal period. Cost
accounting department after making summery of this information
through statistics, begins the assessment of the cost.
124

5.2 Analysis of Financial Position of the Tabarestan Textile
Corporation (Qaemshahr)
When we study the data given in Table No.l below and taking
1997 as the base year, we find that not only the current assets have
decreased during the five years under study, but also current liabilities
have increased continuously.
Table No. 1 Tabarestan Textile Corporation
Comparative Balance Sheet "Increase or Decrease in Term of Percentage"
For the years ending 31.03.1997 to 31.03.2001 Particulars
Current Assets
Fixed Assets
Total Assets
Current Liabilities
Long-term Liabilities
Total Liabilities
Owners' Equity
Total Liabilities & Owners' Equities
1997 Base
36,138,878,833
1,346,245,442
37,185,124,275
18,486,612,143
12,779,391,813
31,264,003,956
6,221,120,319
37,485,124,275
1998
-30%
-10%
-29%
+68%
+20%
+48%
-420%
-29%
1999
-63%
-23%
-62%
+59%
+ 13%
+89%
-820%
-62%
2000
-67%
+15%
-64%
+216%
+ 106%
+17%
-1250%
-64%
2001
-57%
+23%
-55%
+385%
+205%
+311%
-1894%
-55%
125

The rate of decreasing of current assets during 1998, 1999, 2000
and 2001 has been 30%, 63%, 67% and 57% respectively. Whenever the
current assets of a concern is decreasing and its current liabilities are also
decreasing, meaning that the concern is paying its current liabilities
through its current assets. The rate of increasing of current liabilities as
the data in Table No. 1 was 68%, 59%, 216% and 385% during in 1998,
1999, 2000 and 2001 respectively. Whenever, the current assets of a
concern is decreasing and the fixed assets of the concern is increasing, it
means that the concern has financed its fixed assets through it current
assets. The Table reveals that fixed assets have decreased by 10%o in 1998
and by 23%) in 1999; but have increased by 15% in 2000 and by 23% in
2001. Whenever the current assets of a concern are decreasing, its total
assets are also decreasing. Thus the concern is losing its assets. The Table
reveals that the total assets of Tabarestan Textile Corporation have been
decreasing continuously during the years under study. Whenever the
long-term liabilities and total liabilities of a concern are increasing and its
total assets is not increasing, it means that the concern is failing to
generate internal surplus on a confinuing basis. Further, it is depending
upon frequent infusion of external funds for its survival. Further the data
in Table No. 1 reveal that long-term liabilifies have increased during the
126

five years, from 20% in 1998 to 205% in 2001. The total liabilities also
decreased during the 1998, 1999, 2000 and 2001 over 1997 being, 48%,
89%, 17% and 311% respectively.
The important problem of the Tabarestan Textile Corporation in
the Table No. 1 is continuously decrease of the owners equities by a high
rate during the years under the study, means 420%) in 1998, 820% in
1999, 1250% in 2000 and 1894% in 2001.
The study above is based upon the absolute data derived for the
balance sheet of the Tabarestan Textile Corporation pertaining the year
1997, 1998, 1999, 2000 & 2001. These have been consolidated and given
in Table No.2.
127

"cS -tr-'
o H
'- * • •". X ) rt
J
1
o -J [yT
15 n!
J • ^ j
U
-4-»
[ / I 1/1
o H i « ' < S
< ^ T 3 «
„ . H
aJ o
*^ a. (u o
rR « U .-T:
• | H .S c
Qfc <+H cj O
% CT-
o W
c c >
6-g
11 h- J
s _o 05
o Q. u o
u o
0^
H
c:
H
' ^
H H
* dx ^ » H
O o <s r o T H
r^ o
t-~-0 ^ ON
o •
1-H fO
OX) s: • p ^
-a 0* !/3
OS
s 6X
'^
"o iZ l
X i
o j i ifi
C5
a S 5
T-H
o o
o o o <s
ON T H
X ON ON 1-H
t~-ON ON T H
IZl
.5
OH
U~t r-CTN^
( N " O N
__ oC "*
^
i n
oT 0 0
O N
r--_
^
o ( N
NO"
o ON^
( N
ri-T
i r i 0 0
''1 o"
^ <~i i r T ( N
r n m co_
o o ' r-oo__ oo" r o
NO" m
c/l
< C
u 3 D
o l O r~-r n o
^ ( N " I T )
+
o" o
' ' NO" CNI
_ -
- 1/1 NO
o ( N i r i ^ 00*"
o ( N "
1
0 0
oo"
NO"" ON
0 0
^ ^ '—'
NO i n t ^
ON" m CM
i n NO
'"
ON
ON
^ OO
rn
rn r | NO"" NO
^ ^ O ^
NO O NO_
i r T
i n
(^ o
^
_ i n "
^ (N^
NO"
' '
c/l
"S
< T3 0) X
E
_ r o 00^
• ^
i n o^ 0 0 o
-, 0 0
oo"
°\ '—' o i n +
i n
'"1 ON"
( N " NO
—'
G" r '1 oo^ ON"
(N"
^ ^ ^
m r CNT r i ^ r-o" o r-" ' '
r~-ON_
CI r
o" ^ n" ^
i n
CN" r--i n " NO
-*"
ON
NO"
i n "
' ^ NO" ( N
i n
• " CNl
i n " 00
r-" m
1/1
c/l c/l
<
"o H
o O N t-^
oo" i n
. O NO NO
r o "
+ • ^ ^
o" 0 0
oo ON i n
" ON
^
/^ o
r o " r~-r~- o " 00
^ ( N "
1
G" r o 00
ON" CNI
(N" ^ ^ '—'
ON NO O ^
r o " t~-1 — 1
•*" r in_^
O N "
0 0
ON
r-" NO NO^
0 0
oo" i n
i n
o NO" r n
ON"
^ ON" CN
rn
" i n
of ON O ^ ' — 1
r n
cn • ^
r f NO^
NO" 0 0
oo"
'"'
t/1
-
'2
C 0) fc 3 O
o O N NO
m o i n
o 0 \
cn
+
^ o cn
cn NO
cn o ON"
+
^—^ O
' "1 oo"
^ cn
•^^ NO"
1
o
CN"
i n ^
i n o NO
CN
"+
^ O N
r- ra ^ cn
K
o O N ' cn
0 0 i n
i n " oo
oo"
- NO" ( N
O
cn"
^ NO_
0 0 i n ^ ON" ( N
CNl O
o"
i n "
o '"1 i n "
^~'
cn
CO
ON ro_
ON"
r~-
^
C3
B
c o J
G"
• t ^ ( N i n
0 0 NO
CN
-
o" •n
r-" i n 0 0
CN" cn
r o "
-
, ^ ( N O
r n " r o
r ^ i n "
CN
" 1
o" O N
oo"
i n
NO"
i n
(N" +
r'-i NO 00_ m " o o
^ ON i n ^ oo"
' '
( N m
cn i n
r i O N
-*" OO
O N
r-
ON" C--NO^
o" cn
o ON" i n
i n
in_^
NO
oo" O N cn
NO" •NT
NO
ON^
cn o o "
NO
f^i
cn
.a
C3
"o H
cn 0 0
( N m o ON m NO^
cn
+
cn i n i n
cn
t—
o O N
m "
+
NO O N
^" NO
NO
oT m
o" NO
cn
f -
i n
+ ^-
cn
ry
cn i n r o" O N i n
^ -
cn NO
ON"
oo_
ON
" 1 r 1
0 0 CNl
r— o in_^
i n " NO r-"
(N cn^ oo"
i n
° ON" ' — 1
1
ON
r'-i
o" CNI
^ ^ H
NO"
> N
'3
C
O
O N NO
•Tf"
OO^ ON ON__
ON" cn N , ^
i n cn
cn NO" CNI
0 0 NO" ( N
"~'
^ ^ ^ o oo
oo" 0 0 cn cn
0 0
( N
r'-i ' ND__ oo" cn
r i "
'"' NO ( N
"^
cn r- (N" cn t~~
o" o r-" ^~'
^ ON^
cn c~~
o" ^ r o "
'
i n
CNT
r-
i n " NO
'*"
0 \
NO"
ON_
i n "
^ '*_ NO"
CNl
m
' " r j r - -
i n " 0 0
t-~-"
m
C/1
13 o H
NO r oo" i n
r ^
o NO NO
m "
+ ^
0 0
oo" ON i n ^
' " CN O N
"~
- O NO in_^ r o " t ^
c^ o" 0 0 '—
1 N _ ^
00^
oo"
ON"
O ^
" • • ^
c/1
'3 cr
W
G
o
;-<'
c/1 3 - ^
.2 U > -c
* 13 (D - "
> t i o 5=
cd ? ;
2 "o 1 ^
(/I
> >-Wl -t-i
^ - 0
S ji Xi ~
•S 6 u 0
bO • • t i n 0
•S 0 H c/

Thus, the current assets during 1998, 1999 and 2000 decreased by
Rls, 11,886,448,248, Rls 12,018,524,065 and Rls 1,426,517,300 over the
previous years respectively. But, it was during 2001 that they increased
by Rls 3,552,103,750 over 2000. recording a 33% decrease during 1998
over 1997, 48% decrease during 1999 over 1998 and 10% decrease
during 2000 over 1999. But, there was 30%) increase during 2001 over
2000.
Fixed assets during 1998 and 1999 decreased by Rls 142,729,836
and Rls 162,249,375 respectively. But, during 2000 and 2001 these
increased by Rls 501,918,718 and Rls 108,054,807 over previous years
respectively. Thus, fixed assets during 1998 and 1999 decreased by 10%)
and 13%) over previous years respectively. It was during 2000 and 2001
that they increased by 48% and 7% over previous years respectively.
Since, the current assets during 1998, 1999 and 2000 decreased and
fixed assets also decreased during 1998 and 1999, the total asset during
1998, 1999 and 2000 decreased by Rls 11,039,178,084, Rls
12,180,73,440 and Rls 924,598,810 over the previous years respectively.
Total assets increased in 2001 by Rls 3,660158,780 over 2000.
Thus, total assets during 1998, 1999 and 2000 decreased by 29%,
46%) and 6%) over the previous years respectively. However, during 2001
the total assets increased by 27% over 2000.
129
The current liabilities during 1998 increased by Rls 12,605,542,27,
i.e., by 68% over 1997, but during 1999 they decreased by Rls
1,643,118,304, i.e., by 5% over 1998. The current liabilities again
increased during 2000 and 2001 by Rls 29,034,631,304 and by Rls
31,090,505,690 recording 99% and 53%) increase over the previous years
respectively.
Long-term liabilities increased during 1998 and 1999 by Rls
2,526,518,290 and Rls 14,275,733,302 i.e., by 20% and 93% over the
previous years respectively. They decreased during 2000 by Rls
3,132,857,750 i.e., by 11% over 1999. They recorded an increase during
2001 by Rls 12,568,527,136 i.e., by 48% over 2000.
The total liabilities during 1998, 1999, 2000 & 2001 increased by
Rls 15,134,060,559 Rls 12,632,614,964, Rls 25,901,773,553 and Rls
43,659,032,831 i.e., by 48%, 27%, 44% and 51% over the previous years
respectively. It means that the concern is failing to generate internal
surplus on a continuing basis; thus, depending upon frequent infusion of
external funds for its survival.
The owner's equity during 1998, 1999, 2000 and 2001 decreased
by Rls 26,173,238,643, Rls 24,813,388,804, Rls 26,826,371,935 and Rls
39,998,874,069 i.e., by 420%, 124%, 60% and 56% over the previous
130

years respectively. It means that the concern is recording loss of its assets
on a continued basis.
The percentage increase/decrease over the previous years during
1998, 1999, 2000 & 2001 of current assets, fixed assets, total assets
current liabilities, long-term liabilities, total liabilities and owners equity
of the Tabarestan Textile Corporation as explained above, and given
below in the Table No.3.
Table 3 Tabarestan Textile Corporation
Comparative Balance Sheet "Increase or Decrease Over previous
years " A
For the years ending 31.03.1997 to 31.03.2001 Particulars
Current Assets
Fixed Assets
Total Assets
Current Liabilities
Long-Term Liabilities
Total Liabilities
Owners' Equalities
Total Liabilities and
Owners' Equalities
1997
36,138,878,833
1,346,245,442
37,185,124,275
18,486,612,143
12,779,391,813
31,264,003,956
6,221,120,319
37,485,124,275
1998
-33%
-10%
-29%
-68%
+20%
+48%
-42%
-30%
1999
-48%
-13%
-46%
-5%
+93%
+27%
-124%
-46%
2000
-10%
+48%
-6%
+99%
-11%
+44%
-60%
-6%
2001
+30%
+7%
+27%
+53%
+48%
+51%
-56%
+27%
* Calculated by the researcher Source: Data given in Table No.2
131

The common size balance sheet of Tabarestan Textile Corporation
as under (Table No.4) gives absolute figures of each individual asset and
liability, and also the percentage share of each asset and liability as the
total assets and liabilities. It also gives figures for owners equity. The data
pertain to the years 1997, 1998, 1999, 2000 & 2001.
The data reveal that during 1997, 96.37% of the total assets were
current assets, the share of cash being less than 1%. It means that the
concern has great problem in miaintaining liquidity cash. The share of
inventories in total assets has been 72% of the total during 1997. Trade
note and account receivable together accounted for 14.8%); while other
account and note receivables share was 5.5%>; order and prepaid stored at
4?/o of the total assets. The share of inventories in comparison to total
assets during 1997 has been too high, indicating an inefficient
management of inventory, over-investment inventories, dull business,
poor quality of goods, accumulation of obsolete and slow moving goods
and, of course, low profits. The share of properties, plants and
equipments has been 3.6%) only of the total assets in 1997, indicating that
Tabarestan Textile Corporation did not make new investment in the fixed
assets. The share of trade account and note payables in comparison to
total liabilities stood at 32%); other note and account payable claiming
132

27% of the total liability. Employees termination benefits in comparison
to total liabilities stand at 40.7% of the total liabilities. It means that the
Tabarestan Textile Corporation was unable to meet the rights of
employees after retirement. In the year 1997, 55.3% of total owners
equities has been the accumulated loss. The data given in Table No.4
reveal that during 1998, 95.5% out of the total assets was the share of
current assets. But the share of quick assets i.e., cash, trade notes and
account receivable, and other account and note receivable were 9%, 12%
and 3.6% respectively. It means that most of the current assets was
inventories with share of 76% in the total assets. The share of fixed assets
i.e., properties, plant and equipment and also long-term investment in the
total assets was 4.4% and 0.1% respectively. Thus, the share of fixed
asset was less that 5% of the total assets.
Out of total liabilities, 67.7% is current liabilities and 32.3% was
long-term liabilities. Since, out of total assets less than 5% is fixed assets
and out of total liabilities 32.3% was long-term liabilities. It means that
the concern financed its current assets through the long-term liabilities.
Trade notes and accounts receivable and also other accounts and notes
receivable have increased from 12% and 3.6% to 21% and 11%
respectively during 1999. But, inventories decreased from 76% during
133

1998 to 59% during 1999. It means that the concern sold around 17% of
its inventory on account. Out of total assets during 1999, the share of the
current assets of the concern was 92%, and out of total liabilities, current
liabilities stand at 49% i.e., the concern financed its current assets through
the long-term liabilities. In other words, out of total assets, current assets
was 7% and out of total liabilities, long-term liabilities was 50%) i.e., the
concern financed its current assets through its long-term liabilities.
Accumulated loss increased from Rls. 29,952 million during 1998 to Rls.
53,765 million during 1999. Thus, total owners equities during 1999 was
negative. During 2000, the share of current assets out of total assets was
87%, and the share of fixed assets was 13%. But in the same year the
share of current liabilities out of total liabilities was 69%), and the share of
long-term liabilifies was 31%. Cash stands at 0.1% of the total assets i.e.,
the liquidity position of the concern posed problems, during 2000.
Accumulated loss from Rls. 53,765 million during 1999 increased to Rls
80,597 million during 2000.
Out of the total assets during 2001 share of cash, trade notes and
accounts receivables, other account and note receivable and also
inventories stood at 0.7%, 12%, 6.6% and 70% respectively i.e., out of
the total assets 90% was current assets and 10% was fixed assets. It
134

means that the share of inventories in comparison to other assets was too
much. The accumulated loss increased from Rls. 80,591 million during
2000 to Rls. 120,590 million during 2001.
Table No. 4 reveals that, during the five years under study, the
share of current assets out of the total assets, stood at 96.37%, cash
accounted for being less than 1% of the total assets during the same
years; inventories were more than 59% of the total; while fixed assets
were less than 12%) of the total assets.
Current liabilities ranged between 50%) to 70%o during the five
years (1997-2001). Therefore, according the data, the financial position of
the Tabarestan Textile Corporation remained also the same during the
years under study. A close look of the Table No. 4 would reveal that the
amount of total assets has decreased during the years under study except
in 2001. Total assets have decreased from Rls. 37,485 million in 1997 to
Rls. 26,445 million, Rls. 14,265 million and Rls. 13,340 million
respectively in 1998, 1999 and 2000. Thus the Tabarestan Textile
Corporation has wasted its assets. Further, loss to the data given in Table
No. 4 reveal that total liabilities of Tabarestan Textile Corporation have
been increasing continuously during the five years. It has increased from
Rls. 31,264 million in 1997 to Rls. 46,398 million, Rls. 59,030 million,
135

Rls. 84,932 million and Rls. 128,591 million during 1998, 1999, 2000
and 2001 respectively. Table No. 4 reveals that accumulated loss also has
increased from Rls. 3,430 million in 1997 to Rls. 46,398 million in 1998,
Rls. 53,765 million in 1999, Rls.80,591 million in 2000 and Rls.120,590
million in 2001.
136

a\ 1—«
f^ o
DA
•S B
u a> >^
O !5
6
O
a o U
H s «
« Si
bi)
B u a>
PH
8 a
s
4i
O o f^ O
o .A
J=
4> U c .2
4i N
C^ B O
S
s o U
5 B
" • •
tSj
E 05
e
o o o
OS
a\ 0\
"
9 0 0\
o\
CA
1 So -<
u
*l V}
(U
= £ g 1
01
<U
= t 1 i» < *
u ^ «
3 2 1 So ^ ^
a> 3 Si
1 1
' • ^
(8 a.
o
o o_
O ^
t--'
' '
O
CO OS
^ 0 0 CTv^
MO"
' '
OS O
O
r-0 0 ( N
r f
t N
'—'
^ o^ 0\
O
o OS
o ON rn oo'
(N
o o
<r) 0 0 w~^
t--'
^ •* r-' ( N
J:
CO
U
'—'
m ^ VT^
oo_ r--' o o (N"
o o • * ^
m" so
OS oo_
""
( N
•—1
0 0
°\. x^
r-) Os_
IN"
^
' '
0 0 CO
r^" r s i
^
'T\
0 0
^' ~
OS i n O^
^" r^ Tf^
v-f r--"T, irT
•i^i
o
T 3 C3
H
CJ
S o CJ
< 1
S C
^
m so 0O_
oo" Os^
ri ( N ^ „
"
so
r~-os SD_
r ^ ' ( N SO
0 0
sq " •
""
so t--SO__
" o so' OS iri^
^
SO
rn
O
l O
'*" o
OS
l O
iri
OS OS
r~- so" 1—1
rn^ irT i n
o_ CNT
-o c cd
s >
a> 1)
5 o O Z
O r-~
cn so 00__ Os"
Os_
of ( N
—;, ^^
O SO
o ro OS
• * " • *
o so" O N OS_
r-"
OS l O
oo ^ oo_
oo" t--_
so • ^ ^
oo"
^ so r-
m OS
Vl"
m r- so" o Os__
oT ^
^
r-~
o-i
^ o^ t-^ o o^ r-" ^ os MD" r s i
O
1) > c
' — 1
SO
"T, v^
°°„ u-i"
' '
-* O
l O
o <y-i^
rsf
rn^ -*" w-i
sq
^
0 0
r--_ r-"
(N"
(N
r-)
O
rn^ so" 0 0
_ r-" o OS
-*
r-" t--r-_ r<T t^ so_ m" m "T, ' '
• o
'3
O H
•a e
D
-a
o
O O S
OS
r-OS__
rsf OS
Os"
^ ''1 u-i" • " ^
N O
oo
«rs <N r j
OS oo r-" t ^
•""
OS so
OS
o r4 «ri
so" O Os^
r i • ~
~-?
i/-i OS
l O 0 0 1/-)
o" rn "* (N" • *
>n" rs|
so OS
ro m °°„ oo" r -oo_ oo" m • y j " m
0 0
< c a>
u 15 o H
i n
Os
so
Os" SO
<—^ • * SO_
^
1 / ^
' '
OS
^ r- TT" 0 0
Os" m m "
r-
^ m (N^
so" so so m O ^
"
^ ^'
SO
o SD^ w^"
Os^
Os" OS
^
^ o ^ SO
r»i
( N
^ _ u^" ^ r | so ^ r<T^
• " " •
c
c/T
D, O
Q .
C
.s-3 a" m

O
o o o o" o <l m"
~"
o o o o ' o _
r'T
ro O
O O O ^
o" o vq r'T
o
o o o o~ o vq ^
1
F c
H E an ="
-J £.
o o o o" o o MD'
1
1
1
1
1
1
<
o
o o ^
_ f*^
r rT m r--_ o" o o^ r-" •
O O •^
^ r-I/-1
o ' '^ r^ m' * " •
O O
'~~
__ t o t (N"
r ^~ 'A VO ( N
'*'
O
o ""
0 ^
' ^ \o • ^
ON^
l o "
^ t^ •o" ( N
O
o ' '
'rf ( N
'—' m" oo ^ r~-" m
CO
<
o H
' '
oo CO
oo ^ VO
r i m oo__ '—'
«~1
( N
'^ Ov
_ P-^ i n
<r\ ^
O
~'
~"
r--o r-~ ^' >o 0 0
l o "
o ""•
• *
( N 00^
l / ^
ro rn
OS • *
^ o^ ( N
m
ON
•" »/ ' ^ vo' ( N OS
oT
c CO
a
a.
2 S h- Z
SD SO
csi m Tf
• ^ '
w o "
ON O ^
irT oo
^ o^
s oo o o^^ o ' o r-_ oo' r __
i ^ '
»/-^
v - j
m
uo O O ^
Os' T) 0O_
so" m °\ o" (N
^ o^
v~>
o • *
OS_
oo" -* ro^ r-" oo __ r-T
( N
r- <M
SO
o t--^
so" o r-; oo' r-• *
oo'
0)
o
• o n C3
C 3 O
o u < 3 1 - " ^
£ (£
s ?
t N
OS
•* SD^ C^ SO
^ r~' • * SO_^
CN'
^ o ^ ro
o •* so oC so Ti-_
r- ^ SO_
(N'
^'
OS
^ SO
O s ' SO
_ t^' ^ SO
t N
• x O
o^ so
ON
^ SO
oC so •* t--' ^ SO__
(N'
o
so ^ <q n' w-i t ^
_r oo
> U CO
U Q i X.
H
t o
O^ SO
ON
so O ^
r«T" t~-
" t ^ t o
oC 0 0
ON SO
O N
r ^ r-~' so so__ n' 0 0
_ oo' >r>
ON
^
<o r o^ so' m O
oC t • O N ' <N
1-^ SO
m '—f
^^ ^ >o r - H
r l ON O — • "
r^
ON
<o
(N"
so so' 0 0
_ oo' ^~
CO
<u CO CO
< -t-» c o fc U
o f-
0 0
TT P -
o\ rr ' rn "r i
r ^ ' 0 0 0 0
ON'
1
1
1
1
1
C 3 O O
< s C3
C CQ
c a. — u
4-*
o o c -I c3
t o
( N
O (N 0 0
r-' r-r- m' ( — O N '
rsl
m
oo
so_ t o ' 0 0
r-; od" ^ _ so' (N
—-m
• * •
— •rr ^' r~-oo o ' o '4-__
oo' ^
( N ro
( N O
" o ' ^ ON
v->' O r<T^
v-T ^
P~;
o • *
0 0
^ ON
m__ r-~' r~ r- ( N '
'" c
_ o
u
CO
u
C ID M CQ
C5^
ON
*"*
o ON ON_
oo' SO r-- o ' 0 0 I—1
^-' '
1
1
3 o 1)
"2 5 o
t/i o H
(U
Q
O O
' '
so oo t o ' 0 0 Tl-^
ON Vi
oo'
' '
o O ^
PNI
o^ ro' "O
_ r l 1 ^ ON
^' 0 0
O O
' '
O l
r~-^ ON' t--so o ' rn o ON' t o
o o ' '
l o • — '
« - l
•*' so o oo' ON
( so' Tp
OS
o o ' '
so <o
r^' o o ^' so (N^
n-)
15
s H
oo

oo
o o o ^ o " o o ^ o " o o CTT
O o o_ o~ o o_ o o o
o
o o o" o
o" o
o o o o" o o_ o ' o
ON
o o o_ o ' o o" o
5 'S . a
U
1
d
oo
OS
o"
> u U
u _ )
oo o
ON
o"
O
°°„ ON
o" OO
O
OO
o
i n
oo'
( N
oo'
i n m ON
m' 0 0 <^„
o '
O
— 3
e 3 o o <
1
o
NO
ID
U
6
O O
m'
o ' ON
O
o
NO
as' 0O_
ON
Q N
o o
oo
o
NO
rr'
2
o o
CM
OC
ON'
O
o
ON
o ' ( N
vo'
c/5 _(U
'5 a-
UJ t/i i~ <D
c O 75 o
ON r-1
5.3 Analysis of Cost and Profitability of the Tabarestan Textile
Corporation, (Qaemshahr)
The comparative income statement of Tabarestan Textile
Corporation as under (Table No. 5) gives data pertaining to Net Sales,
Cost Of Goods Sold, Gross Loss, Operating Expenses, Operating Loss,
Non-Operating Earning/Expenses and Net Loss. The data pertain to the
years 1997, 1998, 1999, 2000 and 2001. The data reveals that net sales
have decreased during the years under study i.e. 1997-2001. Whenever
net sales is decreasing or is increasing during the years, in a normal
situation, cost of goods sold and gross profit/loss should decrease or
increase in accordance with net sales. It means, that if the net sale is
decreasing, the cost of goods sold and gross Profit should decrease; the
net sale is increasing, cost of goods sold and gross Profit should increase.
But in the case of Tabarestan Textile Corporation the data given in Table
No. 5 indicate that the net sales in comparison to 1997 decreased during
1998, but in the same year in comparison to 1997, cost of goods sold
increased thus, increasing the gross losses at a high rate. Net sales and
cost of goods sold in comparison to 1997 decreased during 1999, but
gross Profit increased. The Tabarestan Textile Corporation was non-
operating in 2000. Decrease in net sales, cost of goods sold and gross loss
140

was recorded during the year 2001 by the same rate. The Table also
reveals that operating expenses have increased by high rate in 2001. Non
operating earning which was Rls. 278 million in 1997, decreased in 1998,
1999 and 2000 respectively and becoming non-operating expenses (Table
No. 6). The comparative income statement of the Tabarestan Textile
Corporation indicates that the end result of the net operation has been the
loss during the five years under study.
Table No. 5 Tabarestan Textile Corporation
Comparative Income Statements "Increase or Decrease in Term of Percentages"
For the year ended 31.03.1997 to 31.03.2001 [Figure in RIS.]
Particulars
Net Sales
Cost of Goods Sold
Gross Loss
Operating Expenses
Operating Loss
Non operating Expenses/ Earning
Net Loss
1997 Base Year
41,967,508,103
44,227,822,537
2,260,314,430
1,708,492,031
3,968,806,461
Earning
278,443,442
3,690,363,019
1998
-13%
+ 18%
+585%
-0.02%
+333%
-1,820%
+511%
1999
-55%
-50%
+102%
-52%
+36%
-7026%
+569%
2000
-
-
-
-16%
-63%
-6990%
+459%
2001
-99.8%
-99.7%
-97%
+2245%
+911%
-10%
+981%
141

The absolute figures given in the income statement for five years
i.e., from 1997 to 2001 pertaining to the Tabarestan Textile Corporation,
showing increase/decrease over the previous years in percentage. Table
No.6 reveal that the net sales decreased during 1998 by 12% over 1997.
But, the cost of goods sold during 1999 increased by 19% over 1998. Net
sales decreased from Rls. 41,967 million during 1997 to Rls. 36,653
million during 1998. Cost of goods sold during 1998 recorded an increase
from Rls. 44,227 million in 1997 to Rls.52,143 million, thus registering
an increased of 19%. The Operating Loss increase from Rls. 3,968
million during 1997 to Rls. 17,198 million during 1998 i.e., there
occurred an increase of 333% over 1997.
Non-operating earning decreased from Rls. 278 million during
1997 to Rls. 5,347 million expenses during 1998 i.e., a decrease of
1820%. Similarly, the net loss increased from Rls. 3,690 million during
1997 to Rls. 22,545 million during 1998, thus registering an increase of
510% during 1998 over 1997.
During 1999, Net Sales decreased by 48% over the previous year,
thus showing a decrease from Rls.36,653 million during 1998 to Rls.
18,905 million during 1999. Cost of goods sold decreased by 55% during
1999 over the previous year; i.e., there occurred a decrease from Rls.
142

52,143 million during 1998 to Rls. 23,480 million during 1999. Looking
to gross loss, we find a decrease by 70% during 1999 over 1998 i.e.,
decreased from Rls. 15,489 during 1998 to Rls. 4,574 during 1999.
Likewise, operating expenses decreased by 52% during 1999 over the
previous year (1998) i.e., from Rls. 1, 708 million during 1998 to Rls.821
million during 1999. Operating loss decreased by 69%) during 1999 over
the previous year. The result of non-operating expenses/earning during
1997, showed an earning of Rls.278 million, but were converted to
expenses during 1998, it showed a decrease by 1820%) during 1998 over
the previous year. In 1999 also there was a decrease by 260%o during
1999 over 1998. Thus, the net loss increased from Rls. 22,545 million
during 1998 to Rls. 24,680 during 1999, showing an increase by 9%)
during 1999 over 1998.
Since, the Tabarestan Textile Corporation did not have any
production during 2000, we can't analyse the net sales, cost of goods Sold
and gross profit/loss during 2000 and also during 2001. Operating
expenses including Administrative expenses and also the general
expenses increased from Rls.821 million during 1999 to Rls. 1,442 million
during 2000. Likewise, these expenses increased during 2001 by 2677%
over 2000; registering a 76%) increase during 2000 over 1999.
143

Though the operating loss decreased by 73% during 2000 over the
previous year, it increased again by 2,677% during 2001 over 2000. i.e.,
the absolute figures being Rls. 1,442 million during 2000; Rls.5,396
million during 1999 and Rls. 40,139 million during 2001. Non-operating
expenses decreased by 0.5% during 2000 over the previous year (1999)
and decreased by 101% during 2001 over 2000. Net loss decreased from
Rls.24,681 million during 1999 to Rls. 20,625 million during 2000 i.e.,
registering a decrease of 16% during 2000 over 1999. However, it
increased again from Rls. 20,625 during 2000 to Rls. 39,889 during 2001
i.e., showing an increase of 93% during 2001 over 2000.
144

Table No. 6 Tabarestan Textile Corporation
Comparative Income Statement "Absolute Figure, (Percentage of Increase and Decrease Over Previous Year)" For the year ended 31.03.1997 to 31.03.2001
[Figure in Rls] Particulars
Net Sales
Cost of Goods Sold
Gross Loss
Operating Expenses
Operating Loss
Non Operating
Expenses/Earning
Net Loss
1997
41,967,508,103
44,227,822,537
2,260,314,430
1,708,492,031
3,968,806,461
278,443,442
3,690,363,019
1998
36,653,097,023
• (-13%)
52,143,067,277
(+18%)
15,489,970,254
(+585%)
1,708,035,728
(-0.02%)
17,198,005,982
(+333%)
-5,347,793,427
(-1,820%)
22,545,799,409
(+511%)
1999
18,905,943,274
(-48%)
23,480,841,383
(-55%)
4,574,898,109
(-70%)
821,226,208
(-52%)
5,396,324,317
(-69%)
-19,284,797,728
(-260%)
24,681,122,045
(+9%)
2000
1,442,867,522
(+76%)
1,442,867,522
(-73%)
-19,182,567,332
(-0.5%)
20,625,437,854
(-16%)
2001
60,388,663
132,238,197
71,849,534
40,068,042,058
(+2,677%)
40,139,891,592
(+2682%)
250,452,849
(-101%)
39,889,438,743
(+93%)
145

According to the common-size income statement of the Tabarestan
Textile Corporation, taking the base of net sales, during the years under
study i.e., 1997, 1998, 1999 and 2001, the cost of goods sold was more
than the net sales. The cost of goods sold was 5% more than the net sales
(100) during 1997; 42% more than the net sales during 1998; 24% more
than net sales during 1999, and 119% more than net sales during 2001.
Thus, gross loss was 5.0%), 42%), 24%o and 119%) of net sales during the
years 1997, 1998, 1999 and 2001 respectively. The operating expenses
were 4.5%, 4.7% and 4.0% of net sales during the years 1997, 1998 and
1999 respectively, but during 2001 they increased by too high rate i.e., by
66,350%) of net sales. In other words, operating expenses have been 663.5
times more than the net sales taken as 100 and result of operating was
loss by 9.5%, 46.7%, 28% and 66,469% of net sales during 1997, 1998,
1999 and 2001 respectively. Looking non-operating expenses/earning for
1997, we find that the non-operating earning stood at 0.7%) of net sales,
but decreased during 1998, 1999 and 2001 and it was converted to
expenses by 14.6%) and 102%) of net sales during 1998, 1999 respectively.
It was again converted to earning by RIs. 250,452,849 of miscellaneous
revenue during 2001. Thus, non-operating expenses/earning has been
14.6%, 102% and 415% of net sales during 1998, 1999 and 2001
respectively. Net loss has been 8.8%, 61.5%, 130.5% and 66,054% of net
sales during 1997, 1998, 1999 and 2001 respectively.
146

Table No. 7
Tabarestan Textile Corporation Common Size Income Statements "Percentage on the base of Net
Sales" For the years
Particulars
Net Sales
Cost of Goods Sold on the
base of Net Sales
Gross Loss on the base of
Net Sales
Operating Expenses on the
base of Net Sales
Operating Loss on the base
of Net Sales
Non Operating Expenses/
Earning on the base of Net
Sales
Net Loss on the base of Net
Sales
ended 31 1997
100
105%
5%
4.5%
9.5%
+0.7%
8.8%
1.03.1997 1998
100
142%
42%
5%
47%
-14.6%
61.6%
to 31.03. 1999
100
124%
24%
4%
28%
-102%
130%
2001 2000
100
-
-
-
-
-
-
2001
100
219%
119%
66,350%
66,469%
+415%
66,054%
On the basis of the formulae given in Chapter IV for calculating
Gross Profit Ratio, Operating Ratio, Operating Profit Ratio; Non-
Operating Ratio, Net Profit Ratio; Return on Shareholder Investment,
Return on Equity Capital, Earning Per Share, Profit Volume Ration,
Margin of Safety, Margin of Safety Ratio, Current Ration and Quick
Ration, the data reveal the some discouraging facts, which are tabulated
in Table No.8 below.
147

Table No. 8 Tabarestan Textile Corporation
Profitability Performance Measures, Cost and Cost Value Profit Analysis and Liquidity Ratio*
For the years 1997-2001
Particulars
Gross Profit Ratio
Operating Ratio
Operating Profit Ratio
Non-Operating Ratio
Net Profit Ratio
Return on Share Holder
Investment
Return on Equity Capital
Earning Per Share
Profit Volume Ratio
Margin of Safety
Margin of Safety Ratio
Current Ratio
Quick Ratio
1997
-5%
4.5%
-9.5%
0.7
-8.8%
-59%
-41%
-410
14%
-43,568,799,327
-103%
1.95
0.5
1998
-42%
5%
-47%
-14.6%
-61.6%
-113%
-250%
-2505
**
**
**
0.8
0.17
1999
-24%
4%
-28%
-102%
-130%
-55%
-274%
-2742
52%
23,581,136,416
-125%
0.45
0.16
2000
***
***
***
***
***
-29%
-229%
-2291
***
***
***
0.2
0.06
2001
-119%
66,350%
-66.469%
415%
-66,054%
-36%
-443%
-4432
**
**
**
0.17
0.04
*For formulae used for the calculation of Ratios and Return on Shareholder Investment, Return on Equity Capital and Earning Per Share see Appendix No. 21-25. **Since, the amount of variable Cost was more than the sales in the year 1998 and 2001, we can't calculate the break even point. Therefore, it is not possible to calculate the Profit Volume Ratio, Margin of Safety and Margin of Safety Ratio. *** In the year 2000, the Tabarestan Textile Corporation was non-operative.
148

The data given in tlie Table No.8 indicate that the gross profit ratio
of Tabarestan Textile Corporation in 1997 was -5%, meaning that the
cost of good sold was 5% more than the sales. A close look on the profit
and loss statement Table No. 2 (In Appendix) indicates that the cost of
goods sold was Rls. 44,227 million while the cost of the raw material
consumed was Rls. 17,746 million i.e., 40% of cost of goods sold; direct
labor cost in production was Rls. 18,303 million i.e., 41% of the cost of
goods sold, and factory overhead was Rls. 8,626 million i.e., 19%) of cost
of goods sold. Therefore, it was expected that the financial managers and
cost managers should review the situation of cost of goods sold to enable
them to take appropriate corrective measures to help reduce the cost of
these items. Operating ratio was 4.5% in comparison to sales, (Rls. 1,708
million). Administrative and general expenses, and sales and distribution
expenses were the two items of operating expenses. Administrative and
general expenses was Rls. 1,371 million i.e., 80%) of total operating
expenses and sales and distribution expenses was Rls. 336 million i.e.,
20%) of total operating expenses respectively. Administration manager
should try to reduce the Administration and general expenses, because
this is too much in comparison to total operating expenses. The most
important problem of the Tabarestan Textile Corporation was non-
149

observed expenses. The net result of income statement was loss,
Consequently, return on share-holders investment and return on equity
capital were negative by -59% and -41% respectively. As regard earning
for share it was Rls. 410. Profit volume ratio of 14% indicates the
financial health of the Tabarestan Textile Corporation which was not
sound.
Margin of safety was negative by a high amount. The Concern has
been operating much below the break-even point. Therefore the margin of
safety ratio was negative by 103%. To analyze the liquidity solvency of
the Tabarestan Textile Corporation in 1997, we find that the current
assets was more than the current liabilities. Thus, the concern was able to
meet its current obligation, but its quick ratio was <1, i.e., 0.5 meaning
that most of the current assets of the concern was its inventories.
Gross profit ratio was -42% in 1998, i.e., cost of good sold was
42% more than the sales. Table No. 4 profit and loss statement (in
Appendix) indicate that the raw material consumed amounted to Rls.
16,553 million i.e., 32%) of the cost of goods sold, direct labor cost in
production was Rls. 20,291 million, i.e., 39%) of cost of goods sold,
factory overhead was Rls. 8,222 million, i.e., 18%) of cost of good sold
and decrease in stock was Rls. 7,075 million, i.e., \\% of cost of goods
150

sold. The operating ratio lias been 5% and the non-operative ratio has
been 14.6%. During 1997 it was earning, but during 1998 it was
expenses. Table No. 4 (in Appendix) indicates that the items of non-
operating expenses are miscellaneous expenses and unabsorbed Expenses
and interest expenses. The miscellaneous expenses were Rls.1,812
million i.e., 34% of the non-operating expenses, unabsorbed expenses
were Rls.3,400 million i.e., 63.5% of non-operating expenses and interest
expenses was Rls. 135 million. Unabsorbed expenses reveals that the
Tabarestan Textile Corporation was operating lower than its capacity,
return on shareholder investments, return on equity capital and earning
per share stood at -113%), -250% and Rls. -2505 respectively. Since, the
variable cost has been more than the sales during 1998, it was not
possible for us to calculate profit volume ratio, margin of safety and
margin of safety ratio. Current ratio comes to 0.8; quick ratio to 0.17,
meaning the liquidity position of the Tabarestan Textile Corporation was
unsatisfactory.
Gross profit ratio during 1999 has been -24%o, meaning that the
cost of goods sold was more than sales. Table No. 6 (in Appendix)
indicates that out of Rls.23,480 million of the cost of goods sold, Rls.
4,013 million has been for raw material consumed i.e., 17% of the cost of
151

goods sold. Direct labor cost has been Rls.4,991 million i.e., 21% of cost
of goods sold. Factory overhead has been Rls. 1,970 million i.e., 8% of
cost of goods sold. The most important item of the cost of goods sold
during 1999 has been the decrease in stock, being RJs. 12,505 million i.e.,
54% of the cost of goods sold. The operating ratio has been 4% of sales.
It is not too high, but the non-operating ratio was 102% of cost of goods
sold. It was too high. The miost important items of non-operating
expenses have been unabsorbed expenses i.e., the concern was operating
below its capacity. Return on shareholders investment, return on equity
capital and earning per share have been negative at 55%), 274% and Rls.
2,742. Profit volume ratio has been 52%, margin of safety was Rls.
-23,587 million and margin of safety ratio was -125%. Thus, the concern
was operating below the break-even point. Current ratio and quick ratio
was 0.45 and 0.16 respectively. The Tabarestan Textile Corporation was
non-operative in 2000. During this year return on shareholders
Investment, Return on equity capital and earning per share have been
negative at 29%, 229% and Rls. 2291 respectively. Its current ratio has
been too low i.e., 0.2 and its quick ratio was 0.06. The corporation again
started its operation in 2001. In this year its gross profit ratio has been -
119%, meaning that the cost of goods sold has been 119% more than its
152

sales, and operating ratio has increased by 66,350%, a very high rate.
Table No. 10 (in Appendix) indicates that most important item in this
year like the previous year has been the unattended expenses. In this year
return on shareholders investment, return on equity capital and earning
per share have been negative; while the current ratio and quick ratio were
too low.
5.4 Swadeshi Cotton Mills, (Kanpur)
After analyzing the balance sheet and the profit and loss account of
the Tabarestan Textile Corporation, we propose to give a brief history of
the Swadeshi Cotton Mills, (Kanpur) and then proceed to study and draw
conclusions from the balance sheet and profit and loss statement
pertaining to this Concern.
The present Kanpur was initially known as Kanhayapur or
Kahnpur. It was a small village upto the time of its first contact with the
t f i
British. Till the 16 Century, it did not occupy an important place in the
industrial map of Utter Pradesh and for that matter in the whole country.
In 1788, the British forces at Bilgram were strategically moved and
brought to Kanpur to establish a better site as it commanded forts across
the Ganges into Oudh. Thus, in 1788 British fortification was established
for the first time in Kanpur. Several cottage and small industries for
153

manufactures, clothing and equipments needed for the mihtary personnel
were established. The beginning of the cotton textile industry of Kanpur
is traced back to the establishment of military forts. Originally, the
industry was started for catering to the military clothing. Then other
industries like leather works and shoe making were also set up. As an
industrial site, Kanpur offered many factors such as the availability of
cotton within the state of Uttar Pradesh, the availability of abundant labor
at cheap rates, availability of cheap power and evolution of a fair
consumer market. On the other hand, the industry gathered momentum
due to the security and amenity offered by the military forces stationed at
Kanpur. The evolutionary process was due to the enterprise of the East
India Company which established a factory at Kanpur giving rise to
increasing activities in the manufacture of indigo and plantation of cotton
for clothing. During 1810s the indigo and cotton business flourished. The
real period of progress of Kanpur industry begins after the war of
independence in 1857. After war the opening of the East Indian Railway
brought new enterprises and greater incentive to industrial development.
The Swadeshi Cotton Mills Company was set up by one Mr. A.F.
Hersoman, who was the manager of the Kanpur Cotton Mills for many
years. This Concern was registered as a private limited company in 1921.
154

It is this unit which is engaged in the spinning of polyester viscose
and yarn.
The cost accounting section of the company collects the necessary
informations and data from different department of the mills and prepare
necessary annexures performa which are applicable to the company as per
the Cost accounting records (textile) rules.
5.5 Analysis of Financial Position of the Swadeshi Cotton Mills,
(Kanpur)
We have studied the data given in Table No. 9 below for financial
analysis and health of the Concern, by taking into account 1997 as the
base year.
Table No. 9 Swadeshi Cotton Mills, (Kanpur)
Comparative Balance Sheet "Increase or Decrease in Term of Percentage" For the Years ending 31.03.1997 to 31.03.2001
[Figures in Rupees]
Particulars
Current Assets
Fixed Assets
Total Assets
Current Liabilities
Long-Term Liabilities
Total Liabilities
Owners Equities
Total Liabilities & Owners
Equities
1997 Base Years
35,304,653
26,827,970
62,132,629
133,970,464
440,838,872
574,809,336
-512,675,707
62,132,629
1998
+20%
-12%
+6%
-6%
+28%
+20%
-22%
+6%
1999
+2%
-24%
-9%
+8%
+55%
+44%
"50%
-9%
2000
-14%
-35%
-23%
+8%
+96%
+76%
-88%
-23%
2001
-26%
-45%
-35%
+11%
+133%
+104%
-121%
-35%
155

We find that the data given in the Table above reveal that during
1998 the current assets increased by 20% and fixed assets decreased by
12%. The rate of decrease of fixed assets during the five years under
study i.e., 1997 to 2001 has been almost uniform, with depreciation being
an important factor. The current liabilities decreased by 6% in 1998, and
long-term liabilifies increased by 28%) in 1998. Consequently, the total
liabilities decreased. Whenever current assets are increasing and current
liabilities are decreasing, it indicates that the Concern is financing its
current assets through its long-term liabilities. During 1998, the current
assets and long-term liabilities increased, indicating that the Concern has
been financing its current assets through long-term liabilities. Owners'
equities decreased by 22%, indicating that the Concern is recording loss
in the value of its assets.
During 1999, current assets increased by 2% and current liabilities
increased by 8%). It means that the current assets are financed through
current liabilities. Whenever both current assets and current liabilifies are
decreasing, it means that the concern is paying its current liabilifies
through current assets. Thus, the Swadeshi Cotton Mills, (Kanpur)
financed its current assets through its current liabilities in 1999. Since, the
current liabilities and long-term liabilities both increased, the total
156

liabilities also increased. The data in Table No. 9 reveals that the owners'
equity decreased by 50% in 1999. The financial position of the Swadeshi
Cotton Mills, (Kanpur) during the year 2000 and 2001 remained the same
i.e., during these two years current assets and fixed assets decreased, and
the current liabilities and long-term liabilities increased. It means that the
Concern failed to generate internal surplus, and it depended upon
frequent infusion of external funds for its survival. Further, the owners'
equity decreased during 2000 and 2001.
Further analysis is based upon the absolute data derived for the
balance sheet of the Swadeshi Cotton Mills, (Kanpur) pertaining to five
years i.e., from 1997 to 2001 (Table 10,11).
157

Table No. 10 given below, gives data pertaining to Current Assets, Fixed Assets, Total Assets, Current Liabilities, Long-term, Liabilities, Total Liabilities and Owners Equity of the Swadeshi Cotton Mill, (Kanpur)
Table No. 10 Swadeshi Cotton Mills
Comparative Balance Sheet "Absolute Figure" For the year ending 31.03.1997 to 31.03.2001
[Fig. In Rupees]
Particulars
Current Assets
Fixed Assets
Total Assets
Current Liabilities
Long-Term Liabilities
Total Liabilities
Owners Equities
Total Liabilities & Owners Equities
1997
35,304,653
26,827,976
62,132,629
133,970,464
440,838,872
574,809,336
(512,675,707)
62,132,629
1998
42,379,900
(+7,075,247)
23,480,337
(-3,347,639)
65,860,237
(+3,727,608)
125,814,637
(-8,155,827)
563,781,474,
(+122,942,602)
689,596,111
(+114,786,775)
(623,735,874)
(+111,060,167)
65,860,237
(+3,727,608)
1999
35,899,884
(-6,480,016)
20,366,279
(-3,114,058)
56,266,163
(-9,594,074)
144,735,179
(+18,920,542)
684,809,081
(+121,027,607)
829,544,260
(+139,948,149)
(773,351,406)
(+149,615,532)
56,266,163
(-9,594,074)
2000
30,222,333
(-5,677,551)
17,324,010
(-3,042,269)
47,546,343
(-8,719,820)
145,175,897
(+440,718)
864,055,460
(+179,246,379)
1,009,231,359
(+179,687,099)
(961,685,016)
(+188,333,610)
47,546,343
(-8,719,820)
2001
26,031,964
(-4,190,369)
14,659,328
(-2,664,682)
40,591,292
(-6,955,051)
149,378,413
(+4,202,516)
1,026,152,586
(+162,097,126)
1,175,530,999
(+166,299,640)
(1,134,939,707)
(+173,254,691)
40,546,343
(-7,000,000)
Figures in brackets give increase/decrease over the previous year. Source: Compiled by the researcher from Balance Sheets for the year under reference.
158

Table No. 11 Swadeshi Cotton Mills, (Kanpur)
Comparative Balance Sheets "Increase or Decrease in the Total Values of Current Assets, Fixed Assets, and Total Assets, Current Liabilities, Long-term Liabilities and Total Liabiliities and Owners' Equity Over Previous
year" For the years ending 31.03.1997 to 31.03.2001
[Fig, in Rupees]
Particulars
Current Assets
Fixed Assets
Total Assets
Current Liabilities
Long-term Liabilities
Total Liabilities
Owners' Equity
Total Liabilities and Owners Equities
1997
35,304,653
26,827,976
62,132,629
133,970,464
440,838,872
574,809,336
(512,675,707)
62,132,629
1998
+20%
-12%
+6%
-6%
+27%
+20%
-22%
+6%
1999
-15%
-13%
-14.5%
+15%
+21.5%
+20%
-24%
-14.6%
2000
-15%
-15%
-15.5%
+0.3%
+26%
+22%
-24%
-15.5%
2001
-14%
-15%
-14.5%
+3%
+19%
+16.5%
-19%
-14.7%
* Calculated by the researcher. Source: Data given in Table No.9
The data given in Table No. 10 and Table No. 11 reveal that the
current assets increased by Rs.7,075,247 during 1998 over the previous
year (1997) recording a 20% increase, but decreased by Rs. 6,480,016,
Rs.5,677,551 and Rs.4,190,369 during 1999, 2000 and 2001 respectively
over the previous years, recording a 15%, decrease during 1999 over
1998, 15% decrease during 2000 over 1999 and 14% decrease during
2001 over 2000. The fixed assets, however, continued to decrease during
the years under study. The daita above reveal that the fixed assets
159

decreased by Rs. 3,347,634, Rs. 3,114,058, Rs. 3,042,269, Rs. 2,664,682
during 1998, 1999, 2000 and 2001 respectively over the previous years.
Since, the amount of the increase of current assets was more than the
amount of increase of fixed assets during 1998. The total assets also
increased during 1998. But the current assets and fixed assets decreased
during 1999, 2000 and 2001 respectively, the total assets also decreased
during the same years. The percentage decrease of total assets registered
14.5% during 1999 over 1998, 15.5% during 2000 over 1999 and 14.5%,
during 2001 over 2000. The current liabilities decreased by
Rs. 8,155,827 during 1998 over 1997. Since, the current assets increased
during 1998 over 1997, it means that the Swadeshi Cotton Mills financed
its current assets through the cuirent liabilities. But current liabilities of
Swadeshi Cotton Mills increased by Rs. 18,920,542, Rs. 440,718 and
Rs. 4,202,516 during 1999, 2000 and 2001 respectively over the previous
years, recording a 15%) increase during 1999 over 1998, 0.3%o increase
during 2000 over 1999 and 3% increase during 2001 over 2000.
According to the data given in Table No. 10 and Table No.l 1, not only the
current assets of the Swadeshi Cotton Mills decreased during the years
1999, 2000 and 2001 respectively over the previous year, but also its
160

current liabilities increased during the same years (over the previous
year).
Long-term liabilities of the Swadeshi Cotton Mills increased by Rs.
122,942,602, Rs. 121,027, Rs. 179,246,379 and Rs. 162,097,126 during
1998, 1999, 2000 and 2001 over the previous years respectively,
recording a 27% increase during 1998 over 1997, 21.5% increase during
1999 over 1998, 26% increase during 2000 over 1999 and 19%) increase
during 2001 over 2000. It means that the Concern is failing to generate
internal surplus on a continued basis, thus, depending upon frequent
infusion of external funds for its survival. The owners' equity during
1998, 1999, 2000 and 2001 decreased by Rs. 111,060,167, Rs.
149,615,532, Rs. 188,333,610 and Rs. 173,254,691 respectively i.e. by
22% in 1998, 24% in 1999, 24% in 2000 and 19% in 2001 over the
previous years. Thus, it may be inferred that the concern is recording
losses in its assets on a continued basis.
The common size balance sheet of the Swadeshi Cotton Mills,
(Kanpur) Table No. 12 gives absolute figures of each item of assets and
liabilities and also the percentage share of each asset and liability in the
total assets and liabilities. It also gives figures for owners' equities. The
data pertain to the years 1997, 1998, 1999, 2000 and 2001.
161

It may be inferred from the data that during 1997, 56.5% of the
total assets was current assets, but the combined share of cash and bank
balance stood at 3%. It means that the Concern had problem in
maintaining its liquidity in terms of cash. The share of loans and
advances, sundry debtors and inventories was 11%, 4.7%) and S% of the
total assets respectively. Out of the Total Assets, 43.4%o was net block.
Out of total liabilities, 23%) was current liabilities and 77%) was long-term
liabilities. Thus, the share of long-term liabilities in comparison to the
fixed assets was more indicating that the Concern financed its current
assets through the long-term liabilities. It means the company had to pay
more interest charges for long-term liabilities. Out of the total capital, the
share of reserved and surplus together was 0.0 l%o only, and the balance of
total capital was negative, because of accumulated losses. The share of
cash and bank balances decreased from 3% during 1997 to 0.48%) during
1998. The share of loans and advances, inventory and other current assets
decreased from 11%, 8% and 29.8% respectively during 1997 to 7.8%,
7.2% and 23%) respectively during 1998. Sundry debtors increased from
4.7% during 1997 to 20.4% during 1998. Out of the total assets, 41.04%
was net block. The share of current liabilities was 18% of the total
liabilities and the share of long-term liabilities was 82% of the total
162

liabilities. Thus, Concern financed its current assets through its long-term
liabilities. The balance of total capital was negative.
During the year 1999, out of the total assets the share of cash and
bank balance, loans and advance, sundry debtors and inventories stood at
0.9%, 5%, 13.6% and 1% respectively. The share of net block decreased
from 41.04% during 1998 to 36.4% during 1999, due to depreciation. Out
of the total liabilities, 17% was current liabilities and 83% was long-term
liabilities. The balance of total capital was negative. A close look to the
Table reveals that the accumulated loss increased from Rs. 512 million
during 1997 to Rs. 623 million during 1998. It also increased from Rs.
623 million during 1998 to Rs. 773 million during 1999.
During 2000, out of total assets the share of cash and bank balance,
loans and advance, sundry debtors, inventories and other current assets
stood at 3.6%, 4.5%, 9.7%, 6.9% and 38.8% respectively. The share of
current assets was 63.5% of the total assets, while the share of current
liabilities was 14.4% of the total liabilities. The balance of total capital
was negative. Accumulated loss increased from Rs. 773 million during
1999 to Rs. 961 million during 2000.
Out of the total assets during 2001, 1.4% was cash which decreased
from Rs. 1,707,882 during 2000 to Rs. 585,000 during 2001. Loans and
163

advances decreased from Rs. 2,144,360 during 2000 to Rs. 1,864,195
during 2001. In the total assets, the share of sundry debtors, inventories
and other current assets stood at 5%, 8% and 45% respectively. Out of the
total assets, the share of current assets was 64% and the share of fixed
assets was 36%. During the year 2001, the current liabilities were 12.6%
of total liabilities, and the long-term liabilities were 87.4%) of the total
liabilities. Accumulated loss increased from Rs. 961 million during 2000
to Rs. 1,13 5 million during 2001.
164

&
e e
^ 6X)
^
«s a fe
111
( / ) y « C
PQ
N
I B O
S o
© ©
©
f ^
o
o\ as
©
i:X)| c
-3 fi a> I/)
<u
a> 4S
^ =«
o o
O O o
u
JS
ON O N
0 0 ON ON
es
O N ON
I
^
C)
U
u
oa <
(N
ON
00
i n
X
NO
"*" NO
o" o r4
X ,
NO
O N
^\ r-ON_^
N O
X i n NO
o r-
o NO
oo
ON
0 0
X (N ON NO
oo oC en
oo'' ON NO
X
NO NO
o o
ON ON ON
o"
lr>
X o o
ON i n m^
ON" O O
X O
o
NO o o
O N O
rn
X
o p o
O N O
X O N o o o
o o o o
o
>n en
o o o o
(N
oo" IT)
NO ON
X ON O O
O O
O
o
ON
in" m
00
oo" O N
r-" 1/1
o NO (N
ON"
<N
0 0
O N
o
m
NO
o
i n
X 00
X N O
X NO NO
X o o
X
q o
X
o o
NO
i n (N
00
00
(N
c o C/1
> o X
c <1) fc 3
U rt O H
N O (N NO_
t~-"
i n o" m •=1-
ND ON
m O N " 0 0 NO
ON O
m
00
ON" O 00__
en (N N O
X X NO NO
X O O
X
q o
X
o o
o r | r-" '^ in_ (N" NO
NO^
ON
r | oo"
en
NO en en^ as o 00
^" i n
ON O en^
en
NO
q_ o" i n
r i m
c 03 O J T3 <U
3 O D
C 03 O
- J •o
3 o u w c D
X3 C3
o
& 3
T3 1) >
O J X)
3
e 3 u o
<
ON
X O
o
NO
i n 00 NO__
NO ON
X o o
i n NO
ON
q oo"
r'l"
X O O
00^ in" en
en CN NO
X o O
o
in"
^ „ ri m
1

5.6 Analysis of Cost and Profitability of the Swadeshi Cotton Mills,
(Kanpur)
The comparative income statement of the Swadeshi Cotton Mills,
(Kanpur) given below (Table No. 13) gives increase /decrease in term of
percentages (with 1997 as the base year) pertaining to net sales, cost of goods
sold, gross loss, operating expenses, operating loss, non-operating
earning/expenses and net loss. The data pertain to the years 1997, 1998, 1999,
2000 and 2001.
Table No. 13
Swadeshi Cotton Mills, (Kanpur)
Comparative Income Statements "Increase or Decrease in Term of
Percentages"
For the years ending 31.03.1997 to 31.03.2001
Particulars
Net Sales And Job Conversion Charge
Cost Of Goods Sold
Gross Loss
Operating Expenses
Operating Loss
Non Operating Expenses
Net Loss
1997 (base year)
46,751,506
72,537,200
25,785,694
31,803,970
57,589,664
41,642,051
99,231,715
1998
-3%
-7%
-13%
+12%
+0.8%
+27%
+ 12%
1999
-78%
-58%
-22%
+95%
+43%
+62%
+51%
2000
-61%
-58%
-53%
+ 172%
+71%
+ 116%
+90%
2001
-29%
-28%
-27%
+33%
+11%
+169%
+75%
166

It is revealed that the net sales and job conversion charge decreased
during the years under study i.e., from 1997-2001. The rate of decrease was
3%, 78%, 61% and 29%) respectively during the period under study with 1997
as the base year. Similarly the cost of goods sold decreased by 7%), 58%), 58%o
and 28%) during the same period respectively (over 1997 as the base year).
The rate of decrease of cost of good sold was lesser than the rate of decrease
in the net sales and job conversion charge during the years under study except
during 1998. Since, cost of goods sold decreased, gross loss also decreased
during the years under study. Operating expenses increased by 12%o, 95%),
172%) and 33%) during this period over 1997 respectively. Consequently,
operating loss also increased. Non-operating expenses increased by 27%),
62%, 116% and 169% during 1998, 1999, 2000 and 2001 respectively. Thus,
the net loss increased during the years under study.
The absolute figures, given in the comparative income statement
(Table No. 14) for five years i.e., from 1997 to 2001 pertaining to the
Swadeshi Cotton Mills, Kanpur, showing percentage increase/decrease over
the previous years.
167

Table No. 14 Swadeshi Cotton Mills, (Kanpur)
Comparative Income Statements "Absolute Figure and Percentage of Increase or Decrease Over Previous Year"
For the year ending 31.03.1997 to 31.03.2001 [Fig, in Rupees]
Particulars
Net Sales And Job
Conversion Charge
Cost Of Goods Sold
Gross Loss
Operating Expenses
Operating Loss
Non Operating
Expenses
Net Loss
1997
46,751,506
72,537,200
25,785,694
31,803,970
57,589,664
41,642,051
99,231,715
1998
45,172,727
(-3%)
67,679,287
(-7%)
22,506,560
(-13%)
35,557,691
(+12%)
58,064,251
(+0.8%)
52,994,916
(+27%)
111,059,167
(+12%)
1999
10,070,017
(-77%)
30,141,962
(-55%)
20,071,945
(-10.8%)
62,131,698
(+74.7%)
82,203,643
(+41.5%)
67,338,580
(+27%)
149,542,223
(+34.7%)
2000
18,057,616
(+79%)
30,256,287
(+0.3%)
12,198,671
(-39%)
86,382,230
(+39%)
98,580,901
(+20%)
89,826,018
(+33%)
188,406,919
(+25.9%)
2001
33,341,197
(+84.6%)
52,162,878
(+72%)
18,821,681
(+54%)
42,287,293
(-51%)
64,108,974
(-35%)
112,145,717
(+24.8%)
173,254,691
(-8%)
The data given above reveals that the net sales and job conversion
charges decreased during 1998 by 3% over 1997, while the cost of goods sold
decreased during 1998 by 7% over 1997, and the gross loss decreased during
1998 by 13% over 1997. Net sales and job conversion charge decreased from
Rs.46 million during 1997 to Rs.45 million during 1998, recording a 2.17%
168

decreased. Cost of goods sold, decreased from Rs.72 million during 1997 to
Rs.67 million during 1998. Consequently, the gross loss decreased from
Rs.25 million during 1997 to Rs.22 million during 1998. The operating
expenses increased from Rs. 31 million during 1997 to Rs.35 million during
1998 i.e., there occurred an increase of 12% over 1997. Non-operating
expenses increased from Rs.41 million during 1997 to Rs.52 million during
1998, registering an increase of 27% during 1998 over the previous year
(1997). Similarly, the net loss increased from Rs.99 million during 1997 to
Rs.l 11 million during 1998, registering an increase of 12%) during 1998 and
1997.
During 1999, the net sales and job conversion charge decreased by
77% over previous year (1998); thus, showing a decrease from Rs.45 million
during 1998 to Rs.lO million during 1999. The cost of goods sold decreased
by 55% during 1999 over the previous year; i.e., there occurred a decrease of
Rs. 37 million while the cost of goods sold decreased from Rs.67 million
during 1998 to Rs.30 million during 1999. Looking to gross loss, we find a
decrease by 10.8% during 1999 over 1998, when it decreased from Rs.22
million during 1998 to Rs.20 million during 1999. Operating expenses
increased by 74.7% during 1999 over the previous year (1998) while the
operating expenses increased from Rs.35 million during 1998 to Rs.62
169

million during 1999. Likewise, the operating loss increased by 41.5% during
1999 over the previous year. Non-operating expenses and net loss increased
by 27% and 34.7%) during 1999 over previous year respectively. Non-
operating expenses increased from Rs. 52 million during 1998 to Rs. 67
million during 1999, and the net loss increased from Rs. I l l million during
1998 to Rs. 149 million during 1999.
During the years 2000 and 2001, net sales and job conversion charges
increased by 79%o and 84.6%o respectively over the previous years, thus
showing an increase from Rs.lO million during 1999 to Rs.l8 million during
2000 and an increase from Rs. 18 million during 2000 to Rs. 33 million
during 2001.
During 2000 and 2001 cost of goods sold increased by 0.3%) and 72%)
over the previous years respectively i.e., it increased from Rs. 30,141,962
during 1999 to Rs. 30,256,287 during 2000 and from Rs. 30,256,287 during
2000 to Rs. 52,162,878 during 2001. Gross loss decreased by 39% during
2000 over the previous year (1999) i.e., it increased from Rs. 20 million
during 1999 to Rs.l2 million during 2000. Gross loss increased by 54%)
during 2001 over 2000 i.e., it increased from Rs.l2 million during 2000 to
Rs.l8 million during 2001. Operating expenses increased by 39%) during
2000 over previous year (1999) and decreased by 51%o during 2001 over
170

2000. Non-operating expenses increased from Rs.67 million during 1999 to
Rs.89 million 2000, and to Rs. 112 million during 2001. Net loss increased
from Rs.l49 million during 1999 to Rs. 188 million during 2000, registering
an increase of 25.9% during 2000 over 1999. Net loss decreased from Rs.l88
million during 2000 to Rs. 173 million during 2001, showing a decrease of
8% during 2001 over 2000.
According to the common-size income statement of the Swadeshi
Cotton Mills, Kanpur (Table No. 15) taking the bases of net sales and job
conversion change, the cost of sold was more than the net sales and job
conversion charge during the years under study i.e., 1997, 1998, 2000 and
2001. It was 55% more than the net sales and job conversion charge during
1997, 50% more than the net sales and job conversion charge during 1998,
199% more than the net sales and job conversion charge during 1999, 68%
more than the net sales and job conversion charge during 2000 and 56% more
than the net sales and job conversion charge during 2001. Thus, gross loss
was 55%, 50%, 199%, 68% and 56% of net sales and job conversion charge
during the years 1997, 1998, 1999, 2000 and 2001 respectively. The
operating expenses was 68%, 79%, 617%, 478% and 127% of net sales and
job conversion charge respectively during the years under study. The result of
operating was loss by 123%, 129%, 816%, 546% and 193% of net sales and
171

job conversion respectively during the above period. Non-operating expenses
has been 89%, 117%, 669% and 236% of net sales and job conversion charge
during 1997, 1998, 1999, 2000 and 2001 respectively. Thus, net loss has been
212%, 246%, 1,485%, 1,0435 and 52% of net sales job conversion charge
during 1997, 1998, 1999, 2000 and 2001 respectively.
172

Table No. 15 Swadeshi Cotton Mills, (Kanpur)
Common-Size Income Statements "Percentages on the base of Net Sales and Job Conversion Charge "
For the years ending 31.03.1997 to 31.03.2001 Particulars
Net Sales and Job Conversion
Charge
Cost of Goods Sold on the base of
Net Sales and Job Conversion charge
Gross Loss on the base of Net Sales
and Job Conversion charge
Operating Expenses on the base of
Net Sales and Job Conversion charge
Operating Loss on the base of Net
Sales and Job Conversion charge
Non Operating Expenses on the base
of Net Sales and Job Conversion
charge
Net Loss on the base of Net Sales
and Job Conversion charge
1997
100
155%
55%
68%
123%
89%
212%
1998
100
150%
50%
79%
129%
117%
246%
1999
100
299%
199%
617%
816%
669%
1,485%
2000
100
168%
68%
478%
546%
497%
1,043%
2001
100
156%
56%
127%
192%
336%
520%
On the base of the formulae given in chapter IV for calculating gross
profit ratio, operating profit ratio, non-operating ratio, net profit ratio, return
on share investment, return on equity capital, earning per share, profit volume
ratio, margin of safety, margin of safety ratio, current ratio and quick ratio,
the data reveal the some discouraging facts, which are tabulated in Table
No. 16.
173

Table No. 16
Swadeshi Cotton Mills, (Kanpur)
Profitability Performance Measures, Cost and Cost Volume Profit
Analysis and Liquidity Ratio*
For the years 1997-2001
Particulars
Gross Profit Ratio
Operating Ratio
Operating Profit Ratio
Non-Operating Ratio
Net Profit Ratio
Return on Share-Holder
Investment
Return on Equity Capital
Earning Per Share**
Profit Volume Ratio
Margin of Safety
Margin of Safety Ratio
Current Ratio
Quick Ratio
1997
-55%
68%
-123%
89%
-212%
-19%
-135,360%
25%
-401,117,950
-1203%
0.26
0.22
1998
-50%
79%
-129%
117%
-246%
-18%
-151,495%
31%
-364,810,395
-807%
0.34
0.3
1999
-199%
617%
-816%
669%
-1485%
-19%
-203,989%
***
***
***
0.25
0.21
2000
-68%
478%
-546%
497%
-1,043%
-21%
-257,000%
47%
-405,871,228
-2,248%
0.21
0.18
2001
-56%
127%
-193%
337%
-520%
-15%
-236,334%
27%
-628,755,985
-1886%
0.17
0.15
*For formulae used for the calculation of Ratios and Return on Shareholder Investment, Return on Equity Capital and Earning Per Share see Appendix No. 26-30. **Since, the total number of Equity Shares is needed for calculation of E.P.S. and the amount of Share Capital on the Balance Sheet is zero. Therefore, calculation of E.P.S. is not possible. *** The amount of Variable Cost was more than the Sales in the year 1999. Therefore, calculation of Break Even Point is not possible
174

The data given in Table No. 15 reveal that the gross profit ratio of the
Swadeshi Cotton Mills, Kanpur in 1997 was -55%, meaning that the cost of
goods sold was 55% more than the net sales and job conversion charge. Profit
and loss statement of the Swadeshi Cotton Mills, Kanpur Table No. 12 (in
Appendix) indicates that the cost of goods sold was Rs. 72,537,200 while the
material consumed was Rs. 1,722,324 i.e., 2% of cost of goods sold; direct
labor cost in production was Rs. 33,565,000 i.e., 46% of cost of goods sold;
factory overhead was Rs. 35,857,430 i.e., 49.5% of cost of goods sold and
decrease in stock was Rs. 1,392,446 i.e., 2.5% of cost of goods sold. It shows
that the labor cost is too high and is one of the reason for sickness of the
Swadeshi Cotton Mill. Operating Ratio was 68% in comparison to net sales
and job conversion charge, (Rs. 31,803,970). Non-operating expenses was
Rs. 41,642,051 i.e., 89% in comparison to net sales and job conversion
charge. Table No. 12 (in Appendix) indicates that the non-operating expenses
consist only of interest charge, because huge long-term liabilities of the mill.
Since, the net profit ratio has been -212%, Consequently, return on
shareholders investment was -19% and return on equity capital was -
135,360%. Profit volume ratio of 25% indicates the financial health of the
Mill, was not sound. Margin of safety was negative by a high amount (Rs.
-401,117,950) and margin of safety ratio was negative by 1203% i.e., the
175

Concern has been operating much below the break-even point. The current
ratio and quiclc ratio were 0.26 and 0.22 respectively meaning that the
concern was unable to meet its current obligation and quick obligation.
Gross profit ratio was -50% in 1998, i.e., cost of goods sold was 50%
more than the net sales and job conversion charge. Table No. 14 Profit and
loss statement (in Appendix) indicates that the material consumed was Rs.
1,738,602, 2.6%) of cost of goods sold, direct labor cost in production was Rs.
29,326,000, 43% of cost of goods sold, factory overhead was Rs. 36,491,926,
54%o of cost of goods and decrease in stock was Rs. 122,759. It shows that the
direct labor cost in production and factory overhead were very high. The
operating ratio, operating profit ratio, non-operating ratio and net profit ratio
were 68%), -123%, 89%o and -212% respectively. Return on shareholder
investment and return on equity capital stood at -19%o and -135,360%)
respectively. Profit volume ratio of 31% indicates the financial health of
concern was not sound. Margin of safety was negative by a high amount (Rs.
-364,810,395) i.e., the concern has been operating much below the break
even point. Thus, the margin of safety ratio was negative by 807%. The
current ratio of the concern was 0.34 and the quick ratio was 0.3.
Gross profit ratio in 1999 was -199%, meaning that the cost of goods
sold was 199%) more than the net sales and job conversion charge. Profit and
176

loss statement Table No. 16 (in Appendix) indicates that, out of Rs.
30,141,962 Cost of goods sold, material consumed, direct labor cost in
production and factory overhead were Rs. 5,198,640, Rs. 8,742,000 and
Rs. 17,513,498 respectively. Operating ratio was 617% in comparison to net
sales and job conversion charge, (Rs. 62,131,698). Non-operating ratio was
669% and the net result of income statement was loss. Consequently, return
on equity capital were by -19%) and -203,989%) respectively. Since, the
variable cost was more than the net sales and job conversion charge during
1999, it is not possible for us to calculate profit volume ratio, margin of
safety and margin of safety ratio. Current ratio comes to 0.25, quick ratio to
0.21, meaning the liquidity position of the mill was unsatisfactory.
Gross profit ratio during 2000 has been -68%, meaning that the cost of
goods sold was 68%) more than net sales and job conversion charge. Table
No. 18 (in Appendix) indicates that out of Rs. 30,256,287 cost of goods sold,
material consumed has been Rs. 1,140,648. Direct labor cost in production
has been Rs. 8,368,000 i.e., 27.7%) of cost of goods sold. Factory overhead
has been Rs. 18,643,658 i.e., 61.6%) of cost of goods sold. The operating ratio
and non-operating ratio have been 478%) and 497%) respectively. These ratios
were too high. Return on shareholders investment and return on equity capital
were -21%) and -257,000%) respectively. Profit volume ratio has been 47%),
177

margin of safety was Rs. -405,871,228 and margin of safety ratio was -
2,248%. Thus, the Concern was operating below the break-even point.
Current ratio and quick ratio were 0.21 and 0.18 respectively.
In 2001 gross profit ratio has been -56%, i.e., the cost of goods sold
was 56% more than the net sales and job conversion charge. Out of Rs.
52,162,878 of cost of goods sold, material consumed was Rs. 3,018,679,
direct level cost in production was Rs. 21,147,000 and factory overhead was
Rs. 27,990,320. The operating ratio and non-operating ratio have been 127%
and 337%. The most important itemis of non-operating expenses during the
five years under study was interest charge. Net profit ratio was -52%,
Consequently, return on shareholder investment and return on equity were
negative by 15% and 236,334% respectively. Profit volume ratio, margin of
safety and margin of safety ratio have been 27%, Rs. -628,755,985 and
-1,886%. Thus, the Concern was operating below the break-even point.
Current ratio and quick ratio were 0.17 and 0.15 respectively, meaning the
liquidity position of the Swadeshi Cotton Mills, Kanpur, was unsatisfactory.
From the analysis of financial position of Tabarestan Textile
Corporation and the Swadeshi Cotton Mills through their balance sheet, we
can conclude that the financial position of the two mills were same i.e., their
current and quick ratio were <1. The two mills financed their current assets
178

through the long-term liabiUties, and the balance of total capital was negative.
From the analysis of cost and profitability of the two mills through their
income statement we find similarities in their functioning i.e. the cost of
goods sold of the two mills were more than their net sales. The operating
expenses and non-operating expenses of the two mills in comparisons to their
net sales were too high. The detail discussion of our finding will be in the
next chapter.
179

5.7 References
' Rabino, 1997, Mazandaran and Estarabad, Translated by Wahid
Mazandarani, Sales Publisher, Tehran, Iran, p.7.
Pesyan and Motazed, 1999, from savadkoh to thohansberg, Sales
Publishers, Tehran, Iran, p.679.
^ Paysan and Motazed, 1999, from Savadkoh to Jhohansborg, Sales Publisher,
Tehran, Iran, p.683.
"* Manchester Gardian Newspaper, 02-11.1934.
180

CHAPTER-6
FINDING AND SUGGESTIONS
181

The preceding chapters have covered different aspects of the study.
Apart from the critical examination of financial statements, including the
balance sheets and income statements and also cost auditing reports of the
Tabarestan Textile Corporation and the Swadeshi Cotton Mills, the
genesis of the growth of mills in Iran and India and its economic impact
have also been analysed. The focus of the discussion has also been
directed towards the problematic areas of the two mills. Further,
considerable attention has been given to critically review the financial
position and also cost and profitability of the two mills under study.
Further attention has been paid to the study of various problems
confronting the two corporations. Efforts has also been made to
comparative evaluate the performance of the Tabarestan Textile
Corporation and the Swadeshi Cotton Mills. The purpose has been to
synthesize the various aspects of study which have been made in the
foregoing chapters so as to provide an integrated view of the findings and
conclusions of the study.
As has been discussed in earlier chapters, the texfile industry holds
a prominent position in the economy of Iran and India by virtue of its
size, employment potential, contribution to domestic product, exports
earnings etc.
182

As we have mentioned in tlie objective of the study, we
investigated the definition and history of textile, process, phases, signs,
detection of sick textile units and reasons of textile units' sickness. We
elaborated the concept of cost and profitability, and also investigated the
financial position of the two mills under study, and analysed the cost,
profitability, cost volume profit and liquidity ratio of the Tabarestan
Texfile Corporation and the Swadeshi Cotton Mills. The cost and
profitability position and the financial position of two mills reveal that:
I. The gross profit ratios of the Tabarestan Textile Corporation and
the Swadeshi Cotton Mills in 1997 have been negative, meaning
thereby that the cost of goods sold by both has been more than the
sales and job conversion charge. But the amount of gross profit
rafio of the Swadeshi Cotton Mills is lower. The gross profit rafio
of the Tabarestan Texfile Corporafion in 1997 was -5.3%, but the
gross profit ratio of the Swadeshi Cotton Mills in 1997 was -55%,
meaning thereby a 49.7% lower gross profit ratio by of the
Tabarestan Textile Corporafion. Out of 100% cost of goods sold by
the Tabarestan Texfile Corporafion in 1997, 41%) has been the
direct labor cost in production. Similarly, out of 100% cost of
goods sold by the Swadeshi Cotton Mills in 1997, 46% has been
]83

the direct labor cost in production, meaning thereby that the
situation of labor cost in production of the two mills during 1997
has been the same. Out of 100% cost of goods sold by the
Tabarestan Textile Corporation in 1997, 19.5% has been the
factory overhead, in comparison to the cost of goods sold, it is not
more, because the most expenses of factory overhead in the
Tabarestan Textile Corporation is depreciation and amount of
building, machinery and equipment as shown by historical cost in
the balance sheet, and the historical cost of these items is very low.
But out of 100%) cost of goods sold by the Swadeshi Cotton Mills
in the same year, 49% has been the factory overhead, means
indirect labor cost in production, utilities, stores and spares and
repair and maintenance expenses of the Swadeshi Cotton Mills has
been too much. The material consumed by the Tabarestan Textile
Corporation in 1997, as compared to the Swadeshi Cotton Mills
has been too much, because the cost of material in Iran has
increased during the Iran-Iraq war and after war also the war. In
1998 gross profit ratio of the Tabarestan Textile Corporation in
comparison to the Swadeshi Cotton Mills is better, but in
comparison to last year it has been worse, because, firstly the
184

amount of sales in comparison to last year has decreased. Secondly,
the cost of goods sold in comparison to last year, has increased.
The reason of increase in the cost of goods sold, is decrease in
stock. Out of 100% cost of goods sold of the Tabarestan Textile
Corporation in 1998, 11% is decrease in stock. Gross profit ratio of
Swadeshi Cotton Mills in 1998 stood at - 5 % while that of the
Tabarestan Textile Corporation in same year was much higher
negatively. However, as compared the last year it was better in
1999. Net sales and job conversion charge of the Swadeshi Cotton
Mills in 1998, as compared to 1997, decreased by 3% but the cost
of goods sold, decreased by more than 3%. Consequently, the gross
profit ratio decreased. In 1999, gross profit ratio of the Tabarestan
Textile Corporation in comparison to last year was better.
Similarly, during 1999 also as compared to gross profit ratio of the
Swadeshi Cotton Mills it was better. Out of 100% cost of goods
sold by the Tabarestan Textile Corporation, 17% was accounted for
by the cost of the material consumed, 21%) by direct labor cost of
production, S% by the factory overhead and 54%o due to decrease in
stock Thus, the net sales in comparison to 1998, decreased,
decrease in stock has also converted to increase, means the concern
185

has great problem in inventories. Whenever the sales decrease,
stock should increase. The percentage of material consumed and
direct labor cost in production by the Tabarestan Textile
corporation during 1999, in comparison to the percentage of
material consumed, the direct labor cost in production of the
Swadeshi Cotton Mills has been the same. But percentage of
factory overhead of the Tabarestan Textile Corporation in
comparison to the percentage of the factory overhead of the
Swadeshi Cotton Mills sharply differed. Out of 100% cost of good
sold by the Tabarestan Textile Corporation during 1999, 8% was
accounted for by the factory overhead, but out of 100% cost of
goods sold by the Swadeshi Cotton Mills, 54% was the share of
factory overhead, because indirect labor cost in production, utilities
expenses, stock and spares expense, repair and maintenance
expenses of the Swadeshi Cotton Mills were higher. Since the
Tabarestan Textile Corporation was non-operative in 2000,
therefore we can't compare the operations of the two mills during
2000, but the gross profit ratio of the Swadeshi Cotton Mills during
2000 in comparison to 1999 was better. During the last four years
under the study, the gross profit ratio of the Swadeshi Cotton Mils
186

was lower than the gross profit ratio of the Tabarestan Textile
Corporation. But during 2001, Gross profit ratio of the Tabarestan
Textile Corporation was lower than the gross profit ratio of the
Swadeshi Cotton Mills. The main reason for this situation, is that
the Tabarestan Textile Corporation was non-operative in 2000. It
started again in 2001. A low gross profit ratio, generally indicates
high cost of good sold due to unfavourable procurement policies,
lesser sales, lower selling prices, excessive competition, over
investment in plant and machinery, etc. Consequently the gross
profit ratio of the two mills under study, reveals the sickness and
inefficiency of operation: When every thing is normal, the gross
profit ratio should remain unchanged, irrespective of the level of
production and sales, since it is based on the assumption that all
costs deducted when computing gross profit which varies with
sales.
187

Percentage
|NJ O i
o
fvj O O
J H Q) (D (/)
' I—I-
CO
Q. CD (/) =7
o o (/) (A
"0
o
7i 0)

II. Operating ratio of the Tabarestan Textile Corporation in
comparison to the Swadeshi Cotton Mills during the years under
study was better, except for 2001. Two items of operating expenses
of the Tabarestan Textile Corporation as indicated by the income
statement was administrative and general expenses, and sales and
distribution expenses. Operating ratio of the Tabarestan Textile
Corporation was less than 5% from 1997 to 1999. Since the mill
was non-operative in 2000, we couldn't calculate the operating
ratio for this year. In 2001, the Operation Ratio increased by too
high a rate. The operating ratio of the Swadeshi Cotton Mills in
1997 was 68% and in comparison to the Tabarestan Textile
Corporation in the same year its was too much. The most important
item of operative expenses in 1997, as is shown on the income
statement, Table No. 12 (in Appendix) are the provisions for
statutory gratuity, administration overhead and other employees'
cost. The management should analyse these items, especially the
other employees' cost. In 1998, operating ratio of the Swadeshi
Cotton Mills in comparison to the previous year increased. It was
too high also for the Tabarestan Textile Corporation in the same
year. Employees cost on selling and distribution, provision for
189

statutory gratuity, employee cost on administration and actual
bonus, was the most important expenses as is shown in Table No.
16 (in Appendix). In 1999, the Operating Ratio of the Swadeshi
Cotton Mills in comparison to the Tabarestan Textile Corporation,
and also in comparison to the previous year increased by a high
rate. The most important operating expenses of the Swadeshi
Cotton Mills as is shown in the income statement are accounted for
by the cost due to non-working. After that, come the provision for
statutory gratuity, and then actual bonus to employee and
administration overhead. Since the Tabarestan Textile Corporation
was non-operative in 2000, we cannot compare the operating ratio
of the two mills in this year. But the operating ratio of the
Swadeshi Cotton Mills in comparison to the previous year
increased and the most important expense as is shown in Table
No. 18 (in Appendix) is the provision for statutory gratuity.
Operating ratio of the Tabarestan Textile Corporation in 2001, after
one year closing, has increased by too high a rate in comparison to
1999, and in comparison to the operating ratio of Swadeshi Cotton
Mills, Kanpur (India) in same year is also too high. The most
important item of the operating expenses of the Tabarestan Textile
190

Corporation in 2001 is unattended expenses. It means that the
concern was operating at lower than its capacity. The most
important item of the operating expenses of the Swadeshi Cotton
Mills (Kanpur) in 2001 is Employee Cost for non-working.
Consequently, the operating ratio of the two mills under
study reveals that the Tabarestan Textile Corporation and Swadeshi
Cotton Mills, (Kanpur) are sick and the operating expenses
position of both of these has been unsatisfactory.
191

A o o o o o
_^
o o o o
Percentage K) O O O O
CJ O O O O
A o o o o
en o o o o
O) o o o o
-vl o o o o
I H
fl) -^ (D W
Q. CD
o •a (D
3 (Q
192

III. The non-operating ratio of the Tabarestan Textile Corporation in
comparison to non-operating ratio of Swadeshi Cotton Mills
(Kanpur) during the years under study is better. The two items of
the non-operating expenses of the Tabarestan Textile Corporation
are non-observed expenses and miscellaneous earning/expenses.
Non-observed expenses reveal that the concern was operating at
lower than its capacity. In 1997 the total non-operating results was
income, because miscellaneous Income was more than un-observed
expenses. But in the years 1998 and 1999, non-observed expenses
was more than the miscellaneous income. Therefore, the result of
non-operating ratio in comparison to 1997 decreased; but in 2001
increased again. Non-operating ratio of the Swadeshi Cotton Mills,
(Kanpur) is very unfavourable. It has been continuously increasing.
The non-operating expenses of the Swadeshi Cotton Mills
(Kanpur) is interest charge only, i.e., the solvency position of the
concern is unsatisfactory.
193

Percentage
o o o o o o o o o o o o o o o o o o o o o
i H Q} u-—t CD (/> I—••
Q)
CO
Q) Q. 0 (/) 3-
I
o (P
0)
194

IV. Net Profit Ratio of the Swadeshi Cotton Mills, (Kanpur) during the
five years period under study, is negative, becoming worse every
year in comparison to the previous years. Net profit ratio of the
Swadeshi Cotton Mills, (Kanpur) in comparison to the net profit
ratio of the Tabarestan Textile Corporation has lower except in
2001. Net profit ratio of the Tabarestan Textile Corporation during
the five years under study is also found negative. Since the net
profit ratio of the Tabaresta.n Textile Corporation and the Swadeshi
Cotton Mills, (Kanpur) is negative, the return on shareholders'
investment, return on equity capital and also the earning per share
of the two mills are negative. Thus, the means two mills are
unprofitable.
195

1
o o o o
1
o o o o
1
en o o o o
Percentage 1
o o o o
1 GO O O O O
1
O O O
o
1
o o o o
T Q)
cr Q} (D W
3
(fi ^ U) Q . (D U) zr
Z (D !•*•
•0 3 P4-
7) fi)
o
196

V. Profit volume ratio of the Swadeshi Cotton Mills, (Kanpur) during
the five years under study is less than 50%. It is not possible to
calculate the profit volume ratio for 1998, because for the
calculation of profit volume ratio, the sale volume must touch the
in break even point. When, variable cost of a Concern is more that
the sales, it is not possible to calculate the break even point.
Variable cost of Swadeshi Cotton Mills, (Kanpur) is more than the
sales in 1999. Profit volume ratio of the Tabarestan Textile
Corporation during 1997 and 1999 has been 14% and 52%)
respectively. Calculation of profit volume ratio for the three other
years is not possible because variable cost was more than the sales.
Profit volume ratio of the two mills reveals that their financial
health has not been sound. The margin of safety of two mills is
negative and margin of safety ratio of the two mills is also
negative. It means that the Tabarestan Textile Corporation and the
Swadeshi Cotton Mills, (Kanpur) have been operating below the
break even point.
197

Percentage hO CO ^
o o o o o
CO CD
—
1 H Q}
UJ - 1 (D (/) 0) D
CO ^ Q) Q. CD (/) 3 -
1 • 0
o - t t ^ • • l
I - *
<
o c 3 CD 7} fi)
o
CO CO CO
— CD CD CD
O O O
K) O O
198

VI. The current ratio and the quick ratio of the Swadeshi Cotton Mills,
(Kanpur) during the five years under study have been less than 0.5,
and also the current ratio and quick ratio of the Tabarestan Textile
Corporation during the five years under study is less than 0.5,
except for 1997 and 1998. Its current ratio is 1.95 in 1997 and 0.8
in 1998. Consequently, the liquidity solvency of the Tabarestan
Textile Corporation and the Swadeshi Cotton Mills, (Kanpur) has
been unsatisfactory.
199

1997 1998 1999
Current Ratio
2000 2001
-Tabarestan -•—Swadeshi
1997 1998 1999
Quick Ratio
2000
-Tabarestan —•—Swadeshi]
2001
200

From the above analysis all points of our hypothesis are proved,
i.e. the Tabarestan Textile Corporation, Qamshashar and the Swadeshi
Cotton Mill, (Kanpur) was working below break-even point. Their
liquidity and solvency positions are in poor state and incurring huge
losses. It is clear from our analysis that cotton textile mills of Iran and
India are sick and in need of immediate remedial measures.
The industiy has been in doldrum due to its low productivity and
low capacity utilization on account of inadequate and uncertain supply of
raw materials, increase in the price of power, fuel and cotton, increase in
interest charge, sluggish cloth production, lack of modernization, credit
squeeze and lack of consumers demand, etc. Due to low productivity the
mills have been incurring losses continuously. The present study was
undertaken with a view to make an assessment of the problems of cost
and profitability relating to the Tabarestan Textile Corporation and the
Swadeshi Cotton Mills. Apart from the above-mentioned problems,
several other serious disabilities from which the cotton textile mills have
been suffering and which are collectively responsible for the severe crisis
and present state of poor health, are summarized below:
1. The escalation in price of raw cotton therein is a major factor
contributing to the soaring cost of production of cotton textiles.
201

The production cost of yarn and cloth has risen during the last three
decades. The price of raw materials for the industry has undergone
a sea-change since the last three decades. With a small cotton crop
than originally projected, higher mill consumption, continuous hike
in prices of indigenous viscose fibre, other than the man-made
fibres and filament yarns and increase in the cost of other inputs,
the mill working has become highly uneconomic.
2. The fixing of wages at a high level without linking them with
productivity and payment of bonus, even in the absence of any
surplus, have added to the financial burden under which mills are
groaning. Over the last three decades, the wages have gone up in
textile industry of Iran and India both by as much as 200 to 300
percent; though the average productivity increase during the same
period has been marginal and has mostly taken place because of
high speed and better machines. Inspite a plethora of wage
settlements, there have hardly been the settlements linking wages
with productivity. Even the Wage Boards have dealt with the
matter from the point of view of wage rise only. When it come to
wage rise it is the industry or the region that is taken as the base.
202

when it comes to increase efficiency in working it becomes an
individual mills affair.
3. One of the major contributors for the endemic sickness in the
cotton textile industry of Iran and India has been the old and
obsolete machinery. The need, therefore, is to moderanise the
textile machinery both in India and Iran. In the interest of the
consumers and the general economy, proper rehabilitation of the
units with renovation of the machinery should be undertaken.
4. The textile industry of Iran and India is heavily taxed and little is
left as reserves for the industry to stabilize, improve and
modernized - this being a major contributory factory towards its
sickness. The abnormal growth in indirect taxes, also had its
adverse effects on the growth of textile industry of Iran and India.
5. Absenteeism causes loss of production and disruption of
teamwork. In the cotton textile industry of Iran and India when the
workers absent themselves from the work for any reason,
substitutes are employed so as to keep production running. Since
the task required of them is not properly done, it affect both
efficiency and quality.
203

6. Training is one of the neglected areas in tlie textile industry of Iran
and India. The only provision for training at the workers level is
what is known as apprenticeship training scheme. A small
percentage of workers is recruited from the apprentice cadre. Even
this training has not been systematized. The unskilled workers are
promoted as semi-skilled workmen and later to the skilled
category. Today, textile worker learns his work habit as a
substitute, imitating other v/orkers. Several of these work habits are
bad but the worker does not know, why they are bad or what is the
impact of his work on productivity and product quality at his
machine or at the machines in processes that fellow. How much a
worker can improve his job performance, depends on his own
initiative and effort. The interest in managerial and supervisory
training is also lacking. Neither the units have their own training
program, nor they are willing to sponsor their workers for various
courses offered by other institutions and professional bodies. We
found that many units do not consider it necessary or even useful.
Their usual argument is that persons recruited for those positions
are already trained and possess specialized knowledge. It is
204

conveniently forgotten that not only machines and technology but
also men become obsolete over time.
7. The most important feature of the sickness of the textile industry in
Iran and India now exhibiting, is the failure of the existing
marketing system. The imbalance in demand and supply has made
it impossible for the mills or the units in the decentralized sector to
go for the total capacity utilization. This has created a situation
where only the units or mills of two countries will be able to sell
their production in the market which they are trying to cater. This
means that a total well targeted consumer-oriented approach would
be necessary for the management to follow. Any moderization,
diversification or investment proposal without having a pre-
targeted market and effective marketing strategy, would fail to
deliver the goods. The mills which do not have the Market
Information System (MIS) and the consumer orientation, will
always face the risk of order utilization and lower marketability of
products, distress sales, losses and closures.
8. Finance is the life blood of industry and it is also a measuring rod
for success or failure. The various capital formation ratios,
registered by textile mills of Iran and India are insufficient to
205

maintain a steady growth of the industry. A large share of gross
profit is found to fly out of the textile mills in the form of interest
payment obligation. This has been due to heavy borrowing by the
textile mils of the two countries. The textile industry of Iran and
India is unable to plough back profits; thereby reducing the share
of reserve and surplus.
As the financial position, productivity situation, solvency and
profitability and cost position of the two mills under study have been
found similar, the following suggestions can be put forward for
improving the productivity, profitability and financial position of these
mills.
I. The textile industry in Iran and India continue to face crisis on
the raw material front particularly in cotton, in term of high
prices and availability. Their respective governments should
ascertain the supply of raw material and also work to stabilize
the raw material prices. To overcome this problem, more cotton
should be grown and more land should be brought under the
cultivation of cotton crop.
II. There are severe power cuts. The mills are hit by frequent peak
load restrictions, trappings and break downs which dispute the
206

working of the mills, causing unnecessary wastage and loss.
This problem can be solved by sustained efforts on the part of
the respective Governments.
III. The industry needs to be modernized. Modernization does not
only mean replacing old machinery by new machinery but also
includes the reorientation of management and labour to this
process. Attention of management should be focused on
reorientation of workers, redefinition of work loads and work
norms, so that the interest of both, the workers and the industry,
can be furthered.
IV. The interest charge in Iran and India have steadily increased and
are the highest, if compared with most of the countries. If the
industry has to be modernized to help compete in the
international market, then interest structure needs to be scaled
down both for working capital and term bonus. This will
stimulate modernization.
V. One way to improve the productivity of the textile industry
which is also urgently needed, is to increase the per capital
consumption of cloth so that the textile industry can produce
fabrics of different product-mix. This is urgently needed. This
207

will go a long way to develop both the handloom and the power
loom scales. They will harmoniously co-exist and prosper.
Many positive measures have been taken as envisaged in the
Integrated Textile Policy, but much more is needed. Even in
those areas where it has been taken, it has not been adequate
and effective in term of implementation calling for a time bound
action plan. In textile industry, the export potentials are high
despite competitiveness. There are inbuilt advantages on which
the two countries have to encash. There is need for a more
pragmatic approach by the government and a dynamic approach
on the part of textile industry itself which could exploit natural
advantages and utilize its installed capacity at optimum levels
leading to better productivity and quality at reduced cost, so that
both countries could be more competitive in the global market.
208

Bibliography
Books
Agarwal, N.P., 1981, Analysis of financial statements, National
Publishing, House, New Delhi.
Altman, E.I. and Samentz, A.W., 1997, Financial crisis: Institutions and
Markets, John wiley and sons, New York.
Baig, Nafees, 1990, Management Accounting and Control, Ashish
Publishing House, New Delhi.
Bala, Shashi, 1983, Management of Small Scale Industries, Deep and
Deep Publication, New Delhi.
Banerjee B., 1988, Financial Policy and Management Accounting, The
World Press Pvt. Ltd., Calcutta.
Banerje Gautam, 1988, Law and Rehabilitation of Sick Industries, UDH
Publishing House, New Delhi.
Bhatia, B.S. and Batra, G.S., 1994, Management of Sick Industries, Deep
and Deep Publishing, New Delhi.
Bidani, S.N. and Mittra P.K., 1983, Industrial Sickness-Identification and
Rehabilitation, Vision Books Pvt. Ltd., New Delhi.
Biswasroy, Prasanna Kant and et al., 1990, Corporate Sickness and
Institutional Financial in India, Ashish Publishing House,
New Delhi.
209

Chakra Borty, S.K. and Sen, P.K. (Ed.), 1980, Industrial Sickness and
Revival in India, Indian Institute of Management, Calcutta.
Bawar, R., 1986, Institutional Finance to Small Scale Industries, Deep
and Deep Publishing, New Delhi.
Foulke, R.A, 1976, Practical Financial Statement Analysis, Tata McGraw
Hill Publishing Co., New Delhi.
Ahmad, Naseem, 2002, Financial Accounting, Atlantic Publishers and
Distributors, Delhi.
Datta, L.N., 1988, Industrial Sicloiess- A Challenge to Professional
Managers, Gemini Publishers, Calcutta.
Gupta, D.P., 1990, Industrial Sickness and the Role of Reconstruction
Agencies, Chanakya Publishers, New Delhi.
Gupta, L.C., 1983, Financial Ratio for Monitoring Corporate Sickness:
Towards a more Systematic Approach, Oxford University
Press, New Delhi.
Gupta, L.C., 1988, Controlling Corporate Sickness, Oxford University
Press, Bombay.
Gupta, L.C., 1991, Corporate Financial Health: Building Reliable Ratio
Indicators, Manas Publishers, Delhi.
Hanson, A.H., 1962, Management Problems in Public Enterprises, Asia
Publishing House, Bombay.
210

Irving, K, 1969, How to Use Financial Statement, HcGraw Hill Book
Co., New York.
Joshi, V.K., 1987, Management of Industrial Sickness, Kuber Associates
and Publishers, Jaipur.
Juneja, CM., Chawla, R.C. and Saksena, K.K., 1991, Analysis of
Financial Statements, Kalyani Publishers, New Deli.
Khan, N.A., 1990, Sickness in Industrial Units, Anmol Publications, New
Delhi.
Kishore, Parvin M., 2004, Management Accounting and Financial
Analysis, Taxaman Allied Service (P) Ltd. New Delhi.
Kishore, Parvin M., 2004, Cost Accounting and Financial Management,
Taxamann Allied Seivice (P) Ltd. New Delhi.
Kishore, Parvin M., 2004, Cost and Management Accounting, Taxaman
Allied Service (P) Ltd., New Delhi.
Kaveri, V.S., 1983, How to Diagnosis, Prevent and Cure Industrial
Sickness (A practical Approach), Sultan Chand and Sons,
New Delhi.
Kaveri, V.S., 1992, Rehabiliatation of Sick Companies-New Approaches
in Banking for Better Profitability, McMillion Co. of India
Ltd., New Delhi.
Kaveri, V.S. and Bahlerao, Megha, 1991. Sick Industrial Companies Act
- A Critical Approach, Ajanta Publication, Delhi.
211

Khan, Nafees A., 1990, Sickness in Industrial Units, Anmol Publications,
New Delhi.
Khandwalla, Pradip N., 1989, Effective Turnaround of Sick Enterprises:
Text and Causes, Commonwealth Secretariat, London.
Khanka, S.S., 1995, Industrial Sickness in India (Causes, Consequences
and Cures), Commonwealth Publishers, New Delhi.
Kulkami, V.B., 1979, History of the Indian Cotton Textile Industry,
Millowner's Association Bombay.
Lall Nigam, B.M. and Jain, I.C, 2000, Cost Accounting, Asoke K.
Ghosh, New Delhi.
Lai Sudarshan, 1978, How to Prevent Industrial Sickness, Navrang, New
Delhi.
Khan, M.Y. and Jain P.K., 1982, Financial Management, Tata McGraw
Hill Publishing Company Ltd., New Delhi.
Kuchhal, S.C, 1980, Financial Management: An analytical and
Conceptual Approach, Chaitanaya Publishing House,
Allahabad.
Kuchhal, S.C, 1984, Success and Sickness of New Projects, Indian
Institute of Management, Ahmadabad.
Kulkami, P.K., 1985, Financial Management, Himalaya Publishing
House, Bombay.
212

Kumar, Vinod, 1987, Indian Industries, Predicting Success or Failure,
Commonwealth Publishers, New Delhi.
Lewis, R.B. 1959, Financial Analysis for Management, Engle-wood Cliff,
Prentice-Hall.
Mishra, M.K., 1991, Industrial Sickness Role of Entrepreneurs, Anmol
Publications, New Delhi.
Mohsin, M., 1980, Financial Planning and Control. Vikas Publishing
House, Pvt. Ltd. New Delhi.
Murlidham, S., 1993, Handbook of Industrial Sickness, Vidhi Publishing,
New Delhi.
Naik, Haribhan, 1989, Industrial Relations in the Textile Industry, Indian
Journal of Industrial Relation, IJIR, SCR, New Delhi.
Pandey, I.M., 1986, Financial Management, Vikas Publishing House, Pvt.
Ltd., New Delhi.
Panda, R.K. and Meher, R.K., 1992, Industrial Sickness - A Study of
Small Scale Industries, Ashish Publishing House, New
Delhi.
Ranganathan, K., 1988, Industrial Sickness, Suneja Publications, New
Delhi.
Reddy, K.C., (Ed.), 1988, Sickness in Small Scale Industries, Ashish
Publishing House, New Delhi.
213

Sharma, R.K. and Gupta, Shastri, K., 2003, Management Accounting
Principles and Practices, Kalyani Publishers, Delhi-
Ludhiana.
Simha, S.L., 1977, Sickness in Industrial Units: Some Observations,
Institute of Financial Management and Research, Madra S.
Sriva Stava, S.S. and Yadav, R.A., 1986, Management and Monitoring of
Industrial Sickness, Concept Publishing House, New Delhi.
Suhu, P.K. and Mishra, D.P., 1992, The Critical Appraisal of Industrial
Sickness, Kanishka Publishing House, Delhi.
Verma, B.L., 1988, An Analysis of Financial Statements, Arshant
Publishers, Jaipur.
Vishwanthan, S.S., 1974, Essentials of Financial Management, Prentice-
Hall of India Ltd.
214

Articles
Altman, E.J., 1968, "Financial Ratio, Discriminate Analysis and the
Prediction of Corporate Bankruptcy" Journal of Finance,
Vol. XXIII, Sept, pp.589-609.
Barch Lev, 1971, "Financial Failures and Informational Decomposition
Measures". Accounting in Perspective: Contributions to
Accounting Though by other Disciplines, R.R. Sterling and
W.F. Bentz (Sough Western Publishing Company, pp. 102-
111.
Beaver, W.H., 1966, "Financial FLatio as Predictors of failure; Empirical
Research in Accounting Selected Studies, supplement to
Vol.4 Journal of Accounting Research, pp.71-127.
Blum, M. 1974, "Failing Company Discriminate Analysis", Journal of
Accounting Research, Spring, pp. 1-25.
Chatteriee, S. and Roy, S. 1978, "Forecasting Sickness: A Quantitative
Approach", 20" All India Cost Conference, Calcutta,
January.
Deakins, E.B. 1972, "A Discriminate Analysis of Predictors of Failure",
Journal of Accounting Research, Vol.1, No. 10, Spring, pp.
167-179.
Demolena, I.G. and Khoury, S.J., 1980, "Ratio Stability and Corporate
Failure", Journal of Finance, Sept. pp. 1020-71.
215

Desai, V.V. 1980, "Rehabilitation of Sick Units". The Chartered
Accountant, July pp.11-14.
Dutta Ashok, 1980, "Revival of sick Unit", The Chartered Accountant,
April, pp.907-909.
Rajindra, S. 1979, "Causes of Sickness its Prevention and Cure", Journal
of Indian Institute of Management.
Rajit, GR, 1988, "Textile Industry Still in the Deep woods. ICMF
Journal, Feb. p.32.
Sarama, L.V.L.N and Rao, G.B. 1976. "Financial (Ratios as Predictors of
failure: A Multivariate Approach". Indian Manger, Vol.7
(April-June) pp.175-189.
Singh, Anil Pratap, 1987, "Diagnosing and Treating Industrial Sickness",
Journal, July, pp. 1-13.
Sinha, S.L.N. 1979, Sickness in Industrial Units- Some Observation",
Institute for Financial Management and Research, Madras.
Tamari, M. 1966, "Financial Ratios as Measure of Forecasting
Bankruptcy". Management International Review, Vol.4,
pp. 15-21.
Bhave, P.V., 1990, Impact of Overhead Costs on Profitability of Textile
Mills, Indian Cotton Mills Federation (ICMF) Journal, Vol.
XXVI, No.4, February-April.
216

Buch, A.N., 1988, "Crisis in Textile Industry, Indian Cotton Mills
Federation (ICMF) Journal, Vol. XXV, No.l, May.
Dalmia, R.K. 1995, Future Trends in Textile Journal at the Textile
Association (India), Vol.56, No.4. November.
Garde, A.R., The Indian Textile Industry: From Sickness to Health,
Commerce Annual Number, Vol.151, No.3893.
Jahangir, M.S., 1997, Nursing and Rehabilitation of Sick Small Scale
Industries, Monthly Commentary on Indian Economic
Conditions, Vol. XXXVIII, No.8 March, New Delhi.
Sandesara, J.C, 1988, Industrial Sickness in India, Decision Vol.15, No.3
and 4, July-October.
Srinivason, M.S., Industry's 'Sickness' can be Healed, Indian Cotton
Mills Federation (ICMF) Journal Vol. XXVI, No.3. July.
217

Website
1. www.engr.sjsu.edu/pabacker/history/middle.htm
2. www.geocities.com/area5 l/lair/5459/bliautbib.html
3. www.po-net.prato.it/artestoria/s1oria/eng/sintess.htm
4. http://planing commission.nic.in/aboutus/committee/workgb-53.htm
5. www.textile associationindia.com
6. www.iranonline.com/culture/iran-contribution/craftss.html
7. www.themanager.org/models/profit.htm
218
APPENDIXES

Table No. 1 Tabarestan Textile Corporation, (Qaemshahr)
Balance sheet Year ended 31.03.1997
Assets
Current assets
Cash 27,447,185
Trade notes and accounts receivable 5,575,434,059
Other account and notes receivable 2,055,316,799
Inventory
Liabilities and owners equity
Liabilities
Current Liability
Trade accounts and notes payable 9,926,151,791
Other accounts and notes payable 8,478,706,706
26,947,007,013 Tax reserve 81,753,646
Orders and prepaids 1,533,673,777 Total current liabilities 18,486,612,143
Total current assets 36,138,878,833
Uncurrent assets (fixed assets)
Long term liabilities
Employees termination benefits 12,777,391,813
Total long term liabilities 12,777,391,813
Property, plant and equipment
Total Assets
1,346,245,442 Total liabilities 31,264,003,956
Total fixed assets 1,346,245,442
37,485,124,275
Owner's equities
Capital 9,000,000,000
Legal reserve 20,492,881
Accumulated profit (loss) (3,430,983,935)
Other reserves 631,611,373
Total owners equities 6,221,120,319
Total liabilities and owners equities 37,485,124,275
219

Table No. 2 Tabarestan Textile Corporation, (Qaemshahr)
Profit and Loss Statement the year ended 3ko3.|997
Net sales 41,967,508,103
Less cost of goods sold:
Raw material consumed (17,746,773,318)
Direct labour cost in production (18,303,953,233)
Factory overhead (8,626,781,246)
Increase /Decrease in stock (449,688,255)
Total (44,227,822,537)
Gross profit/(loss) (2,260,314,430)
(-) + Operating (expenses) /income:
Administration and general/expenses (1,371,770,659)
Sales and distribution expense (336,721,372)
Non obsorbed expenses (1,639,807,664)
Total operating (expense) (1,708,492,031)
Operating profit/(loss) (3,968,806,461)
(-) + Non operating income/(expenses)
Miscellaneous income 1,918,251,210
Non absorbed expenses (1,639,807,768)
Total non operating (expense)/earning 278,443,442
Earning before interest and taxes = Net (loss) (3,690,363,019)
Beginning balance of accumulated profit and loss 259,379,084
Ending balance of accumulated profi</(loss) (3,430,983,935)
220

Table No. 3 Tabarestan Textile Corporation, (Qaemshahr)
Balance Sheet Year Ended 31.03.1998
Assets
Current assets
Cash 248,390,904
Trade Notes and accounts receivable 3,234,723,038
Other accounts and Notes Receivable 945,404,510
Inventory 19,906,735,793
Orders and prepared 907,186,340
Total current assets 25,242,430,585
Uncurrent assets (fixed assets)
Property, plant and equipment 1,199,915,606
Long term investments 3,600,008
Liabilities and owners equity
Liabilities
Current Liabilities
Trade Accounts and Notes Payable 4,957,335,824
Other accounts and Notes
Payable 23,487,348,940
Tax reserve 2,647,469,649
Total current liabilities 31,092,154,413
Long-term liabilities employees termination benefits 15,305,910,102
Total long term liabilities 15,305,910,102
Total liabilities 46,398,064,515
Owners equities
Capital 9,000,000,000
Accumulated profit (loss) (28,952,118,324)
Total owners equity (19,952,118,324)
Total fixed assets 1,203,515,606
Total Assets Total liabilities and
26,445,946,191 owners equities 26,445,946,191
221

Table No.4 Tabarestan Textile Corporation, (Qaemshahr)
Profit and Loss Statement the year ended 31.03.1998
Net sales
Less, cost of goods sold:
Raw material consumed
Direct labour cost in production
Factory overhead
Increase/(decrease) in stock
Total
Gross Profit/(loss)
(-) + operating (expenses)/income:
Administration and general expenses
Selling and distribution expenses
Total operating expenses
Operating profit/(loss)
(-) + Non-operating income/(expenses):
Miscellaneous income/(expenses)
Unabsorbed expenses
Interest expenses
Total non-operating expenses
Net profit/(loss)
Beginning balance of accumulated profit and
Add, provision written back
Ending balance accumulated profit and loss
36,599,379,768
(16,553,565,260)
(20,291,819,618)
(8,222,098,013)
(7,075,585,280)
(52,143,067,277)
(15,489,970,254)
(1,341,457,317)
(366,578,411)
(1.708,035,728)
(17,198,005,982)
(1,812,572,140)
(3,400,028,665)
(135,192,622)
(loss)
(5,347,793,427)
(22,545,799,409)
(3,430,983,935)
(2,975,334,985)
(28,952,118,324)
222

Table No. 5 Tabarestan Textile Corporation, (Qaemshahr)
Balance Sheet Year ended 31.03.1999
Assets
Current assets
Cash 12,427,287
Trade Notes and accounts receivable 2,931,577,981
Other accounts and Notes receivable 1,596,404,676
Inventory
Orders and prepaid
8,461,718,848
221,777,728
Liabilities and owners' equity
Liabilities
Current Liabilities
Trade Accounts and Notes Payable 5,864,707,421
Other accounts and Notes Payable 20,936,859,005
Tax reserve 2,647,469,649
Total current liabilities 29,449,036,075
Long term liabilities
Employee termination Total current assets 13,223,906,520 benefit 18,400,874,414
Uncurrent assets (fixed assets)
Property, plant and equipment
Long term investments
Total of fixed assets
1,037,666,231
3600000
1,041,266,231
Dept to social security 11,180,768,990
Total long term liabilities 29,581,643,404
Total liabilities 59,030,679,479
Owners' equities:
Capital 9,000,000,000
Accumulated profit (loss) (53,765,507,128)
Total of Assets 14,265,172,751
Total owners' equity
Total liabilities and owners' equities
(44,765.507,128)
14,265,172,751

Table No. 6 Tabarestan Textile Corporation, (Qaemshahr)
Profit and Loss Statement the year ended 31.03.1999
Net sales
Less, cost of goods sold:
Raw material consumed
Direct labour cost in production
Factory overhead
Increase/(decrease) in stock
Total
Gross profit/(loss)
(-) + operating (expenses)/income:
Administration and general expenses
Selling and distribution expenses
Total operating expenses
Operating profit/(loss)
(-) + Non operating income/(expenses):
Miscellaneous Revue
Unabsorbed expenses
Total non-operating expenses
Earning before interest and tax=net profit/(loss)
Beginning balance of accumulated profit and loss
Add, provision written back
Ending balance of accumulated profit and (loss)
18,905,943,274
(4,013,370,098)
(4,991,998,926)
(1,970,227,430)
(12,505,244,929)
(23.480,841,383)
(4,574,898,109)
(675,157,708)
(146.268,500)
(821,226,208)
(5,396,324,317)
17,030,074
(19301.827.802)
(19,284,797,728)
(24,681,122,045)
(28,952,118,324)
(132,266,759)
(53,765,507,128)
224

Table No. 7 Tabarestan Textile Corporation, (Qaemshahr)
Balance Sheet Year Ended 31.03.2000
Assets
Current assets
Cash 16,984,693
Trade Notes and accounts receivable 1,893,263,400
Other accounts and Notes Receivable 1,684,623,697
Inventory 7,996,044,930
Orders and prepaid 54,372,505
Total current assets 11,797,389,225
Liabilities and owners' equity
Liabilities
Current Liabilities
Trade Accounts and Notes Payable 4,357,496,822
Other accounts and Notes Payable 51,478,700,908
Tax reserve 2,647,469,649
Total current liabilities 58,483,667,379
Long term liabilities
Employee termination benefit 26,448,785,658
Uncurrent assets (fixed assets) Total long term liabilities 26,448,785,658
Property, plant and equipment 1,539,584,749
Long term investments 3,600,000
Total fixed assets 1,543,184,949
Total liabilities 84,932,453,032
Owners' equities
Capital 9,000,000,000
Accumulation profit (loss) (80,591,879,063)
Total owners' equity (71,591,879,063)
Total Assets 13,340,573,974 Total of liabilities and owners' equities (13,340,573,974)
225

Table No. 8 Tabarestan Textile Corporation, (Qaemshahr)
Profit and Loss Statement the year ended 3f.o3.2goo
Net sales
Cost of goods sold
Gross Profit (loss)
(-) + financial, administration and general expenses:
Administration and general expenses
Selling and distribution expenses
Total operating expenses
Operating profit/(loss)
(-) + Non operating incoine/(expenses):
Miscellaneous Revue
(1.442.867.522)
Non absorbed expenses
Total non-operating expenses
Earning before interest and tax= Net (loss)
Beginning balance of accumulated profit and (loss)
Add provision written back
Ending balance of accumulated profit and (loss)
133,527,782
(19.316.095.114)
(1,442,867,522)
(1,442,867,522)
(19.182,567,332)
(20,625,437,854)
(53,765,507,128)
(6.200,934,090)
(80,591,879,063)
The factory was non-operative.
226

Table No. 9 Tabarestan Textile Corporation, (Qaemshahr)
Balance Sheet Year Ended 31.03.2001
Assets
Current assets
Cash 117,037,001
Trade Notes and accounts receivable 2,007,835,143
Other accounts and Notes Receivable 1,122,929,863
Inventory 11,925,875,404
Orders and prepaids 175,815,564
Total current assets 15,349,492,975
Uncurrent assets (fixed assets)
Property, plant and equipment 1,641,639,756
Liabilities and owners' equity
Liabilities
Current Liabilities
Trade Accounts and Notes Payable 1,832,648,988
Other accounts and Notes Payable 85,094,054,432
Tax reserve 2,647,469,649
Total current liabilities 89,574,173,069
Long term liabilities
Employee termination Benefits 29,133,777,820
Long term accounts and notes payable 9,883,534,974 • , ^ \ j ^ , ^ ^ • , >
Total long term liabilities 39,017,312,794
Long term investments 3,600,000
Other assets 6,000,000
Total fixed assets 1,651,239,756
Total liabilities 128,591,485,863
Owners' equities
Capital Legal reserve 9,000,000,000
Accumulated profit (loss) (120,590,753,132)
Total Assets 17,000,732,731
Total owners' equity (111,590,753,132)
Total liabilities and owners' equities 17,000,732,731

Table No. 10 Tabarestan Textile Corporation, (Qaemshahr)
Profit and Loss Statement the year ended 31.03.2001
Net sales 60,388,663
Less, cost of goods sold:
Raw material consumed (1,000,256,439)
Direct labour cost in production (12,278,291,462)
Factory overhead (21,477,685,794)
Unattended expenses (32,955,407,503)
Increase/(decrease) in stock 1,668,587,995
Total (132,238,197)
Gross Profit (loss) (71,849,534)
(-) + operating (expenses)/earning:
Administration and general expenses (5,334,475,916)
Selling and distribution expenses (1,778,158,639)
Unattended expenses (32,955,407.503)
Total operating expenses (40,068,042,058)
Operating profit/(loss) (40,139,891,592)
(-) + Non-operating inconie/(expense}!):
Miscellaneous revenue 250,452,849
Total non-operating income/(expenses) 250,452,849
Earning before interest and tax = Net (loss) (39,889,438,743)
Beginning balance of accumulated profit and (loss) (80,591,879,063)
Add, provision written back (109,435,326)
Ending balance of accumulated profit and (loss) (120,590,753,132)
228

Table No. 11 Swadeshi Cotton Mills, (Kanpur)
Balance Sheet Year Ended 31.03.1997
Assets Liabilities and Capital
Current assets
Cash and Bank balance
Loans and advance
Sundry debtors
Other current assets
Total current assets
U^current assets
(Fixed Assets)
Capital work in progress
Gross block
Less: Depreciation
Net block
Total fixed Assets
Total assets
Current Liabilities
1,859,986 Current liabilities 97,526,231
6,855,295 Provisions 36,444,233
2,907,921 Total current liabilities 133,970,464
18,515,271 Long term liabilities
35,304,653 Secured loans 62,547,201
Unsecured loans 378,291,671
Total long term liabilities 440,838,872
55,448 Total liabilities 574,809,336
47,104,905 Capital
20,332,377 Reserved and surplus 73,309
26,772,528 Accumulated profit & loss 512,750,016
26,827,976 Total capital 512,675,707
62,132,629 Total liabilities & Capital 62,133,629
229

Table No. 12 Swadeshi Cotton Mills, (Kanpur)
Profit and Loss statement For the Year Ending 31.03.1997
Net sales and job conversion charge 46,751,506
Less cost of goods sold:
Material consumed (1,722,324)
Direct labor cost in production (33,565,000)
Factory overhead (35,857,430)
Increase /(Decrease) in stock (1,392,446)
Total (72,537,200)
Gross profit/(loss) (25,785,694)
(-)+operating (expenses)/income
Employ cost in administration (5,102,000)
Employ cost in selling and distribution (575,000)
Actual bonus to employee (3,079,000)
Provision for statutory gratuity (12,132,625)
Administration overhead (4,434,271)
Selling and distribution overhead (122,834)
Other employee cost (7,753,430)
Cotton waste sold/transfer 1,096,027
Other prior period and written back 716,403
Miscellaneous income 845,483
230

Total operating (expenses)/income (31,803,970)
Earning before interest & tax (57,589,664)
(-) + Non operating expenses/interest charge (41,642,051)
Net profit/(loss) for the year (99,231,715)
Beginning balance of accumulated profit/(loss) (413,518,301)
Ending balance of accumulated profit/(loss) (512,750,016)
23]

Table No. 13 Swadeshi Cotton Mills, (Kanpur)
Balance Sheet Year Ending 31.03.1998
Assets Liabilities and capital
Current assets Liabilities
Cash and bank balance
Loans and advance
Sundry debtors
Inventories
Other accounts assets
Total current assets
313,569
5,145,305
13,465,524
4,760,894
18,694,608
42,379,900
Current Liabilities
Current liabilities
Provisions
82,750,429
43,064,208
Total current liabilities 125,814,637
Uncurrent assets
(Fixed Assets)
Capital work in progress 55,448
Gross block 47,180,991
Less: Depreciation (23,756,102)
Net block 23,424,889
Total fixed assets 23,480,337
Total Assets 65,860,237
Long-term liabilities
Secured loans 113,243,848
Unsecured loans 450,537,626
Total long-term liabilities 563,781,474
Total liabilities capital 689,596,111
Capital
Reserved and surplus 73,309
Accumulated profit
(loss) (623,809,183)
Total capital (623,735,874)
Total liabilities and
Capital 65,860,237
232

Table No. 14 Swadeshi Cotton Mills, (Kanpur)
Profit and Loss Statement the year ending 31.03.1998
Net sales and job conversion charge
Less, cost of goods sold:
Material consumed
Direct labour cost in production
Factory overhead
Increase/(decrease) in stock
Total
Gross Profit (loss)
(-) + operating (expenses)/income:
Employee cost on administration
Employee cost on selling and distribution
Actual bonus to employee
Provision for statutory gratuity
Administration overhead
Selling and distribution overhead
Transfer of finished goods
Provisions for bad and doubtful debts,
advance, obsolete stores
Other expenses not included in cost
Other income not included in cost
45,172,727
(1,738,602)
(29,326,000)
(36,491,926)
(122,759)
(5,213,000)
(17,031,851)
(3,074,000)
(7,434,924)
(4,852,039)
(2,112)
(43,487)
(896,551)
(3,606)
1580
(67,679,287)
(22,506,560)
233

Miscellaneous income 3,641,293
Total operating income/(expenses) (35,557,691)
Earning before interest and tax /operating profit (loss) (58,064,251)
(-) + non-operating expenses/interest charge (52,994,916)
Net profit/(loss) for the year (111,059,167)
Beginning balance of accumulated profit and (loss) (512,750,016)
Ending balance of accumulated profit and (loss) (623,809,183)
234

Table No. 15 Swadeshi Cotton Mills, (Kanpur)
Balance Sheet Year Ended 31.03.1999
Assets
Current assets
Cash and bank balance
Loans and advance
Sundry debtors
Inventories
Other current assets
510,658
3,059,903
7,634,191
5,735,042
18,960,090
Liabilities and capital
Liabilities
Current liabilities
Current liabilities 100,090,017 Provisions 44,645,162
Total current liabilities 144,735,179
Total current assets 35,899,884
Uncurrent assets (Fixed Assets)
Capital/work in progress 55,448
Gross block 47,192,426
Less: Depreciation (26,881,595)
Net block
Total fixed assets
Total Assets
20,310,831
20,366,279
56,266,163
Long-term liabilities
Secured loans Unsecured loans
Total long-term liabilities
137,318,058 547,491,023
684,809,081
Total liabilities capital Reserved and surplus 73,309
Accumulated profit (loss) (773,351,406)
829,544,260
Total capital
Total liabilities and capital
(773,278,097)
56,266,163
235

Table No. 16 Swadeshi Cotton Mills, (Kanpur)
Profit and Loss Statement the year ending 31.03.1999
Net sales and job conversion charge 10,070,017
Less, cost of goods sold:
Material consumed (5,198,640)
Direct labour cost in production (8,742,000)
Factory overhead (17,513,498)
Increase/(decrease) in stock 1,312,176
Total (30,141,962)
Gross Profit (loss) (20,071,945)
(-) + operating (expenses)/income:
Employee cost on administration (860,000)
Employee cost on selling and distribution (98,000)
Actual bouns to employee (2,910,272)
Employees cost for non-working (36,669,683)
Provision for statutory gratuity (15,969,675)
Other income not included in cost (Provision written back) 260,306
Miscellaneous income 787,070
Other profit period written back 228,173
Selling and distribution overhead (195,512)
Administration overhead (2,422,304)
Other expenses not included in cost (328,285)
236

Other provisions for bad and doubtful debts, advance (3,953,510)
Total operating income/(expenses) (62,131,698)
Earning before interest and tax /operating profit/(loss) (82,203,643)
(-) + non-operating expenses/interest charge (67,338,580)
Net profit/(loss) for the year (149,542,223)
Beginning balance of accumulated profit/(loss) (623,809,183)
Ending balance of accumulated profil/(loss) (773,351,406)
237

Table No. 17 Swadeshi Cotton Mills, (Kanpur)
Balance Sheet the year ended 31.03.2000
Assets
Current assets
Cash and bank balance 1,707,882
Loans and advance 2,144,360
Sundry debtors 4,628,499
Inventories 3,301,945
Other accounts assets 18,430,647
Total current assets 30,222,333
Uncurrent assets (Fixed Assets)
Capital/work in progress 55,448
Gross block 47,221,199
Liabilities and capital
Liabilities
Current liabilities
Current liabilities Provisions
106,839,947 38,335,950
Total current liabilities 145,175,897
Long-term liabilities
Secured loans Unsecured loans
Total long-term liabilities
165,915,591 698,139,871
864,055,460
Less: Depreciation (29,952,637)
Net block 17,268,562
1,009,231,359
73,309
Accumulated profit/ (loss) (961,758,325)
Total liabilities Capital Reserved and surplus
Total fixed assets 17,324,010 Total capital (961.685,016)
Total Assets 47,546,343 Total liabilities and capital 47,546,343
238

Table No. 18 Swadeshi Cotton Mills, (Kanpur)
Profit and Loss Statement the year ending 31.03.2000
Net sales and job conversion charge
Less, cost of goods sold:
Material consumed (1,140,648)
Direct labor cost in production (8,368,000)
Factory overhead (18,643,658)
Increase/(decrease) in stock (12,103,983)
Total
Gross Profit (loss)
(-) + operating (expenses)/income:
Employee cost on administration (743,000)
Employee cost on selling and distribution (90,000)
Other employee cost (37,095,613)
Actual bounce to employee (2,518,566)
Provision for statutory gratuity (44,627,614)
Administration to overhead (5,632,352)
Selling and distribution overhead (69,739)
Other provisions, bad doubtful debts, obsolete stores (31,136)
Other expenses not included in cost (Prior period expense) (2,105,965)
Other income not included in cost (provision return back) 6,531,755
Total operating inconie/(expenses)
18,057,616
(30,256,287)
(12,198,671)
(86,382,230)
239

Earning before interest and tax /operating profit/(loss) (98,580,901)
(-) + non-operating expenses/interest charge (89,826,018)
Net profit/(Ioss) for the year (188,406,919)
Beginning balance of accumulated profit/(loss) (773,351,406)
Ending balance of accumulated profit/(loss) (961,758,325)
240

Table No. 19 Swadeshi Cotton Mills, (Kanpur)
Balance Sheet Year Ended 31.03. 2001
Assets
Current assets
Cash and bank balance 585,000
Loans and advance 1,864,195
Sundry debtors 2,064,276
Inventories 3,239,117
Other current assets 18,179,376
Total current assets 26,031,964
Uncurrent assets (Fixed Assets)
Capital/work in progress 55,448
Gross block 47,263,463
Less: Depreciation (32,659,583)
Net block
Total fixed assets
Total Assets
14,603,880
14,659,328
40,591,292
Liabilities and capital
Liabilities
Current liabilities
Current liabilities Provisions
112,918,756 36,459,657
Total current liabilities 149,378,413
Long-term liabilities
Secured loans Unsecured loans
200,164,626 825,987,960
Total long-term liabilities 1,026,152,586
Total liabilities capital 1,175,530,999 Capital
Reserved and surplus 73,309
Accumulation profit/ (loss) (1,135,013,016)
Total capital
Total capital «& liabilities
(1,134,939,707)
40,591,292
241

Table No. 20 Swadeshi Cotton Mills, (Kanpur)
Profit and Loss Statement the year ending 31.03.2001
Net sales and job conversion charge
Less, cost of goods sold:
Material consumed
Direct labor cost in production
Factory overhead
Increase/(decrease) in stock
Total
33,341,197
(3,018,679)
(21,147,000)
(27,990,320)
(6,873)
Gross Profit (loss)
(-) + operating (expenses)/income:
Employee cost on administration (2,805,000)
Employee cost on selling and distribution (334,000)
Employee cost for non-working (24,253,052)
Administration overhead (3,525,155)
Other overhead (1,840,662)
Selling and distribution overhead (183,057)
Actual bonus to employees other than included bonus (2,435,559)
Other provisions, bad doubtful debts, absolute stores (15,721)
Provision for statutory gratuity (9,959,776)
Other income not included in cost (provision return back) 1,889,314
Total operating income/(expenses)
(52,162,878)
(18,821,681)
(42,287,293)
242

Earning before interest and tax /operating profit (loss) (64,108,974)
(-) + non-operating expenses/interest charge (112,145,717)
Net profit/(loss) for the year (173,254,691)
Beginning balance of accumulated profit and (loss) (961,758,325)
Ending balance of accumulated profit and (loss) (1,135,013,016)
243

Table No. 21 The Calculation of Ratios, Return on Shareholder Investment and
Earning Per Share of Tabarestan Textile Corporation, (Qaemshahr) 1997
^ p ^ , p , . -2,260,314,534 ^,.. .„, Gross Profit Ratio = x 100 = - 5 %
41,967,508,103
Operating Ratio = ^ ^ ^ ^ ^ ^ ^ ^ ^ x 100 = 4.5% 41,967,508,103
Operating Profit Ratio - -^.968,806,565^^^^ ^ _^^^^^ 41,967,508,103
278 443 442 Non-operating Ratio = x 100 = 0.7%
41,967,508,103
Net Profit Ratio = "3.690,363,019^^^^^ ^ _^^„^^ 41,967,508,103
Return on Shareholders Investment
^ -3,690,363,019
9,000,000,000 + 20,492,881 + 613,611,373-3,430,983,935
Return on Equity Capital = z l ! ^ ^ ^ ! : ^ ^ x 100 = -41% 9,000,000,000
p . p . . -3,690,363,019 .._ Earning Per Share = = -410
9,000,000 T. ^ . . , T. • 41,967,508,103-36,050,726,551 ,^^ , , „ , Profit Volume Ratio = -^ x 100 = 14%)
41,967,508,103 Margin of Safety = 41,967,508,103 -85,536,307,430=-43,568,799,327
-43 568 799 ^97 Margin of Safety Ratio = ' ' '—xlOQ = -103%
41,967,508,103
_, _ . 36,138,878,833 . ^ . Current Ratio = = 1.95
18,486,612,143
X100 = -59%
J , I \J^^^\J A ^^L
^ . , „ . 36,138,878,833-26,947,007,013 , , Quick Ratio = = 0.5
18,486,612,143
244

Table No. 22 The Calculation of Ratios, Return on Shareholder Investment and
Earning Per Share of Tabarestan Textile Corporation, (Qaemshahr) 1998
^ ^ „ . -15,489,970,254 ,^^ ,^„, Cross Profit Ratio = x 100 = -42%
36,599,379,768
. „ . 1,708,035,728 ,^^ ,„, Operating Ratio = ~ x 100 = 5%
36,599,379,768
• T. r- T. • -17,198,005,982 ,^^ ,^„, Operating Profit Ratio = — x 100 = 47%
36,599,379,768 • T. • -5,347,793,427 ,^^ , , ^„,
Non-operating Ratio = — x 100 = -14.6% 36,599,379,768
-22 545 799 409 Net Profit Ratio = ' ' ' xlOO = 61.6%
36,599,379,768
-22,545,799,409 Return on Shareholders Investment = x 100 = -113%
9.000,000,000 - 28,952,118,324 -22 545 799 409
Return on Equity Capital = ' ' ' xlOO = -250% 9,000,000,000
-22 545,799,409 Earning Per Share = '- -2505
9,000,000
Profit Volume Ratio*
Margin of Safety*
Margin of Safety Ratio
„ . 25,242,430,585 ^„ Current Ratio = -^ = 0.8
31,092,154,413 Quick Ratio = 25.242,430.585-19.906.735.793 ^ „ , ,
31,092,154,413
' Since, the amount of Variable Cost was more than the Sales in the year 1998 and 2001, we can't calculate the Break Even Point. Therefore, it is not possible to calculate the Profit Volume Ratio, Margin of Safety and Margin of safety Ratio.
245

Table No. 23 The Calculation of Ratios, Return on Shareholder Investment and
Earning Per Share of Tabarestan Textile Corporation, (Qaemshahr) 1999
- 4 574 898109 Cross Profit Ratio = ' ' ' xlOO = -24%
18,905,943,274
. ^ . 821,226,208 ,^^ , , , Operating Ratio = x 100 = 4%
18,905,943,274
Operating Profit Ratio = -^^^96,324,317^^^^ ^ _^^^^^ 18,905,943,274
• r. • -19,284,797,728 ,^^ ,^^„, Non-operating Ratio = x 100 = -102%
18,905,943,274 XT T. ^ T. • -24,681,122,045 , , ,^ , , ^ „ , Net Profit Ratio = x 100 = -130%
18,905,943,274 o, , , j T -24,681,122,045 ,^^ ^^„,
Return on Shareholders Investment = xlOO = -55% 9.000,000,000-53,765,507,128
r. • ^ • , -24,681,122,045 ,^^ ^^,„, Return on Equity Capital = — x 100 = -274%
9,000,000,000 V • ^u -24,681,122,045 „_.„ Earning per Share == = -2742
9,000,000 T. ^ . . , T. • 18,905,943,274-9,005,369,024 ,^^ ^^„, Profit Volume Ratio - - ^ x 100 = 52%
18,905,943,274 Margin of Safety = 18,905,943,274 - 42,487,079,690 - - 23,581,136,416
w • ^a r r. • 18,905,943,274-42,487,079,690 ,^^ ,^^„, Margin of Safety Ratio = — xlOO = -125%
18,905,943,274 „ . 13,223,906,520 , , ,
Current Ratio = -^ = 0.45 29,449,036,075
R , , , , , 13.223.906.520-8.461.71JJ48 ^ „ ,^
29,449,036,075
246

Table No. 24 The Calculation of Ratios, Return on Shareholder Investment and
Earning Per Share of Tabarestan Textile Corporation, (Qaemshahr) 2000
Cross Profit Ratio*
Operating Ratio*
Operating Profit Ratio*
Non-operating Ratio*
Net Profit Ratio*
n, , , j T -20,625,434,854 ,^^ ^^„, Return on Shareholders Investment = xlOO = -29%
9,000,000,000 - 80,591,879,063
D . T7 -t r > 1 -20,625,434,854 . . . . _ , . Return on Equity Capital = x 100 = -229%
9,000,000,000
„ . ^, -20,625,434,854 Earning per Share = = -2291
9,000,000
Profit Volume Ratio*
Margin of Safety *
Margin of Safety Ratio
Current Ratio = — '- '- 0.2 58,483,667,379
Quiek Ratio = n.797.389.225-7.996.044j30 ^ ^^^ 58,483,667,379
In the year 2000, the Tabarestan Textile Corporation was non-operative.
247

Table No. 25 The Calculation of Ratios, Return on Shareholder Investment and
Earning Per Share of Tabarestan Textile Corporation, (Qaemshahr) 2001
-71849 534 Cross Profit Ratio = ' ' xlOO = -119%
60,388,663
_ . ^ . 40,068,042,058 ,^,. , , . . _ „ , Operating Ratio = x 100 = 66350%
60,388,663 -40139 891592
Operating Profit Ratio = ' ' ' —xlOO = -66,469% 60,388,663
• T. • 250,452,849 ,,,^ , ,^„ , Non-operating Ratio = x 100 = 415%)
60,388,663 .T T. ^ T. • -39,889,438,743 , , ,^ ^ ^ ^ c . n . Net Profit Ratio = x 100 - -66054%
60,388,663 cu u ,j T -39,889,438,743 ,^^ .^,,
Return on Shareholders Investment x 100 = -36%) 9,000,000,000 -120,590,753,132
r • r. • , -39,889,438,743 ,^^ , ,^„ , Return on Equity Capital x 100 = -443%
9,000,000,000 ^ . ^, --39,889,438,743 , , „ Earning per Share = = -4432
9,000,000
Profit Volume Ratio*
Margin of Safety*
Margin of Safety Ratio
^ . 15,349,492,975 , , ^ Current Ratio = — = 0.17
89,574,173,069
R,,i„ , 15.349.492.975-11,925.875,404 ^ ^ ^^
89,574,173,069
Since, the amount of Variable Cost was more than the Sales in the year 1998 and 2001, we can't calculate the Break Even Point. Therefore, it is not possible to calculate the Profit Volume Ratio, Margin of Safety and Margin of safety Ratio.
248

Table No. 26 The Calculation of Ratios, Return on Shareholder Investment and
Earning Per Share of the Swadeshi Cotton Mills, (Kanpur) 1997
Gross Profit Ratio = 25,785,674 ^ ^ ^ ^ _^^„^^ 46,751,504
11 80' 970 Operating Ratio = — ~ x 100 - 68%
46,751,504
Operating Profit Ratio = ~^^'^^^'^^^xlQO = -123% 46,751,504
Non-operating Ratio = ^ i ^ ^ ^ ^ ^ x 100 = 89% 46,751,504
-99 231715 Net Profit Ratio = ^ x 100 = -212%
46,751,504
-99,231,715 Return on Shareholder investment ==—'— xlOO = -19%)
(512,675,707)
-99 231 715 Return on Equity Capital = — x 100 = -135,360%
73,309
T. r- . . , T. • 46,751,506-35,287,324 ,^^ ^,„, Profit Volume Ratio = — x 100 = 25%)
46,751,506
Margin of Safety = 46,751,506- 447,869,456 = - 401,117,950
w • f c f t p . - 33,341,197-447,869,456 ^ . . _ _ , „ . Margin of Safety Ratio = xlOO = 1203%)
33,341,197 „ . 35,304,643 , , ,
Current Ratio = — = 0.26 133,970,464
^ . , „ . 35,304,643-5,166,180 , , , Quick Ratio = -^ — - — = 0.22
133,970,464
249

Table No. 27 The Calculation of Ratios, Return on Shareholder Investment and Earning Per Share of the Swadeshi Cotton Mills, (Kanpur) 1998
Gross Profit Ratio =—^^'^^^'—x ] 00 = -50% 45,172,727
Operating Ratio = ^^^^^^^xlOO = 79% 45,172,727
Operating Profit Ratio = "^^'^^"^'^^^ x 100 = -129% 45,172,727
52 994 916 Non-operating Rafio = — x 100 = 117%
45,172,727
Net Profit Ratio -~^^^'^^^'^^^ xlOO = -246% 46,751,504
Return on Shareholder investment = '- '- x 100 = -18% (623,735,874)
Return on Equity Capital = l l i l i ^ ^ — x 100 = -151,495% 73,309
P ^ -. , p . 45,172,727-31,064,602 .__ . . „ , Profit Volume Ratio ^ xlOO = 31%
45,172,727
Margin of Safety = 45,172,727-409,983,122 =-364,819,395
45 172 727-409 983122 Margin of Safety Rafio = ' ' ^ '^^'^^-"'^^^xlOO = -807%
45,172,727
„ . 42,379,900 „ , , Current Ratio = — = 0.34
725,814,637
_ . . ^ . 42,379,900-4,760,894 _ . Quick Ratio = = 0.3
125,814,637
250

Table No. 28 The Calculation of Ratios, Return on Shareholder Investment and
Earning Per Share of the Swadeshi Cotton Mills, (Kanpur) 1999
-20 071945 Gross Profit Ratio = ' ' x 100 = -199%
10,070,017
Operating Ratio = ^^'^^^'^^^ x 100 = 617% 10,070,017
— 89 O" fS41 Operating Profit Ratio = ' ' x 100 - -816%
10,070,017
•vT • T • 67,338,580 ,„ - ^^,^n, Non-operating Ratio = — x 100 = 669%
10,070,017
-149 542 223 Net Profit Ratio - '^^'"^^^'^-xlOO - -1485%
10,070,017
— 149 542 223 Return on Shareholder investment = '- '- x 100 - -19%)
(773,278,097)
-149 542 223 Return on Equity Capital = ' ' —xlOO = -203,989%
(773,278,097)
Profit Volume Ratio*
Margin of Safety*
Margin of Safety Ratio*
„ . 35,899,884 ^ , , Current Ratio = — = 0.25
144,735,179
^ . , ^ . 35,899,844-5,735,042 ^^ , Quick Ratio = ^ '- = 0.21
144,735,179
Since, the amount of Variable Cost was more than the Sales in the year 1999, we can't calculate the Break Even Point. Therefore, it is not possible to calculate the Profit Volume Ratio, Margin of Safety and Margin of safety Ratio.
251
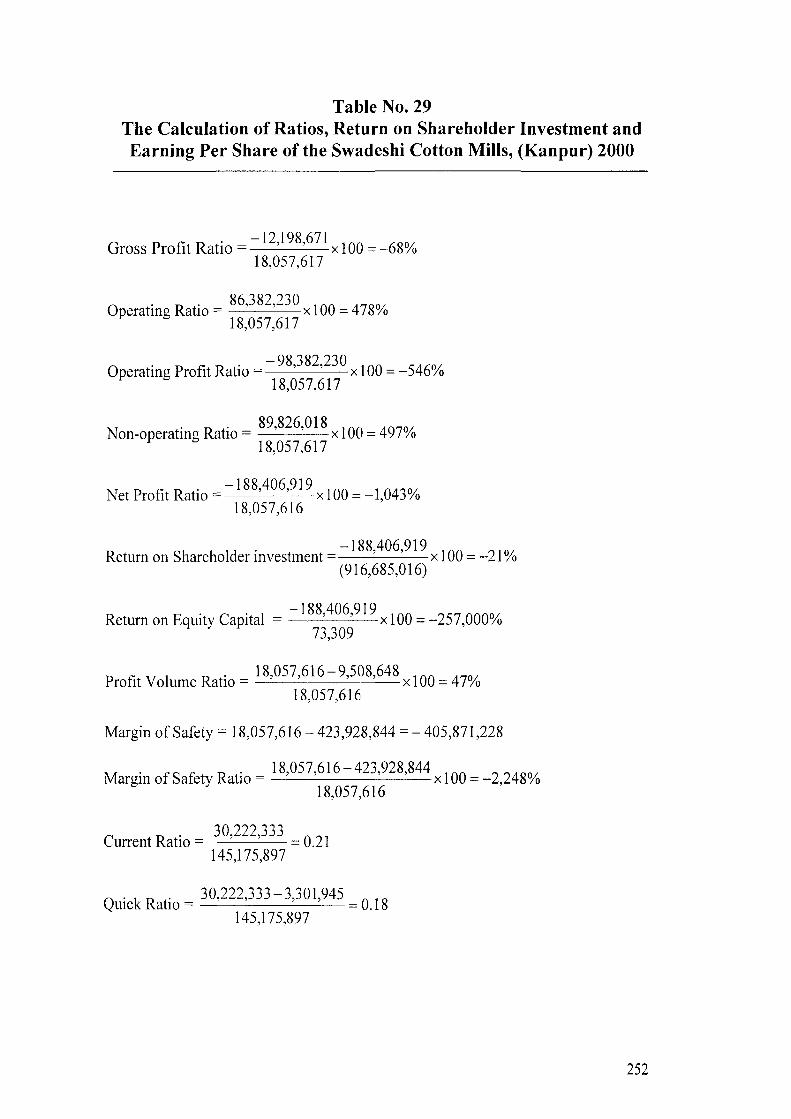
Table No. 29 The Calculation of Ratios, Return on Shareholder Investment and Earning Per Share of the Swadeshi Cotton Mills, (Kanpur) 2000
Gross Profit Ratio =^^i l^MZix 10() = -68% 18,057,617
Operating Ratio = ^^,382,230^^^^ ^ ^ „ ^ 18,057,617
_ Q 0 TOO OTA
Operating Profit Ratio = ' ' xlQO = -546% 18,057,617
Non-operating Ratio = ^ M ^ ^ ^ x 100 = 497% 18,057,617
Net Profit Ratio = l ^ M ^ ^ i ^ x 100 = -1,043% 18,057,616
o, , ,j • -188,406,919 ,^^ ^,„, Return on Shareholder investment = x 100 = -21 vo
(916,685,016)
Return on Equity Capital = ^ l l^M^l^x lOO = -257,000% 73,309
T. ^ . . , T. • 18,057,616-9,508,648 ,^^ ,^„, Profit Volume Ratio = — x 100 = 47%
18,057,616
Margin of Safety =18,057,616-423,928,844 = -405,871,228
A • ^o^.u.- 18,057,616-423,928,844 ,__ . ^,^„, Margin of Safety Ratio = — x 100 = -2,248%
18,057,616 ^ . 30,222,333 ^ , ,
Current Ratio = — = 0.21 145,175,897
„ . . _ . 30,222,333-3,301,945 _ ._ Quick Ratio = = 0.18
145,175,897
252

Table No. 30 The Calculation of Ratios, Return on Shareholder Investment and Earning Per Share of the Swadeshi Cotton Mills, (Kanpur) 2001
— 1 R 891 6R1 Gross Profit Ratio = '^ ' xlOO = -56%
33,341,197
42 287 293 Operating Ratio = - ' xl00 = 127%
33,341,197
-64108 974 Operating Profit Ratio = ' ' x 100 = -192%
33,341,197
• T. • 112,147,717 , , ^„ , Non-operating Ratio = = 337%)
33,341,197
-173 254 691 Net Profit Ratio = — ' ' xlOQ = -520%
33,341,197
-173 254 691 Return on Shareholder investment = '- ' xlOO = -15%)
(1,134,939,707)
-173 254 691 Return on Equity Capital = ^—x 100 = -236,334%
73,309
33 341197-24165 679 Profit Volume Ratio - ' ' ^2!J-g^2^xlOO = 27%
33,341,197
Margin of Safety = 33,341,197 - 662,097,182 = - 628,755,985
A • ^c r n .• 33,341,197-662,097,182 ,^^ , „„ ,„ , Margin of Safety Ratio = -^— ' x 100 = -1,886%
33,341,197 ^^ . 26,031,964 ^ , ^
Current Ratio = — = 0.17 149,378,413
„ . , ^ . 26,031,964,3,239,117 ^^^ Quick Ratio = — - — — •— = 0.15
149,378,413
253