shrm survey findings: shrm/ebri 2014 health benefits survey november 19, 2014
TRANSCRIPT

SHRM Survey Findings: SHRM/EBRI 2014 Health Benefits Survey
November 19, 2014
SHRM/EBRI Health Benefits Survey ©SHRM 2014 2
Key Findings
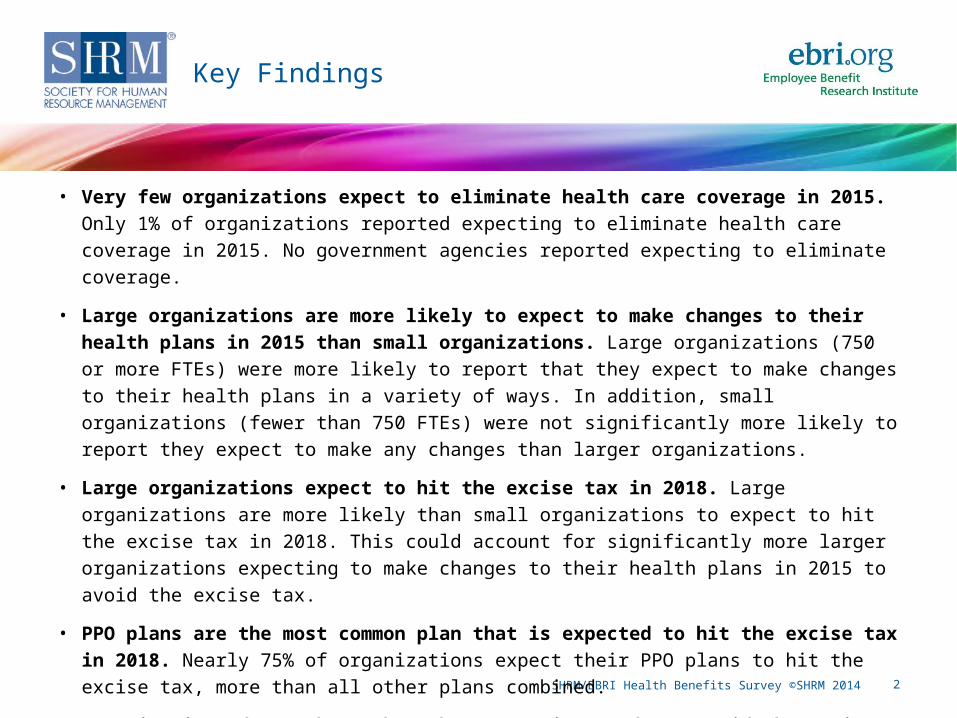
• Very few organizations expect to eliminate health care coverage in 2015. Only 1% of organizations reported expecting to eliminate health care coverage in 2015. No government agencies reported expecting to eliminate coverage.
• Large organizations are more likely to expect to make changes to their health plans in 2015 than small organizations. Large organizations (750 or more FTEs) were more likely to report that they expect to make changes to their health plans in a variety of ways. In addition, small organizations (fewer than 750 FTEs) were not significantly more likely to report they expect to make any changes than larger organizations.
• Large organizations expect to hit the excise tax in 2018. Large organizations are more likely than small organizations to expect to hit the excise tax in 2018. This could account for significantly more larger organizations expecting to make changes to their health plans in 2015 to avoid the excise tax.
• PPO plans are the most common plan that is expected to hit the excise tax in 2018. Nearly 75% of organizations expect their PPO plans to hit the excise tax, more than all other plans combined.
• Organizations do not know what they are going to do to avoid the excise tax. Nearly 30% of organizations do not know what they will do to avoid the excise tax in 2018.

SHRM/EBRI Health Benefits Survey ©SHRM 2014 3
• Despite employers’ continued uncertainty surrounding health care reform and its related costs, most organizations are not considering eliminating coverage for their employees at this time. Only 1% of HR professionals who responded to this survey said their organization would eliminate coverage in 2015.
• Other research has shown that health care benefits are an extremely valuable recruiting tool, and HR professionals often cite these benefits when hiring new workers or retaining existing employees. Given the competitive nature of finding top talent at the moment, health care benefits should be viewed as an important element of staffing management.
• Many HR professionals are already looking ahead to 2018, when an employer tax on high-cost health plans will go into effect. This excise tax of 40% will apply to certain individual and family thresholds on health plans and will prompt HR professionals to re-examine their health care offerings as a means of cutting costs. Although many of the respondents to this survey (30%) said they still don’t know what actions they would take to avoid the excise tax, very few (3.5%) said they would eliminate health care coverage as a result.
What Do These Findings Mean for the HR Profession?
SHRM/EBRI Health Benefits Survey ©SHRM 2014 4
SHRM/EBRI 2014 Health Benefits Survey

SHRM/EBRI Health Benefits Survey ©SHRM 2014 5
Do You Plan to Make Any of the Following Changes to Your Health Care Plans in 2015?
Note: n = 2,295
Adopt reference pricing
Eliminate coverage
Eliminate coverage for part-time workers
Provide an employee subsidy for coverage on the private exchange
Adopt a value-based insurance design
Move to private exchange
Create tiered networks
Institute spousal surcharge
Require spouses to get coverage through own employer
Add wellness rewards or penalties
0.0% 10.0% 20.0% 30.0%
0.6%
1.0%
1.3%
2.6%
2.6%
3.2%
3.6%
6.7%
7.9%
26.3%

SHRM/EBRI Health Benefits Survey ©SHRM 2014 6
Do You Plan to Make Any of the Following Changes to Your Health Care Plans in 2015? (by staff size)
Note: n = 2,271
Move to private exchange
Create tiered networks
Institute spousal surcharge
Require spouses to get coverage through own employer
Add wellness rewards or penalties
0.0%
5.0%
10.0
%
15.0
%
20.0
%
25.0
%
30.0
%
35.0
%
40.0
%
3.2%
3.6%
6.7%
7.9%
26.3%
3.1%
3.2%
5.9%
7.7%
24.1%
3.8%
5.5%
10.1%
9.4%
34.6%
750 or more FTEs Fewer than 750 FTEs Total

SHRM/EBRI Health Benefits Survey ©SHRM 2014 7
Do You Plan to Make Any of the Following Changes to Your Health Care Plans in 2015? (by staff size, continued)
Note: n = 2,135
Adopt reference pricing
Eliminate coverage
Eliminate coverage for part-time workers
Provide an employee subsidy for coverage on the private exchange
Adopt a value-based insurance design
0.0% 1.0% 2.0% 3.0% 4.0% 5.0% 6.0% 7.0%
0.6%
1.0%
1.3%
2.6%
2.6%
0.5%
1.1%
1.0%
2.7%
1.7%
1.4%
1.0%
2.4%
2.4%
5.8%
750 or more FTEs Fewer than 750 FTEs Total

SHRM/EBRI Health Benefits Survey ©SHRM 2014 8
Do You Plan to Make Any of The Following Changes to Your Health Care Plans in 2015? (by staff size)
Note: Only statistically significant differences are shown.
Comparisons by organization staff size
750 or more FTEs > Fewer than 750 FTEs
Comparisons by organization staff size
• Organizations with 750 or more FTEs are more likely than organizations with fewer than 750 FTEs to make the following changes to health care plans in 2015:• Institute spousal surcharge.• Eliminate coverage for part-time workers.• Adopt a value-based insurance design (VBID).• Adopt reference pricing.• Create tiered networks.• Add wellness rewards or penalties.
SHRM/EBRI Health Benefits Survey ©SHRM 2014 9
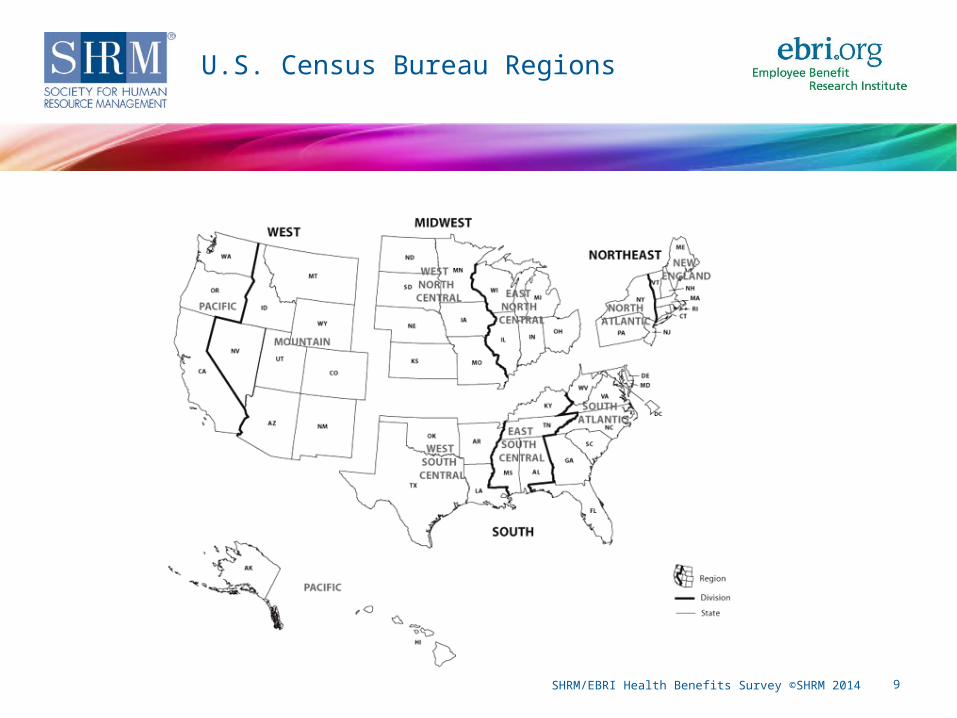
U.S. Census Bureau Regions

SHRM/EBRI Health Benefits Survey ©SHRM 2014 10
Do You Plan to Make Any of the Following Changes to Your Health Care Plans in 2015? (by region)
Note: n = 2,264
Move to private exchange
Create tiered networks
Institute spousal surcharge
Require spouses to get coverage through own employer
Add wellness rewards or penalties
0.0%
5.0%
10.0
%
15.0
%
20.0
%
25.0
%
30.0
%
35.0
%
3.2%
3.6%
6.7%
7.9%
26.3%
3.9%
5.1%
7.3%
7.8%
28.7%
4.2%
3.7%
6.8%
8.0%
27.9%
2.6%
2.4%
8.1%
10.9%
25.9%
1.6%
4.0%
4.4%
3.3%
20.7%
West Midwest South Northeast Total

SHRM/EBRI Health Benefits Survey ©SHRM 2014 11
Do You Plan to Make Any of the Following Changes to Your Health Care Plans in 2015? (by region, continued)
Note: n = 2,279
Adopt reference pricing
Eliminate coverage
Eliminate coverage for part-time workers
Provide an employee subsidy for coverage on the private exchange
Adopt a value-based insurance design
0.0% 1.0% 2.0% 3.0% 4.0% 5.0% 6.0%
0.6%
1.0%
1.3%
2.6%
2.6%
0.5%
1.0%
0.7%
5.1%
3.6%
0.7%
1.0%
0.9%
1.8%
3.0%
0.5%
1.6%
1.5%
2.8%
2.6%
0.7%
0.2%
2.1%
1.2%
1.2%
West Midwest South Northeast Total

SHRM/EBRI Health Benefits Survey ©SHRM 2014 12
Do You Plan to Make Any of the Following Changes to Your Health Care Plans in 2015? (by region)
Note: Only statistically significant differences are shown.
Comparisons by region
SouthMidwest
> West
Comparisons by region
• Organizations in the South and Midwest are more likely than organizations in the West to require spouses to get health care coverage through their own employer.
• Organizations in the Northeast are more likely than organizations in the South and West to provide an employee subsidy for coverage on the private exchange.
Comparisons by organization staff size
Northeast >SouthWest

SHRM/EBRI Health Benefits Survey ©SHRM 2014 13
Do You Plan to Make Any of the Following Changes to Your Health Care Plans in 2015? (by region)
Note: Only statistically significant differences are shown.
Comparisons by region
South > West
Comparisons by region
• Organizations in the South are more likely than organizations in the West to add wellness rewards or penalties.
SHRM/EBRI Health Benefits Survey ©SHRM 2014 14
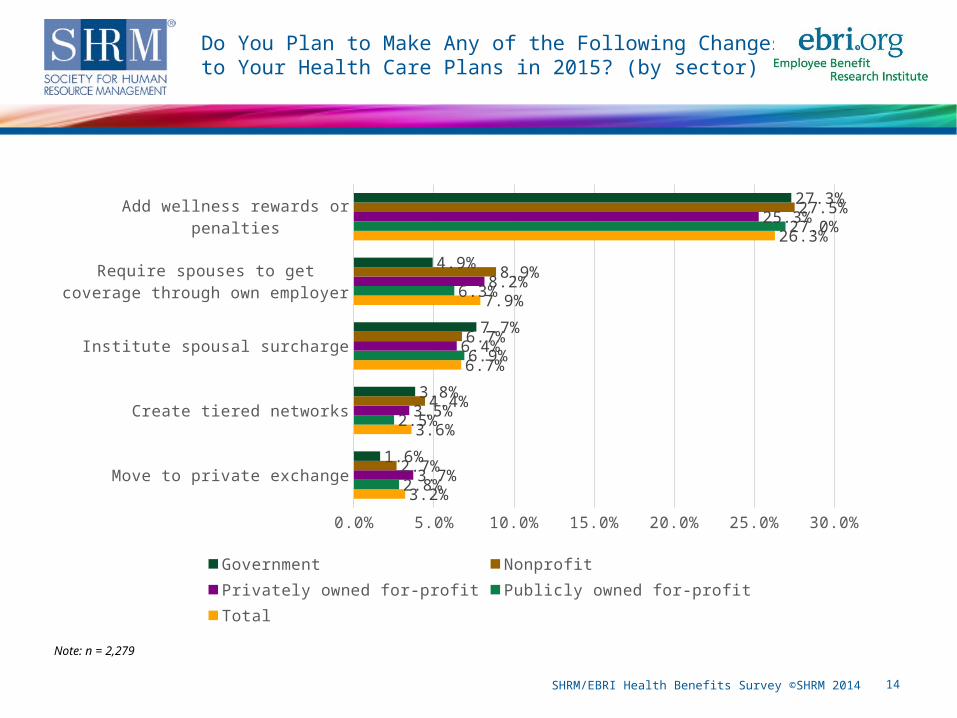
Do You Plan to Make Any of the Following Changes to Your Health Care Plans in 2015? (by sector)
Note: n = 2,279
Move to private exchange
Create tiered networks
Institute spousal surcharge
Require spouses to get coverage through own employer
Add wellness rewards or penalties
0.0% 5.0% 10.0% 15.0% 20.0% 25.0% 30.0%
3.2%
3.6%
6.7%
7.9%
26.3%
2.8%
2.5%
6.9%
6.3%
27.0%
3.7%
3.5%
6.4%
8.2%
25.3%
2.7%
4.4%
6.7%
8.9%
27.5%
1.6%
3.8%
7.7%
4.9%
27.3%
Government Nonprofit Privately owned for-profitPublicly owned for-profit Total

SHRM/EBRI Health Benefits Survey ©SHRM 2014 15
Do You Plan to Make Any of The Following Changes to Your Health Care Plans in 2015? (by sector, continued)
Note: n = 2,279
Adopt reference pricing
Eliminate coverage
Eliminate coverage for part-time workers
Provide an employee subsidy for coverage on the private exchange
Adopt a value-based insurance design
0.0% 0.5% 1.0% 1.5% 2.0% 2.5% 3.0% 3.5% 4.0%
0.6%
1.0%
1.3%
2.6%
2.6%
0.6%
0.9%
1.3%
0.9%
3.8%
0.6%
1.2%
1.2%
3.1%
2.4%
0.4%
1.1%
1.4%
2.5%
2.5%
1.6%
0.0%
0.5%
1.6%
2.7%
Government Nonprofit Privately owned for-profitPublicly owned for-profit Total

SHRM/EBRI Health Benefits Survey ©SHRM 2014 16
Do You Plan to Make Any of The Following Changes to Your Health Care Plans in 2015? (by business activity)
Note: n = 2,264
Move to private exchange
Create tiered networks
Institute spousal surcharge
Require spouses to get coverage through own employer
Add wellness rewards or penalties
0.0%
5.0%
10.0
%
15.0
%
20.0
%
25.0
%
30.0
%
35.0
%
3.2%
3.6%
6.7%
7.9%
26.3%
2.7%
3.2%
5.9%
6.9%
19.7%
2.8%
2.8%
8.7%
9.0%
29.2%
3.3%
4.0%
6.1%
7.6%
26.1%
Services Manufacturing Consulting Total

SHRM/EBRI Health Benefits Survey ©SHRM 2014 17
Do You Plan to Make Any of the Following Changes to Your Health Care Plans in 2015? (by business activity, continued)
Note: n = 2,264
Adopt reference pricing
Eliminate coverage
Eliminate coverage for part-time workers
Provide an employee subsidy for coverage on the private exchange
Adopt a value-based insurance design
0.0% 0.5% 1.0% 1.5% 2.0% 2.5% 3.0% 3.5% 4.0% 4.5%
0.6%
1.0%
1.3%
2.6%
2.6%
0.5%
2.1%
1.6%
4.3%
2.1%
1.0%
1.0%
1.0%
2.6%
2.5%
0.4%
0.8%
1.4%
2.3%
2.8%
Services Manufacturing Consulting Total

SHRM/EBRI Health Benefits Survey ©SHRM 2014 18
Do You Plan to Make Any of the Following Changes to Your Health Care Plans in 2015? (by business activity)
Note: Only statistically significant differences are shown.
Comparison by business activity
Manufacturing > Consulting
Comparison by business activity
• Manufacturing organizations are more likely than consulting organizations to add wellness rewards or penalties.

SHRM/EBRI Health Benefits Survey ©SHRM 2014 19
Do You Expect Your Organization to Hit the Excise Tax in 2018?
Note: n = 1,803
85%
15%
No Yes

SHRM/EBRI Health Benefits Survey ©SHRM 2014 20
Do You Expect Your Organization to Hit the Excise Tax in 2018? (by staff size)
Note: n = 1,713
Total
Fewer than 750 FTEs
750 or more FTEs
0.0% 20.0% 40.0% 60.0% 80.0% 100.0% 120.0%
15.0%
13.2%
23.9%
85.0%
86.8%
76.1%
Yes No

SHRM/EBRI Health Benefits Survey ©SHRM 2014 21
Do You Expect Your Organization to Hit the Excise Tax in 2018? (by staff size)
Note: Only statistically significant differences are shown.
Comparison by organization staff size
750 or more FTEs > Fewer than 750 FTEs
Comparison by organization staff size
• Organizations with 750 or more FTEs are more likely than organizations with fewer than 750 FTEs to expect to hit the excise tax in 2018.

SHRM/EBRI Health Benefits Survey ©SHRM 2014 22
Do You Expect Your Organization to Hit the Excise Tax in 2018? (by region)
Note: n = 1,791
Total
Northeast
South
Midwest
West
0.0% 20.0% 40.0% 60.0% 80.0% 100.0% 120.0%
15.0%
18.8%
13.9%
13.7%
14.5%
85.0%
81.2%
86.1%
86.3%
85.5%
Yes No

SHRM/EBRI Health Benefits Survey ©SHRM 2014 23
Do You Expect Your Organization to Hit the Excise Tax in 2018? (by sector)
Note: n = 1,791
Total
Publicly owned for-profit
Privately owned for-profit
Nonprofit
Government
0.0% 20.0% 40.0% 60.0% 80.0% 100.0% 120.0%
15.0%
18.7%
12.9%
13.1%
27.5%
85.0%
81.3%
87.1%
86.9%
72.5%
Yes No

SHRM/EBRI Health Benefits Survey ©SHRM 2014 24
Do You Expect Your Organization to Hit the Excise Tax in 2018? (by sector)
Note: Only statistically significant differences are shown.
Comparison by sector
Government >Privately owned for-profit
Nonprofit
Comparison by sector
• Government agencies are more likely than privately owned for-profit or nonprofit organizations to expect to hit the excise tax in 2018.

SHRM/EBRI Health Benefits Survey ©SHRM 2014 25
Do You Expect Your Organization to Hit the Excise Tax in 2018? (by business activity)
Note: n = 1,776
Total
Consulting
Manufacturing
Services
0.0% 20.0% 40.0% 60.0% 80.0% 100.0% 120.0%
15.0%
10.4%
14.2%
15.7%
85.0%
89.6%
85.8%
84.3%
Yes No

SHRM/EBRI Health Benefits Survey ©SHRM 2014 26
Which Plan(s) Do You Expect to Hit the Excise Tax?
Note: n = 249
Other
Indemnity (fee for service)
Exclusive provider organization (EPO)
Consumer-driven health plan
Point of service (POS)
Health maintenance organization (HMO)
Preferred provider organization (PPO)
0.0% 10.0% 20.0% 30.0% 40.0% 50.0% 60.0% 70.0% 80.0%
1.6%
1.2%
4.8%
7.6%
17.3%
18.5%
74.3%

SHRM/EBRI Health Benefits Survey ©SHRM 2014 27
Which Plan(s) Do You Expect to Hit the Excise Tax? (by staff size)
Note: n = 239
Other
Indemnity (fee for service)
Exclusive provider organization (EPO)
Consumer-driven health plan
Point of service (POS)
Health maintenance organization (HMO)
Preferred provider organization (PPO)
0.0% 10.0%20.0%30.0%40.0%50.0%60.0%70.0%80.0%90.0%
1.6%
1.2%
4.8%
7.6%
17.3%
18.5%
74.3%
1.8%
1.2%
3.6%
7.7%
19.5%
19.5%
72.2%
1.4%
1.4%
7.1%
7.1%
11.4%
17.1%
80.0%
750 or more FTEs Fewer than 750 FTEs Total

SHRM/EBRI Health Benefits Survey ©SHRM 2014 28
Which Plan(s) Do You Expect to Hit the Excise Tax? (by region)
Note: n = 246
Other
Indemnity (fee for service)
Exclusive provider organization (EPO)
Consumer-driven health plan
Point of service (POS)
Health maintenance organization (HMO)
Preferred provider organization (PPO)
0.0% 10.0%20.0%30.0%40.0%50.0%60.0%70.0%80.0%90.0%1.6%
1.2%
4.8%
7.6%
17.3%
18.5%
74.3%
5.6%
1.9%
11.1%
3.7%
31.5%
18.5%
63.0%
1.2%
2.3%
2.3%
11.6%
17.4%
15.1%
73.3%
0.0%
0.0%
3.2%
9.5%
11.1%
11.1%
81.0%
0.0%
0.0%
4.7%
0.0%
9.3%
34.9%
83.7%
West Midwest South Northeast Total

SHRM/EBRI Health Benefits Survey ©SHRM 2014 29
Which Plan(s) Do You Expect to Hit the Excise Tax? (by region)
Note: Only statistically significant differences are shown.
Comparisons by region
West >South
Midwest
Comparisons by region
• Organizations in the West are more likely than organizations in the South or Midwest to expect HMO plans to hit the excise tax.
• Organizations in the Northeast are more likely than organizations in the Midwest and West to expect POS plans to hit the excise tax.
Comparisons by organization staff size
Northeast >Midwest
West

SHRM/EBRI Health Benefits Survey ©SHRM 2014 30
Which Plan(s) Do You Expect to Hit the Excise Tax? (by sector)
Note: n = 246
Other
Indemnity (fee for service)
Exclusive provider organization (EPO)
Consumer-driven health plan
Point of service (POS)
Health maintenance organization (HMO)
Preferred provider organization (PPO)
0.0% 10.0%20.0%30.0%40.0%50.0%60.0%70.0%80.0%90.0%1.6%
1.2%
4.8%
7.6%
17.3%
18.5%
74.3%
2.8%
2.8%
2.8%
13.9%
8.3%
5.6%
80.6%
0.9%
0.9%
7.8%
7.0%
18.3%
15.7%
75.7%
5.1%
5.1%
15.4%
35.9%
74.4%
1.8%
3.6%
5.4%
23.2%
21.4%
67.9%
Government Nonprofit Privately owned for-profitPublicly owned for-profit Total

SHRM/EBRI Health Benefits Survey ©SHRM 2014 31
Which Plan(s) Do You Expect to Hit the Excise Tax? (by sector)
Note: Only statistically significant differences are shown.
Comparison by sector
Government >Privately owned for-profitPublicly owned for-profit
Comparison by sector
• Government agencies are more likely than privately owned for-profit or publicly owned for-profit organizations to expect HMO plans to hit the excise tax.
SHRM/EBRI Health Benefits Survey ©SHRM 2014 32
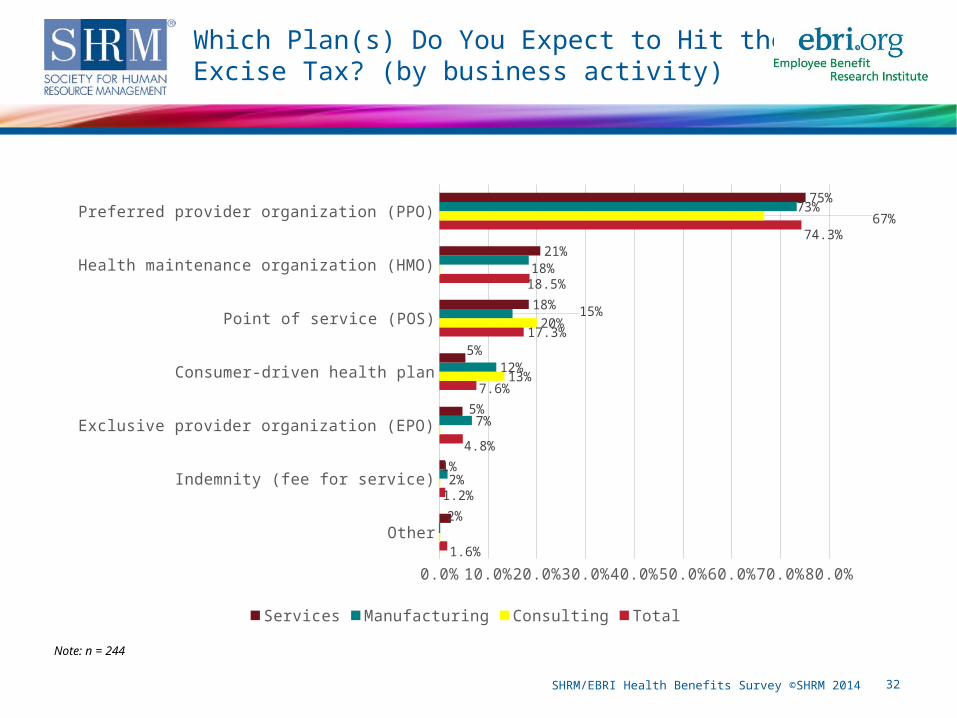
Which Plan(s) Do You Expect to Hit the Excise Tax? (by business activity)
Note: n = 244
Other
Indemnity (fee for service)
Exclusive provider organization (EPO)
Consumer-driven health plan
Point of service (POS)
Health maintenance organization (HMO)
Preferred provider organization (PPO)
0.0% 10.0% 20.0% 30.0% 40.0% 50.0% 60.0% 70.0% 80.0%1.6%
1.2%
4.8%
7.6%
17.3%
18.5%
74.3%
2%
1%
5%
5%
18%
21%
75%
2%
7%
12%
15%
18%
73%
13%
20%
67%
Services Manufacturing Consulting Total

SHRM/EBRI Health Benefits Survey ©SHRM 2014 33
What Actions, if Any, Will You Take to Avoid the Excise Tax?
Note: n = 170
Do no
t kno
w
Chang
e plan
s
Reduc
e co
vera
ge
Incr
ease
em
ploy
ee con
tribu
tion
High-
dedu
ctible h
ealth
plan
Nothing
Elim
inat
e plan
Priva
te e
xcha
nges
Follo
w bro
ker a
dvice
Other
0.0%
5.0%
10.0%
15.0%
20.0%
25.0%
30.0%
35.0%
29.4%
16.5%
10.6% 9.4%
4.7% 4.7% 3.5% 3.5% 2.4%
15.3%

SHRM/EBRI Health Benefits Survey ©SHRM 2014 34
Demographics
35
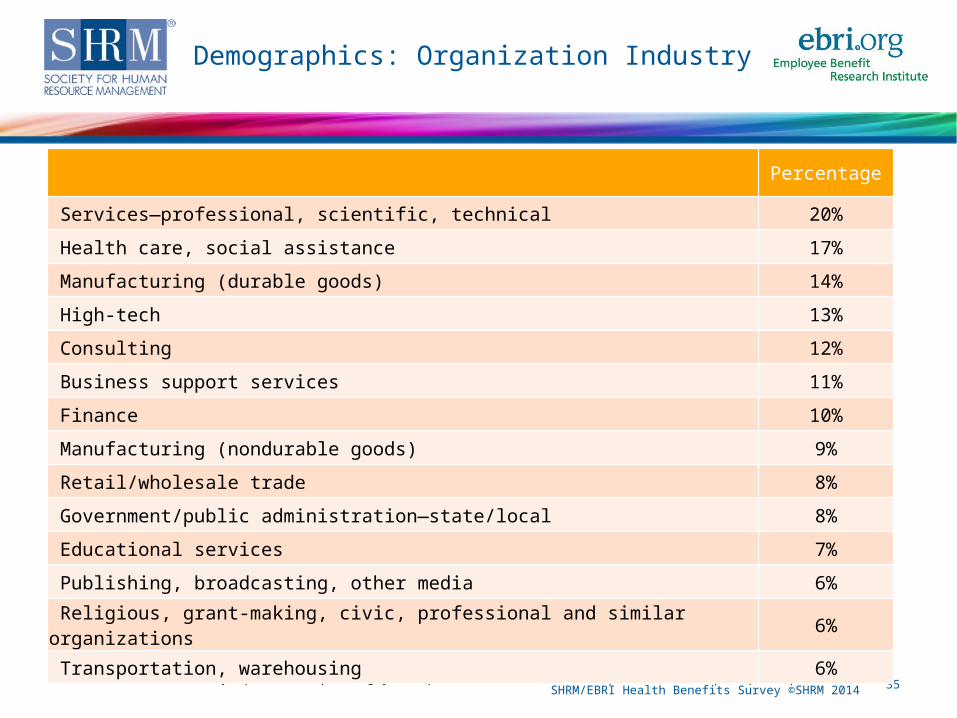
Demographics: Organization Industry
Note: n = 3,329. Total number of respondents and percentage for this question exceeded the overall sample size due to multiple response options.
Percentage
Services—professional, scientific, technical 20%
Health care, social assistance 17%
Manufacturing (durable goods) 14%
High-tech 13%
Consulting 12%
Business support services 11%
Finance 10%
Manufacturing (nondurable goods) 9%
Retail/wholesale trade 8%
Government/public administration—state/local 8%
Educational services 7%
Publishing, broadcasting, other media 6%
Religious, grant-making, civic, professional and similar organizations 6%
Transportation, warehousing 6%
SHRM/EBRI Health Benefits Survey ©SHRM 2014

36
Demographics: Organization Industry (continued)
Note: n = 3,329. Total number of respondents and percentage for this question exceeded the overall sample size due to multiple response options.
Percentage
Construction, mining, oil and gas 4%
Insurance 4%
Services—accommodation, food and drinking places 4%
Arts, entertainment, recreation 3%
Utilities 3%
Telecommunications 3%
Real estate, rental, leasing 3%
Repair and maintenance 3%
Association—professional/trade 1%
Biotech 1%
Pharmaceutical 1%
Waste management and remediation services 1%
Government/public administration—federal 1%
SHRM/EBRI Health Benefits Survey ©SHRM 2014

SHRM/EBRI Health Benefits Survey ©SHRM 2014 37
Demographics: Organization Sector
Note: n = 3,302. Percentages do not equal 100% due to rounding.
Privately owned for profit
Nonprofit
Publicly owned for-profit
Government
53%
23%
16%
9%

SHRM/EBRI Health Benefits Survey ©SHRM 2014 38
Demographics: Organization Staff Size
Note: n = 3,031. Percentages do not equal 100% due to rounding.
1 to 99 employees
100 to 499 employees
500 to 2,499 employees
2,500 to 24,999
25,000 or more employees
37%
38%
17%
8%
1%

SHRM/EBRI Health Benefits Survey ©SHRM 2014 39
Demographics: Region
Note: n = 3,289.
South
Midwest
West
Northeast
38%
26%
18%
18%

SHRM/EBRI Health Benefits Survey ©SHRM 2014 40
Demographics: Business Activity
Note: n = 3,277.
Services
Manufacturing
Consulting
65%
26%
9%

SHRM/EBRI Health Benefits Survey ©SHRM 2014 41
Demographics: Organizational Level
Note: n = 3,190.
76%, Corporate (companywide)
24%, Business unit/work location

42
Survey Methodology
• Response rate = 14%• 3,329 HR professionals from a randomly selected sample of SHRM’s membership• Margin of error +/- 5%• Survey fielded February 4 to April 7, 2014
SHRM/EBRI Health Benefits Survey ©SHRM 2014

43
For more survey/poll findings, visit shrm.org/surveys
For more information about SHRM’s Customized Research Services, visit shrm.org/customizedresearch
Follow us on Twitter @SHRM_Research
About SHRM Research
Project leader:Andrew Mariotti, senior researcher, SHRM Research
Project contributors:Steven Hyde, research coordinator, SHRM ResearchJoseph Coombs, senior analyst, SHRM Research
Copy editor:Katya Scanlan, SHRM Knowledge Center
SHRM/EBRI Health Benefits Survey ©SHRM 2014

SHRM/EBRI Health Benefits Survey ©SHRM 2014 44
SHRM
Founded in 1948, the Society for Human Resource Management (SHRM) is the world’s largest HR membership organization devoted to human resource management. Representing more than 275,000 members in over 160 countries, the Society is the leading provider of resources to serve the needs of HR professionals and advance the professional practice of human resource management. SHRM has more than 575 affiliated chapters within the United States and subsidiary offices in China, India and United Arab Emirates. Visit us at shrm.org.
EBRI
The Employee Benefit Research Institute is a private, nonpartisan, nonprofit research institute based in Washington, DC, that focuses on health, savings, retirement, and economic security issues. EBRI does not lobby and does not take policy positions. The work of EBRI is made possible by funding from its members and sponsors, which include a broad range of public, private, for-profit and nonprofit organizations. For more information go to www.ebri.org or www.asec.org
About SHRM and EBRI