short-term variability of cerebral blood flow velocity responses to arterial blood pressure...
TRANSCRIPT
PII: S0301-5629(02)00698-1
● Original Contribution
SHORT-TERM VARIABILITY OF CEREBRAL BLOOD FLOW VELOCITYRESPONSES TO ARTERIAL BLOOD PRESSURE TRANSIENTS
RONNEY B. PANERAI,* BRIAN J. CAREY† and JOHN F. POTTER
†
*Division of Medical Physics, University of Leicester, Leicester Royal Infirmary, Leicester, UK; and†Division ofMedicine for the Elderly, University of Leicester, Glenfield Hospital, Leicester, UK
(Received 26 June 2002; in final form 11 September 2002)
Abstract—The time course of mean beat-to-beat changes in cerebral blood flow velocity changes induced byspontaneous transients in mean arterial blood pressure was studied in a group of 39 healthy subjects, ages 40�15 (SD) years. Continuous 10-min noninvasive recordings of cerebral blood flow velocity (CBFV) from bothmiddle cerebral arteries (MCA) with Doppler ultrasound (US) and simultaneous beat-to-beat arterial bloodpressure (ABP) were made. A total of 522 spontaneous positive transients of ABP and CBFV were extracted witha maximum of 15 transients for each subject. The CBFV transient amplitude was normalized by the corre-sponding ABP change and the area-under-the-curve (AUC) of the falling phase was used to classify the CBFVregulatory response as either weak, moderate or strong. The coherent average of ABP and CBFV of eachcategory confirmed the consistency of this classification, reinforced by the agreement of separate averages forrecordings from the right and left MCA. All 39 subjects showed at least two categories of transients, with all threecategories present in 33 subjects (right MCA) and 29 subjects (left MCA), respectively. These results indicate asignificant short-term variability of CBFV responses in healthy subjects whose origin remains unexplained.(E-mail: [email protected]) © 2003 World Federation for Ultrasound in Medicine & Biology.
Key Words: Cerebral blood flow, Physiologic variability, Doppler ultrasound, Cerebral autoregulation, Coherentaverage.
INTRODUCTION
The excellent temporal resolution afforded by Dopplerultrasound (US) has led to significant progress in recentyears in our understanding of the dynamic regulation ofcerebral blood flow in humans. Following previous ob-servations in animals, Aaslid et al (1989) have shown inhumans that a disturbance in mean cerebral blood flowvelocity (CBFV), provoked by a sudden change in meanarterial blood pressure (ABP), is corrected within a fewseconds by an adaptive mechanism that was termed“dynamic autoregulation.” Other approaches to gain in-sight into the dynamic behaviour of CBFV recordingsinclude cognitive stimulation (Stroobant and Vinger-hoets 2001), autonomic tests (Panerai et al. 2001), visualstimulation (Rosengarten et al. 2001) and transient hy-peraemic responses induced by brief occlusion of thecarotid artery (Smielewsky et al. 1995).
The regulation of cerebral blood flow has beenshown to be affected in a number of important clinicalconditions, such as prematurity, birth asphyxia, stroke,head injury, carotid artery disease, hypertension and va-sovagal syncope. The utilisation of Doppler US, in con-junction with analytical methods suitable for dynamicanalysis, has great potential to allow noninvasive assess-ment of dynamic autoregulation in routine clinical prac-tice (Panerai 1998). For this purpose, one particularlyappealing approach is the analyis of CBFV variabilityduring spontaneous fluctuations in mean ABP. Previousinvestigations have demonstrated that spontaneous fluc-tuations in mean ABP have sufficient power to allowmeaningful characterisation of the dynamic ABP-CBFVrelationship by frequency-domain analysis (Giller 1990;Blaber et al. 1997; Panerai 1998; Zhang et al. 1998a),coherent averaging (Panerai et al. 1995) or time-domainsystem identification methods (Panerai et al. 1999a;Simpson et al. 2001). With these methods, a singleestimate of dynamic autoregulatory performance is ob-tained from continuous recordings lasting 5 min orlonger. A future refinement can be envisaged, though,
Address correspondence to: Ronney B. Panerai, PhD., Depart-ment of Medical Physics, University of Leicester, Leicester RoyalInfirmary, Leicester LE1 5WW UK. E-mail: [email protected]
Ultrasound in Med. & Biol., Vol. 29, No. 1, pp. 31–38, 2003Copyright © 2003 World Federation for Ultrasound in Medicine & Biology
Printed in the USA. All rights reserved0301-5629/03/$–see front matter
31
whereby real-time characterisation of the dynamic ABP-CBFV relationship is performed for continuous bedsidemonitoring of cerebral autoregulation. In a preliminarystudy (Verma et al. 2000) we observed that empiricalindices extracted from mean CBFV transient responsesshowed considerable variability. These observationsprompted us to embark on a more detailed study of theshort-term variability of the ABP-CBFV dynamic rela-tionship described in this article.
METHODS
Subjects and measurementsA total of 42 healthy subjects, as assessed by his-
tory, physical examination, full neurologic assessment,12-lead ECG and standard autonomic function tests wererecruited from a register database and departmental staff.Written consent was given by each subject and ethicalcommittee approval was obtained before the study.
Subjects avoided caffeine-containing products, nic-otine and alcohol for at least 12 h before the study. Theywore loose comfortable clothing and attended in themorning between 9:00 and 11:00 a minimum of 2 h aftera light breakfast. Measurements were performed in aquiet dimly lit room at constant ambient temperature(23°C), with subjects lying supine on a couch with theirheads supported by two pillows and their right armsupported at atrial height. After lying supine for 10 min,three semiautomated ABP readings were taken 1 minapart (Omron 711, Matsusaka, Japan). The mean of thelast two readings, providing pressures differed by lessthan 10 mmHg, was taken as the baseline casual ABPmeasurement. A surface three-lead ECG was fitted andABP was measured continuously and noninvasivelyfrom the middle finger of the right hand using a servo-controlled plethysmograph (Finapres 2300, Ohmeda,Englewood), which has been extensively used in previ-ous studies of dynamic autoregulation (Blaber et al.1997; Panerai et al. 1999a; Zhang et al. 1998a). A trans-cutaneous gas monitor (TINA, Radiometer, Copenhagen,Denmark) was attached to the chest wall to record PCO2.CBFV was measured by insonating the middle cerebralartery (MCA) bilaterally using 2-MHz transcranialDoppler US (SciMed QVL 842X, Bristol, UK). BothDoppler probes were held in place using a custom-designed adjustable head frame and the velocity wave-form spectra were visually displayed to aid positioning.The ABP, dual-channel CBFV Doppler shift audio/ve-locity signals, transcutaneous CO2 and ECG were con-tinuously recorded on digital tape for subsequent analy-sis (Sony PC 108 M). After the subjects had restedsupine for a minimum of 30 min and the Finapres andCO2 traces had stabilized (�10% variation over 5 min),recording was started. Subjects were asked to lie still and
to refrain from talking during the recordings. An ABPcalibration signal was recorded, the servo-adjust mecha-nism of the Finapres was switched off and a baselinerecording of 10 min was then made with the subjectslying quietly. Data were downloaded in real-time onto adedicated personal computer. The Doppler audio signalwas converted at 20 or 40 kHz, depending of the velocityrange selected. An FFT was used to convert the Dopplersignals into maximum frequency velocity envelopes witha 5-ms window resolution. The ABP, transcutaneousCO2 and ECG signals were sampled at 200 samples/s perchannel.
Data analysisData were visually inspected, the ABP trace was
calibrated and artefactual data spikes on the CBFV sig-nals were removed by linear interpolation. The five sig-nals were low-pass filtered with a zero-phase eighthorder Butterworth digital filter with a cut-off frequencyof 20 Hz. Each cardiac cycle was automatically markedto determine the R-R interval from the ECG tracing, andthe mean ABP, mean CBFV and mean transcutaneousCO2 were calculated for each cycle. Spline interpolationwas used to resample the data at 5 Hz to create a uniformtime base.
Spontaneous positive ABP transients were automat-ically detected and visually inspected to make sure that 1.there were no artefacts on either the ABP or CBFVsignals, 2. the pressure/velocity change was greater than2% of the baseline mean ABP/CBFV (Panerai et al.1995), 3. there was a simultaneous change in CBFVduring the upstroke phase of the transient in both chan-nels, 4. the ABP transient had a duration greater than 8 s,and 5. the minimum time interval between transients was20 s. A maximum of 15 transients satisfying these con-ditions were extracted for each subject, in decreasingorder of relative ABP amplitude change.
The pattern of the CBFV response to the initialdisturbance provoked by the ABP transient was charac-terised by an area-under-the-curve (AUC) parameter ex-pressing the strength of dynamic autoregulation. Previ-ous observations in adults and neonates (Panerai et al.1995; Panerai et al. 2001) have shown that, with im-paired autoregulation, CBFV shows a similar time courseto the ABP transient. However, when autoregulation isintact, CBFV returns to its baseline value before the ABPtransient is over, similarly to what is observed during athigh cuff manoeuvre (Aaslid et al. (1989)). To quantifythe AUC during the period of time when the autoregu-latory response is more pronounced, the CBFV signalwas re-scaled to the same units of ABP according to:
V��t� �V�t� � Vp
Vp � Vf�Pp � Pf� � Pp (1)
32 Ultrasound in Medicine and Biology Volume 29, Number 1, 2003
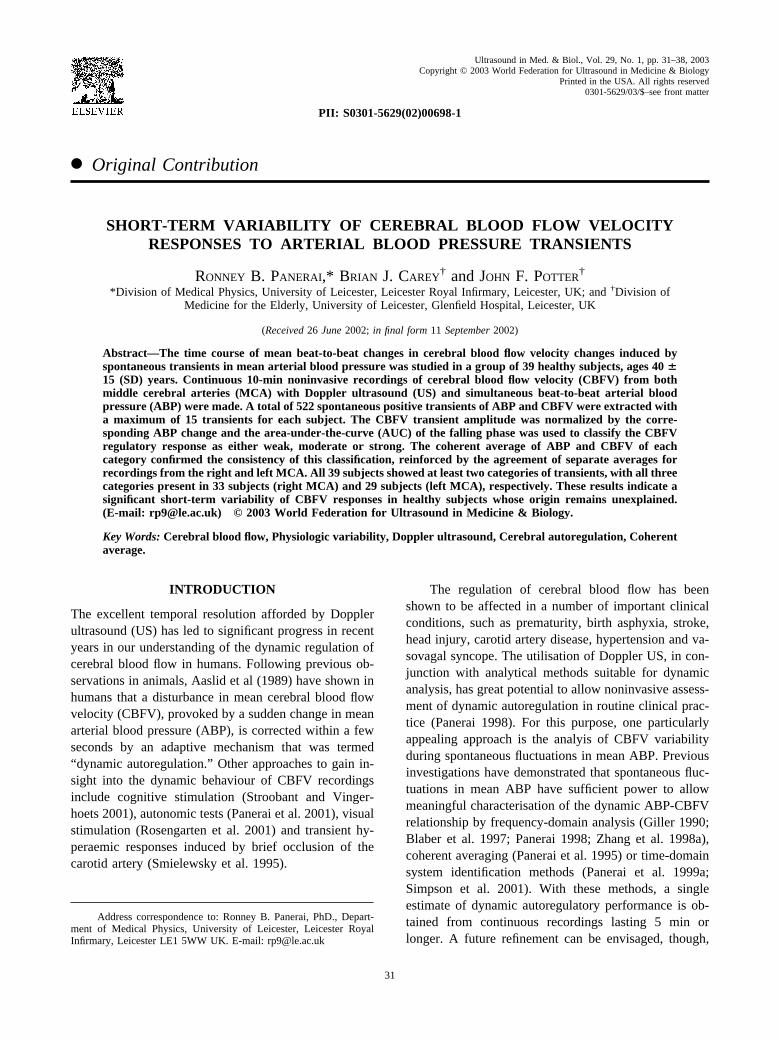
where V(t) is the original CBFV signal (in cm.s�1) andV�(t) is the normalized signal. Subscripts p and f repre-sent the peak and foot points of the ABP and CBFVtransients as illustrated in Fig. 1. The AUC parameter(Fig. 1) is normalized in relation to the area of the ABPtransient and expressed as percentage:
AUC � 100
�t�2
7
�P�t� � V��t��
�t�f
7
�P�t� � Pf�
(2)
where P(t) represents the ABP signal, and the integrationlimits from 2 s to 7 s after the peak derivative of P(t)(Fig. 1) were chosen based on our previous experiencewith the analysis of spontaneous ABP and CBFV tran-sients (Panerai et al. 2001). If autoregulation is weak, theCBFV transient will tend to follow the ABP change and
AUC will tend toward zero. On the other extreme, ifthere is a strong autoregulatory response, CBFV willreturn to its baseline value shortly after the ABP upstrokeand AUC will tend toward higher values. Arbitrary val-ues of AUC were used to classify each CBFV transientresponse as weak (AUC � 0%), moderate (0% � AUC� 50%), or strong (AUC � 50%). Coherent averages ofCBFV and ABP were calculated for each category oftransient using the maximum rate of rise of ABP as thepoint of synchronism.
Statistical analysisThe relative distribution of weak, moderate, and
strong autoregulatory responses was calculated for eachsubject and the mean SD was estimated for the wholepopulation. One-way ANOVA with Scheffe’s test forpost hoc analysis was adopted to test for the effects ofselected parameters on the classification of autoregula-tory responses. Parameters selected were the ABP at thefoot and peak of each transient, the absolute and relativeABP change (peak-foot), and baseline values of ABP,CBFV and transcutaneous CO2. Baseline values werecalculated during the 30-s period preceding the transient.p � 0.05 was considered significant.
RESULTS
A total of 39 subjects (18 men), 40 15 (SD) yearsof age (range 20 to 72 years) were studied. Three sub-jects were excluded from the analysis because it was notpossible to record the CBFV signal from the left MCA.Clinical systolic and diastolic pressures were 124 13mmHg (range 102 to 153) and 76 9 mmHg (range 61to 89), respectively.
A total of 522 ABP transients satisfied the condi-tions specified previously. The minimum number of tran-sients for any subject was 8; 16 subjects had the maxi-mum allowed number of 15 transients. The pressurechange in relation to the transient foot was 7.5 4.4mmHg (10.5 5.9%), with an absolute peak pressure of86.3 13.0 mmHg. The corresponding peak velocitiesfor the right and left MCA were 61.5 13.4 cm.s�1 and64.2 15.6 cm.s�1, respectively.
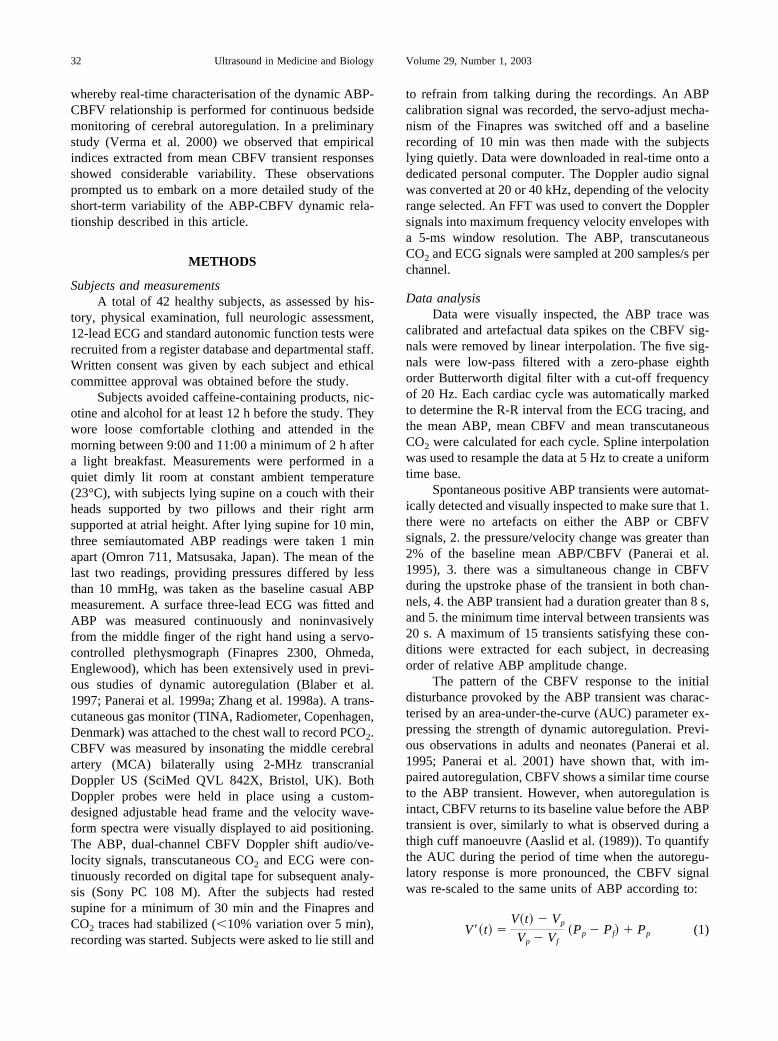
Figure 2 depicts the distribution of AUC valuesestimated for the right and left MCA, indicating abroadly similar pattern. For the right MCA, 60 transientswere classified as weak, 239 as moderate and 223 asstrong. The corresponding values for the left MCA were55, 240 and 227, respectively. All subjects had severalCBFV transients classified as moderate for both right andleft MCA. Only 5 recordings from the right MCA and 7from the left did not show weak responses. A singletransient, classified as weak response was observed in 16subjects (right MCA) and 14 subjects (left MCA). Also,
Fig. 1. Representative tracings of cerebral blood flow velocity(right MCA) and arterial blood pressure during a spontaneousrise in ABP in a 52-year-old man. (a) Continuous ABP andCBFV recordings; (b) beat-to-beat interpolated signals formean ABP (—) and mean CBFV (– – –). The AUC was cal-culated between 2 and 7 s after the maximum rate of rise ofABP (t � 0) and, for this subject, it corresponds to 83% of the
total area of the ABP transient.
Variability of cerebral blood flow velocity ● R. B. PANERAI et al. 33
2 or more weak responses, up to a maximum of 5,occurred in 18 subjects, for recordings from both MCAs.The pattern corresponding to the strong response was notpresent in only 1 (right MCA) and 3 (left MCA) subjects,respectively. For the right MCA, 33 subjects presentedall three responses and, for the left MCA, the corre-sponding number was 29. The mean SD distribution ofthe three types of responses across the population studiedis given in Table 1. The figures in this table indicate that,in the right MCA, the occurrence of moderate responsesranged from 14.3 to 92.9% of the total number of tran-sients of each subject. Similar interpretation applies tothe other values in Table 1.
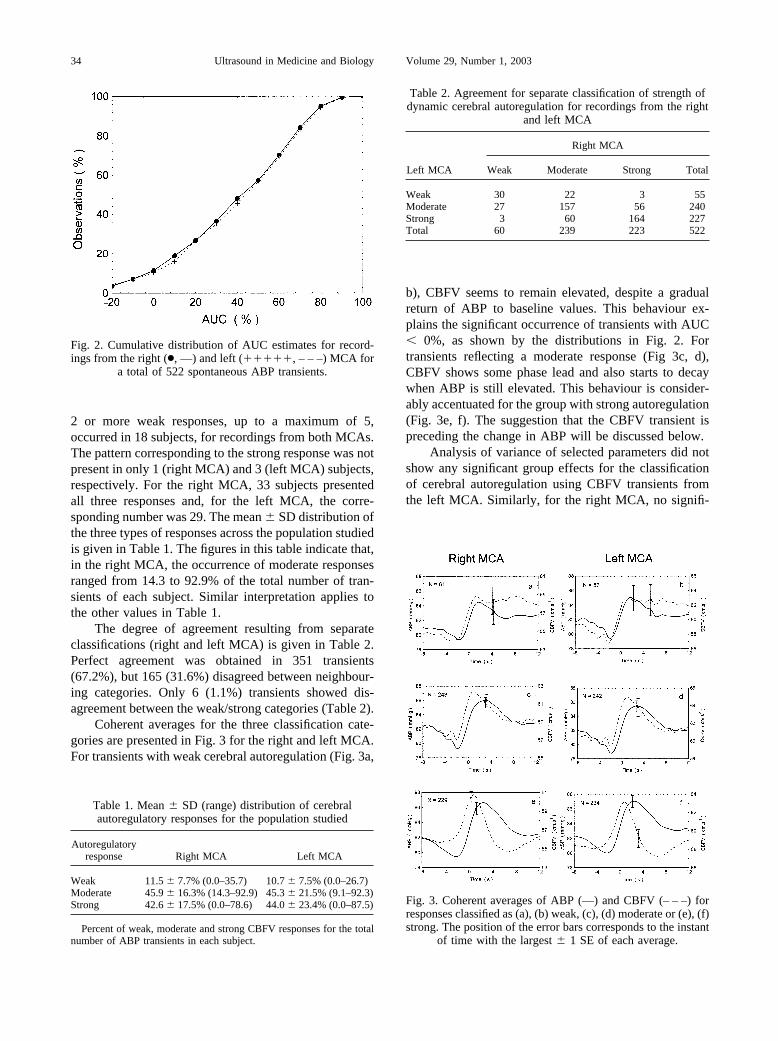
The degree of agreement resulting from separateclassifications (right and left MCA) is given in Table 2.Perfect agreement was obtained in 351 transients(67.2%), but 165 (31.6%) disagreed between neighbour-ing categories. Only 6 (1.1%) transients showed dis-agreement between the weak/strong categories (Table 2).
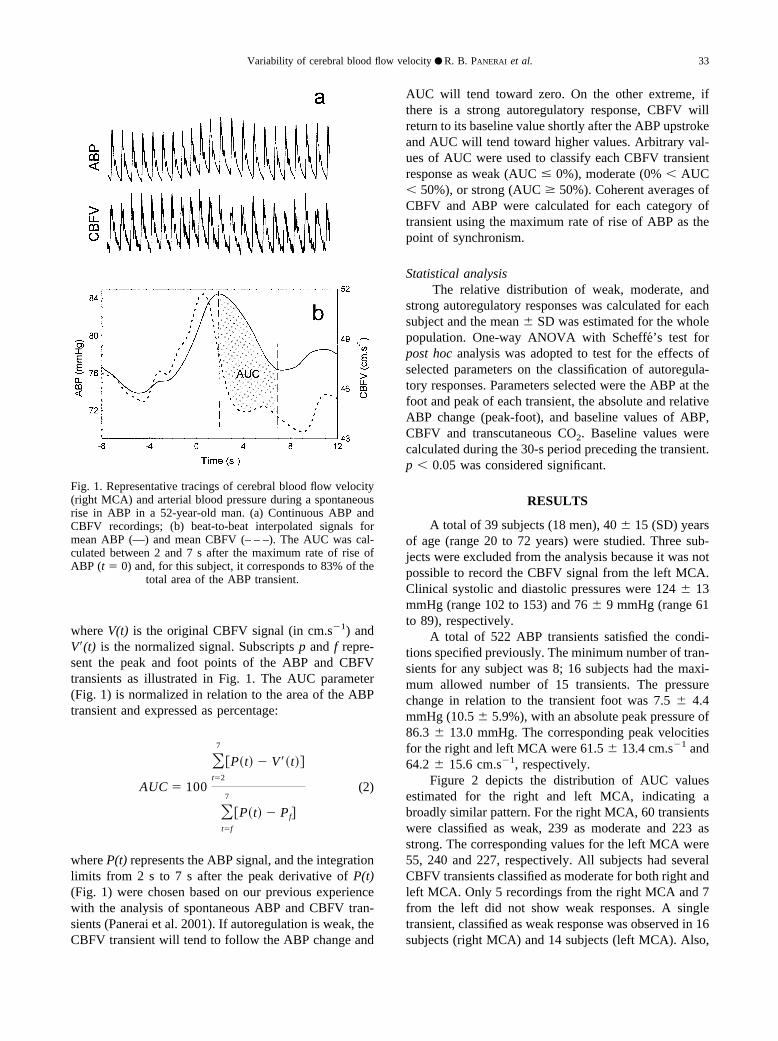
Coherent averages for the three classification cate-gories are presented in Fig. 3 for the right and left MCA.For transients with weak cerebral autoregulation (Fig. 3a,
b), CBFV seems to remain elevated, despite a gradualreturn of ABP to baseline values. This behaviour ex-plains the significant occurrence of transients with AUC� 0%, as shown by the distributions in Fig. 2. Fortransients reflecting a moderate response (Fig 3c, d),CBFV shows some phase lead and also starts to decaywhen ABP is still elevated. This behaviour is consider-ably accentuated for the group with strong autoregulation(Fig. 3e, f). The suggestion that the CBFV transient ispreceding the change in ABP will be discussed below.
Analysis of variance of selected parameters did notshow any significant group effects for the classificationof cerebral autoregulation using CBFV transients fromthe left MCA. Similarly, for the right MCA, no signifi-
Fig. 2. Cumulative distribution of AUC estimates for record-ings from the right (●, —) and left (, – – –) MCA for
a total of 522 spontaneous ABP transients.
Table 1. Mean SD (range) distribution of cerebralautoregulatory responses for the population studied
Autoregulatoryresponse Right MCA Left MCA
Weak 11.5 7.7% (0.0–35.7) 10.7 7.5% (0.0–26.7)Moderate 45.9 16.3% (14.3–92.9) 45.3 21.5% (9.1–92.3)Strong 42.6 17.5% (0.0–78.6) 44.0 23.4% (0.0–87.5)
Percent of weak, moderate and strong CBFV responses for the totalnumber of ABP transients in each subject.
Table 2. Agreement for separate classification of strength ofdynamic cerebral autoregulation for recordings from the right
and left MCA
Left MCA
Right MCA
Weak Moderate Strong Total
Weak 30 22 3 55Moderate 27 157 56 240Strong 3 60 164 227Total 60 239 223 522
Fig. 3. Coherent averages of ABP (—) and CBFV (– – –) forresponses classified as (a), (b) weak, (c), (d) moderate or (e), (f)strong. The position of the error bars corresponds to the instant
of time with the largest 1 SE of each average.
34 Ultrasound in Medicine and Biology Volume 29, Number 1, 2003
cant differences were observed for the transcutaneousCO2, baseline CBFV, baseline mean ABP, ABP transientpeak derivative or transient foot or peak ABP. However,for the right MCA, the transient ABP change from foot topeak had a significant effect either as a relative (p �0.039) or an absolute value (p � 0.012). Post hoc anal-ysis with Scheffe’s test indicates that these differencesare due to the weak group having a smaller change inABP than the other two groups, as can be observed inFig. 3.
DISCUSSION
Variability of dynamic cerebral autoregulationLimited information is available on the variability
of dynamic autoregulation indices. Using the mathemat-ical model proposed by Tiecks et al. (1995), Dawson(2000) and Mahony et al. (2000) studied the reproduc-ibility of the dynamic autoregulatory index (ARI) inhealthy subjects, estimated from spontaneous ABP tran-sients and thigh cuff manoeuvres, respectively. Bothstudies indicated a substantial variability in this param-eter. In particular, Mahony and colleagues reported sixinstances in which ARI was approximately zero, thussuggesting absence of autoregulatory response followingthe sudden release of thigh cuffs. Czosnyka et al. (1997)obtained continuous estimates of cerebral autoregulationfrom the running correlation coefficient between ABPand intracranial pressure (ICP) or between cerebral per-fusion pressure and CBFV, using a moving window of200 s. Unfortunately, these authors did not report on theintrasubject variability of these estimates or their shortterm fluctuations, presenting only day-to-day changes ingroup averages. Day-to-day fluctuations in CBFV re-sponses to mental arithmetic paradigms were also re-ported by Vingerhoets and Stroobant (2002), who sug-gested that averaging multiple short-activation epochswithin the same session might improve the reliability ofresults.
More information about the variability of estimatesof dynamic autoregulation is vital to extend our under-standing of the physiology of cerebral blood flow con-trol, and also improving the accuracy and precision ofmeasurement techniques. The main difficulty in this areais the absence of a rigorous definition of dynamic cere-bral autoregulation and lack of a “gold standard” for itsassessment (Panerai 1998). Hitherto, most studies haveattempted to describe the dynamic properties of cerebralautoregulation by estimating the temporal relationshipbetween ABP and CBF or CBFV. However, if CBF orCBFV is also influenced by other physiologic variables,the relationship with ABP is bound to be highly variable.As a consequence, it is often difficult to separate truephysiologic variability from random error resulting from
limitations of measurement techniques. Hitherto, moststudies of cerebral autoregulation have assumed, implic-itly or explicitly, that the physiologic mechanisms in-volved are more stable than the measurement techniquesadopted for their observation and modelling. As dis-cussed below, this perception can be challenged by theresults of our study.
Fluctuations in dynamic autoregulationThe results of the coherent averaging of spontane-
ous positive ABP and CBFV transients (Fig. 3) and thewide distribution of AUC values (Fig. 2) suggest thatdynamic cerebral autoregulation can display consider-able variability over short periods of time. These resultsare not due exclusively to intersubject variability; nosingle subject presented only one type of autoregulatoryresponse (Table 1). Coherent averaging and the AUCmeasure were adopted as the simplest tools to quantifythe temporal pattern changes of the CBFV response to aspontaneous ABP transient with an appropriate temporalresolution. Previous studies based on coherent averagingof spontaneous ABP transients have shown agreementwith the classical static approach and sensitivity to con-ditions where cerebral autoregulation is expected to beimpaired (Boylan et al. 2000; Panerai et al. 1995; Paneraiet al. 2001). The intuitive quantification of the strength ofautoregulation with the AUC measure only provides anordinal scale to rank-order autoregulatory responses. Ifthis parameter correlates linearly with other indices ofcerebral autoregulation, such as the ARI (Tiecks et al.1995), or CBFV impulse responses (Panerai et al. 1999a,2001; Zhang et al. 1998a), should be the object of futureinvestigations.
Several authors have shown an association of thephase lead of CBFV in relation to ABP and the perfor-mance of cerebral autoregulation, using either time- orfrequency-domain analysis techniques (Birch et al. 1995;Blaber et al. 1997; Diehl et al. 1995; Panerai 1998;Panerai et al. 1999a, 1999b; Zhang et al. 1998a). Thisfeature of the CBFV response is clearly visible in Fig. 3,with an increasing phase lead of CBFV from the weak tothe strong category suggesting an agreement of the AUCclassification with other approaches adopted to quantifythe efficiency of cerebral autoregulation.
In theory, the complex nonlinear and multivariatemechanisms controlling cerebral blood flow are likely todisplay considerable variability (Panerai 1998; Panerai etal. 2000; Ursino and Lodi 1998). The effects of ABPchanges on CBF regulation, which are often referred toas pressure-autoregulation, involve a large number ofintermediate steps and metabolites as part of myogenicand/or metabolic mechanisms. Metabolic regulation ofvasomotor activity has been shown to be influenced by alarge number of metabolites, chiefly tissue pO2, pH,
Variability of cerebral blood flow velocity ● R. B. PANERAI et al. 35
pCO2, and nitric oxide (Brian et al. 1996; Busija andHeistad 1984; Faraci and Sobey 1998; Paulson et al.1990). Fluctuations and complex interactions amongstmetabolites are likely to be reflected as a modulation ofthe CBF-ABP relationship. Previous studies in humanshave shown that other variables, such as arterial pCO2,mental activation, respiration and intracranial environ-ment, can influence the dynamic relationship betweenABP and CBFV (Aaslid et al. 1989; Birch et al. 1995;Busija and Heistad 1984; Panerai 1998; Panerai et al.1999b, 2000; Paulson et al. 1990; Ursino and Lodi 1998),but the intensity and time scale of these effects at rest,restricted to spontaneous fluctuations, have not beenestablished. Finally, changes in CBF produced by otherphysiologic variables can also be manifested as an ap-parent modulation of cerebral pressure autoregulation.Studies in animals have shown spontaneous fluctuationsin cortical O2 supply (Halsey and McFarland 1974),cortical blood flow (Jones et al. 1995), oxidative metab-olism (Dora and Kovach 1981) and pial vessel diameters(Auer and Gallhofer 1981; Gotoh et al. 1982), indepen-dently of oscillations in arterial blood pressure.
Future studies will be necessary to clarify the phys-iologic significance of the considerable intrasubject vari-ation in autoregulatory responses that we observed. Onepossibility is that the dynamic response is pressure-de-pendent or that there is a pressure threshold below whichthe response is not fully developed. This possibility isreinforced by the significantly smaller mean ABP ampli-tude of the transients classified as weak for the rightMCA (5.9 3.2 mmHg). This effect was not observedfor the left MCA (p � 0.08), probably because the meanABP transient amplitude for the group classified as weakwas slightly greater (6.2 4.5 mmHg). In one studyusing frequency-domain analysis, Zhang et al. (1998b)also suggested that changes in ABP variability powercould influence the relationship with CBFV in the verylow frequency range (0.02 to 0.07 Hz). On the otherhand, Mahony et al. (2000) have observed significantintrasubject variability using thigh cuff manoeuvres thatusually induce relatively large drops (10 to 20 mmHg) inmean ABP. Other studies have also failed to detect anABP amplitude-of-change effect on the CBFV response(Dawson 2000; Panerai et al. 2001), but they did notfocus on the specific question of intrasubject variability.
Limitations of the studyThe second possibility to explain the intrasubject
differences in autoregulatory responses that we observedis that they are an artefact of the methods of measure-ment and analysis adopted. The Finapres device has beenextensively used in studies of dynamic autoregulation(Blaber et al. 1997; Mahony et al. 2000; Panerai et al.2001; Simpson et al. 2001; Zhang et al. 1998a), and it has
been show to reflect intra-arterial pressure changes (Im-holz et al. 1998; Omboni et al. 1993; Zhang et al. 1998a).Although it is not possible to exclude the possibility ofsignificant differences in variability patterns betweenABP recorded in the finger and the true MCA pressure,it is unlikely that such differences could explain theintrasubject fluctuations in autoregulatory responses,given the relative uniformity of the ABP transient pat-terns for the three categories of responses shown in Fig.3. In other words, the differences that have been recordedwere due to changes in the CBFV transient response,rather than in the ABP transient.
Transcranial Doppler US cannot measure absoluteflow; the accuracy of its estimates rely on the assumptionthat the diameter of the MCA remains approximatelyconstant, as supported by several studies (Giller et al.1993; Newell et al. 1994; Serrador et al. 2000). Otherpotential sources of error involve inadequate insonationof the MCA, transducer movement or poor signal-to-noise ratio (e.g., due to skull thickness). The use of ahead frame to hold the two Doppler probes minimizedthe risk of artefacts resulting from transducer movement,as would be the case with hand-held transducers. Oneconjecture is that fluctuations in ICP could lead to minorchanges in insonation, by shifting the position of theMCA. Even if this phenomenon, or changes in MCAdiameter, could cause a temporary distortion in the am-plitude of the CBFV raw signal, it is difficult to under-stand how it could affect only the sequence of five ormore cardiac cycles in the falling phase of the CBFVresponse (Fig. 3) in some transients, but not in others.Finally, the agreement obtained between recordings fromthe right and left MCA (Fig. 3) suggests that noisearising from Doppler measurements cannot be consid-ered as the main explanation for the very significantdifferences observed in the CBFV responses to ABPtransients.
Fluctuations in arterial pCO2 could explain, at leastqualitatively, the intrasubject variation in CBFV re-sponses (Aaslid et al. 1989; Birch et al. 1995; Busija andHeistad 1984; Panerai 1998; Panerai et al. 1999b, 2000;Paulson et al. 1990; Simpson et al. 2001). Althoughtranscutaneous CO2 has limited temporal resolution, theaverage value calculated 30 s before the ABP transientshould be able to reflect any large changes that mighthave occurred. However, no such changes were sug-gested by the analysis of variance (largest F � 0.22). Infact, with subjects resting supine and breathing normally,no major differences should be expected. Also, previousstudies indicate that even breathing 5% CO2 has only alimited effect on the CBFV step response and otherfrequency-domain indices of cerebral autoregulation(Panerai et al. 1999b; Simpson et al. 2001). Therefore, itis unlikely that small spontaneous fluctuations in arterial
36 Ultrasound in Medicine and Biology Volume 29, Number 1, 2003
CO2 could explain the large differences observed in thedynamic ABP-CBFV relationship. Other variables thathave not been taken into account include fluctuations inintracranial volumes, cerebrospinal fluid and intracranialpressure (B-waves).
The AUC measure was used as a simple and intu-itive alternative to the subjective classification of CBFVresponse patterns based purely on visual inspection. Infact, the characteristic patterns represented in Fig. 3 canbe identified in single transients (e.g., Fig. 1), albeit withlarger variability. The decision to break down the patternspace into three clusters, using as separation AUC � 0%and 50%, was made after confirming that similar resultswere obtained with up to 8 subgroups, with the coherentaverages showing a finer gradation of CBFV responseswith increasing values of the AUC threshold. The use ofonly three groups, however, maximized the number oftransients in each group and, consequently, the signifi-cance of the corresponding coherent averages. The mainpossibility of error in coherent averaging is the inclusionof spurious transients, but the 522 ABP and 1044 CBFVtransients (both MCAs) that entered into each averagewere visually inspected to avoid artefacts and to makesure that they complied with the conditions described inthe Methods section. The relatively small standard errorsof the averages, and the agreement between the right andleft MCA, also provide an indication of their consistency(Fig. 3).
Whatever the origin of the intrasubject fluctuationsin CBFV responses, it seems to involve a mechanismaffecting both MCA recordings. From the above discus-sion, it is unlikely that these changes are an artefact ofmeasurement and analytical technique, or caused by fluc-tuations in arterial pCO2. Further work will be requiredto examine the influence of other variables, such asfluctuations in intrathoracic and intracranial pressures, aswell as in metabolic demand and metabolites.
Until the mechanisms responsible for the dynamicregulation of cerebral blood flow are shown to be immu-table in healthy individuals, it is important to keep anopen mind to avoid restrictive assumptions that can con-strain research design and also bias the choice of mea-surement techniques. If the range of variability of theABP-CBFV relationship that we reported is confirmedby future investigations, reproducibility studies of meth-ods to assess dynamic autoregulation in humans willhave to be considerably refined, to reflect the wholespectrum of autoregulatory performance in a single in-dividual, rather than simply aim to reproduce a singlenumerical figure.
Acknowledgements—The authors thank Prof. David H. Evans and Dr.Lingke Fan for the design of the Doppler signal analyser.
REFERENCES
Aaslid R, Lindegaard KF, Sorteberg W, Nornes H. Cerebral autoreg-ulation dynamics in humans. Stroke 1989;20:45–52.
Auer LM, Gallhofer B. Rhythmic activity of cat pial vessels in vivo.Eur Neurol 1981;20:448–468.
Birch AA, Dirnhuber MJ, Hartley-Davies R, Iannotti F, Neil-Dwyer G.Assessment of autoregulation by means of periodic changes inblood pressure. Stroke 1995;26:834–837.
Blaber AP, Bondar RL, Stein F. Transfer function analysis of cerebralautoregulation dynamics in autonomic failure patients. Stroke1997;28:1686–1692.
Boylan GB, Young K, Panerai RB, Rennie JM, Evans DH. Dynamiccerebral autoregulation in sick newborn infants. Pediatr Res 2000;48:12–17.
Brian JE Jr, Faraci FM, Heistad DD. Recent insights into the regulationof cerebral circulation. Clin Exp Pharm Physiol 1996;23:449–457.
Busija DW, Heistad DD. Factors involved in the physiological regu-lation of the cerebral circulation. Rev Physiol Biochem Pharm1984;101:162–211.
Czosnyka M, Smielewski P, Kirpatrick P, et al.. Continuous assessmentof the cerebral vasomotor reactivity in head injury. Neurosurgery1997;41:11–19.
DawsonSL. Blood pressure variability and cerebral autoregulation inacute ischaemic stroke. M.D. Thesis, University of Leicester,Leicester, UK, 2000:109–139.
Diehl RR, Linden D, Lucke D, Berlit P. Phase relationship betweencerebral blood flow velocity and blood pressure. A clinical test ofautoregulation. Stroke 1995;26:1801–1804.
Dora E, Kovach AGB. Metabolic and vascular volume oscillations inthe cat brain cortex. Acta Physiol Acad Sci Hung 1981;57:261–275.
Faraci FM, Sobey CG. Role of potassium channels in regulation ofcerebral vascular tone. J Cereb Blood Flow Metab 1998;18:1047–1063.
Giller CA. The frequency-dependent behavior of cerebral autoregula-tion. Neurosurgery 1990;27:362–368.
Giller CA, Bowman G, Dyer H, Mootz L, Krippne W. Cerebral arterialdiameters during changes in blood pressure and carbon dioxideduring craniotomy. Neurosurgery 1993;32:737–742.
Gotoh F, Fukuuchi Y, Okayasu H, et al.. Rhythmic changes in diameterof pial vessels and function of autonomic nervous system. In:Heistad DD, Marcus ML, ed.s. Cerebral blood flow: Effects ofnerves and neurotransmitters. Amsterdam: Elsevier North Holland,1982:409–417.
Halsey JHJ, McFarland S. Oxygen cycles and metabolic autoregula-tion. Stroke 1974;5:219–225.
Imholz BPM, Wieling W, van Montfrans GA, Wesseling KH. Fifteenyears experience with finger arterial pressure monitoring: Assess-ment of the technology. Cardiovasc Res 1998;38:605–616.
Jones SC, Williams JL, Shea M, Easley KA, Wei D. Cortical cerebralblood flow cycling: Anesthesia and arterial pressure. Am J Physiol1995;268:H569–H575.
Mahony P, Panerai RB, Deverson ST, Hayes PD, Evans DH. Assess-ment of the thigh cuff technique for measurement of dynamiccerebral autoregulation. Stroke 2000;31:476–480.
Newell DW, Aaslid R, Lam A, Mayberg TS, Winn HR. Comparison offlow and velocity during dynamic autoregulation testing in humans.Stroke 1994;25:793–797.
Omboni S, Parati G, Frattola A, et al.. Spectral and sequence analysisof finger blood pressure variability. Comparison with analysis ofintra-arterial recordings. Hypertension 1993;22:26–33.
Panerai RB. Assessment of cerebral pressure autoregulation in hu-mans—a review of measurement methods. Physiol Meas 1998;19:305–338.
Panerai RB, Dawson SL, Eames PJ, Potter JF. Cerebral blood flowvelocity response to induced and spontaneous sudden changes inarterial blood pressure. Am J Physiol 2001;280:H2162–H2174.
Panerai RB, Dawson SL, Potter JF. Linear and nonlinear analysis ofhuman dynamic cerebral autoregulation. Am J Physiol 1999a;277:H1089–H1099.
Variability of cerebral blood flow velocity ● R. B. PANERAI et al. 37
Panerai RB, Deverson ST, Mahony P, Hayes P, Evans DH. Effect ofCO2 on dynamic cerebral autoregulation measurement. PhysiolMeas 1999b;20:265–275.
Panerai RB, Kelsall AWR, Rennie JM, Evans DH. Cerebral autoreg-ulation dynamics in premature newborns. Stroke 1995;26:74–80.
Panerai RB, Simpson DM, Deverson ST, et al.. Multivariate dynamicanalysis of cerebral blood flow regulation in humans. IEEE TransBiomed Eng 2000;47:419–423.
Paulson OB, Strandgaard S, Edvinson L. Cerebral autoregulation.Cerebrovasc Brain Metab Rev 1990;2:161–192.
Rosengarten B, Huwendiek O, Kaps M. Neurovascular coupling andcerebral autoregulation can be described in terms of a controlsystem. Ultrasound Med Biol 2001;27:189–193.
Serrador M, Picot PA, Rutt BK, Shoemaker JK, Bondar RL. MRImeasures of middle cerebral artery diameter in conscious humansduring simulated orthostasis. Stroke 2000;31:1672–1678.
Simpson DM, Panerai RB, Evans DH, Naylor AR. A parametricapproach to measuring cerebral blood flow autoregulation fromspontaneous variations in blood pressure. Ann Biomed Eng 2001;29:18–25.
Smielewski P, Czosnyka M, Iyer V, Piechnik S, Whitehouse H, PickardJ. Computerized transient hyperaemic response test - a method forthe assessment ofcerebral autoregulation. Ultrasound Med Biol1995;21:599–611.
Stroobant N, Vingerhoets G. Test-retest reliability of functional trans-cranial Doppler ultrasonography. Ultrasound Med Biol 2001;27:509–514.
Tiecks FP, Lam AM, Aaslid R, Newell DW. Comparison of static anddynamic cerebral autoregulation measurements. Stroke 1995;26:1014–1019.
Ursino M, Lodi CA. Interaction among autoregulation, CO2 reactivity,and intracranial pressure: A mathematical model. Am J Physiol1998;274:H1715–H1728.
Verma PK, Panerai RB, Rennie JM, Evans DH. Grading of cerebralautoregulation in preterm and term neonates. Pediatr Neurol 2000;23:236–42.
Vern BA, Schuette WH, Leheta B, Juel VC, Radulovacki M. Low-frequency oscillations of cortical oxidative metabolism in wakingand sleep. J Cereb Blood Flow Metab 1988;8:215–226.
Vingerhoets G, Stroobant N. Reliability and validity of day-to-dayblood flow velocity reactivity in a single subject: An fTCD study.Ultrasound Med Biol 2002;28:197–202.
Zhang R, Zuckerman JH, Giller CA, Levine BD. Transfer functionanalysis of dynamic cerebral autoregulation in humans. Am JPhysiol 1998a;274:H233–H241.
Zhang R, Zuckerman JH, Levine BD. Deterioration of cerebral auto-regulation during orthostatic stress: Insights from the frequencydomain. J Applied Physiol 1998b;85:1113–1122.
38 Ultrasound in Medicine and Biology Volume 29, Number 1, 2003