shifts in controls on the temporal coherence of ... · in the summer growing season and autumn, ......
TRANSCRIPT

Shifts in controls on the temporal coherence of throughfallchemical flux in Acadia National Park, Maine, USA
Sarah J. Nelson • Katherine E. Webster •
Cynthia S. Loftin • Kathleen C. Weathers
Received: 1 August 2012 / Accepted: 17 June 2013
� Springer Science+Business Media Dordrecht 2013
Abstract Major ion and mercury (Hg) inputs to
terrestrial ecosystems include both wet and dry
deposition (total deposition). Estimating total deposi-
tion to sensitive receptor sites is hampered by limited
information regarding its spatial heterogeneity and
seasonality. We used measurements of throughfall
flux, which includes atmospheric inputs to forests and
the net effects of canopy leaching or uptake, for ten
major ions and Hg collected during 35 time periods in
1999–2005 at over 70 sites within Acadia National
Park, Maine to (1) quantify coherence in temporal
dynamics of seasonal throughfall deposition and (2)
examine controls on these patterns at multiple scales.
We quantified temporal coherence as the correlation
between all possible site pairs for each solute on a
seasonal basis. In the summer growing season and
autumn, coherence among pairs of sites with similar
vegetation was stronger than for site-pairs that differed
in vegetation suggesting that interaction with the
canopy and leaching of solutes differed in coniferous,
deciduous, mixed, and shrub or open canopy sites. The
spatial pattern in throughfall hydrologic inputs across
Acadia National Park was more variable during the
winter snow season, suggesting that snow re-distribu-
tion affects net hydrologic input, which consequently
affects chemical flux. Sea-salt corrected calcium
concentrations identified a shift in air mass sources
from maritime in winter to the continental industrial
corridor in summer. Our results suggest that the spatial
pattern of throughfall hydrologic flux, dominant
seasonal air mass source, and relationship with
vegetation in winter differ from the spatial pattern of
throughfall flux in these solutes in summer and
autumn. The coherence approach applied here made
clear the strong influence of spatial heterogeneity in
throughfall hydrologic inputs and a maritime air mass
source on winter patterns of throughfall flux. By
contrast, vegetation type was the most importantOriginally presented at BIOGEOMON 2012, Northport, ME,
USA, July 19, 2012.
S. J. Nelson (&)
Senator George J. Mitchell Center for Environmental and
Watershed Research and School of Forest Resources,
University of Maine, 5710 Norman Smith Hall,
Orono, ME 04469-5710, USA
e-mail: [email protected]
K. E. Webster
School of Natural Sciences, Trinity College Dublin,
Dublin 2, Ireland
e-mail: [email protected]
C. S. Loftin
U.S. Geological Survey, Maine Cooperative Fish and
Wildlife Research Unit, University of Maine, 5755
Nutting Hall, Orono, ME 04469-5755, USA
e-mail: [email protected]
K. C. Weathers
Cary Institute of Ecosystem Studies,
Box AB, Millbrook, NY 12545, USA
e-mail: [email protected]
123
Biogeochemistry
DOI 10.1007/s10533-013-9884-7
influence on throughfall chemical flux in summer and
autumn.
Keywords Throughfall � Mercury �Winter �Atmospheric deposition � Coherence � DOC
Introduction
Scientists, policymakers, and managers have recog-
nized the importance of quantifying total atmospheric
deposition, typically defined as wet plus dry deposi-
tion, including occult (fog/cloud) inputs, in assessing
effects of mass transport of anthropogenic pollutants
to terrestrial and, subsequently, aquatic ecosystems.
Atmospheric deposition is typically summed into an
annual flux for use as the input term in watershed-
scale mass balance studies, especially those that
monitor long-term changes in watershed biogeochem-
istry and acidification (e.g., Kahl et al. 2007; Norton
and Fernandez 1999; Likens and Bormann 1995).
Atmospheric deposition is the largest source of
nitrogen (as NO3-, NH4
?), sulfur (as SO42-), and
Hg inputs, and often influences spatial and temporal
patterns in export of these chemicals from many
terrestrial ecosystems (Lindberg et al. 2007; Weathers
et al. 2000, 2006).
Because wet-only deposition is the most readily
accessible and frequently measured component of total
deposition, it has been used to estimate deposition
inputs to watersheds (e.g., Mitchell et al. 2011). Often
dry and occult deposition inputs are inadequate or
unavailable for particular watersheds. Wet-only depo-
sition measurements such as those made by the US
National Atmospheric Deposition Program/Mercury
Deposition Network (NADP/MDN 2001) provide
large-scale, year-round, methodologically consistent
chemistry and deposition data. However, wet-only
measurements underestimate total deposition for many
solutes as dry deposition of some chemicals—SO42-,
Hg, and nitrogen for example—often equals or exceeds
wet-only deposition, particularly at forested sites
[CASTNET (http://epa.gov/castnet); Nelson et al.
2008; Johnson et al. 2007; Weathers et al. 2006].
Because of its importance, as well as challenges in
obtaining accurate estimates particularly for complex
terrain and over small spatial extent, measurement and
modeling of dry deposition continue to be identified as
research priorities (e.g., Lindberg et al. 2007). Dry
deposition has been estimated with inferential tech-
niques, micrometeorological approaches, surrogate
surfaces (Rea et al. 2000; Davidson et al. 1985) and
throughfall (water collected under the forest canopy)
measurements (e.g., Lovett 1994). Micrometeorolog-
ical and inferential methods provide standardized
estimates of deposition that can complement NADP/
MDN measurements of wet-only deposition; however,
they are not well suited to estimate deposition in
landscapes with non-uniform vegetation or topogra-
phy (Weathers et al. 2000, 2006; Lindberg et al. 1994;
Lindberg and Lovett 1992). Occult deposition is rarely
measured, though in some locations it contributes a
significant proportion of atmospheric inputs of water
and solutes (e.g., Anderson et al. 2006; Ritchie et al.
2006; Weathers et al. 2000).
The throughfall approach estimates the amount of a
solute deposited on the land surface after atmospheric
deposition passes through and interacts with the forest
canopy. Although throughfall flux is spatially and
temporally variable, it has most often been quantified
during the growing season and for short-duration
intervals. A notable exception, Houle et al. (1999)
conducted a multi-solute throughfall study across
seasons in hardwood forests in Canada. As a conse-
quence, we lack information on how local to broad
scale controls such as vegetation type and phenology,
elevation gradients, site aspect, and seasonal meteo-
rological patterns (e.g., Witt et al. 2009; Johnson et al.
2007; Weathers et al. 2000; Lovett 1994) influence
throughfall flux throughout the year.
Based on the literature, we had expectations
regarding patterns in throughfall flux of many solutes
collected in this study, and its hydrology. A major
influence on throughfall flux is retention or leaching
from the canopy, with effects differing by forest
composition and solute. In general, ions that are ‘‘not
considered limiting nutrients for tree growth’’ such as
SO42-, chloride (Cl-), sodium (Na?) (Houle et al.
1999) and Hg, are expected to be relatively conserva-
tive with respect to uptake by or leaching from forest
canopies. Throughfall flux for these solutes under
either coniferous or mixed canopies generally exceeds
fluxes under deciduous canopies (Johnson et al. 2007;
Weathers et al. 2000). Retention of foliage year-round
and the greater surface area of needles as compared to
deciduous leaves contribute to greater deposition at
conifer sites (collectively referred to as ‘scavenging
efficiency’) (Grigal 2002; Lovett et al. 1999). Because
Biogeochemistry
123
of decreased canopy coverage in winter, especially in
deciduous or mixed vegetation sites, we expect less
throughfall flux of these solutes in winter as compared
to other seasons.
In contrast to the relatively conservative ions, the
base cations calcium (Ca2?), magnesium (Mg2?), and
potassium (K?) leach readily from forest canopies
during the growing season, and potentially during the
dormant season (Houle et al. 1999), whereas, hydro-
gen ions (H?), ammonium (NH42?), and nitrate
(NO3-) generally are taken up by or exchanged within
forest canopies only during the growing season (Houle
et al. 1999; Johnson and Lindberg 1992). Although
Na? and Cl- are considered conservative with respect
to the forest canopy—especially in coastal areas where
they are deposited as seasalt aerosols (Beier et al.
1992)—leaching of base cations and Cl- can occur
during senescence (deciduous) and dormancy (coni-
fers) (Baumler and Zech 1997; Neary and Gizyn
1994).
Throughfall deposition is a function of both chem-
ical concentrations and hydrologic inputs. Compared
to precipitation at open sites, throughfall volume can
be increased through cloud and fog interception by the
canopy or decreased through evaporation and subli-
mation. In the growing season, rain throughfall
volume generally is less than wet-only volume mea-
sured at open sites due to canopy interception (Lovett
et al. 1999). In contrast, during the dormant season,
snow deposition is influenced primarily by wind re-
distribution, presence and type of canopy vegetation,
and terrain at the local scale (tens to hundreds of
meters) (Pomeroy and Gray 1995).
Although both seasonal weather patterns and fine-
scale watershed factors likely influence total deposi-
tion, few studies have compiled sufficient throughfall
data to adequately investigate spatio-temporal pat-
terns, particularly in winter, and seasonal controls.
Given such gaps in our understanding of throughfall
flux for major ions and Hg, our objectives were to: (1)
quantify the similarity of temporal dynamics in
throughfall deposition of 11 solutes and spatial
variance in hydrologic flux in summer, autumn and
winter; and, (2) infer seasonal shifts in the dominance
of fine-scale (e.g., vegetation type) and broad-scale
(e.g., major air mass source) controls on throughfall
flux.
We analyzed event-based throughfall chemical and
water flux and water volume measurements made over
four years from sites located within a variety of
vegetation and landcover types in Acadia National
Park, Maine, USA. Our study sites at Acadia National
Park are well-suited to this type of analysis: there are
distinct seasonal weather patterns as well as hetero-
geneous vegetation patterns (Schauffler et al. 2007). In
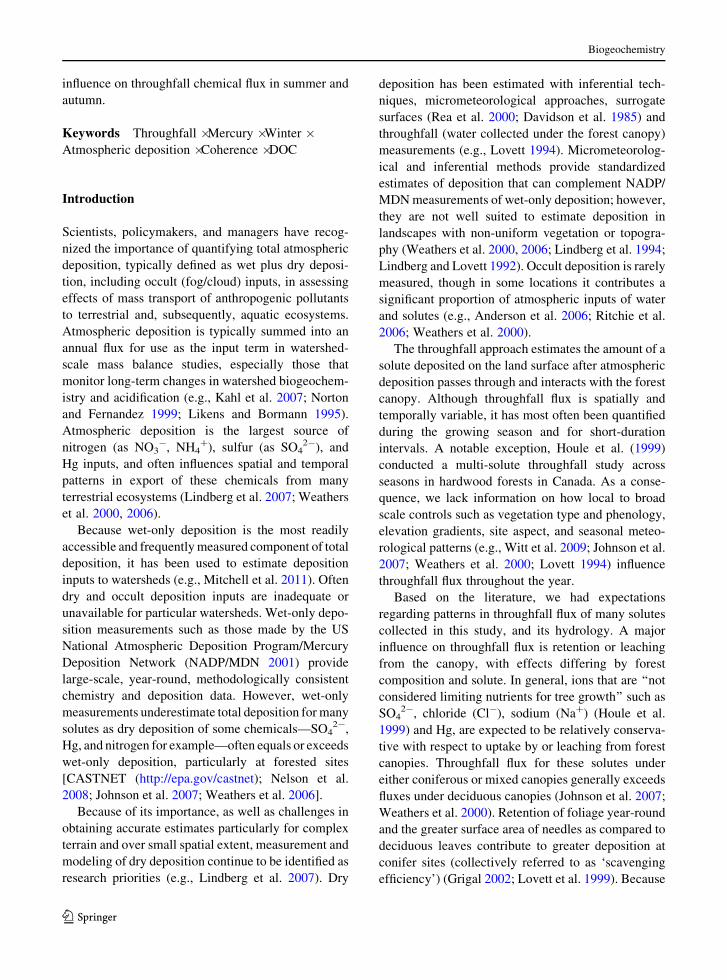
seasons when temporal dynamics were similar (e.g.,
strong coherence across all site pairs), we invoked the
broad-scale factor of air mass source as controlling
temporal patterns in the chemistry of precipitation and
thus throughfall flux (Fig. 1a). If throughfall flux was
not strongly coherent across all site pairs, then local or
site-specific factors related to vegetation type were
considered dominant controls (Fig. 1b). We then
contrasted coherence among site pairs located in the
same vegetation type with those in different vegetation
types. This analysis framework allowed us to propose
a hierarchy of local and broad-scale (regional) controls
on throughfall flux by solute and season.
Methods
Site description
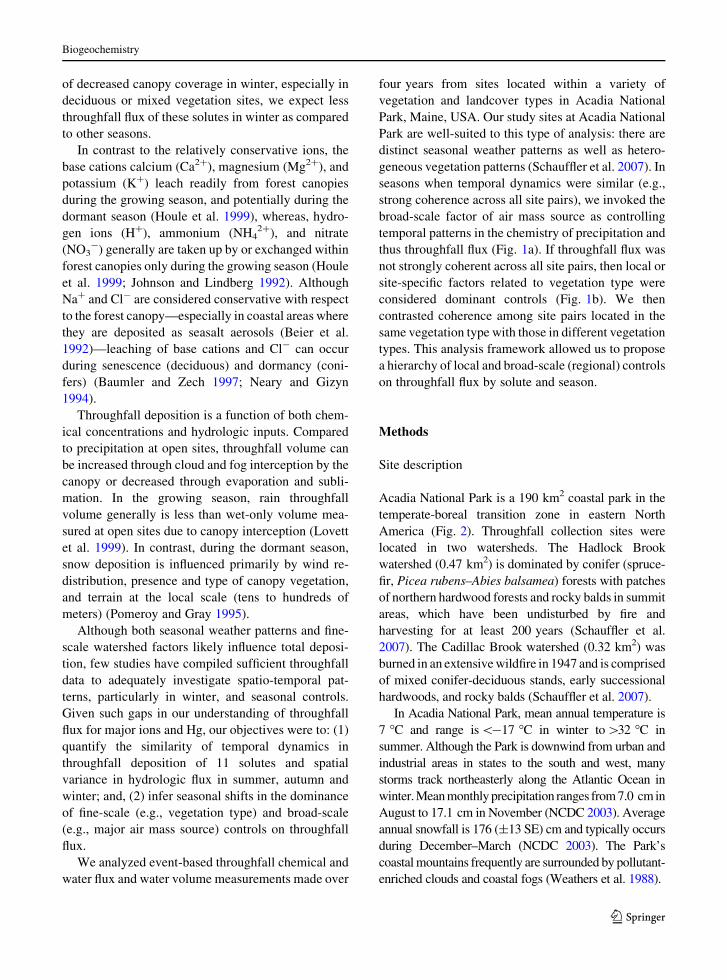
Acadia National Park is a 190 km2 coastal park in the
temperate-boreal transition zone in eastern North
America (Fig. 2). Throughfall collection sites were
located in two watersheds. The Hadlock Brook
watershed (0.47 km2) is dominated by conifer (spruce-
fir, Picea rubens–Abies balsamea) forests with patches
of northern hardwood forests and rocky balds in summit
areas, which have been undisturbed by fire and
harvesting for at least 200 years (Schauffler et al.
2007). The Cadillac Brook watershed (0.32 km2) was
burned in an extensive wildfire in 1947 and is comprised
of mixed conifer-deciduous stands, early successional
hardwoods, and rocky balds (Schauffler et al. 2007).
In Acadia National Park, mean annual temperature is
7 �C and range is\-17 �C in winter to[32 �C in
summer. Although the Park is downwind from urban and
industrial areas in states to the south and west, many
storms track northeasterly along the Atlantic Ocean in
winter. Mean monthly precipitation ranges from 7.0 cm in
August to 17.1 cm in November (NCDC 2003). Average
annual snowfall is 176 (±13 SE) cm and typically occurs
during December–March (NCDC 2003). The Park’s
coastal mountains frequently are surrounded by pollutant-
enriched clouds and coastal fogs (Weathers et al. 1988).
Biogeochemistry
123
Field methods
Throughfall collector sites were established during
1999–2000 at a maximum of 77 locations in the
Hadlock and Cadillac Brook watersheds (Fig. 2;
Johnson et al. 2007; Kahl et al. 2007). These locations
spanned the full range of landcover in each watershed:
deciduous, coniferous, and mixed forests; shrub and
krummholz sites; and open balds. One collector in
each watershed was co-located with an NADP-type
collector in an open, lower-elevation site, and one was
co-located with the official NADP/MDN collector at
site ME98. These landcover contrasts provided data
for coherence comparisons between vegetation types.
Major ion chemistry samples were collected in
HDPE funnel-bottle type collectors with openings 1 m
off the ground during the growing season. Poly-wool
(major ion collectors) or silanized glass wool (Hg
collectors) was placed in funnels to exclude large
litter, insects, frass, and other debris. Hg samples were
collected in borosilicate glass bottles attached via
Teflon� tubing to Teflon�-lined funnels during the
growing season (Johnson et al. 2007). In winter, major
ion and DOC samples were collected in HDPE bags
lining 10 cm diameter, 60 cm depth closed-bottom
tubes, and Hg samples were collected in Teflon� bags
lining 10 cm diameter, 60 cm depth closed-bottom
plastic tubes (Nelson et al. 2008). Loss of snow from
collectors was prevented by collecting samples within
24 h of snowstorms, and loss of Hg via emission was
minimized by using sample data referred to as ‘‘event-
based’’ in Nelson et al. (2008). We used semi-clean
collection methods for Hg, modified from EPA
Ultraclean method 1669 (Louch 2003; Johnson
2002). The collectors were continuously open, and
the samples represent the net inputs of wet deposition,
dry deposition that accumulated on the funnel or bag
and on the forest canopy between any rain or snow
events, and canopy drip from fog or cloud water.
Throughfall samples were retrieved on 35 dates
across 4 years; within a year, samples were retrieved
Fig. 1 a A hypothetical example of three sites behaving
coherently; though there is variability in the magnitude of a
measurement at each time period, sites behave similarly and
maintain their position relative to each other. b A hypothetical
example of three sites displaying non-coherent behavior; the
pattern of increases and decreases in measurements with time
does not occur similarly at each site
Fig. 2 Location of study watersheds in Acadia National Park
on Mount Desert Island, Maine, USA. H Hadlock Brook
watershed, C Cadillac Brook watershed
Biogeochemistry
123
typically 2–3 weeks apart, and each sample included
one or more precipitation events. Throughfall volume
was calculated from sample mass for each sample and
converted to depth of throughfall hydrologic input
based on the collection surface area. The number of
sites and solutes measured differed over the study
period, 1999–2005 (Table 1). In years lacking a full
complement of sites, cluster analysis was used to
choose a subset of sampling sites from the 77
established sites to represent the range of vegetation
type, elevation, throughfall volumes, and chemical
conductance reported in the original (1999–2000,
2001) data set (Nelson 2007). Snow (winter) samples
were collected in one project year, whereas summer
and autumn samples were collected in all project years
(Table 1).
Laboratory analyses
Chemical analyses were performed at the University
of Maine. Analyses of major ions followed standard
EPA methods (e.g., Norton and Fernandez 1999),
including inductively coupled atomic emission spec-
troscopy or ion chromatography for Ca2?, Mg2?, K?,
Na?; ion chromatography for SO42-, Cl-, and NO3
-;
ammonium autoanalyzer for NH4?; persulfate oxida-
tion and IR detection for DOC; and, air-equilibrated
electrode for pH. Hydrogen ion concentration (H?)
was calculated from air equilibrated pH. Total Hg was
measured with cold vapor atomic fluorescence spec-
trometry with EPA Method 1631 (US EPA 2002).
Equipment blank Hg concentrations ranged from
0.1 ng L-1 (detection limit) to 1.46 ng L-1, averag-
ing 0.35 ng L-1, and the value of the blank was
always \10 % of the associated sample Hg concen-
tration. Quality assurance routines included calcula-
tion of ion balance ratios and validation of field blank
and laboratory replicate data. Samples were re-
analyzed if ion balances were [1.20 or \0.80.
Data analysis
Throughfall flux was calculated as the product of
chemical concentration and sample throughfall vol-
ume divided by the number of days for each sample
period in the project years listed in Table 1. Each
value used in coherence analysis represented a single
collector by single collection period combination,
standardized into a per-week value for statistical
analyses. Throughfall flux was annualized (mass per
Table 1 Collection dates,
number of collectors, and
number of collection events
(within the date range) each
project year for major ion
and mercury (Hg)
throughfall samples in
Cadillac Brook (CB) and
Hadlock Brook (HB)
watersheds in Acadia
National Park, Maine
Major ions included Ca2?,
Mg2?, K?, Na?, NH4?,
NO3-, SO4
2-, Cl-, pH (air-
equilibrated), ANC, and
DOC. Each year after 1999
included concurrent
sampling at a co-located
bulk collector (included in
this analysis) and at NADP/
MDN site ME98 (Data not
reported in this analysis)a Severe drought limited
number of collectionsb High elevation sites at CB
were collected 11/23/04
Precipitation type Watershed Dates Solute group No. of
collection
events
No. of
collector
sites
Rain CB 08/01/99–11/19/99 Major ions 6 40
10/20/99–11/19/99 Hg 2 13
HB 08/01/99–11/19/99 Major ions 6 33
10/20/99–11/19/99 Hg 2 13
Rain CB 05/16/00–11/15/00 Major ions 10 38
Hg 25
HB 05/16/00–11/16/00 Major ions 36
Hg 26
Rain CB 05/01/01–11/17/01a Major ions 6 20
HB 17
Rain CB 05/28/04–11/17/04b Major ions 7 10
05/28/04–10/27/04 Hg 6
HB 05/28/04–11/17/04 Major ions 7
05/28/04–10/27/04 Hg 6
Snow CB 12/15/04–03/15/05 Major ions 6 6
12/15/04–03/15/05 Hg
HB 12/15/04–03/15/05 Major ions 5
12/15/04–03/15/05 Hg
Biogeochemistry
123
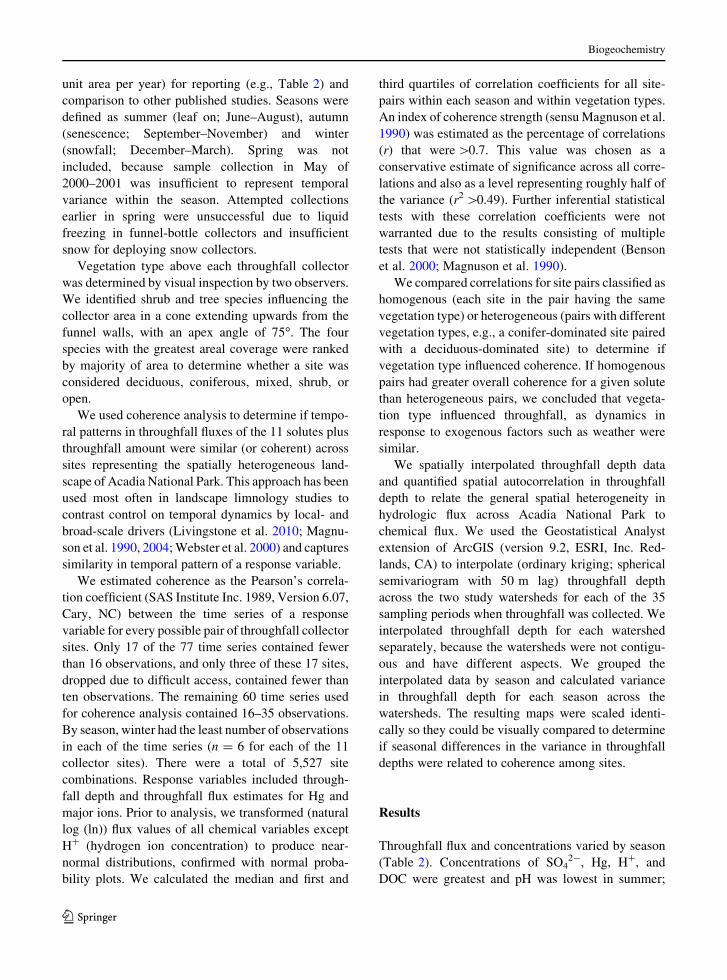
unit area per year) for reporting (e.g., Table 2) and
comparison to other published studies. Seasons were
defined as summer (leaf on; June–August), autumn
(senescence; September–November) and winter
(snowfall; December–March). Spring was not
included, because sample collection in May of
2000–2001 was insufficient to represent temporal
variance within the season. Attempted collections
earlier in spring were unsuccessful due to liquid
freezing in funnel-bottle collectors and insufficient
snow for deploying snow collectors.
Vegetation type above each throughfall collector
was determined by visual inspection by two observers.
We identified shrub and tree species influencing the
collector area in a cone extending upwards from the
funnel walls, with an apex angle of 75�. The four
species with the greatest areal coverage were ranked
by majority of area to determine whether a site was
considered deciduous, coniferous, mixed, shrub, or
open.
We used coherence analysis to determine if tempo-
ral patterns in throughfall fluxes of the 11 solutes plus
throughfall amount were similar (or coherent) across
sites representing the spatially heterogeneous land-
scape of Acadia National Park. This approach has been
used most often in landscape limnology studies to
contrast control on temporal dynamics by local- and
broad-scale drivers (Livingstone et al. 2010; Magnu-
son et al. 1990, 2004; Webster et al. 2000) and captures
similarity in temporal pattern of a response variable.
We estimated coherence as the Pearson’s correla-
tion coefficient (SAS Institute Inc. 1989, Version 6.07,
Cary, NC) between the time series of a response
variable for every possible pair of throughfall collector
sites. Only 17 of the 77 time series contained fewer
than 16 observations, and only three of these 17 sites,
dropped due to difficult access, contained fewer than
ten observations. The remaining 60 time series used
for coherence analysis contained 16–35 observations.
By season, winter had the least number of observations
in each of the time series (n = 6 for each of the 11
collector sites). There were a total of 5,527 site
combinations. Response variables included through-
fall depth and throughfall flux estimates for Hg and
major ions. Prior to analysis, we transformed (natural
log (ln)) flux values of all chemical variables except
H? (hydrogen ion concentration) to produce near-
normal distributions, confirmed with normal proba-
bility plots. We calculated the median and first and
third quartiles of correlation coefficients for all site-
pairs within each season and within vegetation types.
An index of coherence strength (sensu Magnuson et al.
1990) was estimated as the percentage of correlations
(r) that were [0.7. This value was chosen as a
conservative estimate of significance across all corre-
lations and also as a level representing roughly half of
the variance (r2 [0.49). Further inferential statistical
tests with these correlation coefficients were not
warranted due to the results consisting of multiple
tests that were not statistically independent (Benson
et al. 2000; Magnuson et al. 1990).
We compared correlations for site pairs classified as
homogenous (each site in the pair having the same
vegetation type) or heterogeneous (pairs with different
vegetation types, e.g., a conifer-dominated site paired
with a deciduous-dominated site) to determine if
vegetation type influenced coherence. If homogenous
pairs had greater overall coherence for a given solute
than heterogeneous pairs, we concluded that vegeta-
tion type influenced throughfall, as dynamics in
response to exogenous factors such as weather were
similar.
We spatially interpolated throughfall depth data
and quantified spatial autocorrelation in throughfall
depth to relate the general spatial heterogeneity in
hydrologic flux across Acadia National Park to
chemical flux. We used the Geostatistical Analyst
extension of ArcGIS (version 9.2, ESRI, Inc. Red-
lands, CA) to interpolate (ordinary kriging; spherical
semivariogram with 50 m lag) throughfall depth
across the two study watersheds for each of the 35
sampling periods when throughfall was collected. We
interpolated throughfall depth for each watershed
separately, because the watersheds were not contigu-
ous and have different aspects. We grouped the
interpolated data by season and calculated variance
in throughfall depth for each season across the
watersheds. The resulting maps were scaled identi-
cally so they could be visually compared to determine
if seasonal differences in the variance in throughfall
depths were related to coherence among sites.
Results
Throughfall flux and concentrations varied by season
(Table 2). Concentrations of SO42-, Hg, H?, and
DOC were greatest and pH was lowest in summer;
Biogeochemistry
123
Ta
ble
2M
ean
(sta
nd
ard
dev
iati
on
;n
)o
fco
nce
ntr
atio
nan
dan
nu
aliz
edth
rou
gh
fall
flu
xfo
rch
emic
also
lute
san
dth
rou
gh
fall
(TF
)d
epth
det
erm
ined
fro
m3
5th
rou
gh
fall
coll
ecti
on
sm
ade
du
rin
g1
99
9,
20
00
,2
00
1,
and
20
04
–2
00
5at
Aca
dia
Nat
ion
alP
ark
,M
ain
e
SO
42-
(leq
L-
1)
To
tal
Hg
(ng
L-
1)
Cl-
(leq
L-
1)
Na?
(leq
L-
1)
Ca2
?
(leq
L-
1)
Mg
2?
(leq
L-
1)
K?
(leq
L-
1)
NO
3-
(leq
L-
1)
NH
4?
(leq
L-
1)
Eq
pH
DO
C
(mg
L-
1)
Th
rou
gh
fall
con
cen
trat
ion
Su
mm
er8
0.9
(59
.0;
39
1)
21
.6(1
3.4
;
26
5)
61
.6(5
9.6
;
39
1)
56
(51
.0;
39
1)
27
.2(2
3.5
;
39
1)
27
.7(2
5.0
;
39
1)
42
.0(4
4.3
;
39
1)
26
.6(2
9.1
;
39
1)
8.6
8(1
3.5
;
39
0)
4.5
(0.4
6;
38
7)
16
.1(1
2.6
;
38
7)
Au
tum
n6
0(4
2.7
;
67
1)
11
.2(7
.8;
31
7)
11
8(1
25
.4;
67
1)
89
.6(9
2.9
;
67
1)
27
.3(2
5.1
;
67
1)
31
.8(2
9.7
;
67
1)
47
.6(6
1.4
;
67
1)
29
.1(3
9.2
;
67
1)
9.2
8(1
5.3
;
67
1)
4.7
6(0
.65
;
64
4)
11
.6(1
4.4
;
64
6)
Win
ter
31
.4(2
1.1
;
70
)
10
.1(8
.2;
67
)
93
.2(7
7.6
;
70
)
84
.4(6
6.6
;
70
)
10
.8(1
2.3
;
70
)
20
.5(1
7.9
;
70
)
5.5
(6.4
;7
0)
16
.8(1
4.5
;
70
)
5.0
4(3
.76
;
70
)
4.7
3(0
.25
;
70
)
1.6
(1.7
;7
0)
NA
DP
/MD
Nco
nce
ntr
atio
n
Su
mm
er3
8.6
(29
.3;
36
)
16
.1(1
7.4
;
37
)
8.2
(8.7
3;
36
)
6.3
1(7
.81
;
36
)
5.3
1(8
.37
;
36
)
2.1
5(2
.62
;
36
)
0.5
3(0
.98
;
36
)
25
.2(2
2.3
;
36
)
14
.7(1
6.4
;
36
)
4.5
2(0
.35
;
36
)
Au
tum
n2
3.2
(17
.7;
34
)
6.9
(3.8
;3
2)
20
.8(1
7.6
;
34
)
18
.4(1
6.5
;
34
)
2.8
9(2
.17
;
34
)
3.9
9(3
.30
;
34
)
0.5
1(0
.37
;
34
)
15
.4(1
8.8
;
34
)
7.0
7(9
.25
;
34
)
4.7
0(0
.36
;
35
)
Win
ter
25
.9(2
9.4
;
10
)
5.8
(6.8
;1
0)
50
.2(3
9.5
;
10
)
44
.1(3
4.3
;
10
)
5.1
2(7
.04
;
10
)
9.6
6(7
.97
;
10
)
1.0
7(0
.97
;
10
)
17
.0(2
4.2
;
10
)
8.1
9(1
7.9
;
10
)
4.7
3(0
.31
;
10
)
SO
42-
(kg
ha-
1
yea
r-1)
To
tal
Hg
(lg
m-
2
yea
r-1)
Cl-
(kg
ha-
1
yea
r-1)
Na?
(kg
ha-
1
yea
r-1)
Ca2
?
(kg
ha-
1
yea
r-1)
Mg
2?
(kg
ha-
1
yea
r-1)
K?
(kg
ha-
1
yea
r-1)
NO
3-
(kg
ha-
1
yea
r-1)
NH
4?
(kg
ha-
1
yea
r-1)
H?
(kg
ha-
1
yea
r-1)
DO
C
(mg
ha-
1
yea
r-1)
TF
dep
th
(mm
yea
r-1)
Th
rou
gh
fall
flu
x
Su
mm
er2
4.4
(14
.0;
39
0)
15
.1(8
.3;
26
5)
14
.0(1
1.4
;
39
0)
8.3
2(6
.76
;
39
0)
3.1
2(2
.08
;
39
0)
2.0
8(1
.56
;
39
0)
10
.4(8
.32
;
39
0)
8.8
4(8
.84
;
39
0)
1.0
4(1
.56
;
38
9)
0.5
2(0
.05
;
38
6)
10
7(7
8.0
;
38
6)
47
(31
;
45
8)
Au
tum
n2
6.0
(17
.7;
66
2)
10
.4(7
.80
;
31
7)
45
.2(6
3.4
;
66
2)
23
.4(3
5.9
;
66
1)
5.2
0(4
.68
;
66
1)
3.6
4(4
.16
;
66
1)
15
.6(1
5.6
;
66
1)
16
.12
(21
.3;
66
2)
1.5
6(1
.56
;
66
1)
0.5
2(0
.52
;
63
4)
10
9(1
28
;
63
7)
58
(30
;
73
8)
Win
ter
21
.8(1
8.2
;
70
)
14
.0(1
0.9
;
67
)
47
.3(4
2.1
;
70
)
28
.1(2
4.4
;
70
)
3.1
2(3
.64
;
70
)
3.6
4(3
.64
;
70
)
3.6
4(7
.28
;
70
)
13
(11
.4;
70
)
1.5
6(2
.08
;
70
)
0.5
2(0
.05
;
70
)
25
.5(4
1.6
;
70
)
62
(28
;
70
)
NA
DP
/MD
Nfl
ux
Su
mm
er1
0.8
(5.4
7;
4)
7.7
(6.8
;
40
)
12
.1(9
.55
;
4)
6.8
7(5
.61
;
4)
0.6
3(0
.39
;
4)
0.7
5(0
.59
;
4)
0.2
8(0
.22
;
4)
7.7
9(3
.10
;
4)
0.9
3(0
.38
;
4)
0.2
4(0
.10
;
4)
12
9(6
0.6
;
4)
Au
tum
n1
0.5
(2.9
5;
4)
8.5
(12
.0;
37
)
1.6
7(0
.75
;
4)
0.8
7(0
.41
;
4)
0.4
6(0
.02
;
4)
0.1
4(0
.04
;
4)
0.0
9(0
.03
;
4)
7.6
(1.4
3;
4)
1.4
1(0
.34
;
4)
0.2
2(0
.05
;
4)
69
(24
;
4)
Win
ter
11
.5(n
a;
1)
4.3
(3.7
;
11
)
25
.2(n
a;
1)
13
.7(n
a;
1)
0.8
4(n
a;
1)
1.6
(na;
1)
0.5
1(n
a;
1)
6.1
2(n
a;
1)
0.5
6(n
a;
1)
0.2
(na;
1)
13
0(n
a;
1)
NA
DP
and
MD
Nco
nce
ntr
atio
nan
dfl
ux
dat
afo
rsi
teM
E9
8w
ere
com
pil
edfo
rth
esa
me
tim
ep
erio
ds
asin
the
thro
ug
hfa
llre
sear
ch
Biogeochemistry
123
concentrations of Cl-, Na?, Ca2?, Mg2?, K?, NO3-,
and NH4? were greatest in autumn (Table 2). Peaks in
throughfall flux occurred in summer for Hg, autumn
for SO42-, Ca2?, K?, NO3
-, and DOC, and winter for
Cl- and Na?. Throughfall fluxes of Mg2? and NH4?
were similar in autumn and winter. Standard devia-
tions of throughfall fluxes of base cations, Na?, Cl-,
NO3-, NH4
?, and DOC averaged *120 % of the
mean in autumn and winter, whereas they aver-
aged *80 % of the mean in summer.
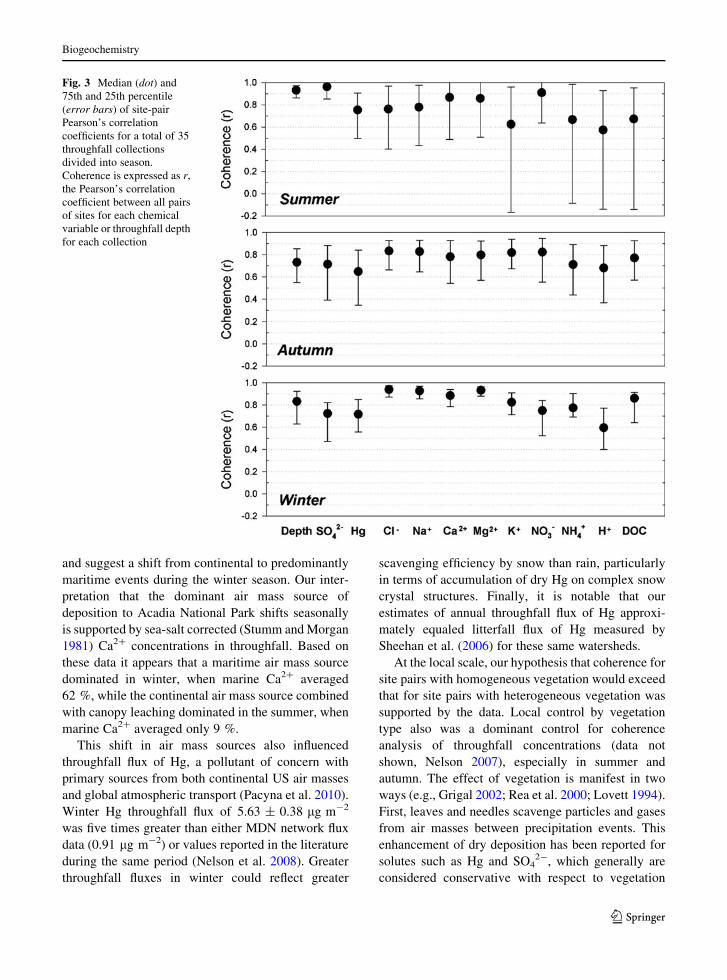
The magnitude and among-site pair variance of
coherence of throughfall flux as well as coherence in
throughfall concentrations (data not shown; see Nel-
son 2007), assessed as the percentage considered
strong (correlation [ 0.7), differed with chemical
variable and season (Fig. 3). In summer, coherence
was greatest for throughfall depth, SO42-, and NO3
-;
coherence was least, and variance was greatest, for
K?, NH4?, H?, and DOC in summer. Coherence
declined slightly in autumn for throughfall depth,
SO42-, and NO3
- and Hg, however, coherence
increased and variance decreased for all other analytes
except throughfall depth, SO42-, and Hg. In winter,
variance declined for all analytes except throughfall
depth, and coherence increased notably for Cl-, Na?,
Ca2?, Mg2?, and DOC (Fig. 3).
Throughfall volume showed a strong seasonal
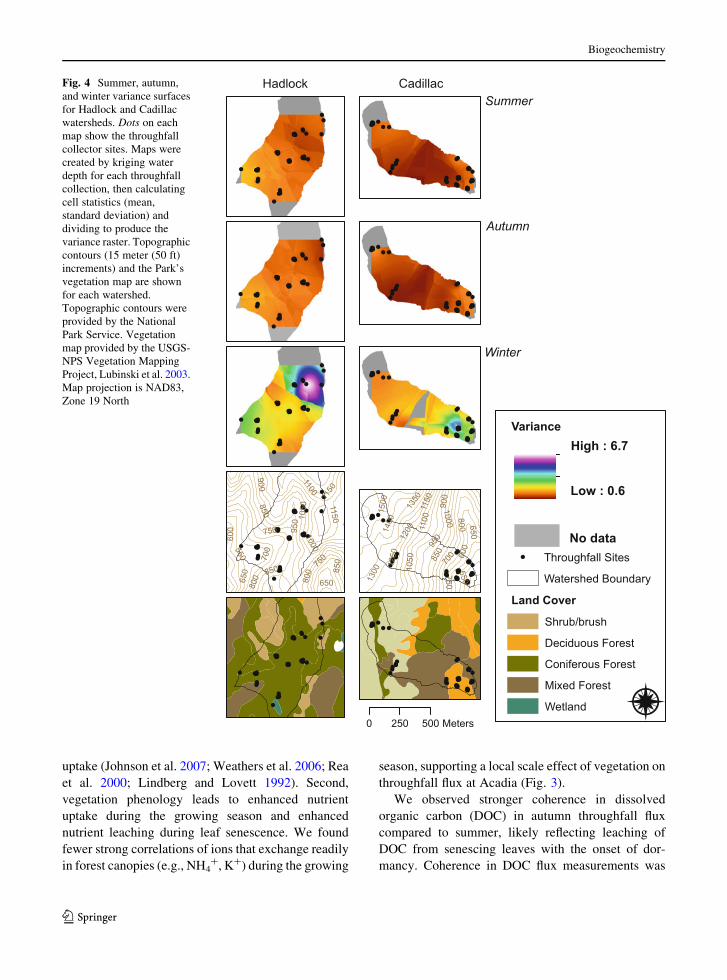
pattern in coherence, total amount and spatial vari-
ance. Throughfall volume correlations were strongest
in summer and weakest in autumn (Fig. 3). Through-
fall depth was greater and most variable in both
watersheds in winter with greatest variance occurring
at a summit with krummholz vegetation and balds in
Hadlock, and a mid-elevation ledge with krummholz
and balds in Cadillac (Fig. 4). Variance in winter
throughfall depth probably was due to re-distribution
of snow, especially in windy, high-elevation or
exposed sites. In contrast, throughfall depth was less
and variance greatest at low-elevation sites with mixed
conifer-deciduous vegetation during summer and
autumn (Fig. 4). Throughfall depth also was variable
near the summit (northernmost extent) of Cadillac
watershed, where vegetation consisted of a krumm-
holz-bald mixture. However, some throughfall collec-
tors in this area were located in sheltered sites such as
in a small, forested valley containing the stream
headwaters.
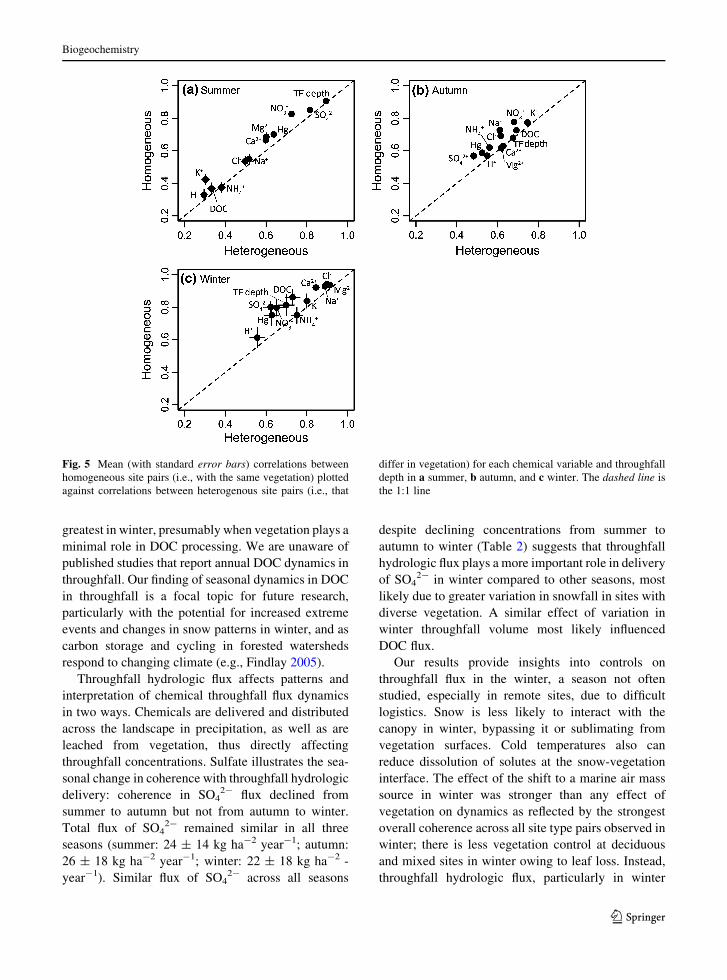
Throughfall flux coherence was more variable in
summer and autumn than in winter with respect to
comparisons between heterogeneous and homoge-
neous site pairs (Fig. 5). In summer, the coherence of
throughfall flux of chemical variables taken up by or
leached from the forest canopy (H?, K?, NH4?, DOC)
had the least coherence, and coherence was slightly
weaker in heterogeneous than homogeneous vegeta-
tion pairs. Ions that could be sourced from maritime
influences (Cl-, Na?, Ca2?, Mg2?) had moderate
coherence in summer, and only slightly weaker
coherence in heterogeneous than homogeneous veg-
etation site pairs. Solutes influenced by scavenging
efficiency of the canopy (SO42-, Hg, NO3
-, through-
fall depth) had the strongest coherence in summer
compared to other ions. In autumn, the throughfall flux
dynamics of K?, DOC, NO3- and NH4
? generally
were more coherent for homogeneous than heteroge-
neous site pairs, and coherence values were less
variable overall (Fig. 5). In winter, marine-derived
ions had greater coherence overall and did not
demonstrate weaker coherence for heterogeneous site
pairs. By contrast, solutes that responded to canopy
presence and architecture (SO42-, Hg, NO3
-, DOC,
and throughfall depth) did display weaker coherence
in heterogeneous site pairs than homogeneous site
pairs (Fig. 5).
Discussion
Patterns in coherence among the study sites in Acadia
National Park suggest the dominant factors controlling
throughfall flux are seasonally dynamic and differ by
solute. Seasonally changing air mass sources, through-
fall volume and spatial pattern, and vegetation type
appear to have been important controls on throughfall
coherence at Acadia, and each represents a different
scale of control, from localized to broad-scale.
Broad scale control on temporal dynamics related
to air mass source was most apparent in winter, when
stronger overall coherence in throughfall flux for
many solutes suggests weaker vegetation control
compared to other seasons (Fig. 3). Chloride (largely
marine-derived) illustrates the influence of air mass
seasonality. Coastal watersheds, such as our focal
study areas, are influenced by significant Na? and Cl-
as seasalt aerosols (Beier et al. 1992, NADP data);
Ca2?, SO42- and Mg2? also have significant marine
sources. Chloride fluxes were greater in winter than in
summer or autumn owing to this strong marine input
Biogeochemistry
123
and suggest a shift from continental to predominantly
maritime events during the winter season. Our inter-
pretation that the dominant air mass source of
deposition to Acadia National Park shifts seasonally
is supported by sea-salt corrected (Stumm and Morgan
1981) Ca2? concentrations in throughfall. Based on
these data it appears that a maritime air mass source
dominated in winter, when marine Ca2? averaged
62 %, while the continental air mass source combined
with canopy leaching dominated in the summer, when
marine Ca2? averaged only 9 %.
This shift in air mass sources also influenced
throughfall flux of Hg, a pollutant of concern with
primary sources from both continental US air masses
and global atmospheric transport (Pacyna et al. 2010).
Winter Hg throughfall flux of 5.63 ± 0.38 lg m-2
was five times greater than either MDN network flux
data (0.91 lg m-2) or values reported in the literature
during the same period (Nelson et al. 2008). Greater
throughfall fluxes in winter could reflect greater
scavenging efficiency by snow than rain, particularly
in terms of accumulation of dry Hg on complex snow
crystal structures. Finally, it is notable that our
estimates of annual throughfall flux of Hg approxi-
mately equaled litterfall flux of Hg measured by
Sheehan et al. (2006) for these same watersheds.
At the local scale, our hypothesis that coherence for
site pairs with homogeneous vegetation would exceed
that for site pairs with heterogeneous vegetation was
supported by the data. Local control by vegetation
type also was a dominant control for coherence
analysis of throughfall concentrations (data not
shown, Nelson 2007), especially in summer and
autumn. The effect of vegetation is manifest in two
ways (e.g., Grigal 2002; Rea et al. 2000; Lovett 1994).
First, leaves and needles scavenge particles and gases
from air masses between precipitation events. This
enhancement of dry deposition has been reported for
solutes such as Hg and SO42-, which generally are
considered conservative with respect to vegetation
Fig. 3 Median (dot) and
75th and 25th percentile
(error bars) of site-pair
Pearson’s correlation
coefficients for a total of 35
throughfall collections
divided into season.
Coherence is expressed as r,
the Pearson’s correlation
coefficient between all pairs
of sites for each chemical
variable or throughfall depth
for each collection
Biogeochemistry
123
uptake (Johnson et al. 2007; Weathers et al. 2006; Rea
et al. 2000; Lindberg and Lovett 1992). Second,
vegetation phenology leads to enhanced nutrient
uptake during the growing season and enhanced
nutrient leaching during leaf senescence. We found
fewer strong correlations of ions that exchange readily
in forest canopies (e.g., NH4?, K?) during the growing
season, supporting a local scale effect of vegetation on
throughfall flux at Acadia (Fig. 3).
We observed stronger coherence in dissolved
organic carbon (DOC) in autumn throughfall flux
compared to summer, likely reflecting leaching of
DOC from senescing leaves with the onset of dor-
mancy. Coherence in DOC flux measurements was
Fig. 4 Summer, autumn,
and winter variance surfaces
for Hadlock and Cadillac
watersheds. Dots on each
map show the throughfall
collector sites. Maps were
created by kriging water
depth for each throughfall
collection, then calculating
cell statistics (mean,
standard deviation) and
dividing to produce the
variance raster. Topographic
contours (15 meter (50 ft)
increments) and the Park’s
vegetation map are shown
for each watershed.
Topographic contours were
provided by the National
Park Service. Vegetation
map provided by the USGS-
NPS Vegetation Mapping
Project, Lubinski et al. 2003.
Map projection is NAD83,
Zone 19 North
Biogeochemistry
123
greatest in winter, presumably when vegetation plays a
minimal role in DOC processing. We are unaware of
published studies that report annual DOC dynamics in
throughfall. Our finding of seasonal dynamics in DOC
in throughfall is a focal topic for future research,
particularly with the potential for increased extreme
events and changes in snow patterns in winter, and as
carbon storage and cycling in forested watersheds
respond to changing climate (e.g., Findlay 2005).
Throughfall hydrologic flux affects patterns and
interpretation of chemical throughfall flux dynamics
in two ways. Chemicals are delivered and distributed
across the landscape in precipitation, as well as are
leached from vegetation, thus directly affecting
throughfall concentrations. Sulfate illustrates the sea-
sonal change in coherence with throughfall hydrologic
delivery: coherence in SO42- flux declined from
summer to autumn but not from autumn to winter.
Total flux of SO42- remained similar in all three
seasons (summer: 24 ± 14 kg ha-2 year-1; autumn:
26 ± 18 kg ha-2 year-1; winter: 22 ± 18 kg ha-2 -
year-1). Similar flux of SO42- across all seasons
despite declining concentrations from summer to
autumn to winter (Table 2) suggests that throughfall
hydrologic flux plays a more important role in delivery
of SO42- in winter compared to other seasons, most
likely due to greater variation in snowfall in sites with
diverse vegetation. A similar effect of variation in
winter throughfall volume most likely influenced
DOC flux.
Our results provide insights into controls on
throughfall flux in the winter, a season not often
studied, especially in remote sites, due to difficult
logistics. Snow is less likely to interact with the
canopy in winter, bypassing it or sublimating from
vegetation surfaces. Cold temperatures also can
reduce dissolution of solutes at the snow-vegetation
interface. The effect of the shift to a marine air mass
source in winter was stronger than any effect of
vegetation on dynamics as reflected by the strongest
overall coherence across all site type pairs observed in
winter; there is less vegetation control at deciduous
and mixed sites in winter owing to leaf loss. Instead,
throughfall hydrologic flux, particularly in winter
Fig. 5 Mean (with standard error bars) correlations between
homogeneous site pairs (i.e., with the same vegetation) plotted
against correlations between heterogenous site pairs (i.e., that
differ in vegetation) for each chemical variable and throughfall
depth in a summer, b autumn, and c winter. The dashed line is
the 1:1 line
Biogeochemistry
123
snowfall, was a key driver influencing variability in
throughfall chemical inputs. We observed heightened
variance in throughfall depth in winter as compared to
summer and autumn, a result likely associated with
exposed areas. Forest edges are areas where solute
deposition varies greatly and may be enhanced
(Weathers et al. 1995), and exposed areas are more
vulnerable to snow redistribution by wind (Pomeroy
and Gray 1995). In contrast, uniform throughfall depth
across the sites within a season, as occurred in
summer, suggests that variability in the amount of
chemicals delivered to the throughfall collector is
attributable to vegetation type or air mass source.
Implications
Extensive atmospheric deposition monitoring net-
works rarely have the resources to evaluate effects of
fine-scale land cover and terrain on deposition flux to
watersheds. Watershed-scale mass balance studies
require spatially heterogeneous deposition estimates,
and when measurements are made, they are often
limited to the growing season. We evaluated summer,
autumn, and winter deposition data from coastal
watersheds with heterogeneous vegetation, and found
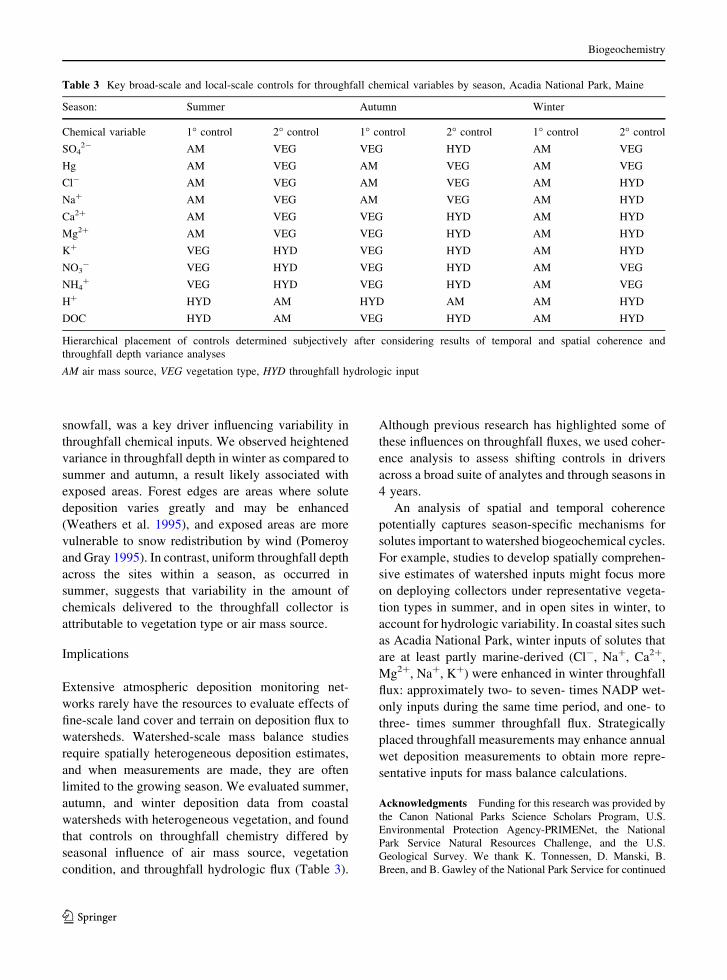
that controls on throughfall chemistry differed by
seasonal influence of air mass source, vegetation
condition, and throughfall hydrologic flux (Table 3).
Although previous research has highlighted some of
these influences on throughfall fluxes, we used coher-
ence analysis to assess shifting controls in drivers
across a broad suite of analytes and through seasons in
4 years.
An analysis of spatial and temporal coherence
potentially captures season-specific mechanisms for
solutes important to watershed biogeochemical cycles.
For example, studies to develop spatially comprehen-
sive estimates of watershed inputs might focus more
on deploying collectors under representative vegeta-
tion types in summer, and in open sites in winter, to
account for hydrologic variability. In coastal sites such
as Acadia National Park, winter inputs of solutes that
are at least partly marine-derived (Cl-, Na?, Ca2?,
Mg2?, Na?, K?) were enhanced in winter throughfall
flux: approximately two- to seven- times NADP wet-
only inputs during the same time period, and one- to
three- times summer throughfall flux. Strategically
placed throughfall measurements may enhance annual
wet deposition measurements to obtain more repre-
sentative inputs for mass balance calculations.
Acknowledgments Funding for this research was provided by
the Canon National Parks Science Scholars Program, U.S.
Environmental Protection Agency-PRIMENet, the National
Park Service Natural Resources Challenge, and the U.S.
Geological Survey. We thank K. Tonnessen, D. Manski, B.
Breen, and B. Gawley of the National Park Service for continued
Table 3 Key broad-scale and local-scale controls for throughfall chemical variables by season, Acadia National Park, Maine
Season: Summer Autumn Winter
Chemical variable 1� control 2� control 1� control 2� control 1� control 2� control
SO42- AM VEG VEG HYD AM VEG
Hg AM VEG AM VEG AM VEG
Cl- AM VEG AM VEG AM HYD
Na? AM VEG AM VEG AM HYD
Ca2? AM VEG VEG HYD AM HYD
Mg2? AM VEG VEG HYD AM HYD
K? VEG HYD VEG HYD AM HYD
NO3- VEG HYD VEG HYD AM VEG
NH4? VEG HYD VEG HYD AM VEG
H? HYD AM HYD AM AM HYD
DOC HYD AM VEG HYD AM HYD
Hierarchical placement of controls determined subjectively after considering results of temporal and spatial coherence and
throughfall depth variance analyses
AM air mass source, VEG vegetation type, HYD throughfall hydrologic input
Biogeochemistry
123
support of the long-term research at Acadia. We thank the
University of Maine laboratories, particularly M. Handley, C.
Devoy, and T. Hyssong, for laboratory analyses and support. We
thank the many field and laboratory crews—especially K.
Mahaffey, H. Caron, A. Grygo, J. Tillotson, T. Hyssong, C.
Schmitt, and K. Johnson—who assisted with sampling and
analyses. T. Haines and K. Johnson provided 1999–2000
mercury throughfall data. B. Halteman provided statistical
support. We thank J. Magnuson for early suggestions, which
guided analysis of the data. Reviews provided by S. Norton and
three anonymous reviewers improved the manuscript. Mention of
trade names or commercial products does not constitute
endorsement or recommendation for use by the U.S. Government.
References
Anderson JB, Baumgardner RE, Grenville SE (2006) Trends in
cloud water sulfate and nitrate as measured at two moun-
tain sites in the Eastern United States: regional contribu-
tions and temporal changes compared with changes in
emissions, 1986–1999. Atmos Environ 40(23):4423–4427
Baumler R, Zech W (1997) Atmospheric deposition and impact
of forest thinning on the throughfall of mountain forest
ecosystems in the Bavarian Alps. For Ecol Manage 95:
243–251
Beier C, Gundersen P, Rasmussen L (1992) A new method for
estimation of dry deposition of particles based on
throughfall measurements in a forest edge. Atmos Environ
26A(9):1553–1559
Benson BJ, Lenters JD, Magnuson JJ, Stubbs M, Kratz TK,
Dillon PJ, Hecky RE, Lathrop RC (2000) Regional
coherence of climatic and lake thermal variables of four
lake districts in the Upper Great Lakes Region of North
America. Freshwater Biol 43:517–527
Davidson CI, Lindberg SE, Schmidt JA, Cartwright LG, Landis
LR (1985) Dry deposition of sulfate onto surrogate sur-
faces. J Geophys Res Atmos 90(D1):2123–2130
Findlay SEG (2005) Increased carbon transport in the Hudson
River: unexpected consequence of nitrogen deposition?
Front Ecol Environ 3(3):133–137
Grigal DF (2002) Inputs and outputs of mercury from terrestrial
watersheds: a review. Environ Rev 10:1–39
Houle D, Ouimet R, Paquin R, Laflamme J-G (1999) Interac-
tions of atmospheric deposition with a mixed hardwood
and a coniferous forest canopy at the Lake Clair Watershed
(Duchesnay, Quebec). Can J For Res 29:1944–1957
Johnson KB (2002) Fire and its effects on mercury and meth-
ylmercury dynamics for two watersheds in Acadia National
Park, Maine. MS Thesis, University of Maine
Johnson KB, Haines TA, Kahl JS, Norton SA, Amirbahman A,
Sheehan KD (2007) Controls on mercury and methylmer-
cury deposition for two watersheds in Acadia National
Park, Maine. Environ Monit Assess 126(1–3):55–67
Johnson DW, Lindberg SE (eds) (1992) Atmospheric deposition
and forest nutrient cycling: a synthesis of the integrated
forest study. Springer-Verlag
Kahl JS, Nelson SJ, Fernandez I, Haines T, Norton S, Wiersma
GB, Jacobson G, Amirbahman A, Johnson K, Schauffler
M, Rustad L, Tonnessen K, Lent R, Bank M, Elvir J,
Eckhoff J, Caron H, Ruck P, Parker J, Campbell J, Manski
D, Breen R, Sheehan K, Grygo A (2007) Watershed
nitrogen and mercury geochemical fluxes integrate land-
scape factors in long-term research watersheds at Acadia
National Park, Maine, USA. Environ Monit Assess
126(1–3):9–25
Likens GE, Bormann FH (1995) Biogeochemistry of a forested
ecosystem, 2nd edn. Springer, New York
Lindberg SE, Lovett GM (1992) Deposition and forest canopy
interactions of airborne sulfur: results from the integrated
forest study. Atmos Environ 26A(8):1477–1492
Lindberg SE, Owens JG, Stratton WJ (1994) Application of
throughfall methods to estimate dry deposition of mercury.
In: Watras CJ, Huckabee JW (eds) Mercury as a global
pollutant: integration and synthesis. Lewis Publishers,
Boca Raton, pp 261–271
Lindberg S, Bullock R, Ebinghaus R, Engstrom D, Feng X,
Fitzgerald W, Pirrone N, Prestbo E, Seigneur C (2007) A
synthesis of progress and uncertainties in attributing the
sources of mercury in deposition. Ambio 36(1):19–32
Livingstone DM, Adrian R, Arvola L, Blenckner T, Dokulil MT,
Hari RE, George G, Jankowsk T, Jarvinen M, Jennings E,
Noges P, Noges T, Straile D, Weyhenmeyer GA (2010)
Regional and supra-regional coherence in limnological
variables. In: George G (ed) Climate and lake impacts in
Europe, Aquatic Ecology series. Springer, Berlin,
pp 311–338
Louch J (2003) EPA Method 1631 (Revision E) for determi-
nation of low-level mercury in aqueous samples. NCASI
(National Council for Air and Stream Improvement) Spe-
cial Report 03-02, NCASI West Coast Regional Center,
Corvallis, OR, May 2003, p 15
Lovett GM (1994) Atmospheric deposition of nutrients and
pollutants in North America: an ecological perspective.
Ecol Appl 4(4):629–650
Lovett GM, Thompson AW, Anderson JB, Bowser JJ (1999)
Elevational patterns of sulfur deposition at a site in the
Catskill Mountains, New York. Atmos Environ 33:617–624
Lubinski S, Hop K, Gawler S (2003) U.S. Geological Survey-
National Park Service Vegetation Mapping Program:
Acadia National Park, Maine. U.S. Geological Survey,
Upper Midwest Environmental Sciences Center, La
Crosse, Wisconsin
Magnuson JJ, Benson BJ, Kratz TK (1990) Temporal coherence
in the limnology of a suite of lakes in Wisconsin, USA.
Freshwater Biol 23:145–159
Magnuson JJ, Benson BJ, Kratz TK (2004) Patterns of coherent
dynamics within and between lake districts at local to
intercontinental scales. Boreal Environ Res 9:359–369
Mitchell MG, Lovett GM, Bailey S, Beall F, Burns D, Buso D,
Clair TA, Courchesne F, Duchesne F, Eimers C, Fernandez
I, Houle D, Jeffries D, Likens G, Moran M, Rogers C,
Scwhede D, Shanley J, Weathers KC, Vet R (2011)
Comparisons of watershed sulfur budgets in southeast
Canada and northeast US: new approaches and implica-
tions. Biogeochemistry 103:181–207
National Atmospheric Deposition Program (NRSP-3)/Mercury
Deposition Network (2001) NADP Program Office, Illinois
State Water Survey, 2204 Griffith Drive, Champaign, IL
61820. http://nadp.sws.uiuc.edu/nadpdata. Accessed April
2007
Biogeochemistry
123
NCDC (2003) National Climatic Data Center Daily Surface
Data
Neary AJ, Gizyn WI (1994) Throughfall and stemflow chem-
istry under deciduous and coniferous forest canopies in
south-central Ontario. Can J For Res 24(6):1089–1100
Nelson SJ (2007) Winter contribution to annual throughfall
inputs of mercury and tracer ions at Acadia National Park,
Maine. PhD Dissertation, University of Maine, Orono,
Maine, 260 pp
Nelson SJ, Johnson KB, Weathers KC, Loftin CS, Fernandez IJ,
Kahl JS, Krabbenhoft DP (2008) A comparison of winter
mercury accumulation at forested and no-canopy sites
measured with different snow sampling techniques. Appl
Geochem 23(3):384–398
Norton SA, Fernandez IJ (eds) (1999) The Bear Brook Water-
shed in Maine: a paired watershed experiment. Kluwer
Academic Publishers, Boston
Pacyna EG, Pacyna JM, Sundseth K, Munthe J, Kindbom K,
Wilson S, Steenhuisen F, Maxson P (2010) Global emis-
sion of mercury to the atmosphere from anthropogenic
sources in 2005 and projections to 2020. Atmos Environ
44:2487–2499
Pomeroy JW, Gray DM (1995) Snowcover accumulation, relo-
cation, and management. Environment Canada, Saskatoon
Rea AW, Lindberg SE, Keeler GJ (2000) Assessment of dry
deposition and foliar leaching of mercury and selected
trace elements based on washed foliar and surrogate sur-
faces. Environ Sci Technol 34:2418–2425
Ritchie CD, Richards W, Arp PA (2006) Mercury in fog on the
Bay of Fundy (Canada). Atmos Environ 40(33):6321–6328
Schauffler M, Nelson SJ, Kahl JS, Jacobson GL Jr, Haines TA,
Patterson WA III, Johnson KB (2007) Paleoecological
assessment of watershed history in PRIMENet watersheds
at Acadia National Park, USA. Environ Monit Assess
126(1–3):39–53
Sheehan KD, Fernandez IJ, Kahl JS, Amirbahman A (2006)
Litterfall mercury in forested watersheds at Acadia
National Park. Water Air Soil Pollut 170:249–265
Stumm W, Morgan J (1981) Aquatic chemistry—chemical
equilibria and rates in natural waters. Wiley, New York
US EPA (2002) Method 1631, Revision E: mercury in water by
oxidation, purge and trap, and cold vapor atomic fluores-
cence spectrometry, EPA-821-R-02-019. U.S. Environ-
mental Protection Agency, Office of Water, Washington, DC
Weathers KC, Likens GE, Bormann FH, Bicknell SH, Bormann
BT, Daube BC Jr, Eaton JS, Galloway JN, Keene WC,
Kimball KD, McDowell WH, Siccama TG, Smiley D,
Tarrant R (1988) Cloudwater chemistry from ten sites in
North America. Environ Sci Technol 22(8):1018–1026
Weathers KC, Lovett GM, Likens GE (1995) Cloud deposition
to a spruce forest edge. Atmos Environ 29(6):665–672
Weathers KC, Lovett GM, Likens JE, Lathrop R (2000) The
effect of landscape features on deposition to Hunter
Mountain, Catskill Mountains, New York. Ecol Appl 10(2):
528–540
Weathers KC, Simkin SM, Lovett GM, Lindberg SE (2006)
Empirical modeling of atmospheric deposition in moun-
tainous landscapes. Ecol Appl 16(4):1590–1607
Webster KE, Soranno PA, Baines SB, Kratz TK, Bowser CJ,
Dillon PJ, Campbell P, Fee EJ, Hecky RE (2000) Structuring
features of lake districts: landscape controls on lake chemical
responses to drought. Freshwater Biol 43:499–515
Witt EL, Kolka RK, Nater EA, Wickman TR (2009) Influence of
the forest canopy on total and methyl mercury deposition in
the boreal forest. Water Air Soil Pollut 199(1–4):3–11
Biogeochemistry
123