shear wave velocity comparisons; surface wave, downhole ... · shear wave velocity comparisons;...
TRANSCRIPT
Shear Wave Velocity Comparisons; Surface Wave, Downhole and SCPT Measurement Methods - A Case History M.R. Lewis & J. Clemente Bechtel Corporation, California, USA I.A. Weemees ConeTec, Inc., British Columbia, Canada K.H. Stokoe, II, J. Yuan, C. Kim &Y.-C. Lin University of Texas at Austin, Texas, USA SUMMARY A subsurface investigation was carried out at a remote site in British Columbia, Canada for the purpose of characterizing the site for future development. A portion of the site characterization effort involved determining the shear wave velocities (VS) of the subsurface materials for use in site-response analysis and liquefaction assessment due to earthquake shaking. Shear wave velocity data were acquired three different ways: (1) downhole seismic measurements in a borehole, (2) downhole measurements with a seismic SCPTu, and (3) nonintrusive surface wave measurements by the Spectral-Analysis-of-Surface-Waves (SASW) method. The SASW method was included because: (1) sampling was required of some layers composed of granular soils with large gravel and cobbles and (2) deeper VS profiling to depths of 60 m or more was desired, potentially in bedrock at some locations. Data obtained from each method are compared, and are correlated to site-specific subsurface conditions, including lateral variability. Differences between localized (SCPTu) and global (SASW) Vs measurements are discussed. This study demonstrates, that in many situations, VS profiling with the SASW method can contribute cost effectively to improved subsurface information and better interpretation of geotechnical site conditions. Keywords: shear wave velocity, spectral analysis of surface waves (SASW), seismic piezocone, downhole test 1. INTRODUCTION Shear wave velocity measurements in the field have become commonplace over the past decade. Techniques have been developed that allow rapid measurement and interpretation of wave velocity data to expedite engineering evaluations. At a remote site in British Columbia, Canada, nonintrusive testing with the Spectral-Analysis-of-Surface-Waves (SASW) method was used to gather shear wave velocity data across an active and potentially contaminated industrial site in a short period of time, particularly in a coarse-grained gravelly and cobble-filled deposit where drilling and cone soundings were difficult at best. These data were subsequently used to perform a site-response analysis and to assess the liquefaction potential at the site. 2. SUBSURFACE CONDITIONS The site is located approximately 30 km inland from the Pacific coast line, about 650 km north of Vancouver, BC, Canada. The site lies in a fjord-like valley that most likely has been shaped by glaciers. The geology of the site consists of alluvial, post-glacial deposits overlying glacial till and bedrock. Depth to bedrock varies from less than 30 m to over 200 m, with rock dipping eastward toward the natural river channel. Table 1 is a generalized north-south profile depicting the main subsurface strata in the central portion of the site. The sands and gravels consist of medium dense to dense sand and gravel, with cobbles. Although standard penetration test (SPT) N-values are not necessarily indicative of dense material, due to gravel
Table 1. Generalized Subsurface Profile In The Central Portion Of The Site
and cobbles, they can be indicative of loose sands if present. In this case, zones of loose and very loose materials (N < 10) were present. Classification tests showed that the vast majority of the sands and gravels classify as well-graded clean sands and gravels (SW and GW) to silty sands (SM) and gravels. The silts and clays encountered were overconsolidated near the surface, decreasing to more normally consolidated at depth. The corrected seismic piezocone penetration testing (SCPTu) tip resistance (qt) of the silts and clays was about 3.6 MPa, with a standard deviation () of about 1.4 MPa, and an average undrained shear strength of about 140 kPa. Classification tests indicated that about half of the samples were clays (CL) and the remainders were silts (ML) and silt-clay mixes (CL-ML). The ground surface ranges from about elevation (el) 10 to 19 m, and the depth to the groundwater table is approximately 3 m. It is noted that although the generalized conditions depicted in Table 1 appear uniform, the site itself is far from uniform. Rock dips from west to east (toward the river channel) and the alluvial deposits vary in a similar manner. This situation was confirmed by adjacent boreholes and cone soundings, which oftentimes showed dramatic differences in results over short distances. Lateral variability was particularly true for the upper sands and gravels, but applied throughout the entire profile. 3. SHEAR WAVE VELOCITY MEASUREMENTS BY THREE FIELD METHODS Shear wave velocity measurements were performed using three methods: (1) conventional downhole seismic testing with boreholes, (2) downhole testing employing a seismic piezocone (SCPTu), and (3) surface-wave testing with the SASW technique. The downhole methods are intrusive, requiring a drilled hole or a cone sounding, and they measure velocity at a particular location within a limited volume of soil. The SASW method is nonintrusive, and evaluates velocity over a larger volume of soil; however it does require a larger and relatively flat unobstructed area upon which to place surface geophones. SASW results tend to result in a global average velocity, particularly measurements at depth, which require larger geophone spacings, on the order of the sampling depth. In terms of a site response analysis, global measurements are preferred, as they tend to involve more closely the overall site during a seismic event (of course, excluding nonlinearity). Each measurement method as performed in this study is briefly discussed below. Conventional downhole (borehole) seismic testing was carried out with a Geometrics, Geode, 24-channel signal enhancement seismograph. The receiver package contained a Sercel GS14-L3 triaxial, downhole geophone package, which was held against the casing wall by a spring steel carrier that was acoustically decoupled from the suspending cable and the weight that draws the carrier down the borehole. The shear wave source was a large wooden beam approximately 2 m long, which was vertically loaded against the ground for good shear transmission. Shear waves were generated with horizontal impacts from a sledge hammer that stuck each end of the beam in opposite directions to provide both positive and negative wave directions. The compressional wave source was produced by impacting the sledge hammer vertically on a steel plate on the ground surface. The field procedure consisted of lowering the geophone package to the measuring point (generally every 0.5 m) in the borehole and ensuring firm coupling of the triaxial geophone to the borehole wall. The wooden beam was then struck horizontally to produce a shock wave rich in shear wave energy. After recording of the first impact, the source beam was struck horizontally from the opposite end. The shear wave velocity results are discussed and presented below.
Depth (m) Material Type CPT qt (MPa) Note(s) 0 – 20 Sand & Gravel ≈ 10 – 40 1. Ground surface elevation ≈ 12 m
2. Water table depth ≈ 3 m. 20 - 100 Silt & Clay < 11 100 - 102 Glacial Till ≈ 20 – 40
>102 Bedrock n/a
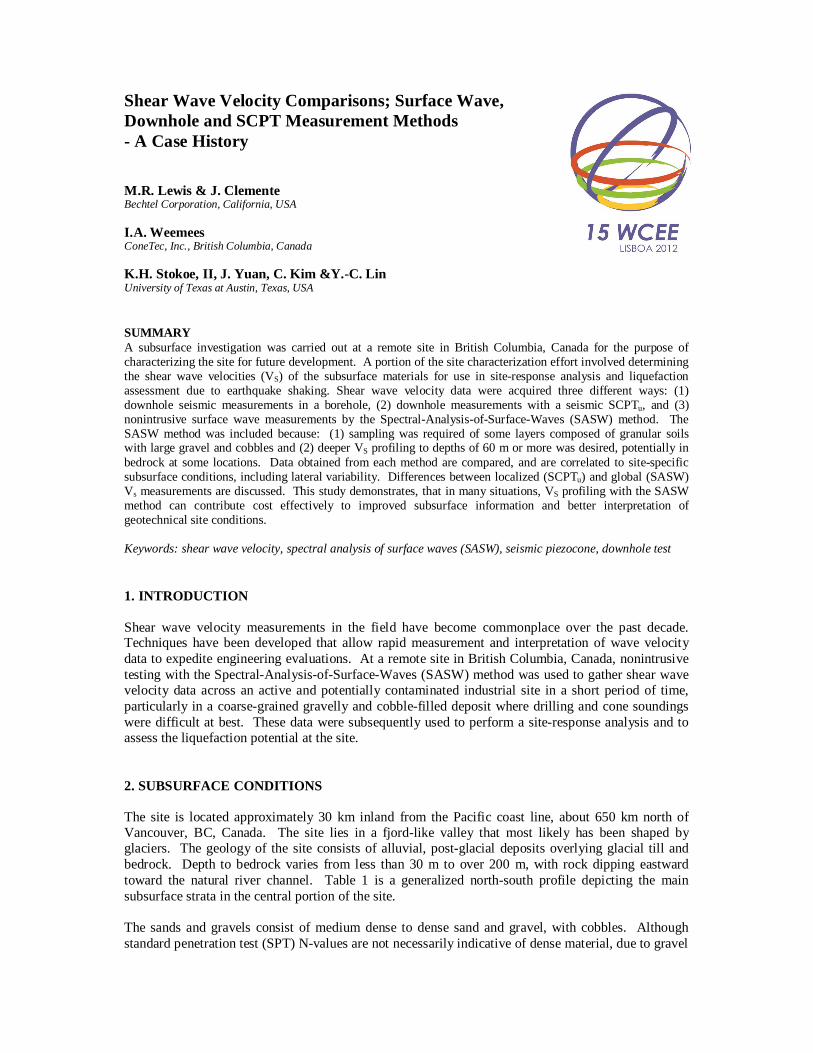
Shear wave velocity measurements were conducted at regular intervals (generally 1m) during the downhole SCPTu test. These measurements were made according to the procedures described by Robertson et.al. (1986). Prior to performing velocity measurements, the rods were decoupled from the CPT rig to avoid transmission of energy down the rods. Shear waves were generated using a hammer striking a steel beam that was coupled to the ground by a hydraulic cylinder under the CPT rig. The hammer striking the beam closed an electrical contact trigger, initiating the recording of the seismic wave traces. The offset of the beam from the cone was taken into account during calculation of the shear wave velocities. At each test depth, multiple impacts were delivered at each end of the beam to enable the operator to check the consistency of the waveforms. The shear wave receiver used was a single horizontal geophone located in the body of the cone penetrometer. The geophone is located approximately 0.2 meters above the cone tip. Seismic records were collected using a sampling rate of 20 kHz, with a total of 5000 points recorded per wave trace. To maintain the desired signal resolution, the input sensitivity (gain) of the receiver was increased with depth. The results of these measurements are presented below and compared with the other VS measurements. Spectral-Analysis-of-Surface-Waves (SASW) testing is a nondestructive, nonintrusive, surface-based technique to obtain in-situ shear wave velocity data for subsurface sediments and rock. The details of the methodology can be found in Stokoe et al, 1994. The method utilizes the dispersive nature of Rayleigh waves propagating through layered materials to determine the shear wave velocity profile at depth. In this context, dispersion arises when surface wave velocity varies with wavelength or frequency. Dispersion in surface wave velocity arises from changing stiffness properties of the soil and rock layers with depth. The dispersion phenomenon is illustrated in Figure 1 for a multilayered solid. A high-frequency surface wave, which propagates with a short wavelength, only stresses material near the exposed surface and thus only samples the properties of the shallow, near-surface material (Figure 1b). A lower-frequency surface wave, which has a longer wavelength, stresses material to a greater depth and thus samples the properties of the shallower and deeper materials (Figure 1c). Spectral analysis is used to separate the waves by frequency and wavelength to determine the experimental ("field") dispersion curve for the site. An analytical, forward - modeling procedure is then used to
Figure 1. Illustration of surface waves with different wavelengths stressing different zones in a layered system
theoretically match the field dispersion curve with a one-dimensional layered system of varying layer stiffnesses and thicknesses (Joh, 1996). The one-dimensional shear wave velocity profile that generates a dispersion curve that most closely matches the field dispersion curve is presented as the shear wave velocity profile at the test location. SASW measurements were carried out at 14 locations across the site. The SASW test locations are listed in Table 2 along with the nearest SPT borehole, SCPTu sounding, and downhole seismic measurements. A typical setup involving one set of 3, 1-Hz geophones in the existing plant area is shown on Figure 2 (note the far geophone in the foreground). The seismic source is a Caterpillar D8 bulldozer (in the background). The VS results are discussed and compared below. 4. SHEAR WAVE VELOCITY RESULTS Figure 3a shows a composite of all 14 SASW sites (solid red lines), 12 SCPTu soundings (solid and/or dotted black lines) and 4 downhole borehole locations (solid blue lines), respectively. (Note: the breaks in lines represent unsampled zones; the dotted portions represent discrete measurements with unsampled zones between them.) Although scatter is seen, the overall comparison is considered good accounting for: (1) site variability, (2) the proximity of one measurement to another, (3) the resolution and uncertainty in the three different measurement techniques, and (4) the volume of soil sampled in each test method. In general, the SCPTu soundings and downhole borehole locations were chosen to be in areas where the subsurface profile consisted of soft silts and clays in order to obtain soil samples for testing these materials and to correlate field results (SCPTu parameters and N-values) with strength and compressibility parameters. In contrast, the SASW locations were purposely spread throughout the overall site to develop a spatial range of subsurface profiles for site response analysis. Thus, the range for the SASW data shown in Figure 3a is more pronounced than that of the SCPTu soundings and the downhole borehole locations. In addition, the large VS range in the SASW VS profiles results from these tests also sampling weathered and unweathered bedrock at six locations. In terms of comparing the VS profiles from the three seismic methods at individual sites, one example is shown in Figure 3b. The site is SASW 6 listed in Table 2. As seen in the figure, the three profiles are very similar in the ranges from elevation 0 to about elevation -55 m. There are differences in the Table 2. SASW Site Information And Near-by SPT, SCPTu And Downhole Tests
SASW Site
Elevation (m)
Groundwater Depth (m)
Nearest SPT Borehole
Nearest SCPTu Sounding
Nearest Downhole Borehole
1 11.9 3-4 B10-07 n/a n/a 2 9.9 3-4 B09-02 SCPTu10-09 n/a 3 10.6 3-4 B10-26 SCPTu10-20 & 26 BK08-05 4 10.0 3-4 B10-09 SCPTu10-01 n/a 5 10.0 3-4 B09-05 SCPTu10-05 n/a 6 10.9 3-4 B10-19 SCPTu09-18B BK07-17 7 11.2 3-4 B10-28 SCPTu09-17C BK07-12 8 13.4 3-4 B10-60 n/a n/a 9 13.1 3-4 B09-05 SCPTu10-06 n/a
10 16.4 3-4 B10-49 n/a BK07-05 11(1) 22.9 3-4 n/a n/a n/a 12 18.9 3-4 B10-46 & 47 n/a n/a 13 9.0 3-4 B10-14 SCPTu10-21 n/a 14 8.6 3-4 B10-05 & 17 n/a n/a
(1) SASW location is not onsite, but was carried where bedrock is shallow; testing mainly for correlation purposes.
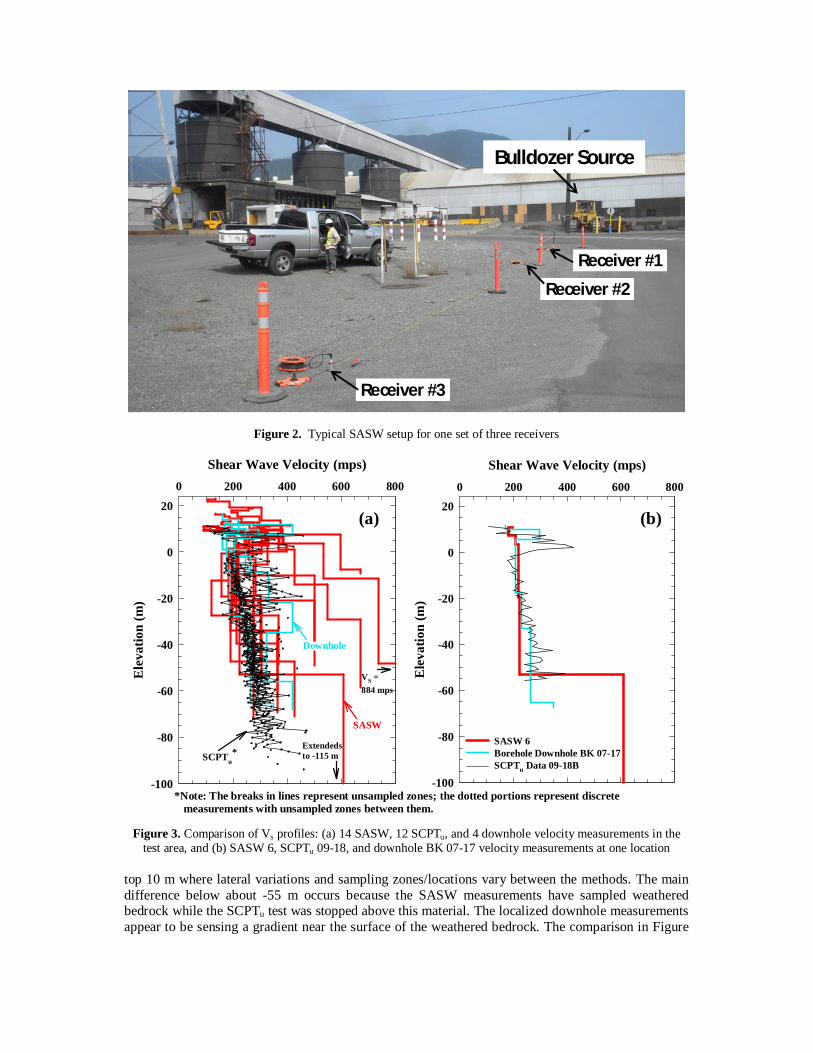
Figure 2. Typical SASW setup for one set of three receivers
Figure 3. Comparison of Vs profiles: (a) 14 SASW, 12 SCPTu, and 4 downhole velocity measurements in the test area, and (b) SASW 6, SCPTu 09-18, and downhole BK 07-17 velocity measurements at one location
top 10 m where lateral variations and sampling zones/locations vary between the methods. The main difference below about -55 m occurs because the SASW measurements have sampled weathered bedrock while the SCPTu test was stopped above this material. The localized downhole measurements appear to be sensing a gradient near the surface of the weathered bedrock. The comparison in Figure
Shear Wave Velocity (mps)0 200 400 600 800
Ele
vatio
n (m
)
-100
-80
-60
-40
-20
0
20
VS = 884 mps
Extendeds to -115 m
SASW
SCPTu*
Downhole
Shear Wave Velocity (mps)0 200 400 600 800
Ele
vatio
n (m
)
-100
-80
-60
-40
-20
0
20
SASW 6Borehole Downhole BK 07-17SCPTu Data 09-18B
Bulldozer Source
Receiver #1
Receiver #2
Receiver #3
(a) (b)
*Note: The breaks in lines represent unsampled zones; the dotted portions represent discrete measurements with unsampled zones between them.
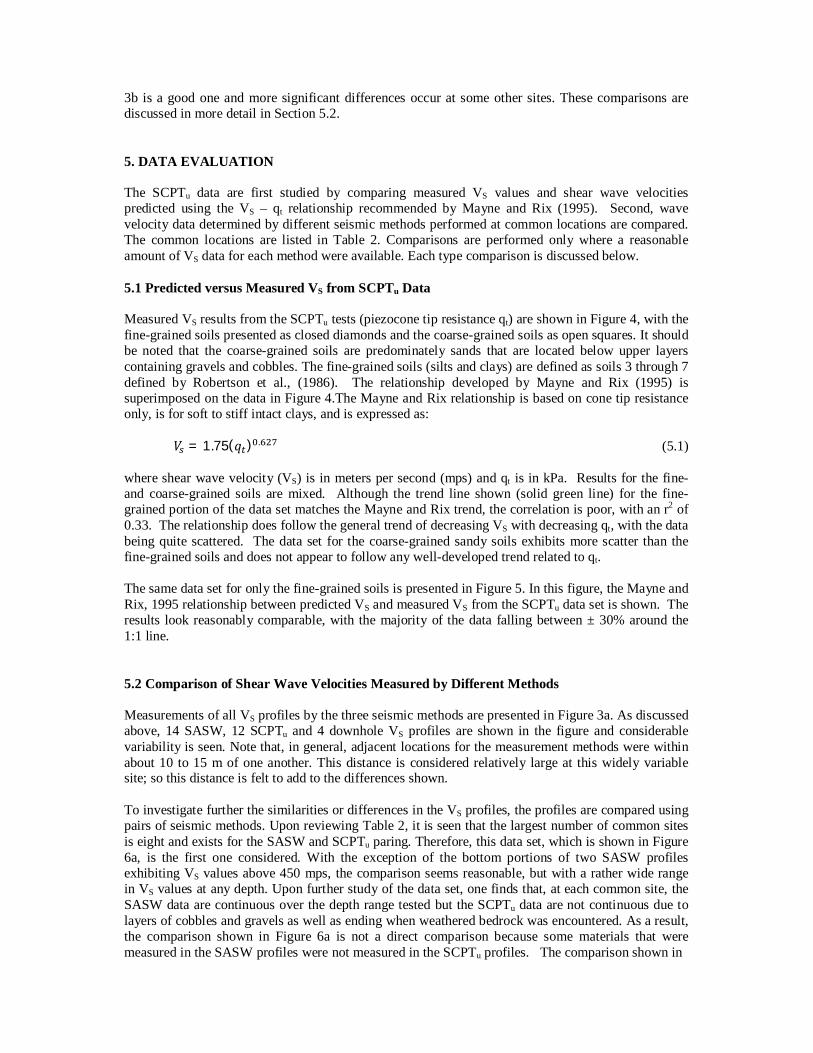
3b is a good one and more significant differences occur at some other sites. These comparisons are discussed in more detail in Section 5.2. 5. DATA EVALUATION The SCPTu data are first studied by comparing measured VS values and shear wave velocities predicted using the VS – qt relationship recommended by Mayne and Rix (1995). Second, wave velocity data determined by different seismic methods performed at common locations are compared. The common locations are listed in Table 2. Comparisons are performed only where a reasonable amount of VS data for each method were available. Each type comparison is discussed below. 5.1 Predicted versus Measured VS from SCPTu Data Measured VS results from the SCPTu tests (piezocone tip resistance qt) are shown in Figure 4, with the fine-grained soils presented as closed diamonds and the coarse-grained soils as open squares. It should be noted that the coarse-grained soils are predominately sands that are located below upper layers containing gravels and cobbles. The fine-grained soils (silts and clays) are defined as soils 3 through 7 defined by Robertson et al., (1986). The relationship developed by Mayne and Rix (1995) is superimposed on the data in Figure 4.The Mayne and Rix relationship is based on cone tip resistance only, is for soft to stiff intact clays, and is expressed as: ௦ܸ = .ଶ (5.1)(௧ݍ)1.75 where shear wave velocity (VS) is in meters per second (mps) and qt is in kPa. Results for the fine- and coarse-grained soils are mixed. Although the trend line shown (solid green line) for the fine-grained portion of the data set matches the Mayne and Rix trend, the correlation is poor, with an r2 of 0.33. The relationship does follow the general trend of decreasing VS with decreasing qt, with the data being quite scattered. The data set for the coarse-grained sandy soils exhibits more scatter than the fine-grained soils and does not appear to follow any well-developed trend related to qt. The same data set for only the fine-grained soils is presented in Figure 5. In this figure, the Mayne and Rix, 1995 relationship between predicted VS and measured VS from the SCPTu data set is shown. The results look reasonably comparable, with the majority of the data falling between ± 30% around the 1:1 line. 5.2 Comparison of Shear Wave Velocities Measured by Different Methods Measurements of all VS profiles by the three seismic methods are presented in Figure 3a. As discussed above, 14 SASW, 12 SCPTu and 4 downhole VS profiles are shown in the figure and considerable variability is seen. Note that, in general, adjacent locations for the measurement methods were within about 10 to 15 m of one another. This distance is considered relatively large at this widely variable site; so this distance is felt to add to the differences shown. To investigate further the similarities or differences in the VS profiles, the profiles are compared using pairs of seismic methods. Upon reviewing Table 2, it is seen that the largest number of common sites is eight and exists for the SASW and SCPTu paring. Therefore, this data set, which is shown in Figure 6a, is the first one considered. With the exception of the bottom portions of two SASW profiles exhibiting VS values above 450 mps, the comparison seems reasonable, but with a rather wide range in VS values at any depth. Upon further study of the data set, one finds that, at each common site, the SASW data are continuous over the depth range tested but the SCPTu data are not continuous due to layers of cobbles and gravels as well as ending when weathered bedrock was encountered. As a result, the comparison shown in Figure 6a is not a direct comparison because some materials that were measured in the SASW profiles were not measured in the SCPTu profiles. The comparison shown in
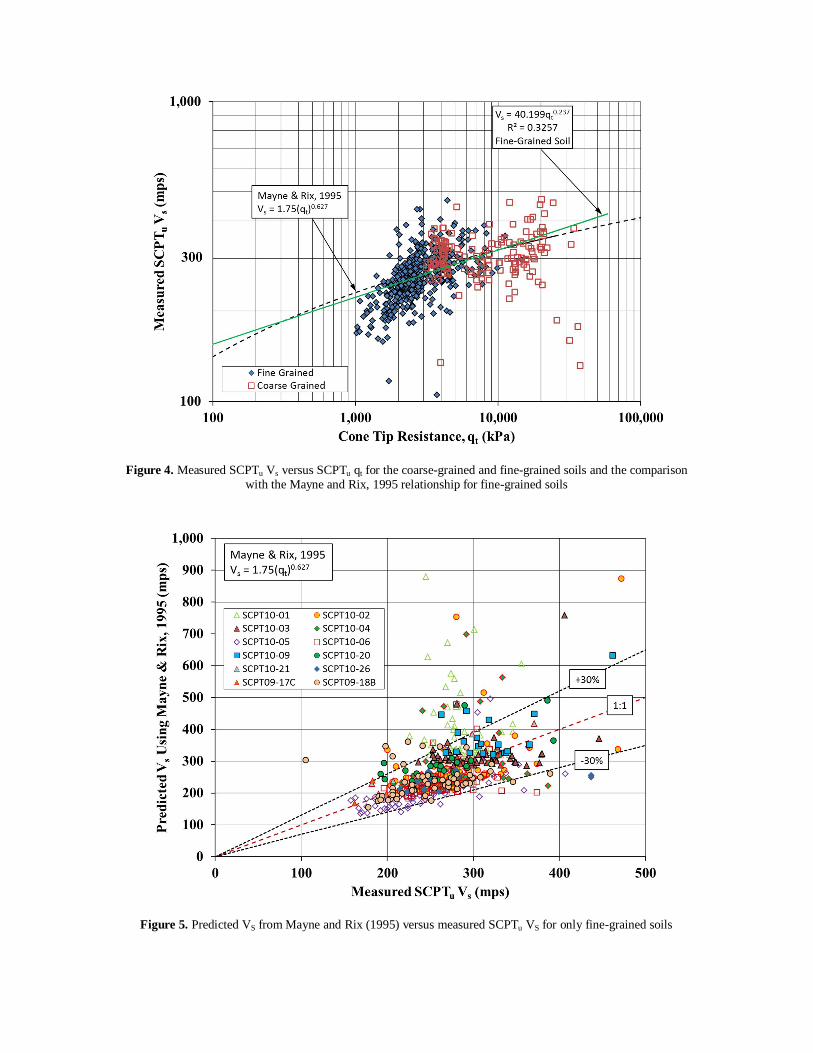
Figure 4. Measured SCPTu Vs versus SCPTu qt for the coarse-grained and fine-grained soils and the comparison with the Mayne and Rix, 1995 relationship for fine-grained soils
Figure 5. Predicted VS from Mayne and Rix (1995) versus measured SCPTu VS for only fine-grained soils
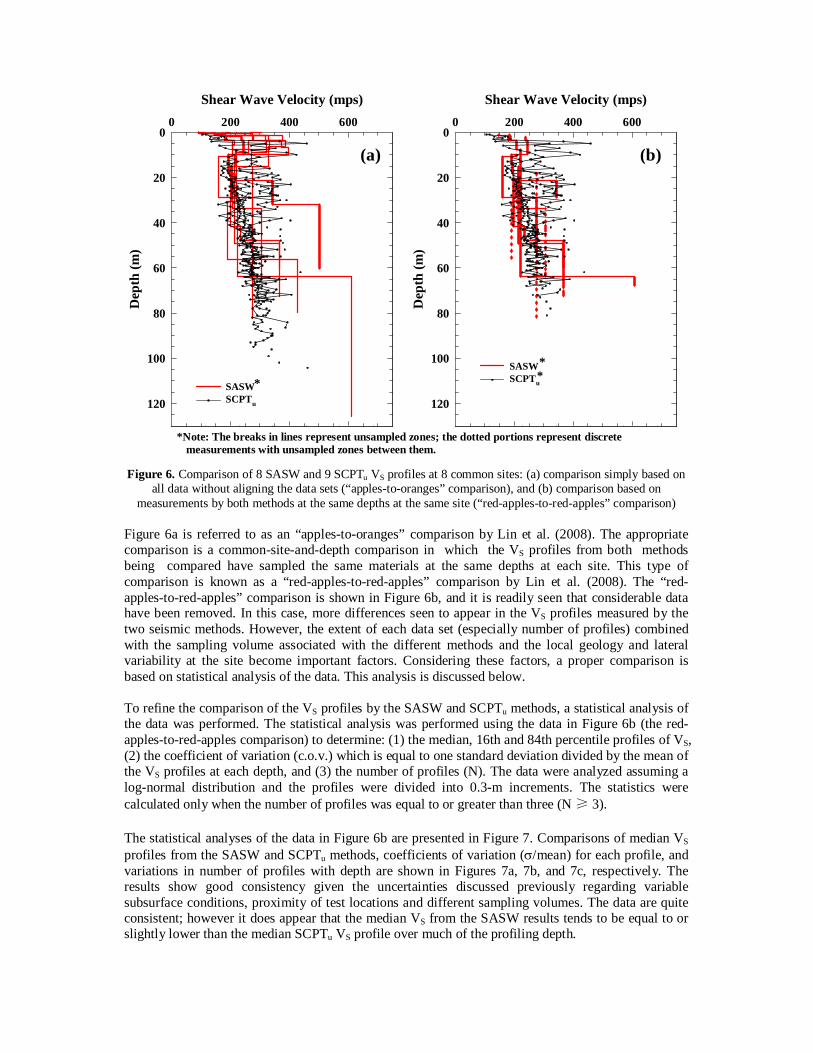
Figure 6. Comparison of 8 SASW and 9 SCPTu VS profiles at 8 common sites: (a) comparison simply based on all data without aligning the data sets (“apples-to-oranges” comparison), and (b) comparison based on
measurements by both methods at the same depths at the same site (“red-apples-to-red-apples” comparison) Figure 6a is referred to as an “apples-to-oranges” comparison by Lin et al. (2008). The appropriate comparison is a common-site-and-depth comparison in which the VS profiles from both methods being compared have sampled the same materials at the same depths at each site. This type of comparison is known as a “red-apples-to-red-apples” comparison by Lin et al. (2008). The “red-apples-to-red-apples” comparison is shown in Figure 6b, and it is readily seen that considerable data have been removed. In this case, more differences seen to appear in the VS profiles measured by the two seismic methods. However, the extent of each data set (especially number of profiles) combined with the sampling volume associated with the different methods and the local geology and lateral variability at the site become important factors. Considering these factors, a proper comparison is based on statistical analysis of the data. This analysis is discussed below. To refine the comparison of the VS profiles by the SASW and SCPTu methods, a statistical analysis of the data was performed. The statistical analysis was performed using the data in Figure 6b (the red-apples-to-red-apples comparison) to determine: (1) the median, 16th and 84th percentile profiles of VS, (2) the coefficient of variation (c.o.v.) which is equal to one standard deviation divided by the mean of the VS profiles at each depth, and (3) the number of profiles (N). The data were analyzed assuming a log-normal distribution and the profiles were divided into 0.3-m increments. The statistics were calculated only when the number of profiles was equal to or greater than three (N ≥ 3). The statistical analyses of the data in Figure 6b are presented in Figure 7. Comparisons of median VS profiles from the SASW and SCPTu methods, coefficients of variation (/mean) for each profile, and variations in number of profiles with depth are shown in Figures 7a, 7b, and 7c, respectively. The results show good consistency given the uncertainties discussed previously regarding variable subsurface conditions, proximity of test locations and different sampling volumes. The data are quite consistent; however it does appear that the median VS from the SASW results tends to be equal to or slightly lower than the median SCPTu VS profile over much of the profiling depth.
Shear Wave Velocity (mps)0 200 400 600
Dep
th (m
)0
20
40
60
80
100
120SASWSCPTu
Shear Wave Velocity (mps)0 200 400 600
Dep
th (m
)
0
20
40
60
80
100
120
SASWSCPTu
(a) (b)
*Note: The breaks in lines represent unsampled zones; the dotted portions represent discrete measurements with unsampled zones between them.
* **
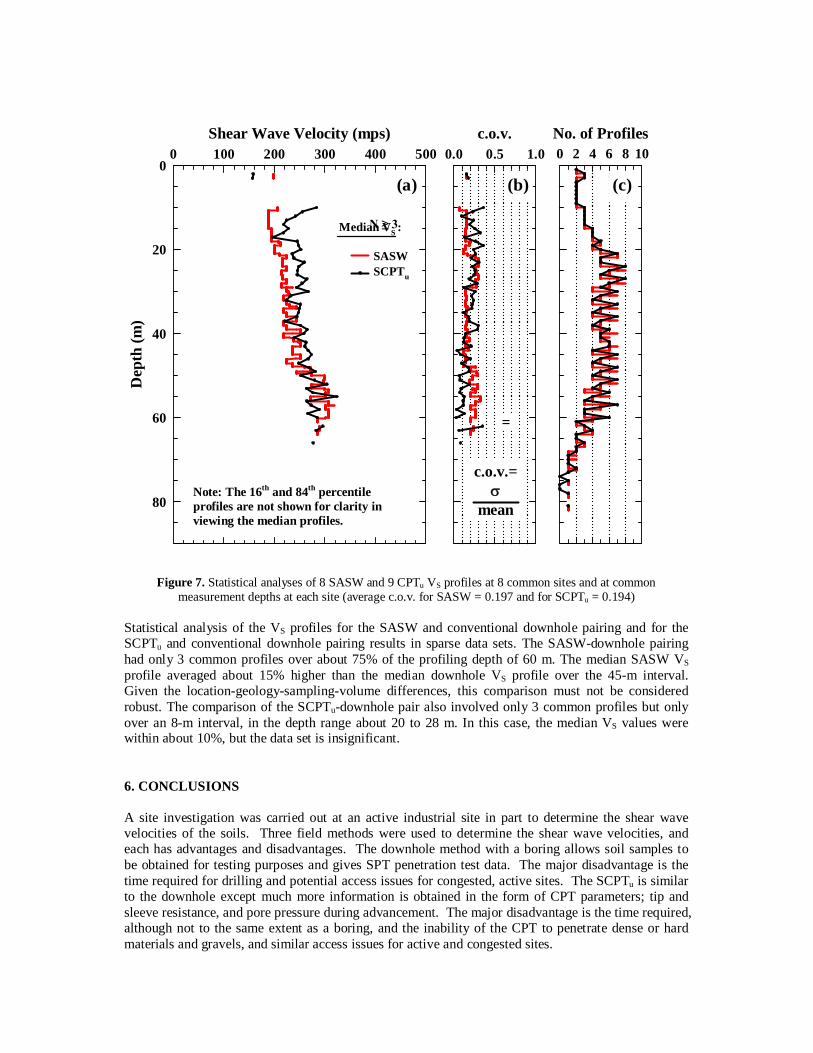
Figure 7. Statistical analyses of 8 SASW and 9 CPTu VS profiles at 8 common sites and at common measurement depths at each site (average c.o.v. for SASW = 0.197 and for SCPTu = 0.194)
Statistical analysis of the VS profiles for the SASW and conventional downhole pairing and for the SCPTu and conventional downhole pairing results in sparse data sets. The SASW-downhole pairing had only 3 common profiles over about 75% of the profiling depth of 60 m. The median SASW VS profile averaged about 15% higher than the median downhole VS profile over the 45-m interval. Given the location-geology-sampling-volume differences, this comparison must not be considered robust. The comparison of the SCPTu-downhole pair also involved only 3 common profiles but only over an 8-m interval, in the depth range about 20 to 28 m. In this case, the median VS values were within about 10%, but the data set is insignificant. 6. CONCLUSIONS A site investigation was carried out at an active industrial site in part to determine the shear wave velocities of the soils. Three field methods were used to determine the shear wave velocities, and each has advantages and disadvantages. The downhole method with a boring allows soil samples to be obtained for testing purposes and gives SPT penetration test data. The major disadvantage is the time required for drilling and potential access issues for congested, active sites. The SCPTu is similar to the downhole except much more information is obtained in the form of CPT parameters; tip and sleeve resistance, and pore pressure during advancement. The major disadvantage is the time required, although not to the same extent as a boring, and the inability of the CPT to penetrate dense or hard materials and gravels, and similar access issues for active and congested sites.
Shear Wave Velocity (mps)0 100 200 300 400 500
Dep
th (m
)
0
20
40
60
80
SASWSCPTu
c.o.v.0.0 0.5 1.0
No. of Profiles0 2 4 6 8 10
Median VS :
c.o.v.=
meanNote: The 16th and 84th percentile profiles are not shown for clarity in viewing the median profiles.
=
N ≥ 3
(a) (b) (c)
The Spectral-Analysis-of-Surface-Waves (SASW) method is a nonintrusive method for determining shear wave velocity profiles and thus, stiffness of subsurface materials. As part of investigation, SASW tests were performed at 14 sites located around the active industrial site in British Columbia, Canada. The major advantages are the speed and cost effectiveness at which multiple sites can be evaluated compared to either a borehole or SCPT. In this case, the 14 SASW sites were evaluated in 3 days, while it generally took one day for a SCPTu and 3 days for a borehole, which both include more than simply the velocity measurements. The major disadvantage is the lack of soil and rock samples. Comparisons were made of shear wave velocities and stratigraphy between SASW, conventional downhole with a standard borehole, and downhole from SCPTu soundings. The results indicated: (1) the borings showed significant lateral variability of material at some test site, (2) SASW testing with a large bulldozer as the seismic source, within the active industrial complex, allowed VS profiling to depths of around 60 to 120 m, (3) statistical analysis of the properly aligned data sets is necessary to meaningfully compare Vs profiles determined by different seismic methods, and (4) good agreement was generally observed between the median SASW and SCPTu VS profiles for common site and common depth comparisons, a red-apples-to-red-apples comparison of the data set. It is interesting to observe that, in this data set of 14 SASW, 12 SCPTu and 4 downhole VS profiles, only the paring of the SASW and SCPTu VS profiles produced a sufficient number of measurements to be statistically analyzed. ACKNOWLEDGEMENT The authors wish to express their appreciation to the Bechtel Corporation, ConeTec, Inc. and the University of Texas at Austin for the opportunity to share this information and for encouraging the authors to publish case history information for the benefit of the industry. REFERENCES Lin, Y.-C, Stokoe, K. H., II, and Rosenblad, B. L., (2008), “Variability in VS Profiles and Consistency between
Seismic Profiling Methods: A Case Study in Imperial Valley, California”, the 3rd International Conference on Site Characterization (ISC'3), Taipei, Taiwan. April, 2008.
Joh, S.-H. (1996). “Advances in the Data Interpretation Technique for Spectral- Analysis of-Surface-Waves (SASW) Measurements,” Ph.D. Dissertation, The University of Texas at Austin, 240 pgs.
Mayne, P.W., and Rix, G.J. (1995). Correlations between Shear Wave Velocity and Cone Tip Resistance in Clays. Soils and Foundations. Vol. 35, No. 2. Pp 107-110.
Robertson, P.K., Campanella, R.G., Gillespie, D., and Greig, J. (1986). Use of Piezometer Cone Data. Use of In-Situ Tests in Geotechnical Engineering. American Society of Civil Engineers GSP 6: pp 1263-1280.
Stokoe, K.H., II, Wright, S.G., Bay, J.A. and J.M. Roesset (1994). “Characterization of Geotechnical Sites by SASW Method,” ISSMFE Technical Committee 10 for XIII ICSMFE, Geophysical Characteristics of Sites, A.A. Balkema Publishers/Rotterdam & Brookfield, Netherlands, pp. 785-816.