sharks of the open ocean || why are bayesian methods useful for the stock assessment of sharks?
TRANSCRIPT
Chapter 31
Why Are Bayesian Methods Useful for the Stock Assessment of Sharks?
Murdoch K. McAllister, Ellen K. Pikitch and Elizabeth A. Babcock
Abstract
Ichthyologists alerted fi shery managers three decades ago to the low reproductive capacity of sharks and their high susceptibility to overexploitation. In many instances, it remains impossible to confi dently apply current fi sheries stock assessment methods to shark popu-lations and to provide compelling scientifi c evidence to motivate conservation action where it is needed. This is due to a variety of reasons, including a paucity of biological data and fi shery-independent times-series of abundance for sharks, as well as substantial differences in biology between sharks and other exploited fi sh species. In this chapter, we review some of the goals and requirements of stock assessment methods for sharks, and outline why Bayesian methods may be useful. When used in conjunction with existing modeling meth-ods, the Bayesian approach could help strengthen the scientifi c support needed for design-ing precautionary fi shery management policies for sharks.
Key words: Bayesian, stock assessment, demographic methods, catch per unit effort, population dynamics, Bayes’ theorem.
Introduction
Recent increases in catches of sharks in many coastal and pelagic fi sheries have raised con-cerns about their conservation (NMFS, 1996; Walker, 1998; Camhi, 2008). These concerns have stimulated increased interest in assessing the status of shark populations and develop-ing management approaches to prevent further decline and to rehabilitate depleted popula-tions (NMFS, 1998; Punt and Walker, 1998; Punt et al., 2000; Kleiber et al., 2001; Babcock and Nakano, 2008). Compared with teleosts, sharks have received little attention until recently from fi shery managers and stock assessment scientists. Information that is crucial for the conservation of many shark populations is currently lacking, and the reproductive, ecological, and migratory characteristics of many sharks are poorly known. Furthermore, few reliable time-series of observations on the abundance of shark populations have been collected, and few stock assessment methods have been developed and applied to provide scientifi c advice to fi shery managers.
Sharks of the Open Ocean: Biology, Fisheries and Conservation. Edited by M. D. Camhi, E. K. Pikitch and E. A. Babcock
© 2008 Blackwell Publishing Ltd. ISBN: 978-0632-05995-9
352 Sharks of the Open Ocean
Research over the last 30 years has alerted fi shery managers to the low reproductive capacity of sharks and their susceptibility to overexploitation (e.g., Holden, 1977; Sminkey and Musick, 1995; Cortés, 1999). However, it is diffi cult, using the existing sparse data, to confi dently apply current assessment methods to provide compelling scientifi c evidence that will motivate conservation action where it is needed. This chapter reviews some of the goals and requirements of stock assessment methods for sharks, and outlines why Bayesian meth-ods can be appropriate for these assessments. We argue that, when used in conjunction with other modeling methods, such as demographic modeling (Cortés, 1999, 2008; Au et al., 2008), Bayesian stock assessments of sharks could help to strengthen the scientifi c support needed for designing precautionary fi shery management policies for sharks (FAO, 1995).
What should be the main goal of stock assessment for sharks?
According to Hilborn and Walters (1992), the main goal of stock assessment should be to inform decision makers of the potential consequences of different management actions. This requires using the best available scientifi c information and data to evaluate the potential con-sequences of alternative management actions, communicating these consequences to man-agers, and informing managers of important uncertainties (Hilborn et al., 1993; McAllister and Kirkwood, 1998a).
Table 31.1 lists considerations in each of the various phases of a stock assessment that may help in formulating scientifi c advice for fi sheries management. Given the general pau-city of appropriate data and biological research on pelagic sharks, and because data col-lection and analysis are not well coordinated among countries, meeting even a portion of these considerations would be onerous for most shark stocks. In several instances, however, stock assessments of a shark population or sets of populations have been undertaken, and will be in the future, because of recently formulated research initiatives (e.g., Anonymous, 1999) and legislative requirements, and because of the substantial economic and other val-ues at stake in the conservation and exploitation of sharks (NMFS, 1996, 1998; Walker et al., 2008). The next section briefl y reviews some of the stock assessment methods that have been applied to sharks.
How has advice been provided for shark fi shery management?
Demographic analysis
One of the most common analytical methods applied to help formulate shark fi shery man-agement advice is demographic analysis (Krebs, 1985; Fowler, 1988; Cortés, 1999, 2008; Au et al., 2008). This requires as inputs some of the basic population dynamics para -meters, such as the rate of natural mortality at each life stage, the duration of each life stage (e.g., immature and mature), and the fecundity or number of newly born offspring produced per female at each age. All of these inputs should be those expected when there is no density dependence, that is, when population abundance is very low. Quite conveniently, this approach does not require time-series observations of relative abundance. A variety of
W
hy Are B
ayesian Methods U
seful for Stock Assessm
ent?
353
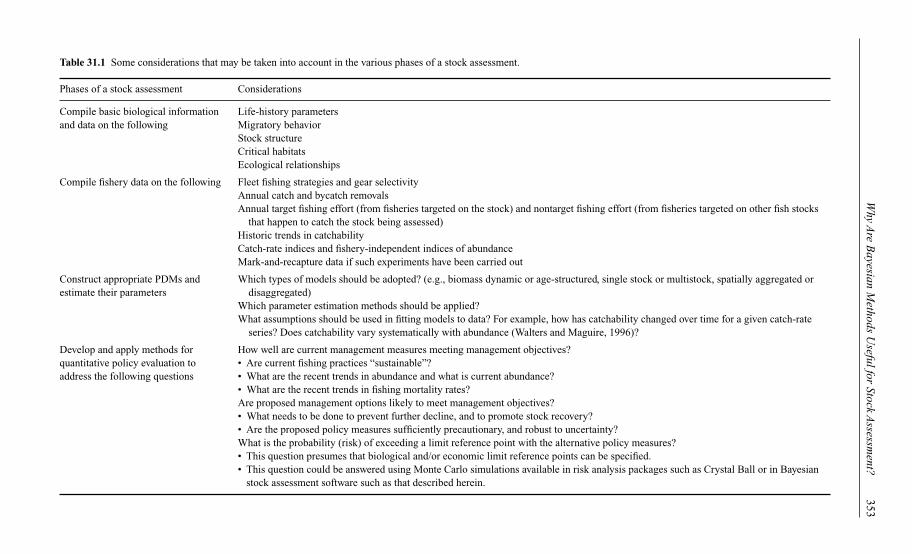
Table 31.1 Some considerations that may be taken into account in the various phases of a stock assessment.
Phases of a stock assessment Considerations
Compile basic biological information Life-history parametersand data on the following Migratory behavior Stock structure Critical habitats Ecological relationships
Compile fi shery data on the following Fleet fi shing strategies and gear selectivity Annual catch and bycatch removals Annual target fi shing effort (from fi sheries targeted on the stock) and nontarget fi shing effort (from fi sheries targeted on other fi sh stocks
that happen to catch the stock being assessed) Historic trends in catchability Catch-rate indices and fi shery-independent indices of abundance Mark-and-recapture data if such experiments have been carried out
Construct appropriate PDMs and Which types of models should be adopted? (e.g., biomass dynamic or age-structured, single stock or multistock, spatially aggregated or estimate their parameters disaggregated) Which parameter estimation methods should be applied? What assumptions should be used in fi tting models to data? For example, how has catchability changed over time for a given catch-rate
series? Does catchability vary systematically with abundance (Walters and Maguire, 1996)?
Develop and apply methods for How well are current management measures meeting management objectives?quantitative policy evaluation to • Are current fi shing practices “sustainable”?address the following questions • What are the recent trends in abundance and what is current abundance? • What are the recent trends in fi shing mortality rates? Are proposed management options likely to meet management objectives? • What needs to be done to prevent further decline, and to promote stock recovery? • Are the proposed policy measures suffi ciently precautionary, and robust to uncertainty? What is the probability (risk) of exceeding a limit reference point with the alternative policy measures? • This question presumes that biological and/or economic limit reference points can be specifi ed. • This question could be answered using Monte Carlo simulations available in risk analysis packages such as Crystal Ball or in Bayesian
stock assessment software such as that described herein.
354 Sharks of the Open Ocean
quantitative methods, ranging from very simple life table analysis (Krebs, 1985; Begon et al., 1996) to more sophisticated demographic methods (Cortés, 1999, 2008; Quinn and Deriso, 1999; Au et al., 2008; Smith et al., 2008), can be applied to these various inputs.
Most commonly, these methods are applied to estimate the intrinsic rate of increase of the population, r, which refl ects the maximum per capita rate of increase in the popula-tion at very low population abundance (Krebs, 1985; Begon et al., 1996). This parameter provides a simple indication of a population’s potential resilience to exploitation. Because of uncertainties and natural random variation, probabilistic estimates that accounted for estimation uncertainties would be most useful for management purposes (Cortés, 1999).
Demographic analyses can also indicate the realized rate of increase of a population, if additional sources of mortality such as exploitation are also present (Cortés, 1999; Au et al., 2008; Smith et al., 2008). The measures provided, however, typically refl ect predic-tions under equilibrium conditions and thus cannot be used to assess current trends in abun-dance or the potential population responses to changes in fi shery regulations. This method can also be used as an independent check for other types of population analysis. Perhaps the most diffi cult aspect of this method is obtaining estimates of the rates of natural mortality at age. However, for some sharks, mark-and-recapture experiments have been successfully executed and can be applied for this purpose (NMFS, 1998; Punt et al., 2000).
Fitting surplus production models to times-series of observations on relative abundance
Nonequilibrium surplus production models (SPMs) have been applied to many teleosts and marine mammals. These models can be used to estimate recent trends in abundance and to evaluate the potential consequences of alternative management actions. However, SPMs have been applied in relatively few instances with sharks (Xiao, 1995; NMFS, 1996, 1998; Cortés et al., 2002; Babcock and Nakano, 2008).
Some have questioned whether models that aggregate age groups into one category of exploitable biomass can adequately model the population dynamics of long-lived, late-maturing individuals. Extensive simulation work conducted by the International Whaling Commission (IWC) indicated that age-aggregated models often perform no worse than age-disaggregated models in evaluations of proposed management procedures for harvest-ing of whale populations (IWC, 1992), which are similar in life-history characteristics to many shark species. However, in the IWC work, the stock assessment models were fi tted to absolute abundance data, rather than relative abundance data (the latter are more common), and it is questionable whether the results can be generalized to shark fi sheries manage-ment. In simulation evaluations of stock assessment methods applied to moderately long-lived teleosts, when the data to which models were fi tted included relative abundance data, simple, age-aggregated models have sometimes been found to provide better estimation performance than age-disaggregated models (Ludwig and Walters, 1985; Punt, 1993). This is partly because age-structured models require more parameters than SPMs, so there is more scope for errors in parameter inputs to cause bias in estimates of abundance.
Estimation of SPM parameters requires a time-series of total catch removals, prefera-bly from the start of the fi shery, and at least one time-series of relative abundance. Despite their simplicity, SPMs can be used to formulate sophisticated management procedures that
Why Are Bayesian Methods Useful for Stock Assessment? 355
incorporate limit and target biological reference points such as maximum sustainable yield (MSY), as well as risk-based reference points (McAllister and Kirkwood, 1998b; McAllister et al., 2001). They cannot be used to evaluate the potential consequences of management measures that affect specifi c age groups, such as gear restrictions, size limits, and marine reserves in pupping and nursery areas.
Age-structured, length-structured, or stage-structured modeling
The approach of fi tting age-structured and length-structured (or, more generally, stage-structured) models to relative abundance indices and tagging and/or catch-age or length frequency data has been even more rarely applied to sharks than the above-mentioned approaches (Punt and Walker, 1998; Punt et al., 2000; Kleiber et al., 2001; Cortés et al., 2002; Apostolaki, 2003). This is primarily because of onerous data requirements, since considerable age- or stage-structured information and data on the population and fi shery need to be obtained. If such data were available, it would appear to be the most desirable approach for shark stock assessment. Many sharks are long-lived and migratory and can be caught in different fi sheries at different life stages (e.g., Punt et al., 2000; Apostolaki, 2003). While age-aggregated models permit only the exploration of the effects of alternative total catch removals from the population, age-structured models permit a more refi ned analysis. Bias in the evaluation of historic trends in abundance can be reduced because differential shifts in age structure due to variability in recruitment and differential vulnerability at age to exploitation can be accounted for with age-structured models. The impacts on potential future stock abundance of changes in regulations for different fi sheries that affect differ-ent life stages of a population, for example, changes in gear regulations and time and area closures that affect different age classes, can be evaluated (Apostolaki, 2003). However, it is generally more diffi cult to quantitatively evaluate uncertainties in parameter values and model structure with more complex models (McAllister and Kirchner, 2002).
Some problems encountered with conventional assessment methods
As indicated above, there are a number of diffi culties in applying the various stock assess-ment methods to sharks. Five of these are outlined here.
Compiling basic biological and fi shery data
For most shark populations, few resources have been allocated for stock assessment research. Bias in estimates of abundance can be reduced by utilizing time-series of fi sheries-independent indices of abundance from standardized surveys, yet because of the large costs of implementing such surveys, few time-series exist. This leaves only time-series of com-mercial catch rates for both target and bycatch fi sheries for sharks, and in many cases even these are not available. Because of uncertainty in how catchability may change with abun-dance or other factors, the catch-rate data, even when standardized for the seasons and areas fi shed, can be very diffi cult to interpret and sometimes unusable as indices of abundance.
Catch-rate data may not be usable as abundance indices if the following processes infl u-ence catch rates: the extent of gear saturation by target species, which can affect catch rates
356 Sharks of the Open Ocean
of bycatch species such as sharks and can change owing to changes in target species abun-dance; changes in the species groupings targeted; changes in gear and electronic technology; systematic temporal changes in the areas fi shed; and range contraction of the target popula-tion. If any of these conditions affect catchability, conventional stock assessment methods cannot be used with these data. In some cases, it may be appropriate to consider a variety of different shapes for the catch per unit effort (CPUE) versus abundance relationship (Walters and Maguire, 1996) and different hypotheses about the impact of learning and gear technol-ogy advances on catchability (Babcock and McAllister, 2004).
Tagging data obtained through mark-and-recapture experiments, though costly, have proven useful in evaluating the population biology of some sharks (Punt et al., 2000). For the southern Australian school shark (Galeorhinus galeus, Triakidae), these have permit-ted a sophisticated age-structured stock assessment that modeled separately the males and females in two subpopulations with different migratory patterns through eight different spatial zones (Walker et al., 2008).
Integrating different types of data and results
For many shark fi sheries, only a few sources of information are available, such as several life-history parameters and some catch and catch-rate data. Not enough information and data may be available for an age-structured stock assessment, but suffi cient information may be available to implement the surplus production and demographic methods separately. For various reasons highlighted below, it would be of interest to integrate both sets of results in providing management advice. Yet conventional assessment methodologies do not provide a systematic approach for doing so.
Reconciling contradictory data, information, and results
Very often in stock assessment, different sources of information or results from different methods yield contradictory results (Schnute and Hilborn, 1993). For example, different time-series of abundance observations might refl ect contradictory trends in abundance, or different methods might provide very different estimates of stock status and resilience to exploitation (Cortés et al., 2002). Current methods do not provide systematic approaches to dealing with such ambiguities. The provision of management advice can then become controversial, with the most appropriate action depending on which analysis or source of information is applied. For sharks, this is particularly problematic, because data are sparse and obtaining additional data series to resolve contradictions would be diffi cult. Moreover, because sharks are slow-growing and long-lived and have low fecundity, it would often take too long to gather further data that might help to resolve these ambiguities. Experimental management approaches that might be feasible for shorter-lived, more fecund species (Sainsbury, 1988) may be unacceptable for sharks.
Thoroughly accounting for uncertainty
Monte Carlo simulation methods are commonly applied in a variety of approaches to account for uncertainty in the values of stock assessment model parameters (Restrepo et al.,
Why Are Bayesian Methods Useful for Stock Assessment? 357
1992; Punt and Hilborn, 1997; McAllister et al., 1999). However, relatively little attention has been devoted to dealing with structural uncertainties, that is, uncertainties in the struc-tural formulation of models (Patterson, 1999; McAllister and Kirchner, 2002). For example, there is often considerable uncertainty over the functional form for the quantity of catch-ability. In some situations we may ask whether catchability varies systematically with abun-dance (Walters and Maguire, 1996), or whether catchability increases only with advances in gear technology, learning, and increased targeting of sharks due to increased demand for shark fi ns. If only catch and relative abundance data are present, structurally different mod-els for catchability could be formulated for these two alternative hypotheses (McAllister and Kirchner, 2002). The sparseness of data would not permit them to be incorporated into a single nested model because the resulting model would be overparameterized.
It is often the case that the best management action to take depends on which of the models is applied. Without formal scientifi c guidance on how to give weightings to results from the alternative assumptions, managers usually apply their own weightings. These may deviate considerably from scientifi c considerations. For example, managers weighted out-comes from 20 alternative model specifi cations for school shark equally without consid-ering the scientifi c plausibility of the alternatives (Punt et al., 2000). In other instances, managers have discarded the most pessimistic alternatives without giving any explicit jus-tifi cation (e.g., ICCAT, 1999). Scientists need more empirically based methods to evaluate scientifi c evidence so that they can in turn provide more empirically based objective guid-ance to managers on how to weight such alternatives (Butterworth et al., 1996; McAllister et al., 1999; McAllister and Kirchner, 2002).
Conveying uncertainty in a meaningful way to decision makers
It is becoming more widely recognized that uncertainties in model results should be con-veyed using probabilities and decision analytic methods (Francis and Shotton, 1997; McAllister et al., 1999). Although the basic elements of decision analysis have been widely applied in many stock assessments, different methods have been applied to calculate proba-bilities for model parameters, with varying degrees of statistical rigor (see McAllister et al., 1999, for a review). Data for sharks are generally more diffi cult to interpret (e.g., because sharks may be captured as bycatch rather than as target species) than data for other species, and thus uncertainty in decision making is a particularly serious issue for shark fi sheries management. Therefore, decision analytic methods that deal explicitly with uncertainty are well suited for shark management. In stock assessments for sharks, probabilistic and deci-sion analytic approaches have been applied only recently (NMFS, 1996, 1998; Punt and Walker, 1998; Cortés et al., 2002; Walker et al., 2008).
How should uncertainty be dealt with in stock assessment?
Decision analytic theory (Raiffa, 1968; Berger, 1985) suggests that the following elements be applied in dealing with uncertainty in stock assessment: identify alternative plausible hypotheses; evaluate the evidence in support of each hypothesis; and use decision tables with mathematical probabilities.
358 Sharks of the Open Ocean
Identify alternative plausible hypotheses
In stock assessment, there are two general types of hypotheses (or scenarios). The fi rst involves alternative structural forms for the population dynamics model (PDM) for past and future processes. For example, there may be different hypotheses about how catch-ability has changed over time or is related to population abundance (Walters and Maguire, 1996). Each alternative needs to be clearly specifi ed in mathematical form. Although there is an infi nite set of alternative structural forms that can be considered, it is often practical to consider a relatively small set of structural alternatives, perhaps no more than a half-dozen plausible alternatives. It is important to include biologists, industry members, and fi shery managers familiar with the fi shery or ones similar to it in the identifi cation of alter-native structural models.
The second type involves alternative values for the parameters in a PDM. For example, alternative values for the intrinsic rate of increase, r, in the Schaefer model could be treated as alternative hypotheses. These alternative hypotheses could be in continuous terms (0.05 � r1 � 0.10; 0.10 � r2 � 0.15) or discrete terms (r1 � 0.075; r2 � 0.125). They can be thought of as conjectures about past and future states of the resource. Thus, we can have hypotheses for the values of parameters for historic events as well as for future events, such as future annual deviates from a stock-recruit function.
Evaluate the weight of evidence in support of each hypothesis
The fi rst step is to specify prior probabilities (see below) for the alternative hypotheses (HA) based on expert judgment. If each HA is deemed to be equally likely before the data for the population in question are analyzed, then each HA may be given equal probability. Meta-analysis methods that combine data from several different populations have recently been developed as a means to synthesize such data and to develop prior probabilities for model parameters (Gelman et al., 1995; Liermann and Hilborn, 1997; Prévost et al., 2003). Some assessment approaches have been designed to update the prior probabilities assigned to the alternative hypotheses by fi tting the model to the data and providing posterior prob-abilities for each HA (Patterson, 1999; Parma, 2001; McAllister and Kirchner, 2002). The posterior probabilities for each HA are taken as the weight of all evidence in support of the alternative hypotheses. Fairly even posterior probabilities across hypotheses convey con-siderable uncertainty; very high probabilities over a very concentrated range of hypotheses indicate much less uncertainty.
Use decision tables without mathematical probabilities
In data-limited fi sheries such as most shark fi sheries, where observations that could be used to evaluate the plausibility of alternative states of nature (e.g., alternative structural forms for the PDM) are scarce, the use of decision tables without mathematical probabili-ties could also be considered. Decision tables are constructed with columns for the possible (unknown) states of nature, rows for the potential management actions, and the cells fi lled in with, for example, the economic value of each action for each state of nature. These types of decision tables and corresponding decision criteria are available from decision
Why Are Bayesian Methods Useful for Stock Assessment? 359
theory (e.g., Raiffa, 1968). Applications in fi sheries are included in Food and Agriculture Organization (FAO, 1995), Seijo et al. (1998), Defeo and Seijo (1999), and Seijo and Caddy (2000).
When probabilities for the plausibility of alternative states of nature cannot be obtained, the Maximin and Minimax regret criteria (Resnik, 1987) could provide a workable frame-work for making decisions using the precautionary approach for shark fi sheries manage-ment. The Maximin criterion ignores the most optimistic scenarios and associated best-case scenario rewards. It suggests choosing the action that yields the maximum value in the worst-case scenario. This criterion expresses a high degree of risk aversion. The Minimax regret criterion is less pessimistic and suggests choosing the action that is expected to lead to the minimum “regret,” where regret is defi ned as the difference between the value of a particular action for a particular state of nature and the value of the best action for that state of nature.
Bayesian methods
The assignment of probability to alternative values for a parameter refl ects the key fea-ture of Bayesian statistics. Methods have also been recently developed and applied to compute Bayesian probabilities (credibilities) for structurally different stock assessment models (Patterson, 1999; Parma, 2001; McAllister and Kirchner, 2002). These methods are based on one fundamental axiom of probability: Bayes’ theorem (Bayes, 1763). This axiom allows the calculation of the probability that a hypothesis is true from all available data.
Bayes’ theorem
Bayes’ theorem, or a simpler statement of it, Bayes’ rule (below), has three fundamental components: a prior probability for each of the alternative hypotheses, a probability of the data, and the posterior probability. In Bayesian analysis we start with the prior probability, Prior Prob(HA is true) – this refl ects what we know or believe about the relative credibility of an HA before evaluating new data. For example, if for some species we knew very little about the value for the parameter r in the Schaefer model, we would start out with a rela-tively fl at or “noninformative” distribution for that parameter. In contrast, if there were some indication of a most likely range of values based on knowledge of the reproductive biology of the species (McAllister et al., 2001), or other similar populations (Gelman et al., 1995; Liermann and Hilborn, 1997), then the prior distribution would be an informative one with a rounded peak about the most likely values.
A key assumption in the use of the prior probability is that it refl ects the credibility of alternative hypotheses before the current data are analyzed and is completely independent of the potential information contained in the data. There is often a risk that knowledge of existing data feeds into the development of priors, making the priors more informative than they should be, and not independent of the data used in Bayes’ theorem. There is also a risk, when priors are formulated from expert judgment, that the experts are overly certain in their knowledge and supply priors that are too narrow. This can be dangerous, because it can prevent data from overriding the biased priors (McAllister and Kirkwood, 1998b). In shark
360 Sharks of the Open Ocean
stock assessment, this risk is especially pertinent because the data most commonly obtained are already sparse, imprecise, and relatively uninformative. Thus care is needed in the for-mulation of priors (see Punt and Hilborn, 1997; McAllister and Kirkwood, 1998a).
The next step is to identify a functional form for the probability distribution for the stock assessment data for the population in question that could result if one of the HA were true (i.e., the probability of the data). For example, if the hypotheses pertained to the mean length of fi sh of a given age in a population, and the data were observations of individual fi sh sampled at random from the population, then we might expect the observations to be normally distributed. The probability of obtaining the data if HA were true would then be given by the normal density function. Each observation would have its own normal dis-tribution, and we would use this to calculate the probability of obtaining the observation assuming the hypothesized value for the mean and standard deviation of the normal distri-bution for hypothesis HA. The likelihood of the entire set of observations, or “data,” would be the product of the probabilities for each of the individual observations.
In summary, the prior comes from inferences from other similar populations or, in the case of SPMs, from demographic information on the population in question (McAllister et al., 2001). We then update that information with the stock assessment data for the pop-ulation in question. The posterior probability refl ects what we have learned about a set of alternative hypotheses after evaluating a set of data. We start with the prior, then analyze the data, and our updated understanding is refl ected in the posterior probability distribu-tion. This updating occurs through the application of Bayes’ rule:
Posterior Prob(HA is true from data) � Prior Prob(HA is true) � Prob(obtaining the data if HA were true)
This formulation suggests why Bayesian statistics are so useful. They allow the calcu-lation of the probability that a hypothesis is true using diverse sources of data. For exam-ple, in an application of Bayesian methods to Baltic salmon (Salmo salar, Salmonidae) stock assessment, a prior probability density function (pdf) for the slope parameter in the Beverton–Holt stock-recruit function was obtained from a meta-analysis of stock-recruit data for nine Atlantic salmon populations (Michielsens, 2003). A prior pdf for the carrying capac-ity of Baltic salmon was obtained by an evaluation of Baltic salmon biologists’ knowledge of the attributes of Baltic salmon rivers. Tagging data on Baltic salmon were analyzed to com-pute posterior distributions for catchability, natural mortality rates, and homing rates from the sea to the river at different sea ages. The results of these analyses served as prior pdfs in the stock assessment model of population dynamics of Baltic salmon. This model was fi tted to the time-series of juvenile salmon abundance data to produce a posterior distribution for the stock assessment model parameters.
In shark fi sheries, the requirements for estimating posterior probabilities are: a PDM can be formulated; estimable parameters are identifi ed; prior pdfs can be specifi ed for the parameters; and data are compiled to which the model can be fi tted. It is essential that the data compiled contain information to help estimate the model parameters. For example, relative abundance indices must show responses (e.g., declines) to catch removals and vari-ations in response to variations in catch removals. It may be that the data by themselves might not be suffi cient for parameter estimation (e.g., a monotonic decline in catch rates),
Why Are Bayesian Methods Useful for Stock Assessment? 361
but when combined with moderately informative priors for one or more of the estimated parameters in Bayes’ theorem, the combination of the data and the prior provide posterior outputs with suffi cient precision to help guide fi sheries management decisions (McAllister et al., 2001). More informative data for shark stock assessment could come from a multi-year mark-and-recapture experiment, if resources were available (Punt et al., 2000).
Bayes’ theorem can also be applied to compute a posterior probability for structurally different models given the available data (Raftery and Richardson, 1996; Patterson, 1999; Parma, 2001; McAllister and Kirchner, 2002).
Example: National Marine Fisheries Service assessment of Atlantic coastal sharks
The National Marine Fisheries Service (NMFS) stock assessment of large coastal sharks (LCSs) in 1996 used a variety of data and applied different assessment tools to provide management advice (NMFS, 1996). This assessment and the ones that followed in 1998 and 2002 illustrate well why Bayesian methods can be so useful for stock assessment of sharks (NMFS, 1998; Cortés et al., 2002). The 1996 assessment included several critical elements.
Demographic analysis of life-history parameters to estimate the intrinsic rate of increase, r
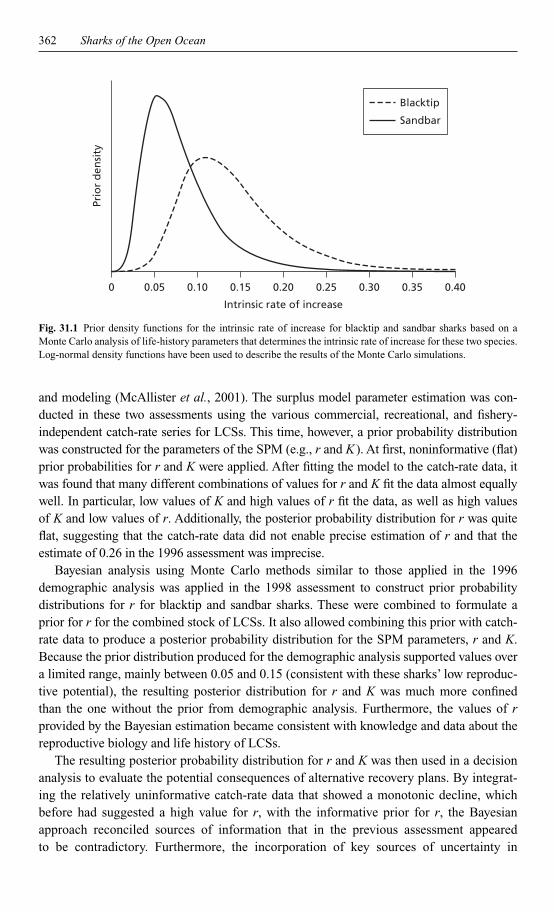
Estimates of the key life-history parameters for demographic analysis were obtained for two carcharhinid sharks, blacktip (Carcharhinus limbatus) and sandbar (C. plumbeus). Point estimates of r were calculated using some alternative combinations of values for the parameters, since the values were not known precisely. In addition, to more thoroughly account for uncertainty, probability distributions for the parameters were constructed, and a Monte Carlo simulation was applied to compute a probability distribution for r. Each of the different demographic analyses suggested that the values for r for blacktip and sandbar sharks were centered around 0.1 (Fig. 31.1).
SPMs to estimate r, recent trends in stock size, and the potential effectiveness of different recovery plans
Several different catch-rate series were available for use as indices of relative abundance for the species grouped as LCS. An SPM was fi tted to these data using a maximum likeli-hood method to estimate the value of r and carrying capacity (K). The value obtained was 0.26, more than twice as high as those obtained in the demographic analyses. The differ-ing estimates suggested large uncertainty in r, yet this was neglected in the policy analysis and provision of management advice. Despite the apparent uncertainty in the estimate of r, only the more optimistic estimate was applied.
A Bayesian stock assessment of Atlantic large coastal sharks
The Bayesian methods applied in the 1998 and 2002 assessments of LCSs overcame these shortcomings by combining the demographic evaluation with surplus production estimation
362 Sharks of the Open Ocean
and modeling (McAllister et al., 2001). The surplus model parameter estimation was con-ducted in these two assessments using the various commercial, recreational, and fi shery-independent catch-rate series for LCSs. This time, however, a prior probability distribution was constructed for the parameters of the SPM (e.g., r and K ). At fi rst, noninformative (fl at) prior probabilities for r and K were applied. After fi tting the model to the catch-rate data, it was found that many different combinations of values for r and K fi t the data almost equally well. In particular, low values of K and high values of r fi t the data, as well as high values of K and low values of r. Additionally, the posterior probability distribution for r was quite fl at, suggesting that the catch-rate data did not enable precise estimation of r and that the estimate of 0.26 in the 1996 assessment was imprecise.
Bayesian analysis using Monte Carlo methods similar to those applied in the 1996 demographic analysis was applied in the 1998 assessment to construct prior probability distributions for r for blacktip and sandbar sharks. These were combined to formulate a prior for r for the combined stock of LCSs. It also allowed combining this prior with catch-rate data to produce a posterior probability distribution for the SPM parameters, r and K. Because the prior distribution produced for the demographic analysis supported values over a limited range, mainly between 0.05 and 0.15 (consistent with these sharks’ low reproduc-tive potential), the resulting posterior distribution for r and K was much more confi ned than the one without the prior from demographic analysis. Furthermore, the values of r provided by the Bayesian estimation became consistent with knowledge and data about the reproductive biology and life history of LCSs.
The resulting posterior probability distribution for r and K was then used in a decision analysis to evaluate the potential consequences of alternative recovery plans. By integrat-ing the relatively uninformative catch-rate data that showed a monotonic decline, which before had suggested a high value for r, with the informative prior for r, the Bayesian approach reconciled sources of information that in the previous assessment appeared to be contradictory. Furthermore, the incorporation of key sources of uncertainty in
0 0.05 0.10 0.15 0.20
Intrinsic rate of increase
Prio
r d
ensi
ty
0.25 0.30 0.35 0.40
Blacktip
Sandbar
Fig. 31.1 Prior density functions for the intrinsic rate of increase for blacktip and sandbar sharks based on a Monte Carlo analysis of life-history parameters that determines the intrinsic rate of increase for these two species. Log-normal density functions have been used to describe the results of the Monte Carlo simulations.
Why Are Bayesian Methods Useful for Stock Assessment? 363
a probabilistic decision analysis of management options permitted the adoption of a precautionary approach.
Recommendations for learning Bayesian stock assessment methods
Applying Bayesian methods to shark stock assessment requires knowledge of basic prob-ability theory. The Ecological Detective (Hilborn and Mangel, 1997) is a useful primer for the application of Bayesian methods, and articles by Punt and Hilborn (1997) and McAllister and Kirkwood (1998a) present the main ideas of Bayesian stock assessment. Although some of the very simplest applications can be implemented in spreadsheets, most stock assessment applications are more computationally intensive owing to the number of parameters to be estimated. Computing requirements can also be onerous if one wants to compute posterior probabilities for structurally different models (McAllister and Kirchner, 2002). If there are more than a few parameters to estimate, then Monte Carlo methods for Bayesian parameter estimation are often needed.
Several software packages can be used for Bayesian stock assessment, which include the Monte Carlo methods needed to numerically integrate posterior distributions for com-plex, multiparameter models. These include the freely available WinBUGS (www.mrc-bsu.cam.ac.uk/bugs/winbugs/contents.shtml), which is perhaps the easiest and the most com-monly applied Bayesian software (Meyer and Millar, 1999; Link et al., 2002; Mantyniemi and Romakkaniemi, 2002). There is a growing literature describing Bayesian modeling in WinBUGS, including SPM applications (Meyer and Millar, 1999), potential biases in parameter estimates in state-space models (Cunningham, 2002), Bayesian mark–recapture, generalized linear modeling and hierarchical modeling (Link et al., 2002; Mantyniemi and Romakkaniemi, 2002; Prévost et al., 2003), and Bayesian data imputation (Clarke, 2003). AD Model Builder (Otter Research, Sidney, British Columbia, Canada) is a computa-tionally effi cient program that has been applied to stock assessment problems with very large numbers of uncertain parameters; it also has an in-built Markov Chain Monte Carlo (MCMC) algorithm to integrate the posterior density function. Bayesian stock assessment and decision analysis software for SPMs has been developed by several of the authors (Babcock and McAllister, 2003) and is downloadable for free from the catalog of stock assessment software at ICCAT (www.iccat.es). This software applies importance sampling rather than MCMC.
Key considerations regarding some hazards and limitations of using the Bayesian approach are:
• If subjective judgment is applied to formulate prior pdfs for model parameters, then caution is required to avoid the use of narrow priors, and the sensitivity of model out-puts to alternative specifi cations for priors should always be undertaken to evaluate the impact of priors on estimates of abundance, fi shing mortality rates, and fi sheries man-agement reference points (McAllister and Kirkwood, 1998a, b).
• The diagnostics developed for each Bayesian method should always be computed and evaluated to assess whether the results obtained from the Bayesian application have
364 Sharks of the Open Ocean
converged and have acceptable statistical properties before the methods can be consid-ered for providing management advice (Spiegelhalter et al., 2003).
• Using models with incorrect structural assumptions (e.g., about catchability or density-dependent processes) will produce incorrect stock assessment results and faulty fi sher-ies management advice whether the method is Bayesian or non-Bayesian. It is therefore important in all stock assessments of sharks to evaluate the sensitivity of results to plau-sible alternative structural forms of the assessment models employed and to convey the results of these evaluations to fi sheries managers. If results are sensitive to structural uncertainty, it is recommended that they be reported in decision table format to facili-tate their incorporation in management decisions (McAllister and Kirchner, 2002).
Conclusions
Because pelagic sharks are vulnerable to overexploitation, it is crucial that fi sheries scien-tists be able to provide advice on how to manage the fi sheries that impact them. However, the requirements for informative catch and abundance data series in conventional stock assessment methods to permit the estimation of the key population parameters of sharks are prohibitive in most instances, because of the lack of availability of such time-series for most shark populations. In contrast, Bayesian stock assessment methods offer an approach when demographic information and catch and relative abundance data for at least the most recent decades of the fi shery are available (McAllister et al., 2001; Apostolaki, 2003; ICCAT, 2005). By incorporating such biological information and data in a probabilistic framework, Bayesian stock assessment methods provide the probabilistic basis necessary to implement a precautionary approach for the management of shark fi sheries (FAO, 1995).
Acknowledgments
This work was made possible by a grant from The David and Lucile Packard Foundation and by the Pew Charitable Trusts through a grant to the Pew Institute for Ocean Science. We thank Jack Musick, Gerry Scott, Joe Powers, Shelley Clarke, Merry Camhi, Geoff Kirkwood, and many others for their helpful discussions. Shelley Clarke provided helpful comments on an early draft, and André Punt offered extensive comments in his review of the manuscript. We thank an anonymous reviewer for helpful comments that improved parts of the manuscript.
References
Anonymous (1999) European Community project FAIR984156, Preparation of a proposal for stock assessment of some elasmobranch fi shes in European waters. cordis.europa.eu/data/MSS_PROJ_FP4_FR/ACTIONeqDndSESSIONeq16149200595ndDOCeq8ndTBLeqEN_PROJ.htm, accessed 25 May 2006.
Why Are Bayesian Methods Useful for Stock Assessment? 365
Apostolaki, P. (2003) Modelling Tools for Evaluating the Effectiveness of Alternative Fisheries Management Measures in Migratory Fish Species. Ph.D. thesis, Imperial College of Science, Technology and Medicine, London, UK.
Au, D. W., Smith, S. E. and Show, C. (2008) Shark productivity and reproductive protection, and a comparison with teleosts. In: Sharks of the Open Ocean: Biology, Fisheries and Conservation (eds. M. D. Camhi, E. K. Pikitch and E. A. Babcock). Blackwell Publishing, Oxford, UK.
Babcock, E. A. and Nakano, H. (2008) Data collection, research, and assessment efforts for pelagic sharks by the International Commission for the Conservation of Atlantic Tunas. In: Sharks of the Open Ocean: Biology, Fisheries and Conservation (eds. M. D. Camhi, E. K. Pikitch and E. A. Babcock). Blackwell Publishing, Oxford, UK.
Babcock, E. A. and McAllister (2003) BSP: Bayesian Surplus Production model software. Available at www.iccat.es, accessed 17 September 2007.
Babcock, E. A. and McAllister, M. K. (2004) Modeling biases and contradictions among catch rate indices of abundance for Atlantic white marlin (Tetrapterus albidus). ICCAT Collective Volume of Scientifi c Papers 56(1), 110–119.
Bayes, T. (1763) Essay towards solving a problem in the doctrine of chances. Reprinted in Biometrika 45, 293–315 (1958).
Begon, M., Harper, J. L. and Townsend, C. R. (1996) Ecology: Individuals, Populations and Communities, 3rd edn. Blackwell Science, Oxford, UK.
Berger, J. O. (1985) Statistical Decision Theory and Bayesian Analysis, 2nd edn. Springer-Verlag, New York.
Butterworth, D. S., Punt, A. E. and Smith, A. D. M. (1996) On plausible hypotheses and their weightings, with implications for selection between variants of the Revised Management Procedure. Report of the International Whaling Commission 46, 481–491.
Camhi, M. D. (2008) Conservation status of pelagic elasmobranchs. In: Sharks of the Open Ocean: Biology, Fisheries and Conservation (eds. M. D. Camhi, E. K. Pikitch and E. A. Babcock). Blackwell Publishing, Oxford, UK.
Clarke, S. C. (2003) Quantifi cation of the Trade in Shark Fins. Ph.D. thesis, Imperial College London, London, UK.
Cortés, E. (1999) A stochastic stage-based population model of the sandbar shark in the western North Atlantic. In: Life in the Slow Lane: Ecology and Conservation of Long-Lived Marine Animals (ed. J. Musick). American Fisheries Society, Bethesda, MD, pp. 115–136.
Cortés, E. (2008) Comparative life history and demography of pelagic sharks. In: Sharks of the Open Ocean: Biology, Fisheries and Conservation (eds. M. D. Camhi, E. K. Pikitch and E. A. Babcock). Blackwell Publishing, Oxford, UK.
Cortés, E., Brooks, L. and Scott, G. (2002) Stock Assessment of Large Coastal Sharks in the US Atlantic and Gulf of Mexico. Sustainable Fisheries Division Contribution SFD-02/03-177. NMFS, Silver Spring, MD.
Cunningham, C. (2002) Improved Management of North East Atlantic Mackerel, Using Bayesian Modelling Methodologies. Ph.D. thesis, Imperial College London, London, UK.
Defeo, O. and Seijo, J. C. (1999) Yield-mortality models: A precautionary bio-economic approach. Fisheries Research 40, 7–16.
FAO (1995) Part 1: Guidelines on the Precautionary Approach to Capture Fisheries and Species Introductions. FAO Fisheries Technical Paper No. 350/1. FAO, Rome, Italy.
Fowler, C. W. (1988) Population dynamics as related to rate of increase per generation. Evolutionary Ecology 2, 197–204.
Francis, R. I. C. C. and Shotton, R. (1997) “Risk” in fi sheries management: A review. Canadian Journal of Fisheries and Aquatic Sciences 54, 1699–1715.
366 Sharks of the Open Ocean
Gelman, A., Carlin, J., Stern, H. and Rubin, D. (1995) Bayesian Data Analysis. Chapman & Hall, Boca Raton, FL.
Hilborn, R. and Mangel, M. (1997) The Ecological Detective: Confronting Models with Data. Princeton University Press, Princeton, NJ.
Hilborn, R. and Walters, C. J. (1992) Quantitative Fisheries Stock Assessment: Choice, Dynamics, and Uncertainty. Chapman & Hall, New York.
Hilborn, R., Pikitch, E. K. and Francis, R. C. (1993) Current trends in including risks and uncertainty in stock assessment and harvest decisions. Canadian Journal of Fisheries and Aquatic Sciences 50, 874–880.
Holden, M. J. (1977) Elasmobranchs. In: Fish Population Dynamics (ed. J. A. Gulland). John Wiley & Sons, London, UK, pp. 187–216.
ICCAT (1999) ICCAT Collective Volume of Scientifi c Papers 49(2).ICCAT (2005) Report of the 2004 Inter-sessional Meeting of the ICCAT Sub-committee on
By-catches: Shark Stock Assessment. ICCAT Collective Volume of Scientifi c Papers 58(3), 799–890.IWC (1992) Report of the Scientifi c Committee. Annex D (Management Procedures). Report of the
International Whaling Commission 42, 87–136.Kleiber, P., Takeuchi, Y. and Nakano, H. (2001) Calculation of Plausible Maximum Sustainable
Yield (MSY) for Blue Shark (Prionace glauca) in the North Pacifi c. Administrative Report H-01-02. Southwest Fisheries Science Center, NMFS, La Jolla, CA.
Krebs, C. J. (1985) Ecology: The Experimental Analysis of Distribution and Abundance, 3rd edn. Harper & Row, New York.
Liermann, M. and Hilborn, R. (1997) A hierarchic Bayesian meta-analysis. Canadian Journal of Fisheries and Aquatic Sciences 9, 1976–1984.
Link, W. A., Cam, E., Nichols, J. D. and Cooch, E. G. (2002) Of BUGS and Birds: Markov chain Monte Carlo for hierarchical modelling in wildlife research. Journal of Wildlife Management 66(2), 277–291.
Ludwig, D. and Walters, C. J. (1985) Are age-structured models appropriate for catch–effort data? Canadian Journal of Fisheries and Aquatic Sciences 42, 1066–1072.
Mantyniemi, S. and Romakkaniemi, A. (2002) Bayesian mark–recapture estimation with an appli-cation to a salmonid smolt population. Canadian Journal of Fisheries and Aquatic Sciences 59, 1748–1758.
McAllister, M. K. and Kirchner, C. H. (2002) Accounting for structural uncertainty to facilitate precautionary fi shery management: Illustration with Namibian orange roughly. In: Targets, Thresholds, and the Burden of Proof in Fisheries Management (ed. M. Mangel). Bulletin of Marine Science 70(2)(special volume), 499–540.
McAllister, M. K. and Kirkwood, G. P. (1998a) Bayesian stock assessment: A review and example application using the logistic model. ICES Journal of Marine Science 55, 1031–1060.
McAllister, M. K. and Kirkwood, G. P. (1998b) Using Bayesian decision analysis to help achieve a precautionary approach to managing newly developing fi sheries. Canadian Journal of Fisheries and Aquatic Sciences 55, 2642–2661.
McAllister, M. K. Starr, P. J., Restrepo, V. R. and Kirkwood, G. P. (1999) Formulating quantitative methods to evaluate fi shery-management systems: What fi shery processes should be modelled and what trade-offs should be made? ICES Journal of Marine Science 56(6), 900–916.
McAllister, M. K., Pikitch, E. K. and Babcock, E. A. (2001) Using demographic methods to con-struct Bayesian priors for the intrinsic rate of increase in the Schaefer model and implications for stock rebuilding. Canadian Journal of Fisheries and Aquatic Sciences 58(9), 1871–1890.
Meyer, R. and Millar, R. B. (1999) BUGS in Bayesian stock assessments. Canadian Journal of Fisheries and Aquatic Sciences 56, 1078–1086.
Why Are Bayesian Methods Useful for Stock Assessment? 367
Michielsens, C. (2003) Bayesian Decision Theory for Fisheries Management of Migratory Species with Multiple Life Histories. Ph.D. thesis, Imperial College London, London, UK.
National Marine Fisheries Service (NMFS) (1996) Report of the Shark Evaluation Workshop. Southeast Fisheries Science Center, NMFS, Miami, FL.
National Marine Fisheries Service (NMFS) (1998) Report of the Shark Evaluation Workshop. Southeast Fisheries Science Center, NMFS, Panama City, FL.
Parma, A. M. (2001) Bayesian approaches to the analysis of uncertainty in the stock assessment of Pacifi c halibut. In: Incorporating Uncertainty into Fisheries Models (eds. J. M. Berkson, L. L. Kline and D. J. Orth). American Fisheries Society, Bethesda, MD, pp. 111–132.
Patterson, K. R. (1999) Evaluating uncertainty in harvest control law catches using Bayesian Markov chain Monte Carlo virtual population analysis with adaptive rejection sampling and including structural uncertainty. Canadian Journal of Fisheries and Aquatic Sciences 56, 208–221.
Prévost, E., Parent, E., Crozier, W., Davidson, I., Dumase, J., Gudbergsson, G., Hindarg, K., McGinnityh, P., MacLeani, J. and Sættem, L. M. (2003) Setting biological reference points for Atlantic salmon stocks: Transfer of information from data-rich to sparse-data situations by Bayesian hierarchical modelling. ICES Journal of Marine Science 60(6), 1177–1193.
Punt, A. E. (1993) The comparative performance of production-model and ad hoc tuned VPA based feedback-control management procedures for the stock of Cape hake off the west coast of South Africa. In: Risk Evaluation and Biological Reference Points for Fisheries Management (eds. S. J. Smith, J. J. Hunt and D. Rivard). Publication No. 120. NRC Research Press, Ottawa, Ontario, Canada, pp. 283–299.
Punt, A. E. and Hilborn, R. (1997) Fisheries stock assessment and decision analysis: The Bayesian approach. Reviews in Fish Biology and Fisheries 7, 35–63.
Punt, A. E. and Walker, T. I. (1998) Stock assessment and risk analysis for the school shark (Galeorhinus galeus) off southern Australia. Marine and Freshwater Research 49, 719–731.
Punt, A. E., Pribac, R., Walker, T. I., Taylor, B. L. and Prince, J. D. (2000) Stock assessment of school shark, Galeorhinus galeus, based on a spatially explicit population dynamics model. Marine and Freshwater Research 51, 205–220.
Quinn, T. J. and Deriso, R. B. (1999) Quantitative Fish Dynamics. Oxford University Press, Oxford, UK.
Raftery, A. E. and Richardson, S. (1996) Model selection via GLIB. In: Bayesian Biostatistics (eds. D. A. Berry and D. K. Dalene). Marcel Dekker, New York, pp. 321–353.
Raiffa, H. (1968) Decision Analysis: Introductory Lectures on Choices Under Uncertainty. Addison-Wesley, Reading, MA.
Resnik, M. D. (1987) Choices: An Introduction to Decision Theory. University of Minnesota Press, Minneapolis, MN.
Restrepo, V. R., Hoenig, J. M., Powers, J. E., Baird, J. W. and Turner, S. C. (1992) A simple simula-tion approach to risk and cost analysis, with applications to swordfi sh and cod fi sheries. Fishery Bulletin 90, 736–748.
Sainsbury, K. (1988) The ecological basis of multispecies fi sheries, and management of a demersal fi shery in tropical Australia. In: Fish Population Dynamics: The Implications for Management (ed. J. A. Gulland), 2nd edn. Wiley, Chichester, UK, pp. 349–382.
Schnute, J. T. and Hilborn, R. (1993) Analysis of contradictory data sources in fi sh stock assess-ments. Canadian Journal of Fisheries and Aquatic Sciences 52, 2063–2077.
Seijo, J. C. and Caddy, J. F. (2000) Uncertainty in bio-economic reference points and indicators of marine fi sheries. Marine and Freshwater Research 51, 477–483.
Seijo, J. C., Defeo, O. and Salas, S. (1998) Fisheries Bio-economics: Theory, Modelling and Management. FAO Fisheries Technical Paper No. 368. FAO, Rome, Italy, 108 pp.
368 Sharks of the Open Ocean
Sminkey, T. R. and Musick, J. A. (1995) Demographic analysis of the sandbar shark, Carcharhinus plumbeus, in the western North Atlantic. Fishery Bulletin 94, 341–347.
Smith, S. E., Au, D. W. and Show, C. (2008) Intrinsic rates of increase in pelagic elasmobranchs. In: Sharks of the Open Ocean: Biology, Fisheries and Conservation (eds. M. D. Camhi, E. K. Pikitch and E. A. Babcock). Blackwell Publishing, Oxford, UK.
Spiegelhalter, D., Thomas, A. and Best, N. (2003) WinBUGS Version 1.4. User Manual. MRC and Imperial College of Science, Technology and Medicine, London, UK (www.mrc-bsu.cam.ac.uk/bugs).
Walker, T. I. (1998) Can shark resources be harvested sustainably? Marine and Freshwater Research 49, 553–572.
Walker, T. I., Taylor, B. L., Brown, L. P. and Punt, A. E. (2008) Embracing movement and stock structure for assessment of Galeorhinus galeus harvested off southern Australia. In: Sharks of the Open Ocean: Biology, Fisheries and Conservation (eds. M. D. Camhi, E. K. Pikitch and E. A. Babcock). Blackwell Publishing, Oxford, UK.
Walters, C. J. and Maguire, J. J. (1996) Lessons for stock assessment from the northern cod col-lapse. Reviews in Fish Biology and Fisheries 6, 125–137.
Xiao, Y. (1995) Stock Assessment of the School Shark Galeorhinus galeus (Linnaeus) off Southern Australia by Schaefer Production Model. SharkFAG Document No. SS/95/D2. Australian Fisheries Management Authority, Canberra, Australian Capital Territory, Australia, 58 pp.