shared phylogeographic patterns between the … · insight into phylogeographic patterns which may...
TRANSCRIPT
Submitted 20 May 2014Accepted 10 August 2014Published 25 September 2014
Corresponding authorCharlotte R. Hurry,[email protected]
Academic editorKeith Crandall
Additional Information andDeclarations can be found onpage 14
DOI 10.7717/peerj.552
Copyright2014 Hurry et al.
Distributed underCreative Commons CC-BY 4.0
OPEN ACCESS
Shared phylogeographic patternsbetween the ectocommensal flatwormTemnosewellia albata and its host, theendangered freshwater crayfishEuastacus robertsiCharlotte R. Hurry1, Daniel J. Schmidt1, Mark Ponniah1,Giovannella Carini1, David Blair2 and Jane M. Hughes1
1 Australian Rivers Institute, Griffith University, Nathan, Qld, Australia2 School of Marine and Tropical Biology, James Cook University, Townsville, Qld, Australia
ABSTRACTComparative phylogeography of commensal species may show congruent patternswhere the species involved share a common history. Temnosewellia is a genus offlatworms, members of which live in commensal relationships with host freshwa-ter crustaceans. By constructing phylogenetic trees based on mitochondrial COIand 28S nuclear ribosomal gene sequences, this study investigated how evolution-ary history has shaped patterns of intraspecific molecular variation in two suchfreshwater commensals. This study concentrates on the flatworm Temnosewelliaalbata and its critically endangered crayfish host Euastacus robertsi, which have anarrow climatically-restricted distribution on three mountaintops. The genetic dataexpands upon previous studies of Euastacus that suggested several vicariance eventshave led to the population subdivision of Euastacus robertsi. Further, our study com-pared historical phylogeographic patterning of these species. Our results showed thatphylogeographic patterns shared among these commensals were largely congruent,featuring a shared history of limited dispersal between the mountaintops. Severalhypotheses were proposed to explain the phylogeographic points of differences be-tween the species. This study contributes significantly to understanding evolutionaryrelationships of commensal freshwater taxa.
Subjects Conservation Biology, GeneticsKeywords Dispersal, Fragmented habitat, Haplotype sharing, Crustaceans, Comparative phylo-geography, Headwater, Invertebrates
INTRODUCTIONThere are many examples of commensal relationships between aquatic organisms,
perhaps none more prevalent than in the relationship between crustacean hosts and
Platyhelminthes. Both marine and freshwater crustaceans worldwide have been shown to
have persistent infestations of Platyhelminthes flatworms (McDermott, Williams & Boyko,
2010; Ohtaka et al., 2012). However, not all of these associations are parasitic, many are
commensal or mutualistic. An example of a commensal association is the one between
How to cite this article Hurry et al. (2014), Shared phylogeographic patterns between the ectocommensal flatworm Temnosewellia albataand its host, the endangered freshwater crayfish Euastacus robertsi. PeerJ 2:e552; DOI 10.7717/peerj.552
the eastern Australian freshwater crayfish genus Euastacus and their ectocommensal
temnocephalan flatworms. These flatworms are mostly host-specific and the most
prevalent of just three, known, external symbionts on Euastacus (McCormack, 2012). Many
temnocephalans are classified as free living, i.e., nonparasitic and capable of motility.
They use the host purely as a mechanism to facilitate transport and/or feeding. The
close association between the host and its ectocommensal may be exploited to develop
an understanding of the phylogeographic history of both species.
Host-commensal associations can be examined using molecular data, which may
demonstrate congruent patterns between host and commensal (Whiteman, Kimball &
Parker, 2007; James et al., 2011). The correlation of genetic variation between interacting
species may be linked to indirect factors such as shared responses to environmental
heterogeneity (e.g., spatial dependence) or due to species sharing similar life histories
and/or movement patterns (James et al., 2011). Hence, we can use genetic data to
explore potential habitat boundaries, identify dispersal patterns, identify divergence
events, discover cryptic gene flow or determine points of origin (Nieberding et al., 2004;
Barbosa et al., 2012; Harris et al., 2013). For instance, Nieberding et al. (2004) explain
how inferences can be made on host phylogeographic history by using the species
which has the higher rate of molecular evolution (usually the symbiont) as a “biological
magnifying glass”; i.e., the detection of previously unknown historical events of the host
as derived from the phyleogeographic history of the symbiont. Vertical transmission in
particular allows “parasites” to be used to infer genealogical history of the host (Rannala &
Michalakis, 2003; Whiteman & Parker, 2005). An improved understanding of evolutionary
relationships between taxa with closely dependent life-histories can lead to increased
insight into phylogeographic patterns which may be an important factor when considering
conservation management plans for endangered species (Whiteman, Kimball & Parker,
2007; Toon & Hughes, 2008). Further, phylogeographic histories are likely to track one
another if the host exists in highly sub-divided populations, as is the case for many
headwater species (McLean, Schmidt & Hughes, 2008; Hughes, Schmidt & Finn, 2009).
In this study we present the first comparative phylogeographic analysis of the ectocom-
mensal flatworm Temnosewellia albata Sewell, Cannon & Blair, 2006 (Platyhelminthes,
Temnocephalida, Temnocephalidae) and its critically endangered host crayfish Euastacus
robertsi Monroe, 1977 (Arthropoda, Decapoda, Parastacidae); freshwater invertebrates
of headwater streams. Our study seeks to understand the association between these
commensals and is one of just a handful of phylogeographic studies of an ectocommensal
flatworm. Our comparisons of phylogeographic histories were attained by sequencing the
mitochondrial cytochrome oxidase subunit 1 (COI) and the nuclear 28S ribosomal DNA.
Previous studies have suggested the diverse array of Euastacus species in eastern
Australia evolved through vicariance of formerly widespread ancestral taxa that became
isolated in upland refuges of the eastern highlands during the Pliocene drying of the
Australian continent (Ponniah & Hughes, 2004; Shull et al., 2005; Ponniah & Hughes,
2006). In these studies two species, E. robertsi and E. fleckeri were found to comprise a
highly divergent monophyletic group within the genus. This phylogenetic separation of
Hurry et al. (2014), PeerJ, DOI 10.7717/peerj.552 2/18
the two most northern Euastacus and the rest of the genus is coincident with a significant
biogeographical barrier, the ‘Black Mountain Corridor’. Further, Ponniah & Hughes (2006)
suggested that intervening lowland has been an effective barrier to dispersal in these
species. We present a fine scale study which investigates historical patterning of E. robertsi
across three mountaintops. These mountaintops in northern Queensland are located
within an area <100 km2 and are the only known locations of E. robertsi. In a previous
phylogeographic study, just twenty E. robertsi individuals were sampled. Small samples
are likely to miss rare alleles and potentially under-represent the full phylogeographic
history of a given locus. Limited distribution combined with anthropogenic disturbances
(Coughran & Furse, 2010), have led to this species being categorised as critically endangered
(Coughran & Furse, 2010).
Temnosewellia albata is the only known ectosymbiont associated with E. robertsi. Very
little is known of its ecology, highlighting the need for further studies on T. albata to better
understand the level of the association between this species and its host. In depth studies on
another crayfish ectosymbiont, Branchiobdellida, have shown that associations previously
regarded as mutualistic may actually be weakly parasitic in times of overabundance
(Brown, Creed & Dobson, 2002; Brown et al., 2012). Although T. albata are not known
to be parasitic we still expect that their life histories are closely aligned with their hosts.
Currently, they are thought to be strictly host-specific and to undergo their entire life
cycle on a single host (Jones & Lester, 1992; Sewell, Cannon & Blair, 2006). Infestations of
Temnosewellia follow an over dispersion pattern, where a few hosts carry many individuals
(Wild & Furse, 2004; C Hurry, pers. obs., 2014). For several species of Temnosewellia it has
been shown that abundance, prevalence and flatworm body size are all positively correlated
with crayfish size (Euastacus sulcatus/Temnosewellia spp. Wild & Furse, 2004; Euastacus
hystricosus/Temnosewellia batiola C Hurry, 2014, unpublished data). These observations,
offer a strong indication that newly hatched Temnosewellia may colonise small or young
crayfish. As Euastacus carry their offspring for several months after hatching (McCormack,
2012), it is most likely that transmission of Temnosewellia albata is vertical. Even though
T. albata are considered host-specific to E. robertsi, a single worm has been reported from
a crayfish of the Cherax depressus complex sensu Riek, 1951, sampled at a site >500 km
from the current habitat of E. robertsi (Sewell, Cannon & Blair, 2006). However, this
identification has not been confirmed by further collection or molecular analyses.
Our study extends on previous phylogeographic research into Euastacus robertsi by
using larger sample sizes and incorporating data from an additional locus. We then
consider the phylogeography of an ectocommensal flatworm and seek to explore the
longevity and history of the relationship between host and commensal. By conducting a
comparative phylogeographic study we were able determine: (1) if there is evidence of past
and present connectivity between populations of Euastacus robertsi and (2) if historical
genetic patterns of colonisation and dispersal were congruent between T. albata and
E. robersti. If T. albata shares a closely linked evolutionary history with its crayfish host,
the topologies and relative depth of gene trees should be similar between the host and the
flatworm.
Hurry et al. (2014), PeerJ, DOI 10.7717/peerj.552 3/18
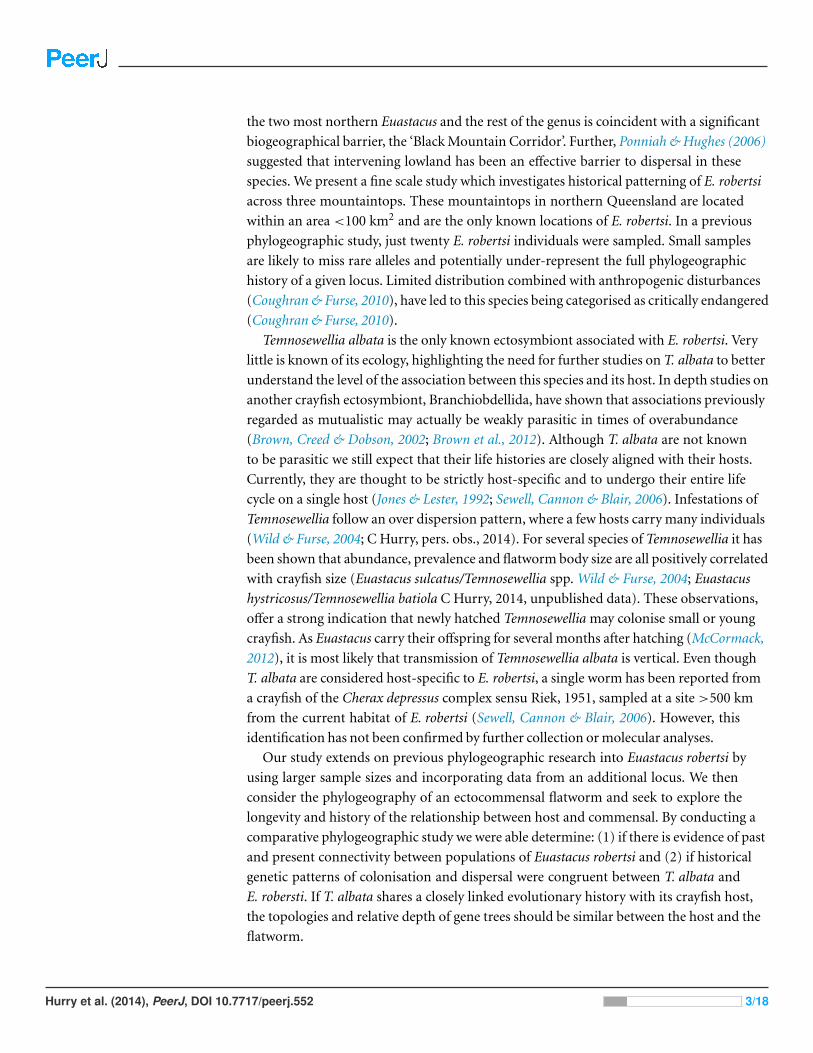
Figure 1 Map of north east Queensland, Australia which shows the three mountaintop habitats (N)of Euastacus robertsi and Temnosewellia albata.
MATERIAL AND METHODSStudy areaThe study area was located in the Daintree rainforest, which is the largest continuous
rainforest on the continent. Situated within the wet tropics in northern Queensland,
Australia, the tropical climate has hot wet summers and cool dry winters. The three
mountaintops inhabited by T. albata and E. robersti are Mount Pieter Botte (elevation
1,009 m), Thornton Peak (1,375 m) and Mount Finnigan (1,083 m) (Fig. 1, Table S1). The
area which is <100 km2, is believed to contain the entire range of both species (Morgan,
1997; Ponniah & Hughes, 2006; Coughran & Furse, 2010). Samples were collected, as per
Ponniah & Hughes (2004), in stream reaches at elevation >750 m. On each mountaintop
one site was sampled except for Mount Finnigan where two stream reaches were sampled.
DNA extraction, amplification, and sequencingTotal genomic DNA was extracted from the leg tissue of E. robertsi and from whole samples
of T. albata as per methods outlined in Carini & Hughes (2006). A final edited 610 base pair
fragment (E. robertsi) and 603 base pair fragment (T. albata) of the mtDNA COI gene was
produced after polymerase chain reaction (PCR) using the COI primer set LCO-1490 and
HCO-2198 of Folmer et al. (1994). PCR conditions were: denaturation of DNA occurred
at 95 ◦C for 5 min, followed by 30 cycles of 94 ◦C denaturing for 1 min, 55 ◦C annealing
for 30 s, and 72 ◦C extension for 1 min, followed by a final 68 ◦C extension step for 5 min.
Dye terminator cycle sequencing reactions were used for sequencing (Perkin Elmer, Foster
City, CA) as per manufacturer’s instructions. Sequencing was carried out on an Applied
Biosystems (Foster City, CA) 3130xl automated sequencing machine.
We also wanted to include nuclear gene data in the analysis to compare phylogenetic
patterns for the two species. Therefore, we included a 734 base pair edited fragment
(E. robertsi) and a 692 base pair edited fragment (T. albata) of 28S ribosomal DNA. We
Hurry et al. (2014), PeerJ, DOI 10.7717/peerj.552 4/18
used the primers Rd1a and Rd4b (Crandall, Harris & Fetzner, 2000). PCR conditions
followed those of Crandall, Harris & Fetzner (2000).
The nucleotide sequences for COI and 28S were aligned and edited with SE-
QUENCHER v4.9 (Gene Codes Corporation). The mtDNA sequences were visually
assessed for the occurrence of nuclear mitochondrial pseudogenes (numts) using
techniques described in Bensasson et al. (2001) and none were found.
Networks, phylogenetic trees and divergence estimatesFor the 28S data we constructed haplotype networks using TCS v1.21 (Clement, Posada
& Crandall, 2000) for E. robertsi and T. albata. Phylogenetic trees were constructed for
the COI data using unique haplotypes. For the E. robertsi tree, E. fleckeri was selected
as an out-group, as it has previously been shown to be the sister species of E. robertsi
(Ponniah & Hughes, 2004). Temnosewellia aphyodes was chosen as an out-group for the
T. albata tree, as it is the resident flatworm of E. fleckeri (Sewell, Cannon & Blair, 2006).
We used jModeltest v0.1 (Posada, 2008) to choose the best-fit substitution model for each
COI dataset. Using the Akaike information criterion the model selected for T. albata was
TPM2uf+I+G and for E. robertsi was TIM3+I. Tree construction for each data set was run
using Bayesian analyses. MrBayes v3.1.2 (Huelsenbeck & Ronquist, 2001) was used for tree
topology comparison, and BEAST v1.7.5 (Drummond & Rambaut, 2007; Drummond et al.,
2012) was used to construct rooted ultrametric trees for comparison of node divergence
times.
In MrBayes, a MCMC chain of 2,000,000 iterations was used with a sample frequency
of 100. The first 25% of iterations were discarded as burn-in. MEGA v5.10 (Tamura et
al., 2011) was used to calculate uncorrected percentage divergence between clades. In
BEAST a lognormal relaxed clock model was first used to estimate divergence times
of clades. However, the data could not reject a strict clock (ucld.stdev included zero);
therefore, a strict clock model was used along with a coalescent constant size tree prior.
Owing to lack of fossil calibration points and uncertainties in transferring molecular
clock rates across taxa, we chose to incorporate a range of rates from the literature to
place an approximate time-frame on COI divergences within the E. robertsi and T. albata
datasets. Clock rates were used to describe a lognormal prior for the estimated clock
rate, where 95% of the probability density was contained within highest and lowest
values taken from the literature. For the temnocephalans these values were 0.0027 and
0.015 substitutions/site/lineage/million years (Schmidtea mediterranea, Platyhelminthes:
Lazaro et al., 2011; Dugesia, Platyhelminthes: Sola et al., 2013). For the crayfish the values
were 0.0083 and 0.012 substitutions/site/lineage/million years (Chirocephalus, Crustacea:
Ketmaier, Argano & Caccone, 2003). Convergence, mixing and effective sample size of
model parameters (>200) was assessed using the program Tracer v1.5 (Drummond &
Rambaut, 2007) after running the analysis for 108 generations.
To investigate the magnitude of genetic divergence within each taxon, without reliance
on transformation using molecular clock rates, we fitted the COI and 28S datasets to a
two population isolation-with-migration model (IM), implemented in the software IM
Hurry et al. (2014), PeerJ, DOI 10.7717/peerj.552 5/18
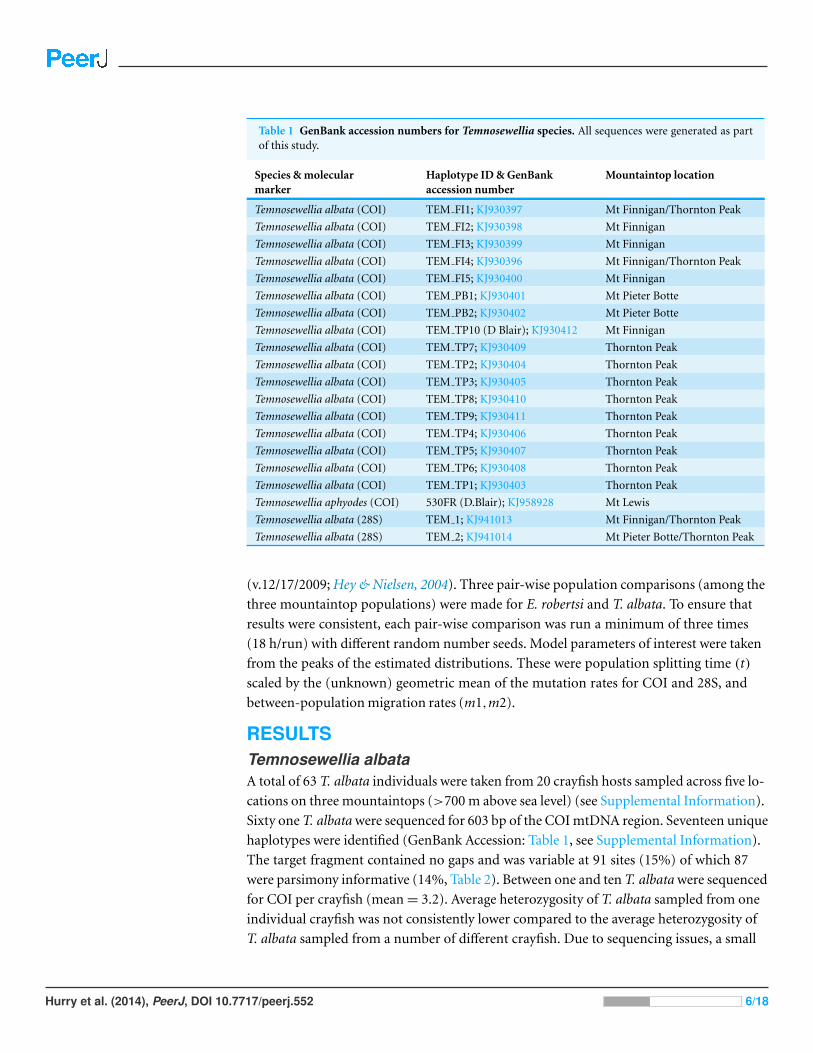
Table 1 GenBank accession numbers for Temnosewellia species. All sequences were generated as partof this study.
Species & molecularmarker
Haplotype ID & GenBankaccession number
Mountaintop location
Temnosewellia albata (COI) TEM FI1; KJ930397 Mt Finnigan/Thornton Peak
Temnosewellia albata (COI) TEM FI2; KJ930398 Mt Finnigan
Temnosewellia albata (COI) TEM FI3; KJ930399 Mt Finnigan
Temnosewellia albata (COI) TEM FI4; KJ930396 Mt Finnigan/Thornton Peak
Temnosewellia albata (COI) TEM FI5; KJ930400 Mt Finnigan
Temnosewellia albata (COI) TEM PB1; KJ930401 Mt Pieter Botte
Temnosewellia albata (COI) TEM PB2; KJ930402 Mt Pieter Botte
Temnosewellia albata (COI) TEM TP10 (D Blair); KJ930412 Mt Finnigan
Temnosewellia albata (COI) TEM TP7; KJ930409 Thornton Peak
Temnosewellia albata (COI) TEM TP2; KJ930404 Thornton Peak
Temnosewellia albata (COI) TEM TP3; KJ930405 Thornton Peak
Temnosewellia albata (COI) TEM TP8; KJ930410 Thornton Peak
Temnosewellia albata (COI) TEM TP9; KJ930411 Thornton Peak
Temnosewellia albata (COI) TEM TP4; KJ930406 Thornton Peak
Temnosewellia albata (COI) TEM TP5; KJ930407 Thornton Peak
Temnosewellia albata (COI) TEM TP6; KJ930408 Thornton Peak
Temnosewellia albata (COI) TEM TP1; KJ930403 Thornton Peak
Temnosewellia aphyodes (COI) 530FR (D.Blair); KJ958928 Mt Lewis
Temnosewellia albata (28S) TEM 1; KJ941013 Mt Finnigan/Thornton Peak
Temnosewellia albata (28S) TEM 2; KJ941014 Mt Pieter Botte/Thornton Peak
(v.12/17/2009; Hey & Nielsen, 2004). Three pair-wise population comparisons (among the
three mountaintop populations) were made for E. robertsi and T. albata. To ensure that
results were consistent, each pair-wise comparison was run a minimum of three times
(18 h/run) with different random number seeds. Model parameters of interest were taken
from the peaks of the estimated distributions. These were population splitting time (t)
scaled by the (unknown) geometric mean of the mutation rates for COI and 28S, and
between-population migration rates (m1,m2).
RESULTSTemnosewellia albataA total of 63 T. albata individuals were taken from 20 crayfish hosts sampled across five lo-
cations on three mountaintops (>700 m above sea level) (see Supplemental Information).
Sixty one T. albata were sequenced for 603 bp of the COI mtDNA region. Seventeen unique
haplotypes were identified (GenBank Accession: Table 1, see Supplemental Information).
The target fragment contained no gaps and was variable at 91 sites (15%) of which 87
were parsimony informative (14%, Table 2). Between one and ten T. albata were sequenced
for COI per crayfish (mean = 3.2). Average heterozygosity of T. albata sampled from one
individual crayfish was not consistently lower compared to the average heterozygosity of
T. albata sampled from a number of different crayfish. Due to sequencing issues, a small
Hurry et al. (2014), PeerJ, DOI 10.7717/peerj.552 6/18
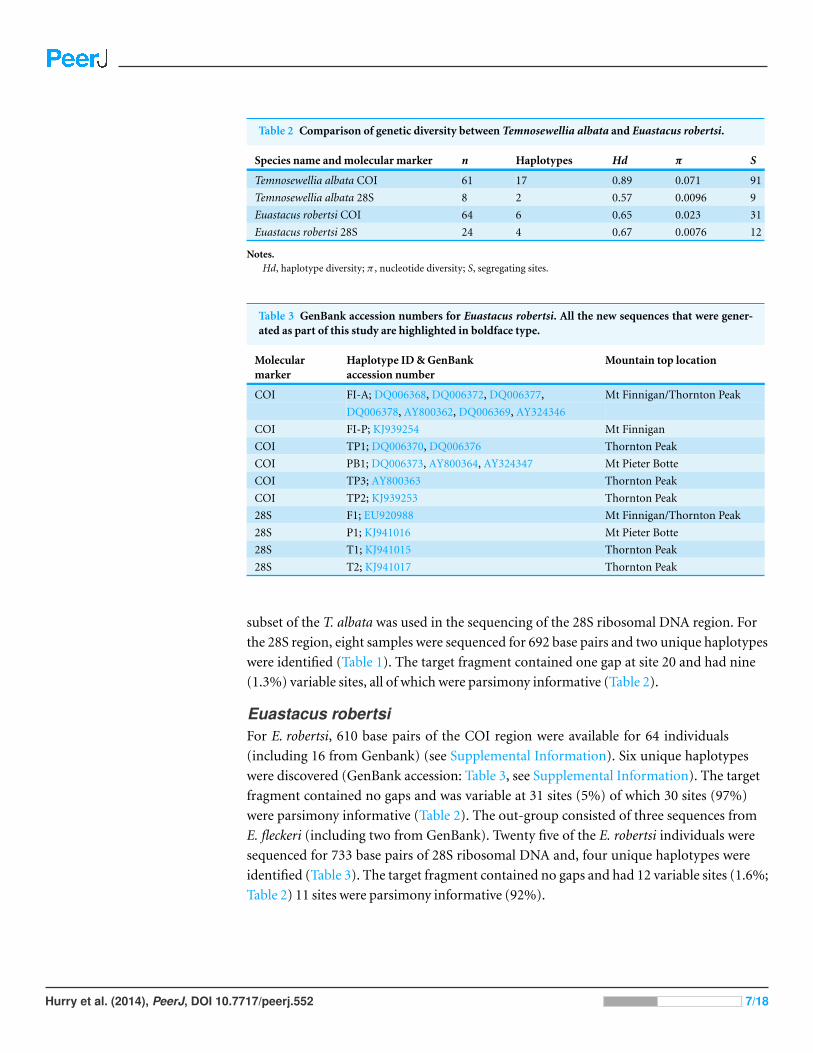
Table 2 Comparison of genetic diversity between Temnosewellia albata and Euastacus robertsi.
Species name and molecular marker n Haplotypes Hd π S
Temnosewellia albata COI 61 17 0.89 0.071 91
Temnosewellia albata 28S 8 2 0.57 0.0096 9
Euastacus robertsi COI 64 6 0.65 0.023 31
Euastacus robertsi 28S 24 4 0.67 0.0076 12
Notes.Hd, haplotype diversity; π , nucleotide diversity; S, segregating sites.
Table 3 GenBank accession numbers for Euastacus robertsi. All the new sequences that were gener-ated as part of this study are highlighted in boldface type.
Molecularmarker
Haplotype ID & GenBankaccession number
Mountain top location
COI FI-A; DQ006368, DQ006372, DQ006377, Mt Finnigan/Thornton Peak
DQ006378, AY800362, DQ006369, AY324346
COI FI-P; KJ939254 Mt Finnigan
COI TP1; DQ006370, DQ006376 Thornton Peak
COI PB1; DQ006373, AY800364, AY324347 Mt Pieter Botte
COI TP3; AY800363 Thornton Peak
COI TP2; KJ939253 Thornton Peak
28S F1; EU920988 Mt Finnigan/Thornton Peak
28S P1; KJ941016 Mt Pieter Botte
28S T1; KJ941015 Thornton Peak
28S T2; KJ941017 Thornton Peak
subset of the T. albata was used in the sequencing of the 28S ribosomal DNA region. For
the 28S region, eight samples were sequenced for 692 base pairs and two unique haplotypes
were identified (Table 1). The target fragment contained one gap at site 20 and had nine
(1.3%) variable sites, all of which were parsimony informative (Table 2).
Euastacus robertsiFor E. robertsi, 610 base pairs of the COI region were available for 64 individuals
(including 16 from Genbank) (see Supplemental Information). Six unique haplotypes
were discovered (GenBank accession: Table 3, see Supplemental Information). The target
fragment contained no gaps and was variable at 31 sites (5%) of which 30 sites (97%)
were parsimony informative (Table 2). The out-group consisted of three sequences from
E. fleckeri (including two from GenBank). Twenty five of the E. robertsi individuals were
sequenced for 733 base pairs of 28S ribosomal DNA and, four unique haplotypes were
identified (Table 3). The target fragment contained no gaps and had 12 variable sites (1.6%;
Table 2) 11 sites were parsimony informative (92%).
Hurry et al. (2014), PeerJ, DOI 10.7717/peerj.552 7/18
Genetic variationComparison of COI tree topology between speciesTree topologies for both taxa featured two or three deeply divided in-group clades
(Fig. 2A). The main difference between taxa was, for T. albata there was division into
three well-supported clades (clades A, B, C), whereas for their crayfish hosts E. robertsi, two
well-supported clades (D, E) were identified. The three T. albata clades corresponded
strongly with the three separate mountaintop populations, although one clade (B)
included a mixture of samples from Thornton Peak and Mt Finnigan. The spatial pattern
of the two clades in the E. robertsi tree grouped together samples from Mt Pieter Botte and
Thornton Peak together (clade D). Clade E was comprised mostly of samples from Mt
Finnigan.
Comparison of 28S tree topology between speciesThe 28S haplotype networks were similar in structure for both species, as both feature two
groups of haplotypes separated by quite a large mutational distance (10–11 bases; Fig. 2B).
In both networks, there were samples collected at Thornton Peak (blue: Fig. 2B) which
shared the same haplotype, or a very similar haplotype (one or two bases different), to
a number of the samples collected at Mt Pieter Botte. Also, for both species, haplotype
sharing was evident for samples collected at Thornton Peak and Mount Finnigan. Another
point of congruence between the species is that there was a large mutational distance
separating Mt Pieter Botte and some samples from Mt Finnigan. Finally, the 28S haplotype
networks showed strong similarities to the COI phylogenetic trees; the main difference
being that the T. albata 28S data exhibited two clades compared to three for the COI data.
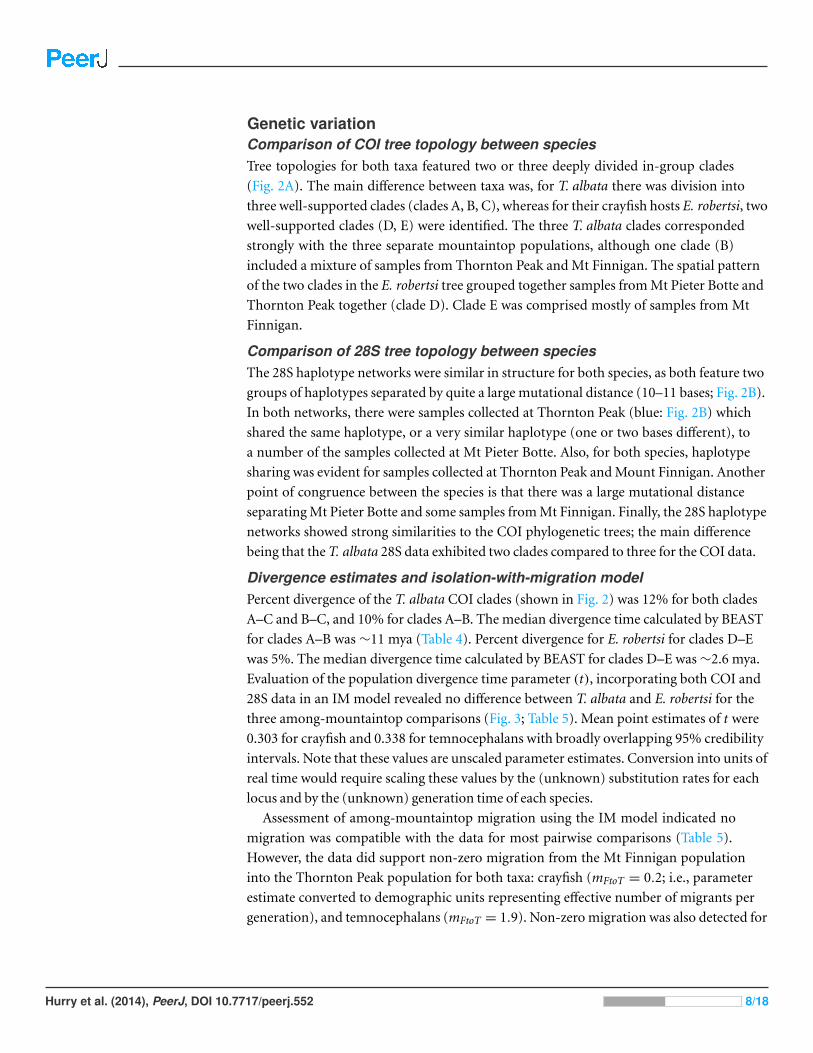
Divergence estimates and isolation-with-migration modelPercent divergence of the T. albata COI clades (shown in Fig. 2) was 12% for both clades
A–C and B–C, and 10% for clades A–B. The median divergence time calculated by BEAST
for clades A–B was ∼11 mya (Table 4). Percent divergence for E. robertsi for clades D–E
was 5%. The median divergence time calculated by BEAST for clades D–E was ∼2.6 mya.
Evaluation of the population divergence time parameter (t), incorporating both COI and
28S data in an IM model revealed no difference between T. albata and E. robertsi for the
three among-mountaintop comparisons (Fig. 3; Table 5). Mean point estimates of t were
0.303 for crayfish and 0.338 for temnocephalans with broadly overlapping 95% credibility
intervals. Note that these values are unscaled parameter estimates. Conversion into units of
real time would require scaling these values by the (unknown) substitution rates for each
locus and by the (unknown) generation time of each species.
Assessment of among-mountaintop migration using the IM model indicated no
migration was compatible with the data for most pairwise comparisons (Table 5).
However, the data did support non-zero migration from the Mt Finnigan population
into the Thornton Peak population for both taxa: crayfish (mFtoT = 0.2; i.e., parameter
estimate converted to demographic units representing effective number of migrants per
generation), and temnocephalans (mFtoT = 1.9). Non-zero migration was also detected for
Hurry et al. (2014), PeerJ, DOI 10.7717/peerj.552 8/18
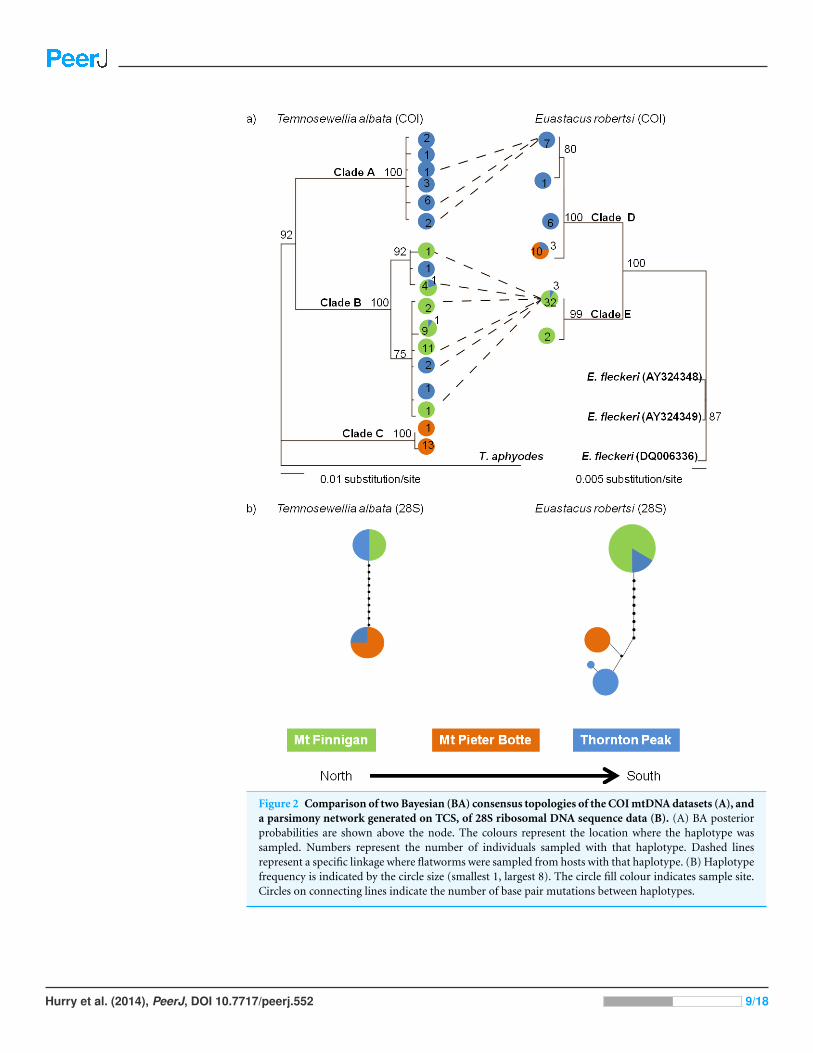
Figure 2 Comparison of two Bayesian (BA) consensus topologies of the COI mtDNA datasets (A), anda parsimony network generated on TCS, of 28S ribosomal DNA sequence data (B). (A) BA posteriorprobabilities are shown above the node. The colours represent the location where the haplotype wassampled. Numbers represent the number of individuals sampled with that haplotype. Dashed linesrepresent a specific linkage where flatworms were sampled from hosts with that haplotype. (B) Haplotypefrequency is indicated by the circle size (smallest 1, largest 8). The circle fill colour indicates sample site.Circles on connecting lines indicate the number of base pair mutations between haplotypes.
Hurry et al. (2014), PeerJ, DOI 10.7717/peerj.552 9/18
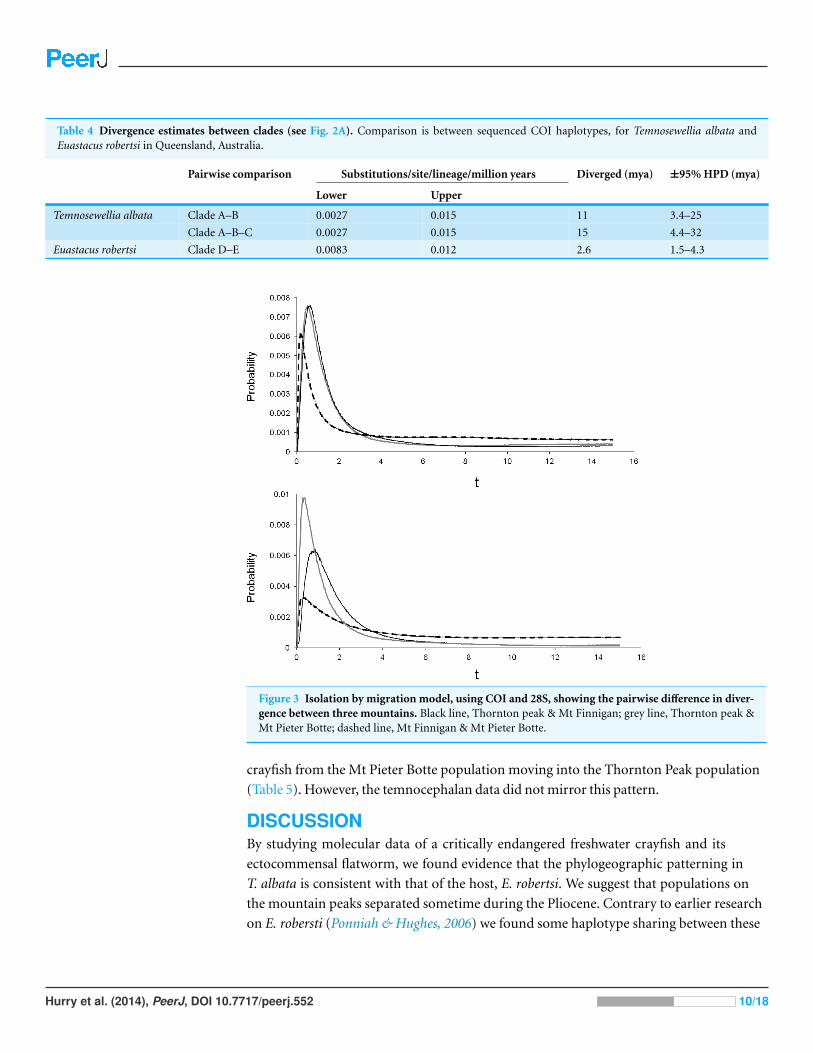
Table 4 Divergence estimates between clades (see Fig. 2A). Comparison is between sequenced COI haplotypes, for Temnosewellia albata andEuastacus robertsi in Queensland, Australia.
Pairwise comparison Substitutions/site/lineage/million years Diverged (mya) ±95% HPD (mya)
Lower Upper
Temnosewellia albata Clade A–B 0.0027 0.015 11 3.4–25
Clade A–B–C 0.0027 0.015 15 4.4–32
Euastacus robertsi Clade D–E 0.0083 0.012 2.6 1.5–4.3
Figure 3 Isolation by migration model, using COI and 28S, showing the pairwise difference in diver-gence between three mountains. Black line, Thornton peak & Mt Finnigan; grey line, Thornton peak &Mt Pieter Botte; dashed line, Mt Finnigan & Mt Pieter Botte.
crayfish from the Mt Pieter Botte population moving into the Thornton Peak population
(Table 5). However, the temnocephalan data did not mirror this pattern.
DISCUSSIONBy studying molecular data of a critically endangered freshwater crayfish and its
ectocommensal flatworm, we found evidence that the phylogeographic patterning in
T. albata is consistent with that of the host, E. robertsi. We suggest that populations on
the mountain peaks separated sometime during the Pliocene. Contrary to earlier research
on E. robersti (Ponniah & Hughes, 2006) we found some haplotype sharing between these
Hurry et al. (2014), PeerJ, DOI 10.7717/peerj.552 10/18
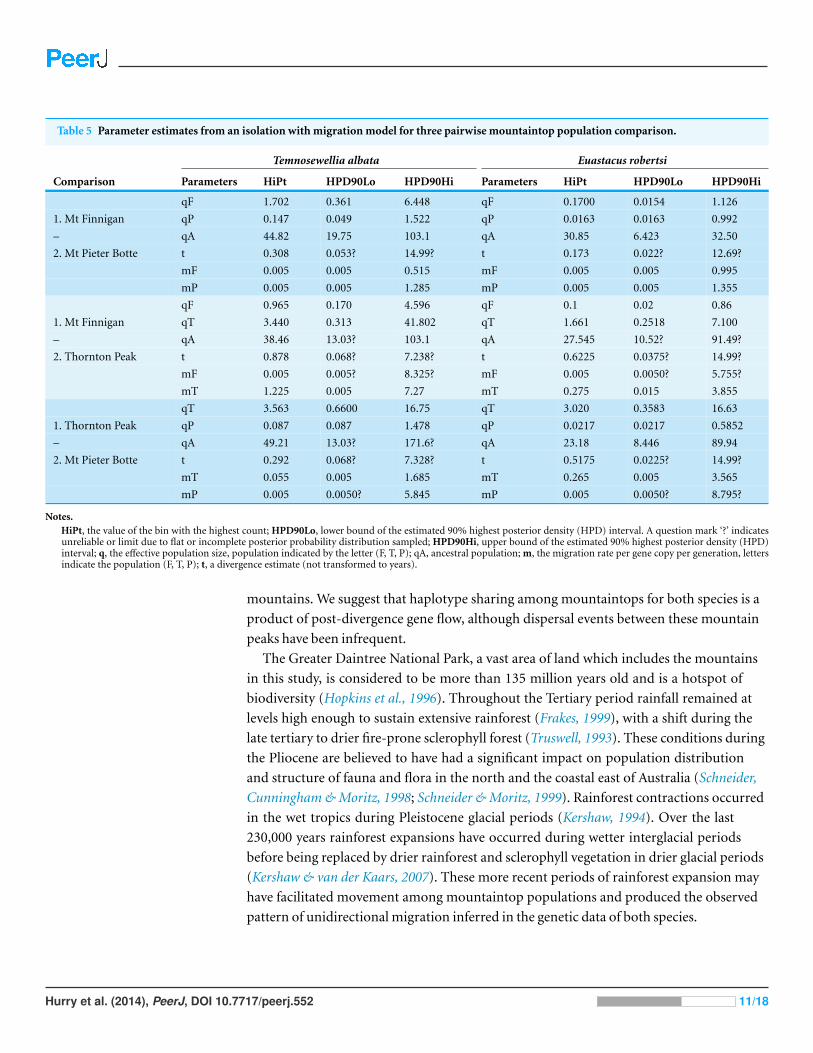
Table 5 Parameter estimates from an isolation with migration model for three pairwise mountaintop population comparison.
Temnosewellia albata Euastacus robertsi
Comparison Parameters HiPt HPD90Lo HPD90Hi Parameters HiPt HPD90Lo HPD90Hi
qF 1.702 0.361 6.448 qF 0.1700 0.0154 1.126
1. Mt Finnigan qP 0.147 0.049 1.522 qP 0.0163 0.0163 0.992
– qA 44.82 19.75 103.1 qA 30.85 6.423 32.50
2. Mt Pieter Botte t 0.308 0.053? 14.99? t 0.173 0.022? 12.69?
mF 0.005 0.005 0.515 mF 0.005 0.005 0.995
mP 0.005 0.005 1.285 mP 0.005 0.005 1.355
qF 0.965 0.170 4.596 qF 0.1 0.02 0.86
1. Mt Finnigan qT 3.440 0.313 41.802 qT 1.661 0.2518 7.100
– qA 38.46 13.03? 103.1 qA 27.545 10.52? 91.49?
2. Thornton Peak t 0.878 0.068? 7.238? t 0.6225 0.0375? 14.99?
mF 0.005 0.005? 8.325? mF 0.005 0.0050? 5.755?
mT 1.225 0.005 7.27 mT 0.275 0.015 3.855
qT 3.563 0.6600 16.75 qT 3.020 0.3583 16.63
1. Thornton Peak qP 0.087 0.087 1.478 qP 0.0217 0.0217 0.5852
– qA 49.21 13.03? 171.6? qA 23.18 8.446 89.94
2. Mt Pieter Botte t 0.292 0.068? 7.328? t 0.5175 0.0225? 14.99?
mT 0.055 0.005 1.685 mT 0.265 0.005 3.565
mP 0.005 0.0050? 5.845 mP 0.005 0.0050? 8.795?
Notes.HiPt, the value of the bin with the highest count; HPD90Lo, lower bound of the estimated 90% highest posterior density (HPD) interval. A question mark ‘?’ indicatesunreliable or limit due to flat or incomplete posterior probability distribution sampled; HPD90Hi, upper bound of the estimated 90% highest posterior density (HPD)interval; q, the effective population size, population indicated by the letter (F, T, P); qA, ancestral population; m, the migration rate per gene copy per generation, lettersindicate the population (F, T, P); t, a divergence estimate (not transformed to years).
mountains. We suggest that haplotype sharing among mountaintops for both species is a
product of post-divergence gene flow, although dispersal events between these mountain
peaks have been infrequent.
The Greater Daintree National Park, a vast area of land which includes the mountains
in this study, is considered to be more than 135 million years old and is a hotspot of
biodiversity (Hopkins et al., 1996). Throughout the Tertiary period rainfall remained at
levels high enough to sustain extensive rainforest (Frakes, 1999), with a shift during the
late tertiary to drier fire-prone sclerophyll forest (Truswell, 1993). These conditions during
the Pliocene are believed to have had a significant impact on population distribution
and structure of fauna and flora in the north and the coastal east of Australia (Schneider,
Cunningham & Moritz, 1998; Schneider & Moritz, 1999). Rainforest contractions occurred
in the wet tropics during Pleistocene glacial periods (Kershaw, 1994). Over the last
230,000 years rainforest expansions have occurred during wetter interglacial periods
before being replaced by drier rainforest and sclerophyll vegetation in drier glacial periods
(Kershaw & van der Kaars, 2007). These more recent periods of rainforest expansion may
have facilitated movement among mountaintop populations and produced the observed
pattern of unidirectional migration inferred in the genetic data of both species.
Hurry et al. (2014), PeerJ, DOI 10.7717/peerj.552 11/18
Shared phylogeographic patterningAt two independent loci we identified haplotype sharing between mountains for the
flatworm and its host. We cannot say with absolute certainty if these shared haplotypes are
the result of gene flow or retention of ancestral haplotypes, but analysis using the IM model
was compatible with low levels of unidirectional gene flow after population isolation.
The pattern shared by crayfish and flatworms was for migration from Mt Finnigan into
Thornton Peak. We established that, in both datasets, Mt Finnigan and Mt Pieter Botte
were isolated from each other due to a lack of haplotype sharing with no evidence of
migration. It has long been postulated that intervening lowlands are effective barriers to
dispersal for Queensland Euastacus (Ponniah & Hughes, 2004; Ponniah & Hughes, 2006).
It is also likely that the lack of migration for this species could be attributed to these two
mountains being on completely separate ridges. Furthermore, we consider it possible
that Mt Finnigan and Thornton Peak may have once shared a ridge making historical
connections between them more likely. These connections may have been present either
overland or through historical stream connections. Historical connections between these
two mountains have been found for the beetle Philipis (Baehr, 1995). As Euastacus are
known to be able to survive for long periods out of water they have the ability to traverse
over land (Furse & Wild, 2002), although overland dispersal may be rarer in some species.
Intervening high points along ridge lines may have allowed for historical migration
pathways. Current elevations between these mountains are no lower than 350 m at some
places. Therefore, although it has been shown to be a rare occurrence, it is possible that
migration between sites is possible, at least between two of the mountain ridges.
The congruence that we observed in the phylogeographic pattern of T. albata and
its crayfish host suggests that their evolutionary histories are spatially linked; therefore,
if hosts are capable of overland dispersal, so are the flatworms. The exact mechanism
of dispersal for Temnosewellia is unknown. As the genus is generally considered to be
host-specific it is expected that, like other temnocephalans, they undergo their entire
life cycle and subsequent generations on a single host crayfish (Sewell, Cannon & Blair,
2006). The mechanisms that allow them to survive the moult phase of their hosts are not
known; however, observations by Haswell (1983) and Nichols (1975), on closely related
temnocephalans, noted that they may be able to survive for some time in the absence of
a host. Even though the flatworm’s ectoderm is somewhat prone to desiccation (Haswell,
1909; C Hurry, pers. obs., 2014), flatworms may still be able to disperse overland with their
host due to the durability of their unhatched eggs. Temnosewellia will lay tens to hundreds
of eggs which stick firmly to the exoskeleton of the crayfish (Wild & Furse, 2004; C Hurry,
pers. obs., 2014). Eggs are enclosed in a tough outer coating and have a large fluid filled
cavity (Haswell, 1909), which may prevent desiccation of the unhatched young allowing
long distance movement in the absence of water. As so little is known of Temnosewellia
this hypothesis has not been tested and further work is needed to determine dispersal
mechanisms in these flatworms.
Hurry et al. (2014), PeerJ, DOI 10.7717/peerj.552 12/18
Time of divergenceAs low levels of migration were detected it should be easier to detect founding events.
Our results show that, for both these species, isolation and divergence among refugial
mountaintop populations was old enough to have resulted in accumulation of mutational
differences. Comparison of COI divergence times for a node marking the split between
Mt Finnigan and Thornton Peak for both taxa suggested the temnocephalan divergence
may be older than the crayfish (∼11 mya compared to ∼2.6 mya). However this result
is contingent on calibration using molecular clock rates from the literature. Numerous
studies have highlighted variability in substitution rates between taxa (Wilke, Schultheiß &
Albrecht, 2009; Lanfear, Welch & Bromham, 2010), so caution is required in interpreting the
divergence times presented here. By taking a different population-based approach—using
the multilocus, isolation-with-migration model—we showed that the population splitting
parameter t was indistinguishable between the two species. This comparison incorporates
data from another locus in addition to COI, and does not depend on application of
molecular clock rates (which may not be appropriate for our study species). However it
does have the drawback of not being expressed in units of absolute time. Weighing-up
both of these results leads us to conclude that either (1) the mountaintop divergences of
both species did occur contemporaneously, but that a greater number of substitutions
have become fixed in the mitochondrial genome of the flatworm compared to the crayfish
(i.e., their divergence rates are different) or (2) T. albata did diverge earlier than their
hosts. The second assumption is entirely possible if in the past T. albata had a different
host which has now become extinct. A different host could either be an ancestral Euastacus
which was not sampled as part of this study or another crustacean host altogether. If we
were able to confirm the authenticity of the single T. albata sampled upon the crayfish
Cherax depressus ∼515 km south of Mount Pieter Botte (Sewell, Cannon & Blair, 2006); we
may find that in the past the distribution of this species was much wider. However, as this
hypothesis is based upon just one sample we are cautious in offering this interpretation.
Our calculations support a separation sometime during the Pliocene. As previously stated,
conditions during the Pliocene are believed to have had a significant impact on population
distribution and structure of fauna and flora in the north and the coastal east of Australia
due to vicariance events.
Due to the close association that Temnosewellia share with their host they may be, in
future studies, considered to be a suitable proxy in resolving phylogeographic patterning
in their hosts. Nieberding & Olivieri (2007) tell us that ‘parasites’ that act as suitable proxy
species are without intermediate hosts and have no phase of living independently of their
host. Equally they are individuals which display smaller Ne at the population level and
exhibit lower gene flow than their hosts among populations. These factors combined
allow them to display a stronger population structure than their host, making them
especially useful in cases where hosts are rare or hard to sample in large numbers. As
Temnosewellia satisfies many of these criteria their role in future studies may be to help
resolve host phylogenies or phylogeographic history. The existence in this study of three
deeply divided COI lineages in the temnocephalan compared with two in the crayfish may
Hurry et al. (2014), PeerJ, DOI 10.7717/peerj.552 13/18
indeed indicate that the ectocommensal genealogy records part of the crayfish history
that is lost due to stochastic sorting of lineages and extinction/recolonisation events. One
possibility is that a third crayfish mtDNA lineage did exist on Mt Pieter Botte, but was
replaced by the Thornton Peak mtDNA lineage following a colonisation event. In this
scenario the ectocommensal history acts as proxy for the crayfish history. However the
extra temnocephalan mtDNA lineage might also be explained by lineage retention or by
failure to detect a corresponding third lineage in our crayfish sample.
We were able to demonstrate that the association between E. robertsi and T. albata
has likely persisted over several million years. The results from our study are applicable
to host-commensal relationships worldwide, as they show that shared histories between
such close commensal species may span millions of years. A growing number of examples
in the literature are demonstrating that symbionts can be used to infer host history for
conservation gains (Colwell, Dunn & Harris, 2012), which highlight the importance of
studying symbiotic species alongside their hosts. We suggest that future phylogeographic
studies exploit host-commensal interactions to provide objective measures of biodiversity,
population subdivisions and phylogeographic information in the host. These interactions
should be considered in management plans for crayfish species, especially as this technique
may prove useful when host numbers are small, due to rarity or low catch rates.
ACKNOWLEDGEMENTSAssistance in the field was provided by C Marshall, L Roberts, S Schmidt, J Ravenscroft, and
M De Zilva. Two reviewers made many insightful suggestions and provided extra reading
material which vastly improved this article.
ADDITIONAL INFORMATION AND DECLARATIONS
FundingWe received funding from Griffith University provided to Mark Ponniah through the New
Researcher Grant. The funders had no role in study design, data collection and analysis,
decision to publish, or preparation of the manuscript.
Grant DisclosuresThe following grant information was disclosed by the authors:
Griffith Universiy.
Competing InterestsJane Hughes is an Academic Editor for PeerJ.
Author Contributions• Charlotte R. Hurry analyzed the data, wrote the paper, prepared figures and/or tables.
• Daniel J. Schmidt analyzed the data, reviewed drafts of the paper.
• Mark Ponniah conceived and designed the experiments.
• Giovannella Carini performed the experiments.
Hurry et al. (2014), PeerJ, DOI 10.7717/peerj.552 14/18
• David Blair reviewed drafts of the paper, provided additional genetic sequences which
he had obtained, provided advice on DNA extraction methods for the flatworms, he also
read and corrected/commented on earlier drafts.
• Jane M. Hughes conceived and designed the experiments, contributed
reagents/materials/analysis tools, reviewed drafts of the paper.
Field Study PermissionsThe following information was supplied relating to field study approvals (i.e., approving
body and any reference numbers):
The Queensland National Parks and Wildlife Service provided the necessary permits to
collect samples as part of an earlier project by Mark Ponniah, see references 2004 & 2006.
Supplemental InformationSupplemental information for this article can be found online at http://dx.doi.org/
10.7717/peerj.552#supplemental-information.
REFERENCESBaehr M. 1995. Revision of Philipis (Coleoplera: Carabidae; Bembidiinae), a genus of arboreal
tachyine beetles from the rainforests of eastern Australia. Taxonomy, phytogeny andbiogeography. Memoirs of the Queensland Museum 12:315–381.
Barbosa AM, Thode G, Real R, Feliu C, Vargas JM. 2012. Phylogeographic triangulation:using predator–prey-parasite interactions to infer population history from partial geneticinformation. PLoS ONE 7(11):1–5 DOI 10.1371/journal.pone.0050877.
Bensasson D, Zhang X, Hartl DL, Hewitt GM. 2001. Mitochondrial pseudogenes: evolution’smisplaced witnesses. Trends in Ecology and Evolution 16:314–321DOI 10.1016/S0169-5347(01)02151-6.
Brown B, Creed RP, Dobson WE. 2002. Branchiobdellid annelids and their crayfish hosts: are theyengaged in a cleaning symbiosis? Oecologia 132:250–255 DOI 10.1007/s00442-002-0961-1.
Brown BL, Creed RP, Skelton J, Rollins M, Farrell K. 2012. The fine line between mutualism andparasitism: complex effects in a cleaning symbiosis demonstrated by multiple field experiments.Oecologia 170(1):199–207 DOI 10.1007/s00442-012-2280-5.
Carini G, Hughes JM. 2006. Population genetic structure and phylogeography of an endangeredfreshwater snail, Notopala sublineata (Gastropoda: Viviparidae) in western Queensland. Aus-tralia Biological Journal of the Linnean Society 88:1–16 DOI 10.1111/j.1095-8312.2006.00594.x.
Clement M, Posada D, Crandall KA. 2000. TCS: a computer program to estimate genegenealogies. Molecular Ecology 9:1657–1659 DOI 10.1046/j.1365-294x.2000.01020.x.
Colwell RK, Dunn RR, Harris NC. 2012. Coextinction and persistence of dependent speciesin a changing world. Annual Review of Ecology, Evolution, and Systematics 43:183–203DOI 10.1146/annurev-ecolsys-110411-160304.
Coughran J, Furse J. 2010. IUCN 2012. IUCN Red List of Threatened Species. Version 2012.2.Available at www.iucnredlist.org (accessed 13 June 2013).
Crandall KA, Harris DJ, Fetzner JW. 2000. The monophyletic origin of freshwater crayfishestimated from nuclear and mitochondrial DNA sequences. Proceedings of the Royal SocietyB: Biological Sciences 267:1679–1686 DOI 10.1098/rspb.2000.1195.
Hurry et al. (2014), PeerJ, DOI 10.7717/peerj.552 15/18
Drummond A, Rambaut A. 2007. Beast: Bayesian evolutionary analysis by sampling trees. BMCEvolutionary Biology 7:214 DOI 10.1186/1471-2148-7-214.
Drummond AJ, Suchard MA, Xie D, Rambaut A. 2012. Bayesian phylogenetics with Beauti andthe Beast 1.7. Molecular Biology and Evolution 29:1969–1973 DOI 10.1093/molbev/mss075.
Folmer O, Black M, Hoeh W, Lutz R, Vrijenhoek R. 1994. DNA primers for amplification ofmitochondrial cytochrome c oxidase subunit I from diverse metazoan invertebrates. MolecularMarine Biology and Biotechnology 3:294–299.
Frakes L. 1999. Evolution of Australian environments. In: Flora of Australia. 2nd edition. vol. 1.Canberra: Australian Biological Resources Study, 163–203.
Furse JM, Wild CH. 2002. Terrestrial activities of Euastacus sulcatus, the Lamington spiny crayfish(Decapoda: Parastacidae). Freshwater Crayfish 13:604–604.
Harris NC, Coonan TJ, King JL, Dunn RR. 2013. Endemism in host–parasite interactionsamong island populations of an endangered species. Diversity and Distributions 19:377–385DOI 10.1111/ddi.12016.
Haswell WA. 1983. A monograph of the Temnocephaleae. In: Proceedings of the Linnean society ofnew South Wales, the Macleay memorial volume. 93–152.
Haswell W. 1909. Memoirs: the development of the Temnocephalese. Part I. Quarterly Journal ofMicroscopical Science 2(215):415–441.
Hey J, Nielsen R. 2004. Multilocus methods for estimating population sizes, migration ratesand divergence time, with applications to the divergence of Drosophila pseudoobscura andD. persimilis. Genetics 167:747–760 DOI 10.1534/genetics.103.024182.
Hopkins MS, Head J, Ash JE, Hewett RK, Graham AW. 1996. Evidence of a holocene andcontinuing recent expansion of lowland rain forest in humid, tropical north Queensland.Journal of Biogeography 23(6):737–745 DOI 10.1111/j.1365-2699.1996.tb00035.x.
Huelsenbeck JP, Ronquist F. 2001. Mrbayes: Bayesian inference of phylogenetic trees.Bioinformatics 17:754–755 DOI 10.1093/bioinformatics/17.8.754.
Hughes JM, Schmidt DJ, Finn DS. 2009. Genes in streams: using DNA to understandthe movement of freshwater fauna and their riverine habitat. BioScience 59:573–583DOI 10.1525/bio.2009.59.7.8.
James PMA, Coltman DW, Murray BW, Hamelin RC, Sperling FAH. 2011. Spatial geneticstructure of a symbiotic beetle-fungal system: toward multi-taxa integrated landscape genetics.PLoS ONE 6:e25359 DOI 10.1371/journal.pone.0025359.
Jones T, Lester R. 1992. The life history and biology of Diceratocephala boschmai (Platyhelminthes;Temnocephalida), an ectosymbiont on the redclaw crayfish Cherax quadricarinatus.Hydrobiologia 248:193–199 DOI 10.1007/BF00006147.
Kershaw AP. 1994. Pleistocene vegetation of the humid tropics of northeasternQueensland, Australia. Palaeogeography, Palaeoclimatology, Palaeoecology 109:399–412DOI 10.1016/0031-0182(94)90188-0.
Kershaw AP, van der Kaars S. 2007. Pollen records, Late Pleistocene, Australia and New Zealand.In: Elias SA, ed. Encyclopedia of quaternary science, vol. 4. Amsterdam: Elsevier, 2613–2622.
Ketmaier V, Argano R, Caccone A. 2003. Phylogeography and molecular rates of subterraneanaquatic Stenasellid Isopods with a peri-Tyrrhenian distribution. Molecular Ecology 12:547–555DOI 10.1046/j.1365-294X.2003.01734.x.
Hurry et al. (2014), PeerJ, DOI 10.7717/peerj.552 16/18
Lanfear R, Welch JJ, Bromham L. 2010. Watching the clock: studying variation in ratesof molecular evolution between species. Trends in Ecology and Evolution 25:495–503DOI 10.1016/j.tree.2010.06.007.
Lazaro EM, Harrath AH, Stocchino GA, Pala M, Baguna J, Riutort M. 2011. Schmidteamediterranea phylogeography: an old species surviving on a few Mediterranean islands? BMCEvolutionary Biology 11 DOI 10.1186/1471-2148-11-274.
McCormack RB. 2012. A guide to Australia’s freshwater spiny crayfish. Collingwood: CSIROPublishing.
McDermott JJ, Williams JD, Boyko CB. 2010. The unwanted guests of hermits: a global reviewof the diversity and natural history of hermit crab parasites. Journal of Experimental MarineBiology and Ecology 394:2–44 DOI 10.1016/j.jembe.2010.06.022.
McLean AJ, Schmidt DJ, Hughes JM. 2008. Do lowland habitats represent barriers to dispersal fora rainforest mayfly, Bungona narilla, in south-east Queensland? Marine and Freshwater Research59:761–771 DOI 10.1071/MF07202.
Monroe R. 1977. A new species of Euastacus (decapoda: Parastacidae) from north queensland.Memoirs of the Queensland Museum 18:65–67.
Morgan GJ. 1997. Freshwater crayfish of the genus Euastacus clark (Decapoda: Parastacidae) fromNew South Wales, with a key to all species of the genus. Records of the Australian MuseumSupplement 23:1–110 DOI 10.3853/j.0812-7387.23.1997.429.
Nichols CK. 1975. Observations on lesser-known flatworms: Temnocephala. International Journalfor Parasitology 5:245–252 DOI 10.1016/0020-7519(75)90114-9.
Nieberding C, Morand S, Libois R, Michaux JR. 2004. A parasite reveals cryptic phylogeographichistory of its host. Proceedings of the Royal Society B: Biological Sciences 271:2559–2568DOI 10.1098/rspb.2004.2930.
Nieberding C, Olivieri I. 2007. Parasites: proxies for host genealogy and ecology? Trends in Ecology& Evolution 22:156–165 DOI 10.1016/j.tree.2006.11.012.
Ohtaka A, Gelder SR, Nishino M, Ikeda M, Toyama H, Cui Y-D, He X-B, Wang H-Z, Chen R-B,Wang ZY. 2012. Distributions of two ectosymbionts, branchiobdellidans (Annelida: Clitellata)and scutariellids (Platyhelminthes: “Turbellaria”: Temnocephalida), on atyid shrimp(Arthropoda: Crustacea) in southeast China. Journal of Natural History 46:1547–1556DOI 10.1080/00222933.2012.692826.
Ponniah M, Hughes JM. 2004. The evolution of Queensland spiny mountain crayfish of the genusEuastacus. I. Testing vicariance and dispersal with interspecific mitochondrial DNA. Evolution58:1073–1085 DOI 10.1111/j.0014-3820.2004.tb00441.x.
Ponniah M, Hughes JM. 2006. The evolution of Queensland spiny mountain crayfish of the genusEuastacus. II. Investigating simultaneous vicariance with intraspecific genetic data. Marine andFreshwater Research 57:349–362 DOI 10.1071/MF05172.
Posada D. 2008. Jmodeltest: phylogenetic model averaging. Molecular Biology and Evolution25:1253–1256 DOI 10.1093/molbev/msn083.
Rannala B, Michalakis Y. 2003. Population genetics and cospeciation: from process to pattern.In: Page RDM, ed. Tangled trees: phylogeny, cospeciation and coevolution. Chicago: TheUniversity of Chicago Press, 120–143.
Schneider CJS, Cunningham M, Moritz C. 1998. Comparitive phylogeography and the history ofendemic vertebrates in the Wet Tropics rainforests of Australia. Molecular Ecology 7:487–498DOI 10.1046/j.1365-294x.1998.00334.x.
Hurry et al. (2014), PeerJ, DOI 10.7717/peerj.552 17/18
Schneider CJS, Moritz C. 1999. Rainforest refugia and Australia’s wet tropics. Proceedings of theRoyal Society London B266:191–196 DOI 10.1098/rspb.1999.0621.
Sewell KB, Cannon LRG, Blair D. 2006. A review of Temnohaswellia and Temnosewellia(Platyhelminthes: Temnocephalida: Temnocephalidae), ectosymbionts from Australian crayfishEuastacus (parastacidae). Memoirs of the Queensland Museum 52:199–279.
Shull HC, Perez-Losada M, Blair D, Sewell K, Sinclair EA, Lawler S, Ponniah M, Crandall KA.2005. Phylogeny and biogeography of the freshwater crayfish Euastacus (Decapoda:Parastacidae) based on nuclear and mitochondrial DNA. Molecular Phylogenetics and Evolution37:249–263 DOI 10.1016/j.ympev.2005.04.034.
Sola E, Sluys R, Gritzalis K, Riutort M. 2013. Fluvial basin history in the northeasternMediterranean region underlies dispersal and speciation patterns in the genus Dugesia(Platyhelminthes, Tricladida, Dugesiidae). Molecular Phylogenetics and Evolution 66:877–888DOI 10.1016/j.ympev.2012.11.010.
Tamura K, Peterson D, Peterson N, Stecher G, Nei M, Kumar S. 2011. MEGA5: molecularevolutionary genetics analysis using maximum likelihood, evolutionary distance,and maximum parsimony methods. Molecular Biology and Evolution 28:2731–2739DOI 10.1093/molbev/msr121.
Toon A, Hughes J. 2008. Are lice good proxies for host history? A comparative analysis of theAustralian magpie, Gymnorhina tibicen, and two species of feather louse. Heredity 101:127–135DOI 10.1038/hdy.2008.37.
Truswell EM. 1993. Vegetation in the Australian tertiary in response to climatic and phytogeo-graphic forcing factors. Australian Systematic Botany 6:533–557 DOI 10.1071/SB9930533.
Whiteman NK, Kimball RT, Parker PG. 2007. Co-phylogeography and comparative populationgenetics of the threatened Galapagos hawk and three ectoparasite species: ecology shapespopulation histories within parasite communities. Molecular Ecology 16:4759–4773DOI 10.1111/j.1365-294X.2007.03512.x.
Whiteman NK, Parker PG. 2005. Using parasites to infer host population history: a new rationalefor parasite conservation. Animal Conservation 8:175–181 DOI 10.1017/S1367943005001915.
Wild CH, Furse JM. 2004. The relationship between Euastacus sulcatus and Temnocephalan spp.(Platyhelminthes) in the Gold Coast Hinterland, Queensland. Freshwater Crayfish 14:236–245.
Wilke T, Schultheiß R, Albrecht C. 2009. As time goes by: a simple fool’s guide tomolecular clock approaches in invertebrates. American Malacological Bulletin 27:25–45DOI 10.4003/006.027.0203.
Hurry et al. (2014), PeerJ, DOI 10.7717/peerj.552 18/18