shaking up the classroom – activities with earthquake seismograms 1 l. braile, purdue university...
Post on 21-Dec-2015
217 views
TRANSCRIPT

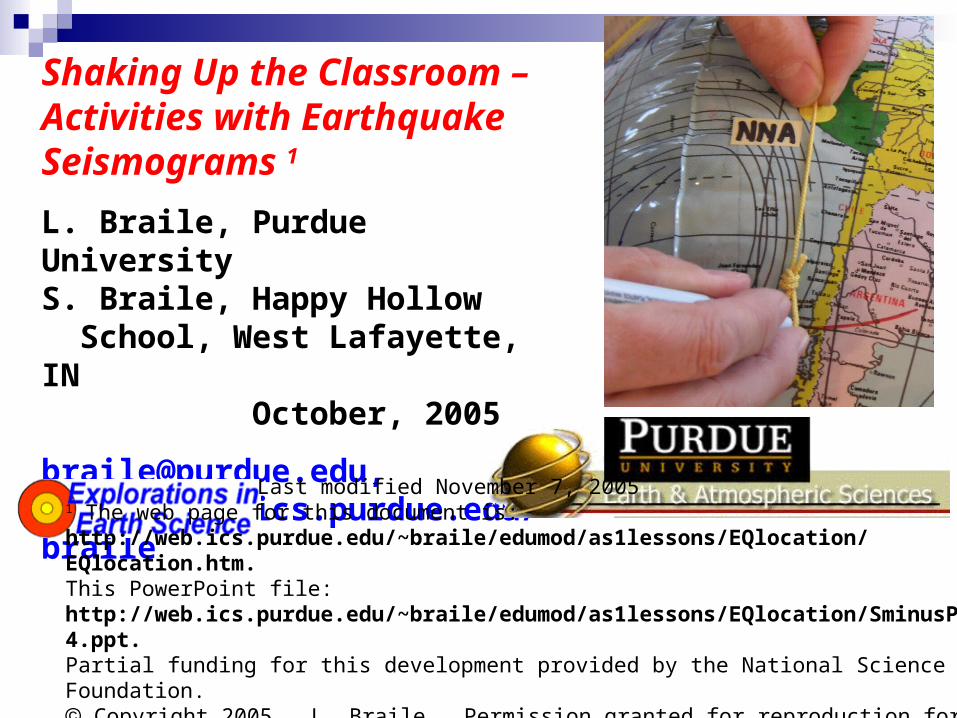
Shaking Up the Classroom – Activities with Earthquake Seismograms 1
L. Braile, Purdue UniversityS. Braile, Happy Hollow School, West Lafayette, IN October, 2005
[email protected], http://web.ics.purdue.edu/~braile
Last modified November 7, 20051 The web page for this document is: http://web.ics.purdue.edu/~braile/edumod/as1lessons/EQlocation/EQlocation.htm. This PowerPoint file: http://web.ics.purdue.edu/~braile/edumod/as1lessons/EQlocation/SminusP0304.ppt. Partial funding for this development provided by the National Science Foundation. Copyright 2005. L. Braile. Permission granted for reproduction for non-commercial uses.
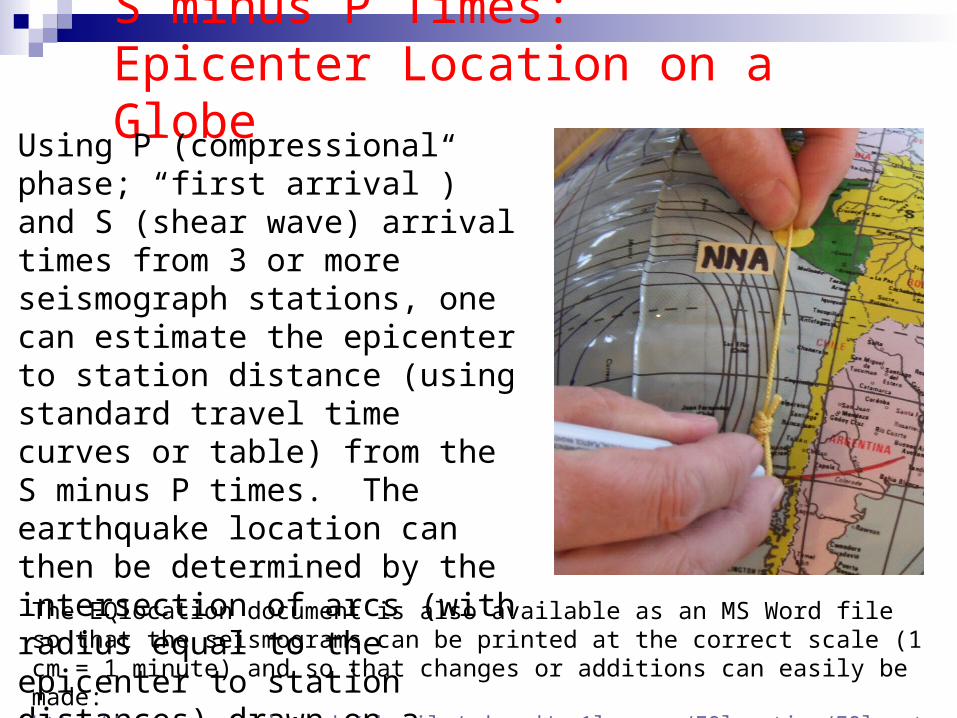
S minus P Times: Epicenter Location on a Globe
Using P (compressional phase; “first arrival”) and S (shear wave) arrival times from 3 or more seismograph stations, one can estimate the epicenter to station distance (using standard travel time curves or table) from the S minus P times. The earthquake location can then be determined by the intersection of arcs (with radius equal to the epicenter to station distances) drawn on a globe.
The EQlocation document is also available as an MS Word file so that the seismograms can be printed at the correct scale (1 cm = 1 minute) and so that changes or additions can easily be made: http://www.eas.purdue.edu/~braile/edumod/as1lessons/EQlocation/EQlocation.doc.
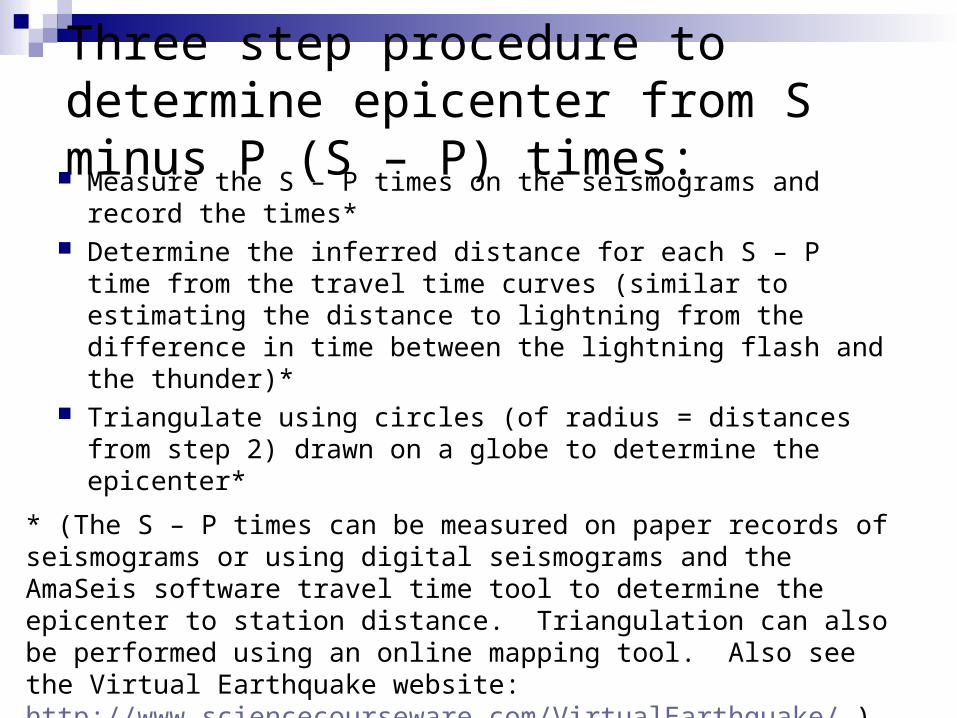
Three step procedure to determine epicenter from S minus P (S – P) times: Measure the S – P times on the seismograms and
record the times* Determine the inferred distance for each S – P time from
the travel time curves (similar to estimating the distance to lightning from the difference in time between the lightning flash and the thunder)*
Triangulate using circles (of radius = distances from step 2) drawn on a globe to determine the epicenter*
* (The S – P times can be measured on paper records of seismograms or using digital seismograms and the AmaSeis software travel time tool to determine the epicenter to station distance. Triangulation can also be performed using an online mapping tool. Also see the Virtual Earthquake website: http://www.sciencecourseware.com/VirtualEarthquake/ )
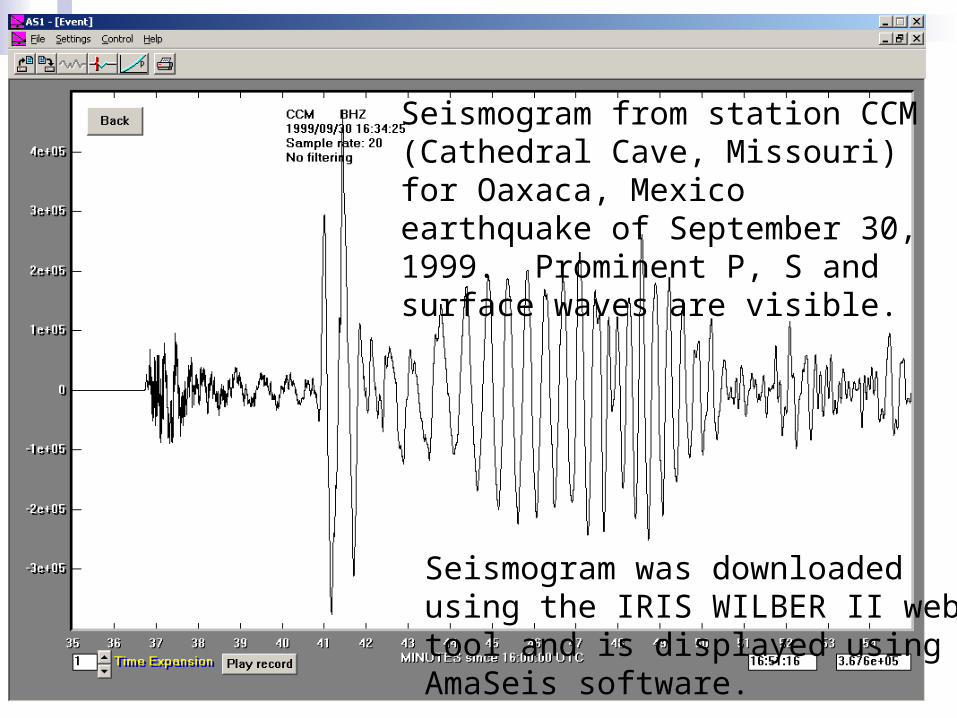
Seismogram from station CCM (Cathedral Cave, Missouri) for Oaxaca, Mexico earthquake of September 30, 1999. Prominent P, S and surface waves are visible.
Seismogram was downloaded using the IRIS WILBER II web tool and is displayed using AmaSeis software.
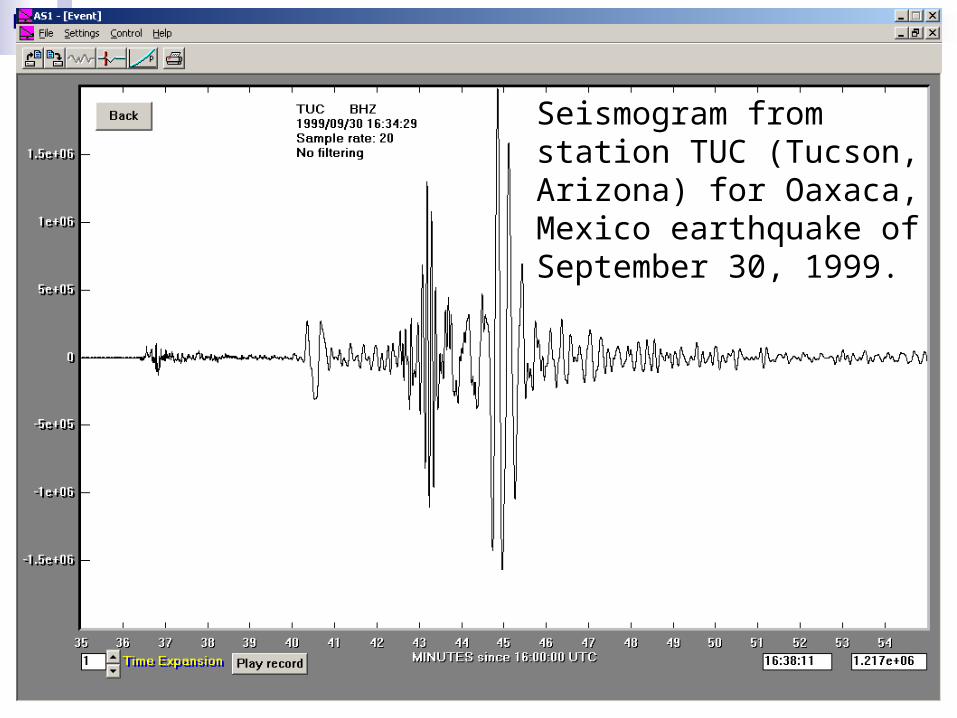
Seismogram from station TUC (Tucson, Arizona) for Oaxaca, Mexico earthquake of September 30, 1999.
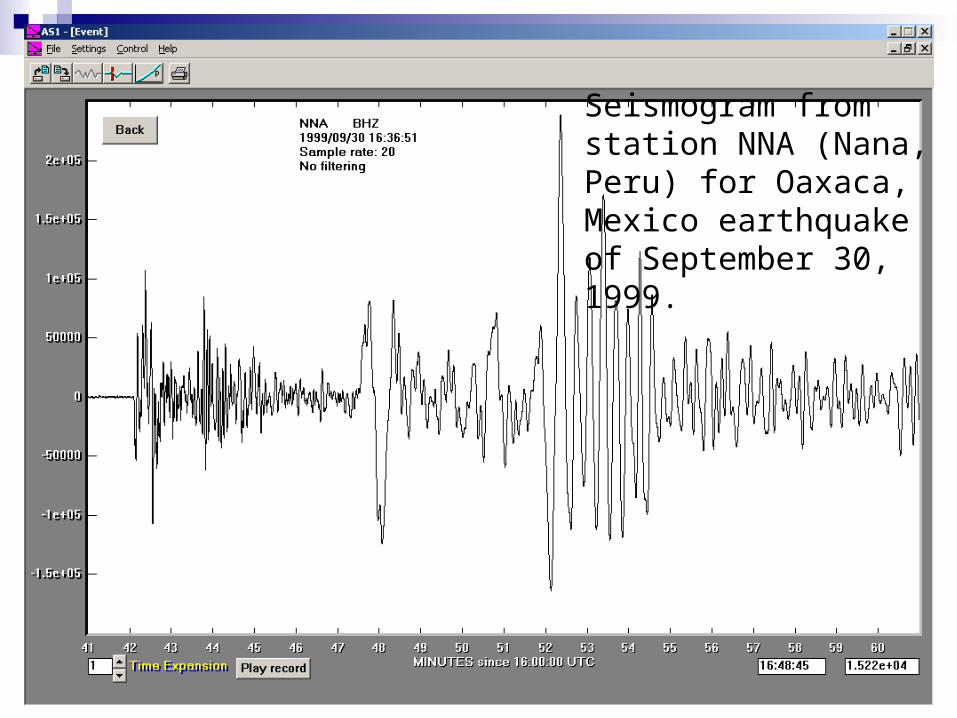
Seismogram from station NNA (Nana, Peru) for Oaxaca, Mexico earthquake of September 30, 1999.
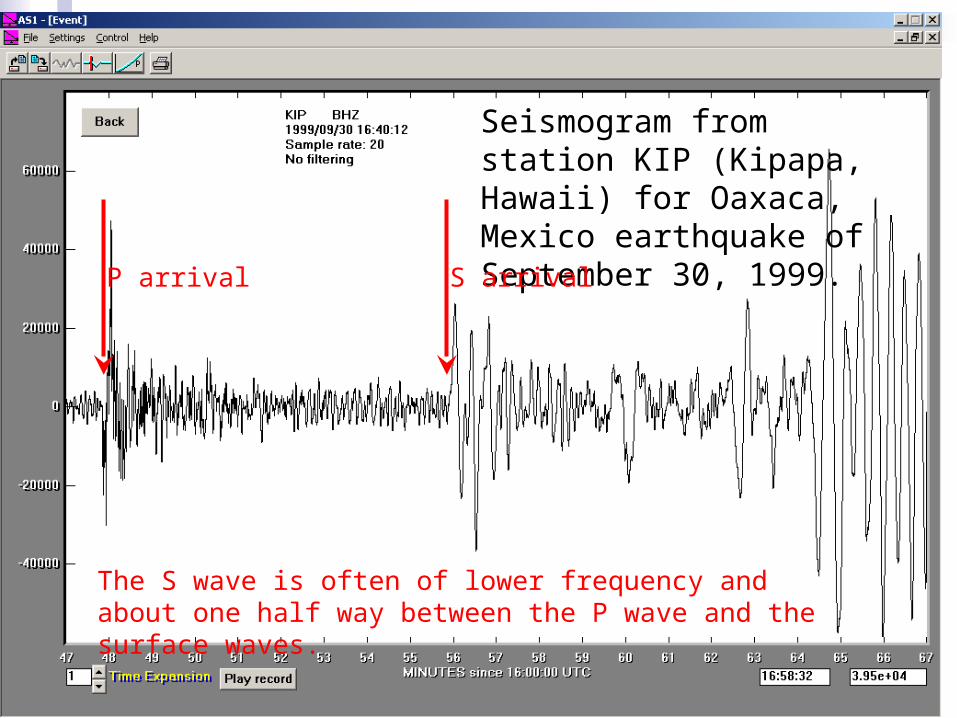
Seismogram from station KIP (Kipapa, Hawaii) for Oaxaca, Mexico earthquake of September 30, 1999.
P arrival S arrival
The S wave is often of lower frequency and about one half way between the P wave and the surface waves.
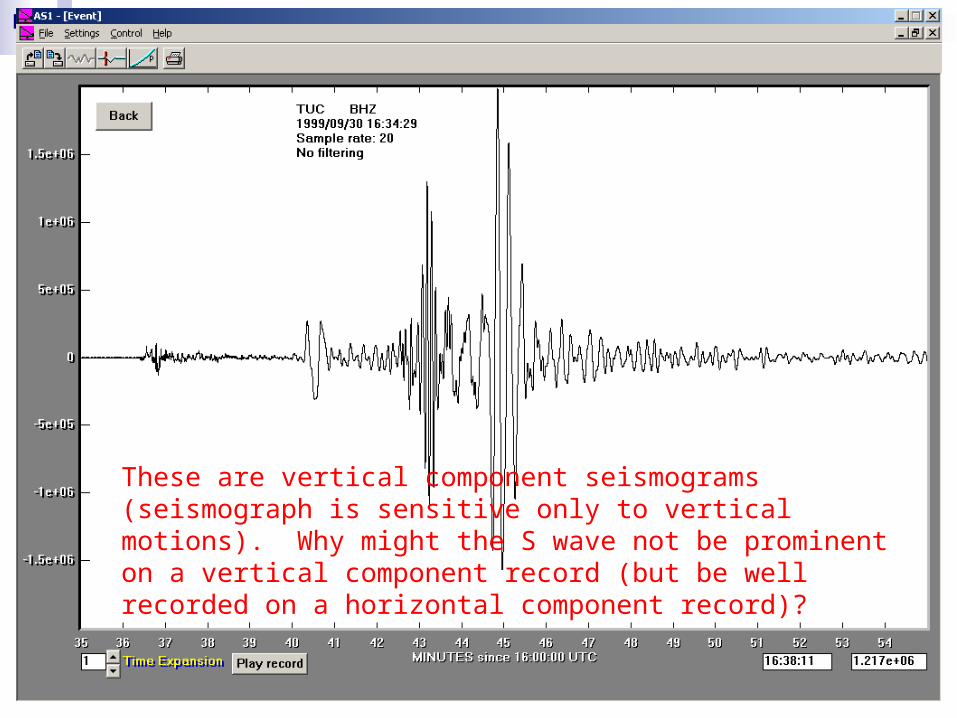
These are vertical component seismograms (seismograph is sensitive only to vertical motions). Why might the S wave not be prominent on a vertical component record (but be well recorded on a horizontal component record)?
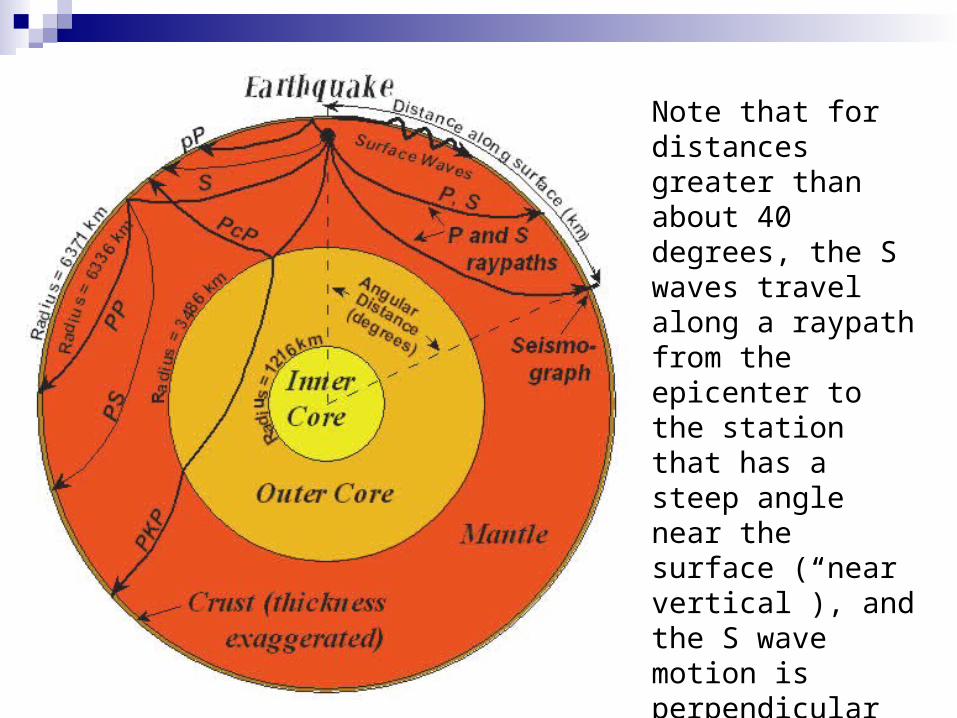
Note that for distances greater than about 40 degrees, the S waves travel along a raypath from the epicenter to the station that has a steep angle near the surface (“near vertical”), and the S wave motion is perpendicular to the direction of propagation (the raypath direction).
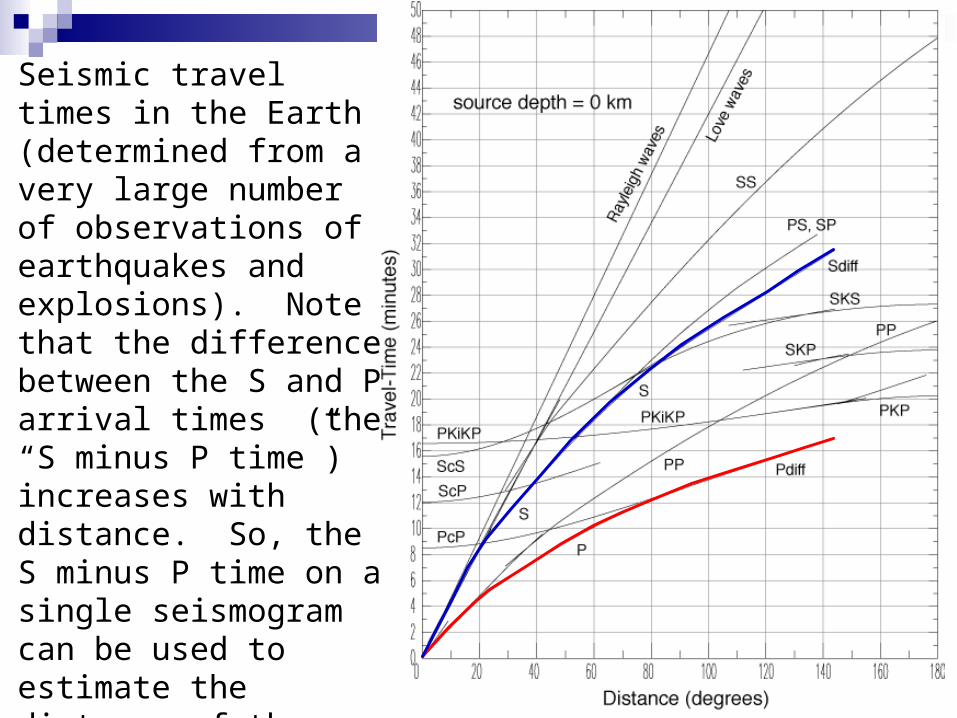
Seismic travel times in the Earth (determined from a very large number of observations of earthquakes and explosions). Note that the difference between the S and P arrival times (the “S minus P time”) increases with distance. So, the S minus P time on a single seismogram can be used to estimate the distance of the station from the epicenter (1 degree = 111.19 km).
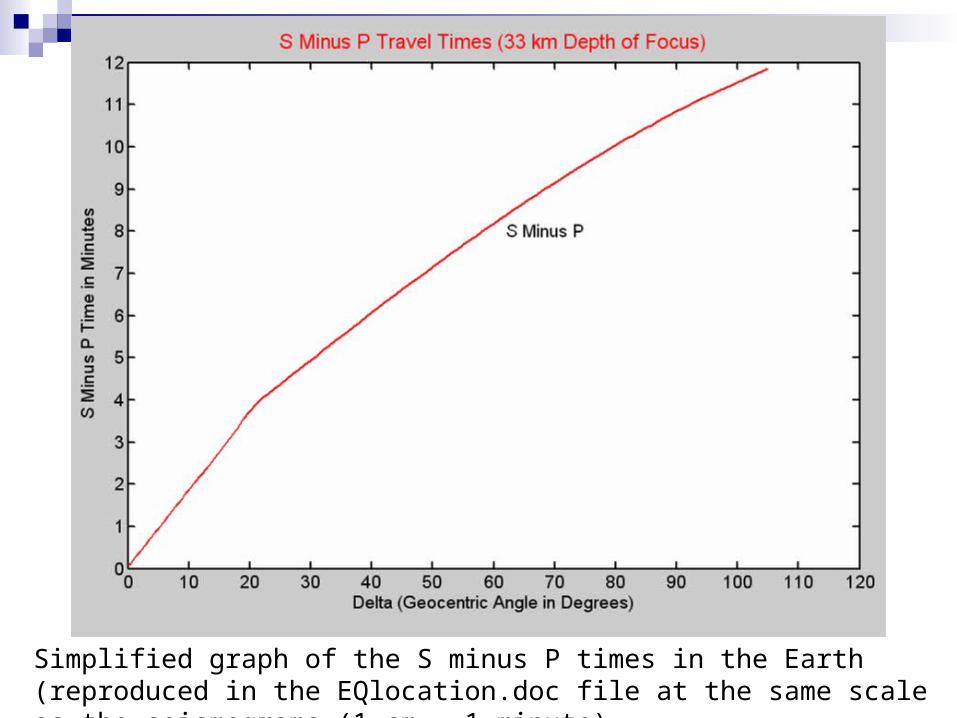
Simplified graph of the S minus P times in the Earth (reproduced in the EQlocation.doc file at the same scale as the seismograms (1 cm = 1 minute).
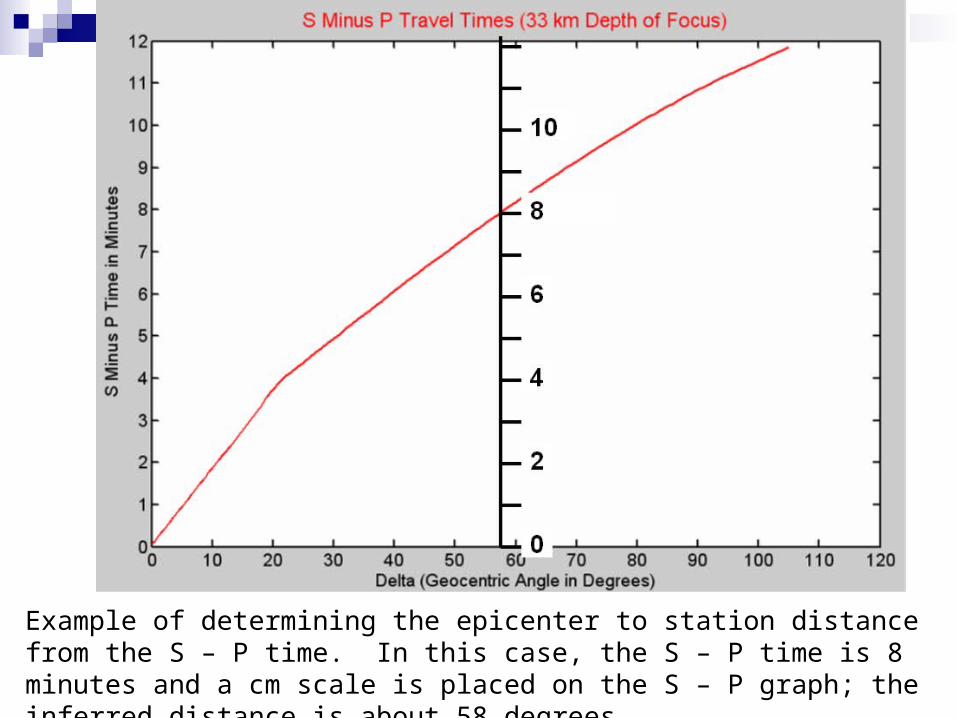
Example of determining the epicenter to station distance from the S – P time. In this case, the S – P time is 8 minutes and a cm scale is placed on the S – P graph; the inferred distance is about 58 degrees.
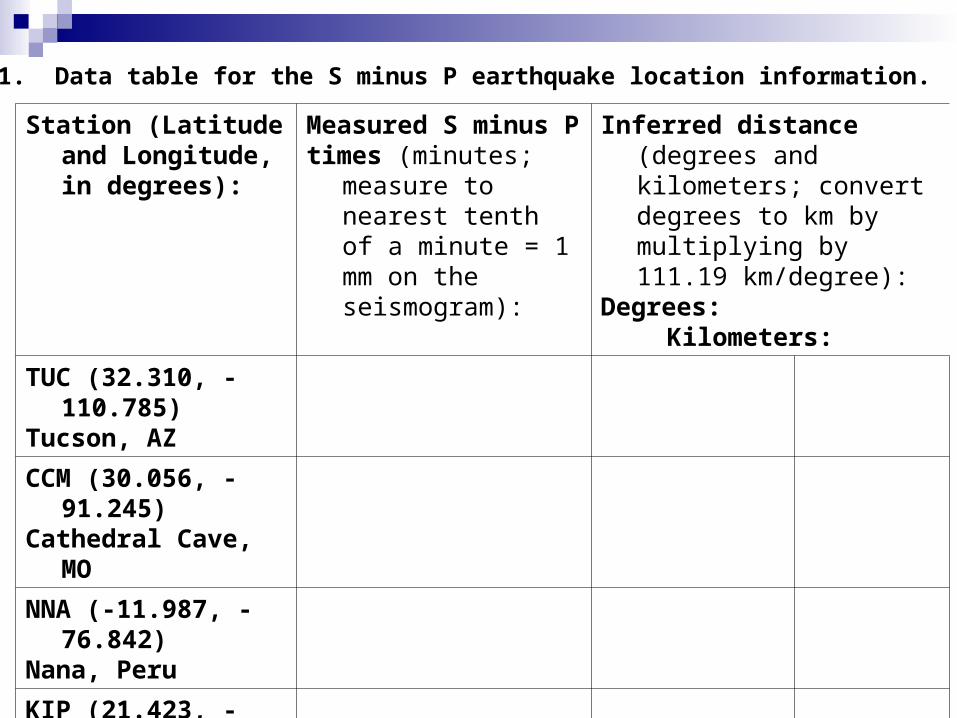
Table 1. Data table for the S minus P earthquake location information.
Station (Latitude and Longitude, in degrees):
Measured S minus Ptimes (minutes; measure to
nearest tenth of a minute = 1 mm on the seismogram):
Inferred distance (degrees and kilometers; convert degrees to km by multiplying by 111.19 km/degree):
Degrees: Kilometers:
TUC (32.310, -110.785)Tucson, AZ
CCM (30.056, -91.245)Cathedral Cave, MO
NNA (-11.987, -76.842)Nana, Peru
KIP (21.423, -158.015)Kipapa, HI
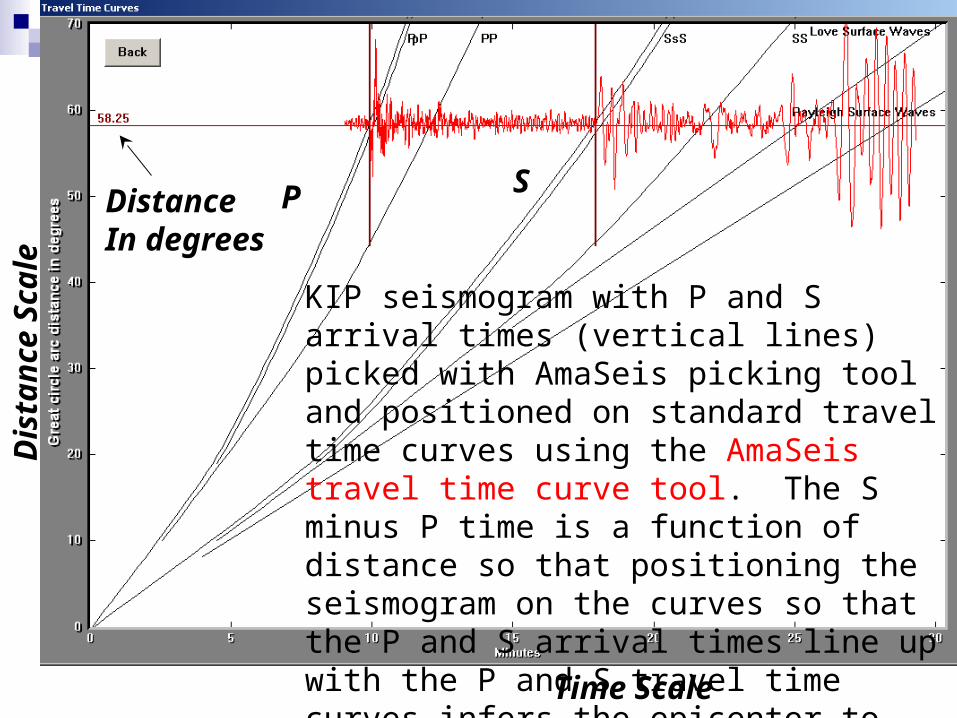
KIP seismogram with P and S arrival times (vertical lines) picked with AmaSeis picking tool and positioned on standard travel time curves using the AmaSeis travel time curve tool. The S minus P time is a function of distance so that positioning the seismogram on the curves so that the P and S arrival times line up with the P and S travel time curves infers the epicenter to station distance, in this case 58.25 degrees (6477 km).
P SDistanceIn degrees
Dis
tan
ce S
cale
Time Scale
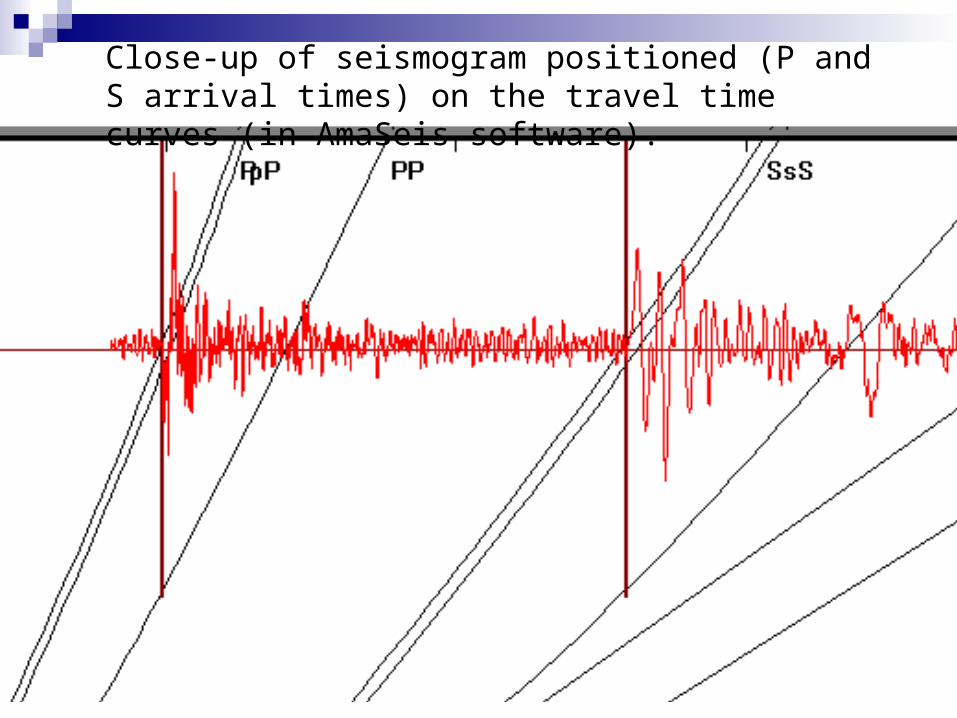
Close-up of seismogram positioned (P and S arrival times) on the travel time curves (in AmaSeis software).
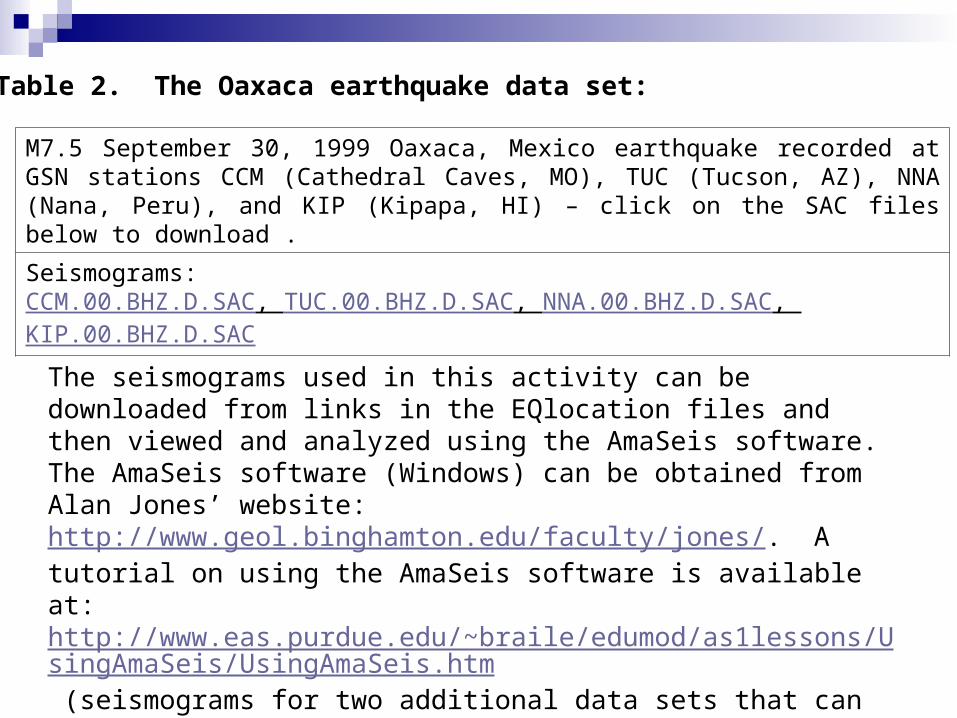
Table 2. The Oaxaca earthquake data set:
M7.5 September 30, 1999 Oaxaca, Mexico earthquake recorded at GSN stations CCM (Cathedral Caves, MO), TUC (Tucson, AZ), NNA (Nana, Peru), and KIP (Kipapa, HI) – click on the SAC files below to download .
Seismograms:CCM.00.BHZ.D.SAC, TUC.00.BHZ.D.SAC, NNA.00.BHZ.D.SAC, KIP.00.BHZ.D.SAC
The seismograms used in this activity can be downloaded from links in the EQlocation files and then viewed and analyzed using the AmaSeis software. The AmaSeis software (Windows) can be obtained from Alan Jones’ website: http://www.geol.binghamton.edu/faculty/jones/. A tutorial on using the AmaSeis software is available at: http://www.eas.purdue.edu/~braile/edumod/as1lessons/UsingAmaSeis/UsingAmaSeis.htm (seismograms for two additional data sets that can be used for S – P location [using digital seismograms and AmaSeis] and for magnitude calculation [for the AS-1 seismograms using the MagCalc online tool] can be found in Section 6 of the Using AmaSeis document).
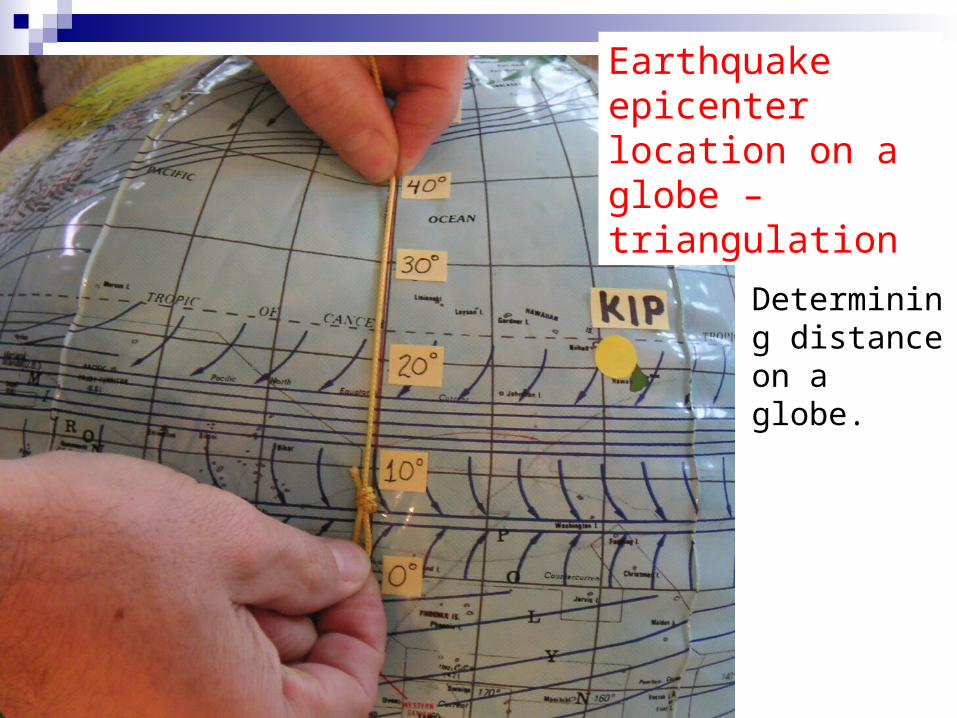
Determining distance on a globe.
Earthquake epicenter location on a globe – triangulation
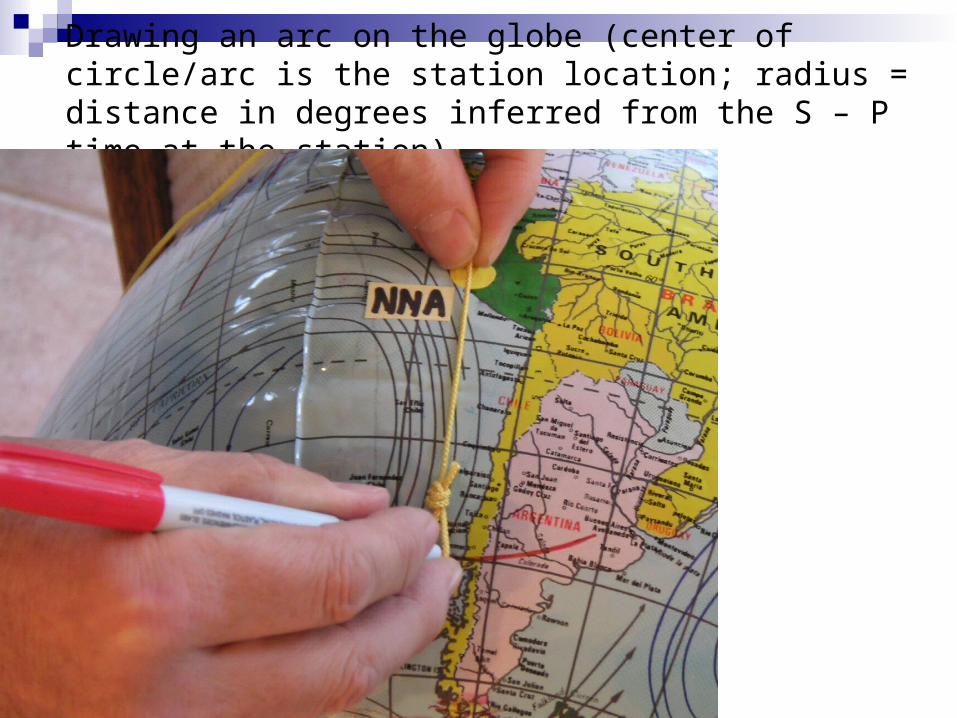
Drawing an arc on the globe (center of circle/arc is the station location; radius = distance in degrees inferred from the S – P time at the station).
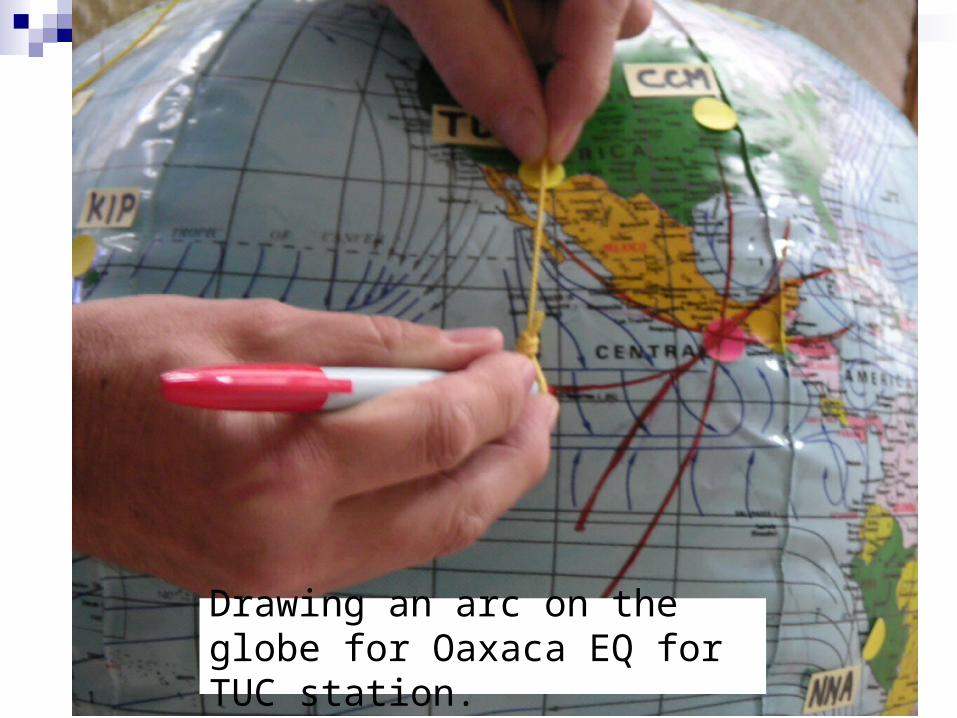
Drawing an arc on the globe for Oaxaca EQ for TUC station.
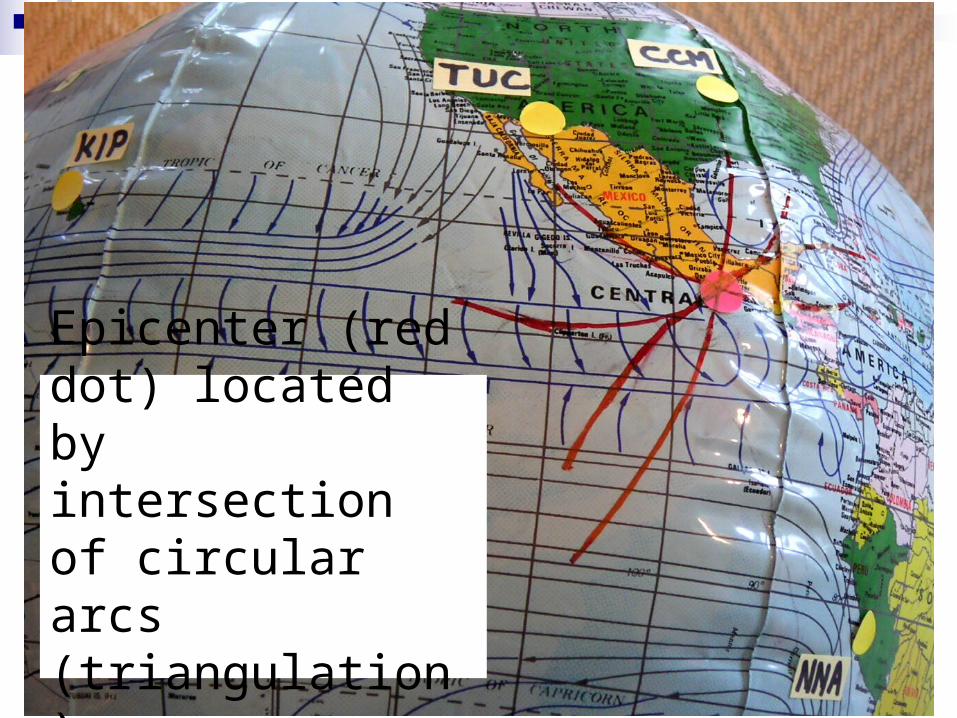
Epicenter (red dot) located by intersection of circular arcs (triangulation)
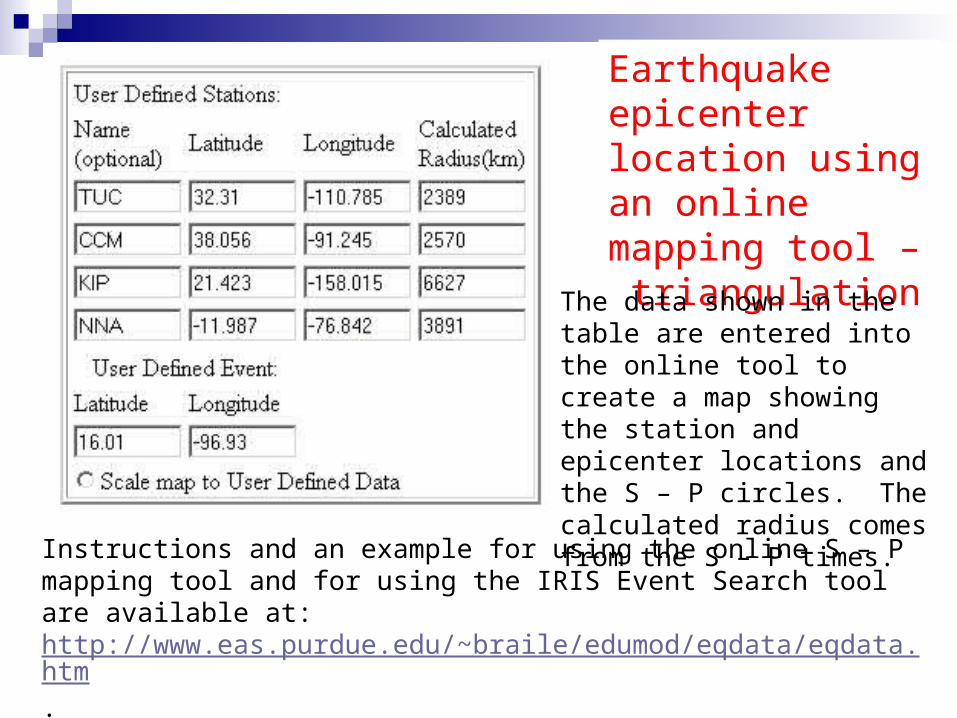
Earthquake epicenter location using an online mapping tool – triangulation
The data shown in the table are entered into the online tool to create a map showing the station and epicenter locations and the S – P circles. The calculated radius comes from the S – P times.
Instructions and an example for using the online S – P mapping tool and for using the IRIS Event Search tool are available at: http://www.eas.purdue.edu/~braile/edumod/eqdata/eqdata.htm. Online instructions on the IRIS website are also available at: http://www.iris.edu/quakes/eventSearchInstructions.htm.
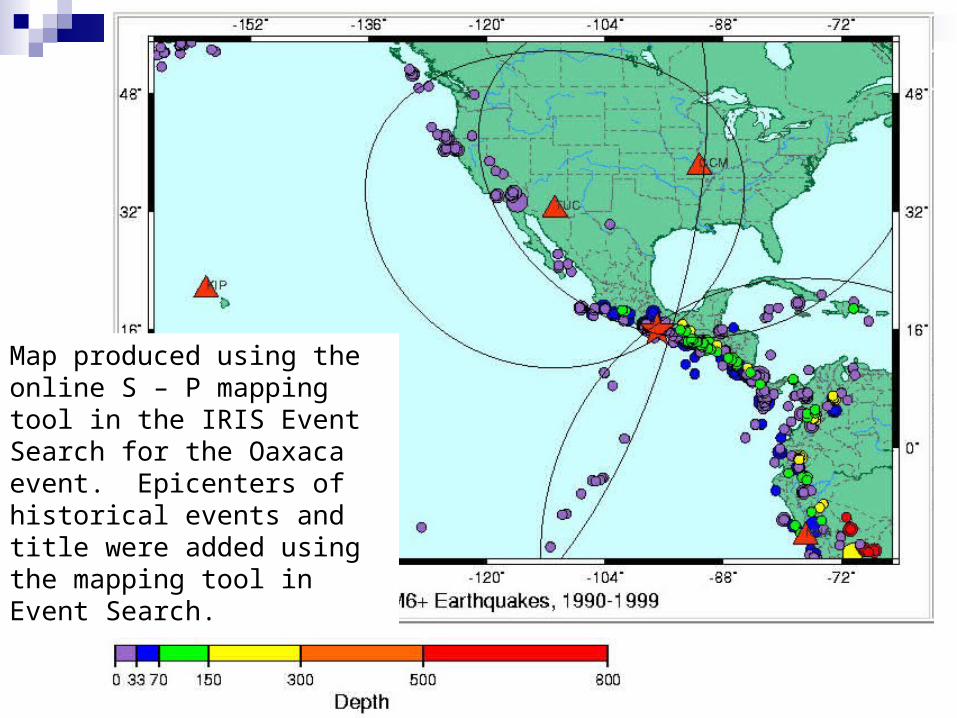
Map produced using the online S – P mapping tool in the IRIS Event Search for the Oaxaca event. Epicenters of historical events and title were added using the mapping tool in Event Search.
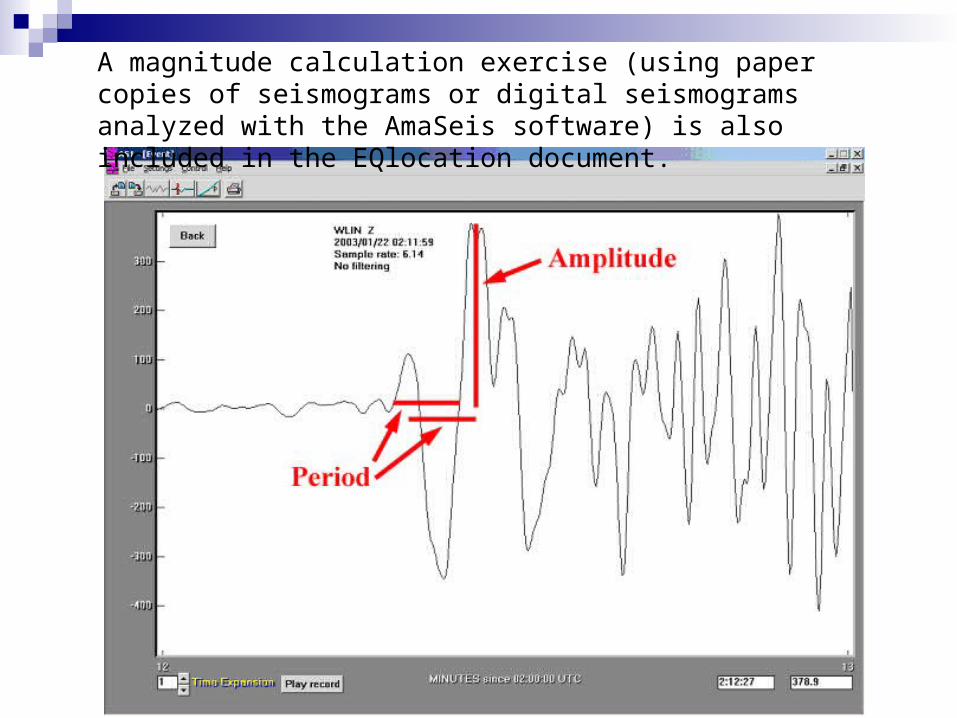
A magnitude calculation exercise (using paper copies of seismograms or digital seismograms analyzed with the AmaSeis software) is also included in the EQlocation document.
Links:
L. Braile web page (links to USGS earthquake site, SpiNet, Alan Jones’ site, USGS travel time calculator, AS-1 seismograph information, AS-1 seismograph magnitude calculator, etc.):http://www.eas.purdue.edu/~braile/ http://web.ics.purdue.edu/~braile/ (new)
AS-1 seismograph information:http://www.eas.purdue.edu/~braile/indexlinks/as1.htm
Seismograph and seismogram information (including EQlocation exercise):http://www.eas.purdue.edu/~braile/edumod/as1lessons/as1lessons.htm
An additional earthquake location tool (more advanced, yet fairly simple to use, and very similar to the methods that are actually used to locate earthquakes) is described at:http://www.eas.purdue.edu/~braile/edumod/eqlocate/tutorial.htm. The Windows software for this method (EqLocate) can be downloaded from Alan Jones’ website http://www.geol.binghamton.edu/faculty/jones/. Additional digital data that can be analyzed using AmaSeis and used for S – P earthquake location are also included (see Section 4).
Shaking Up the Classroom – Activities with Earthquake Seismograms 1
L. Braile, Purdue UniversityS. Braile, Happy Hollow School, West Lafayette, IN October, 2005
[email protected], http://web.ics.purdue.edu/~braile
Last modified November 7, 20051 The web page for this document is: http://web.ics.purdue.edu/~braile/edumod/as1lessons/EQlocation/EQlocation.htm. This PowerPoint file: http://web.ics.purdue.edu/~braile/edumod/as1lessons/EQlocation/SminusP0304.ppt. Partial funding for this development provided by the National Science Foundation. Copyright 2005. L. Braile. Permission granted for reproduction for non-commercial uses.