sgn-24006 / a.k. automatic music transcriptionsgn24006/pdf/l11-music-transcription.pdf · music...
TRANSCRIPT
Music transcription 1SGN-24006 / A.K.
Automatic music transcriptionSources:* Klapuri, Introduction to music transcription, 2006. www.cs.tut.fi/sgn/arg/klap/amt-intro.pdf* Klapuri, Eronen, Astola: Analysis of the Meter of Acoustic Musical Signals, IEEE TASLP 2006.* Klapuri, Multiple fundamental frequency estimation by summing harmonic amplitudes, ISMIR 2006.* Ryynänen, Klapuri, Automatic transcription of melody, bass line, and chords in polyphonic music,Computer Music Journal, 2008.
Contents:Introduction to music transcriptionRhythm analysisMultiple-F0 analysisAcoustic and musicological modelsVocals separation and lyricsApplication to music retrieval
Music transcription 2SGN-24006 / A.K.
1 Introduction to music transcription
Music transcription 3SGN-24006 / A.K.
3 / klapMusictranscription
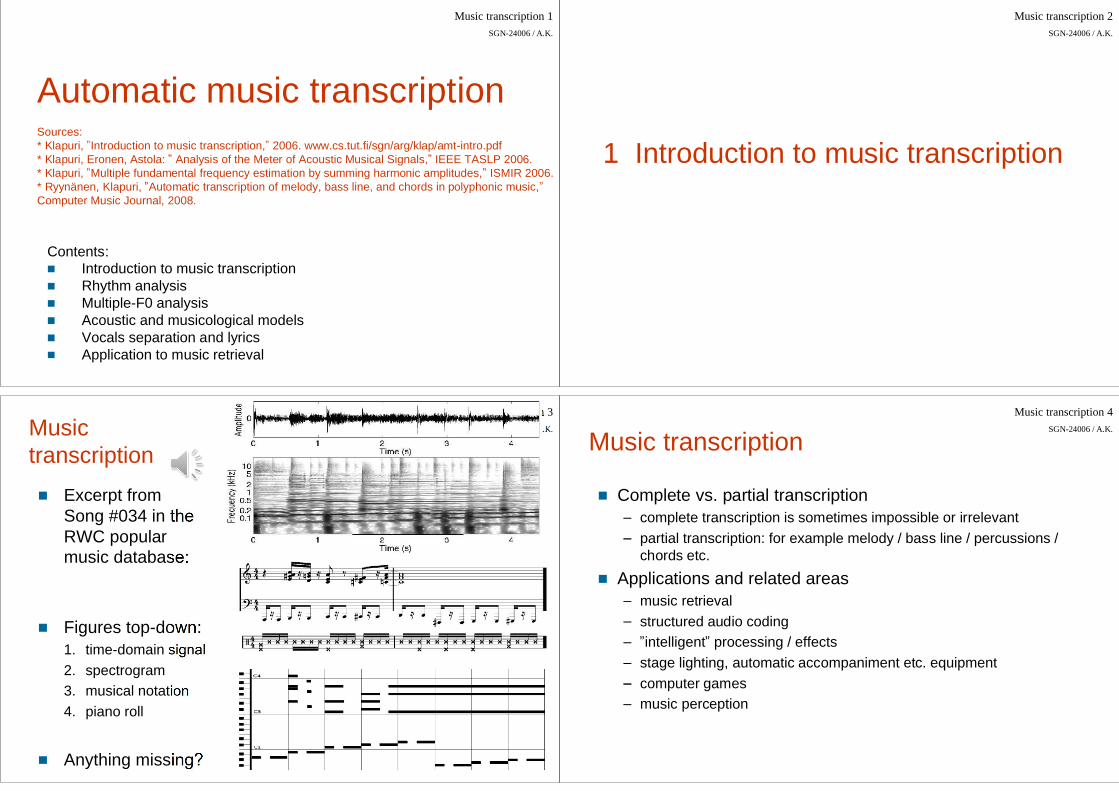
Excerpt fromSong #034 in theRWC popularmusic database:
Figures top-down:1. time-domain signal2. spectrogram3. musical notation4. piano roll
Anything missing?
Music transcription 4SGN-24006 / A.K.
Music transcription
Complete vs. partial transcriptioncomplete transcription is sometimes impossible or irrelevantpartial transcription: for example melody / bass line / percussions /chords etc.
Applications and related areasmusic retrievalstructured audio codingintelligent processing / effects
stage lighting, automatic accompaniment etc. equipmentcomputer gamesmusic perception

Music transcription 5SGN-24006 / A.K.
Perspectives on music transcription
Music transcription is a wide topicIt is useful to structure the problem by decomposing it intosmaller and more tractable subproblems
Music transcription 6SGN-24006 / A.K.Perspectives on music transcription
Acoustic and musicological modelsSpeech recognition systems depend on language models
e.g. probabilities of different word sequences (N gram models)
Musicological information is equally important fortranscription
e.g. probabilities of tone sequences or combinationsinstrument models
P( )P( )
Acousticsignal
Internal models
AnalysisResult
Music transcription 7SGN-24006 / A.K.
2 Onset detection and meter analysis
Music transcription 8SGN-24006 / A.K.
Time structure analysis
Onset detection = Detection of the beginnings of sounds in anacoustic signalMeter analysis
for example tapping foot to music (beat tracking)may include several time scalesdetect moments of musical stress in an audio signal anddiscover underlying periodicities in them
Applicationsbeat-synchronous feature extractiontemporal framework for audio editingsynchronization of audio/audio or audio/video
Music transcription 9SGN-24006 / A.K.
Meter analysis
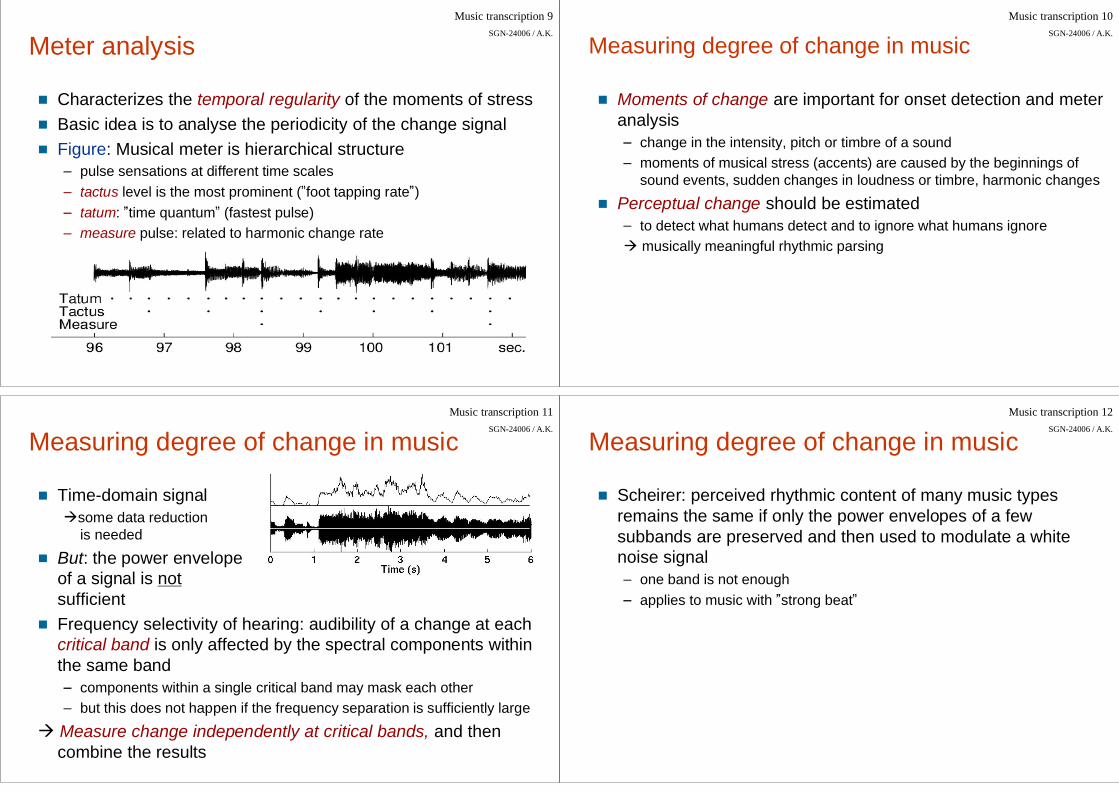
Characterizes the temporal regularity of the moments of stressBasic idea is to analyse the periodicity of the change signalFigure: Musical meter is hierarchical structure
pulse sensations at different time scalestactus level is the most prominent ( foot tapping rate )tatum: time quantum (fastest pulse)measure pulse: related to harmonic change rate
Music transcription 10SGN-24006 / A.K.
Measuring degree of change in music
Moments of change are important for onset detection and meteranalysis
change in the intensity, pitch or timbre of a soundmoments of musical stress (accents) are caused by the beginnings ofsound events, sudden changes in loudness or timbre, harmonic changes
Perceptual change should be estimatedto detect what humans detect and to ignore what humans ignoremusically meaningful rhythmic parsing
Music transcription 11SGN-24006 / A.K.
Measuring degree of change in music
Time-domain signalsome data reductionis needed
But: the power envelopeof a signal is notsufficientFrequency selectivity of hearing: audibility of a change at eachcritical band is only affected by the spectral components withinthe same band
components within a single critical band may mask each otherbut this does not happen if the frequency separation is sufficiently large
Measure change independently at critical bands, and thencombine the results
Music transcription 12SGN-24006 / A.K.
Measuring degree of change in music
Scheirer: perceived rhythmic content of many music typesremains the same if only the power envelopes of a fewsubbands are preserved and then used to modulate a whitenoise signal
one band is not enoughapplies to music with strong beat
Music transcription 13SGN-24006 / A.K.
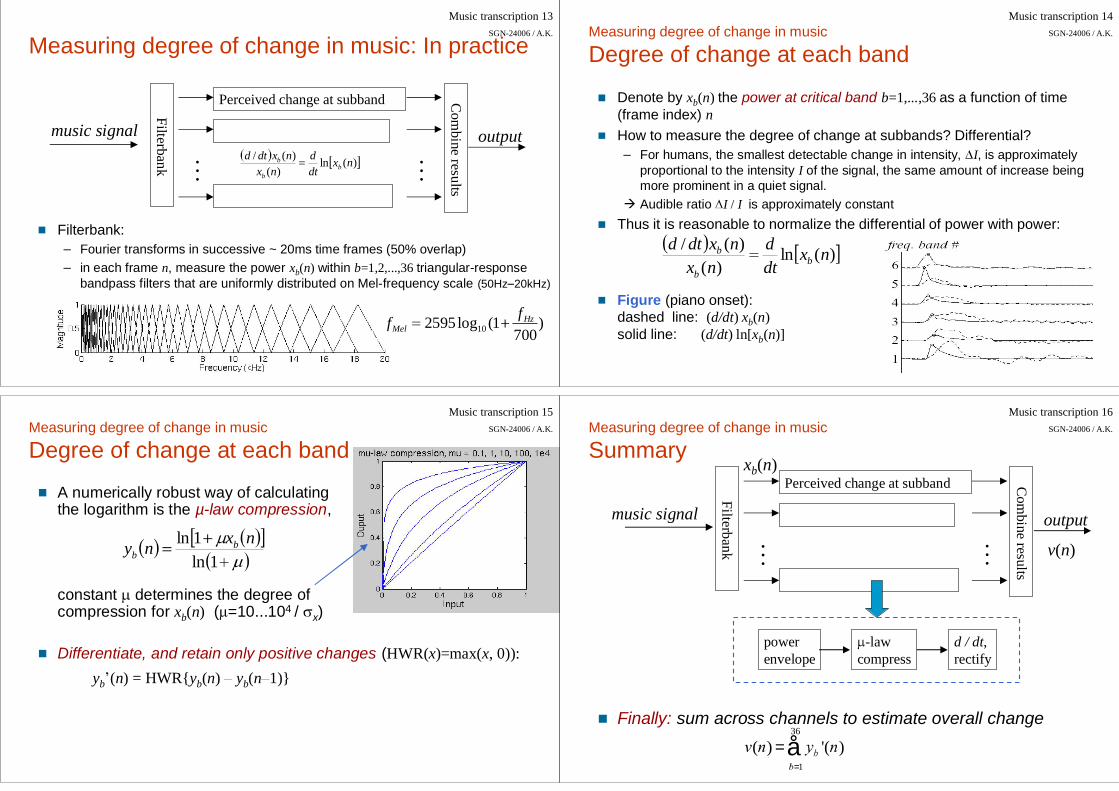
Measuring degree of change in music: In practice
Filterbank:Fourier transforms in successive ~ 20ms time frames (50% overlap)in each frame n, measure the power xb(n) within b=1,2,...,36 triangular-responsebandpass filters that are uniformly distributed on Mel-frequency scale (50Hz 20kHz)
Filterbank
Perceived change at subband Com
bineresults
music signal
...
...
output)(ln
)()(/ nx
dtd
nxnxdtd
bb
b
)700
1(log2595 10Hz
Melff
Music transcription 14SGN-24006 / A.K.Measuring degree of change in music
Degree of change at each band
Denote by xb(n) the power at critical band b=1,...,36 as a function of time(frame index) nHow to measure the degree of change at subbands? Differential?
For humans, the smallest detectable change in intensity, I, is approximatelyproportional to the intensity I of the signal, the same amount of increase beingmore prominent in a quiet signal.Audible ratio I / I is approximately constant
Thus it is reasonable to normalize the differential of power with power:
Figure (piano onset):dashed line: (d/dt) xb(n)solid line: (d/dt) ln[xb(n)]
)(ln)(
)(/ nxdtd
nxnxdtd
bb
b
Music transcription 15SGN-24006 / A.K.Measuring degree of change in music
Degree of change at each band
A numerically robust way of calculatingthe logarithm is the µ-law compression,
constant determines the degree ofcompression for xb(n) ( =10...104 / x)
Differentiate, and retain only positive changes (HWR(x)=max(x, 0)):yb (n) = HWR{yb(n) yb(n 1)}
1ln1ln nxny b
b
Music transcription 16SGN-24006 / A.K.Measuring degree of change in music
Summary
Finally: sum across channels to estimate overall change
Filterbank
Perceived change at subband Com
bineresults
music signal
...
...
output
( ) = '( )=1
36
å
powerenvelope
-lawcompress
d / dt,rectify
xb(n)
v(n)
Music transcription 17SGN-24006 / A.K.
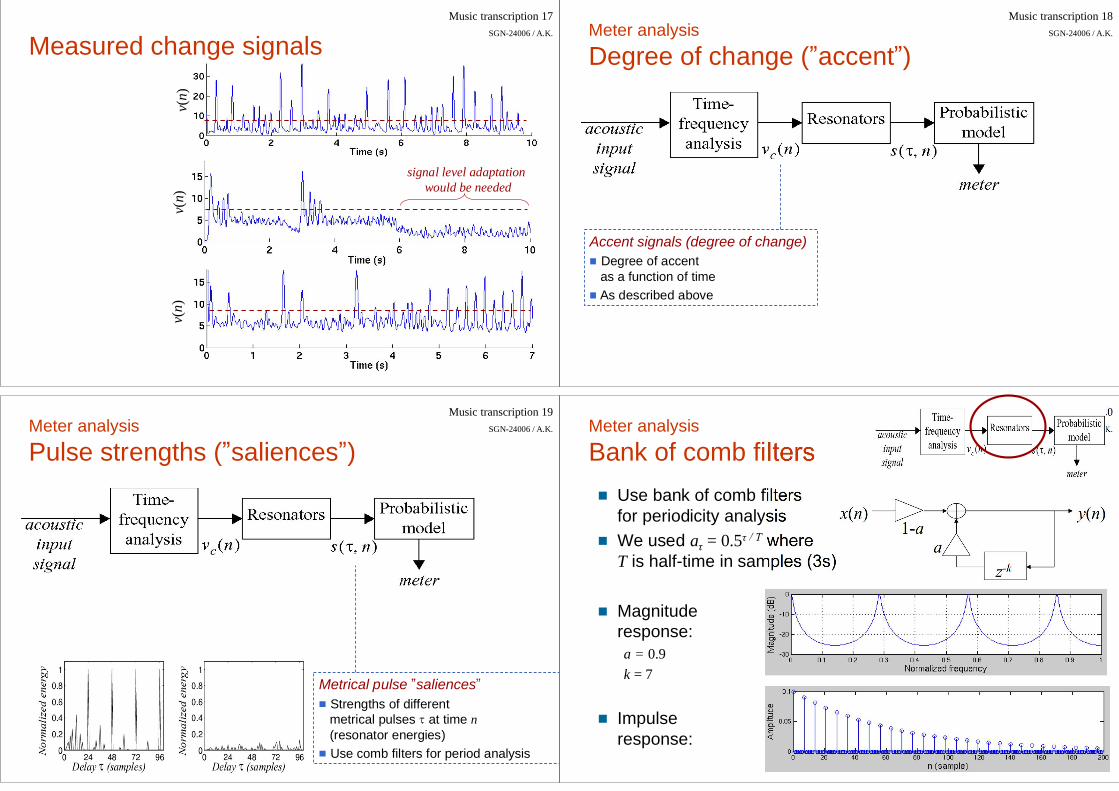
Measured change signals
v(n)
v(n)
v(n)
signal level adaptationwould be needed
Music transcription 18SGN-24006 / A.K.Meter analysis
Degree of change ( accent )
Accent signals (degree of change)Degree of accentas a function of timeAs described above
Music transcription 19SGN-24006 / A.K.Meter analysis
Pulse strengths ( saliences )
Metrical pulse saliencesStrengths of differentmetrical pulses at time n(resonator energies)Use comb filters for period analysis
Music transcription 20SGN-24006 / A.K.Meter analysis
Bank of comb filtersUse bank of comb filtersfor periodicity analysisWe used a = 0.5 whereT is half-time in samples (3s)
Magnituderesponse:a = 0.9k = 7
Impulseresponse:
x(n) y(n)
z-k
a1-a
Music transcription 21SGN-24006 / A.K.Meter analysis
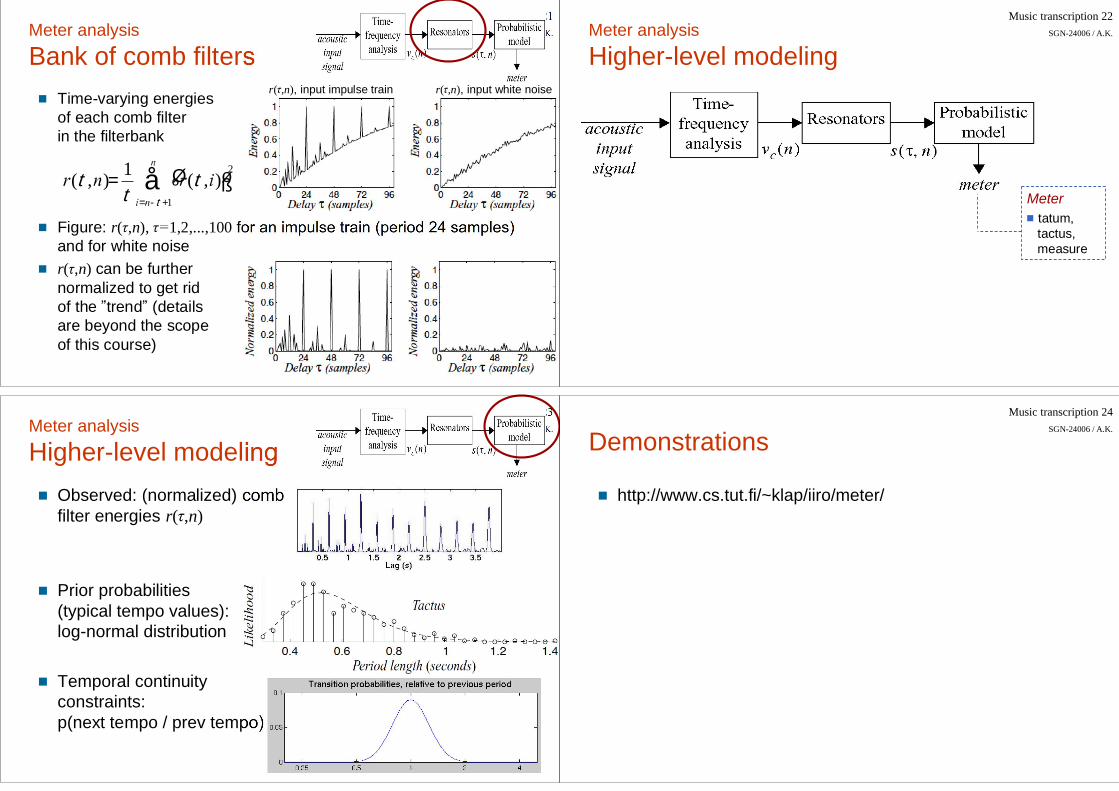
Bank of comb filtersTime-varying energiesof each comb filterin the filterbank
Figure: r( ,n), 1,2,...,100 for an impulse train (period 24 samples)and for white noiser( ,n) can be furthernormalized to get ridof the trend (detailsare beyond the scopeof this course)
(t , )= 1t
(t , )éë ùû2
= -t +1å
r( ,n), input impulse train r( ,n), input white noise
Music transcription 22SGN-24006 / A.K.Meter analysis
Higher-level modeling
Metertatum,tactus,measure
Music transcription 23SGN-24006 / A.K.Meter analysis
Higher-level modelingObserved: (normalized) combfilter energies r( ,n)
Prior probabilities(typical tempo values):log-normal distribution
Temporal continuityconstraints:p(next tempo / prev tempo)
Music transcription 24SGN-24006 / A.K.
Demonstrations
http://www.cs.tut.fi/~klap/iiro/meter/

Music transcription 25SGN-24006 / A.K.
3 Polyphonic pitch analysis
Music transcription 26SGN-24006 / A.K.
Introduction
Pitch information is an essential part of almost all WesternmusicExtracting pitch information from recorded audio is hard
spectrogram can be calculated straightforwardlypiano-roll... more tricky
Multiple F0 estimation= F0 estimation in polyphonic signals
music variety of sources, wide pitch range, presence of drums
A number of completely different approaches have beenproposed in the literature
Music transcription 27SGN-24006 / A.K.
Musical sounds
Most Western instruments produce harmonic soundsFigure: trumpet sound (260Hz) in time and frequency domainsperiod in time-domain: 1/F0 period in frequency-domain: F0
Frequency (Hz)
1/ F0
F0
Music transcription 28SGN-24006 / A.K.
How about just autocorrelation function (ACF)?
Autocorrelation function (ACF) based algorithms are among the mostfrequently used single-pitch estimators
Usually the maximum value in ACF is taken as 1/F0 periodShort-time ACF r( ) for a discrete time domain signal x(n):
1
0)()(1)(
nN
nnxnx
Nr
ACF:
Signal x(n):(vowel [ae])

Music transcription 29SGN-24006 / A.K.
Autocorrelation function
Short-time ACF within a time frame of length N :
Short-time ACF for real-valued signals can be computed via FFT as
where IDFT is inverse Fouriertransform and X(k) is DFT ofx(n) (padding zeros so thatFFT length is twice the length of x)The latter identity is true only forreal-valued (audio) signals
1
0( ) ( ) ( )
N
nr x n x n
/ 2 12 2
0
2 2( ) IDFT cosK
k
kr X k X kK K
Music transcription 30SGN-24006 / A.K.
Autocorrelation function
From the frequency-domain interpretation, we see at least threeproperties of ACF that make it non-robust for the period analysisof polyphonic audio
the entire spectrum is used (weighting with values btw -1 and 1)all integer multiples of fs/ are given the same (unity) weightsquaring the spectrum emphasizes timbral properties (formants etc.)
In the following, we propose a method which makes three basicmodifications to ACF to enhance its robustness
1. sharper peaks (cf. comb filter); 2. weight harmonics ( 1
g( ,m)
Music transcription 31SGN-24006 / A.K.
More reliable method*
Starting point is conceptually very simple1. Input signal is first spectrally flattened ( whitened ) to suppress timbral
information2. The salience (strength) of a F0 candidate is calculated as a weighted sum
of the amplitudes of its harmonic partials
where f ,m = mfs / is the frequency of the m:th harmonic partial of a F0candidate fs /fs is the sampling rate, and function g( ,m) defines the weight of partial m ofperiod in the sumY(f) is the short-time Fourier transform of the whitened time-domain signal
* Klapuri, A., Multiple fundamental frequency estimation by summing harmonic amplitudes,"7th International Conference on Music Information Retrieval, Victoria, Canada, Oct. 2006.
t( ) = t ,( )=1
å t ,( )
Music transcription 32SGN-24006 / A.K.Proposed method
Summing harmonic amplitudes
The basic idea of harmonic summation is intuitively appealing:pitch perception is closely related to time-domain periodicity of soundsFourier theorem states that a periodic signal can be represented with spectralcomponents at integer multiples of the inverse of the period
Question of an optimal mapping of the Fourier spectrum to pitch spectrum(or, a piano roll) is closely related to these methods
here, function g( ,m) is learned by brute-force optimization ( 300Hz):
,1
,M
mm
s g m Y fmmf
ffggmgs
sm
1//, ,21
Music transcription 33SGN-24006 / A.K.Proposed method
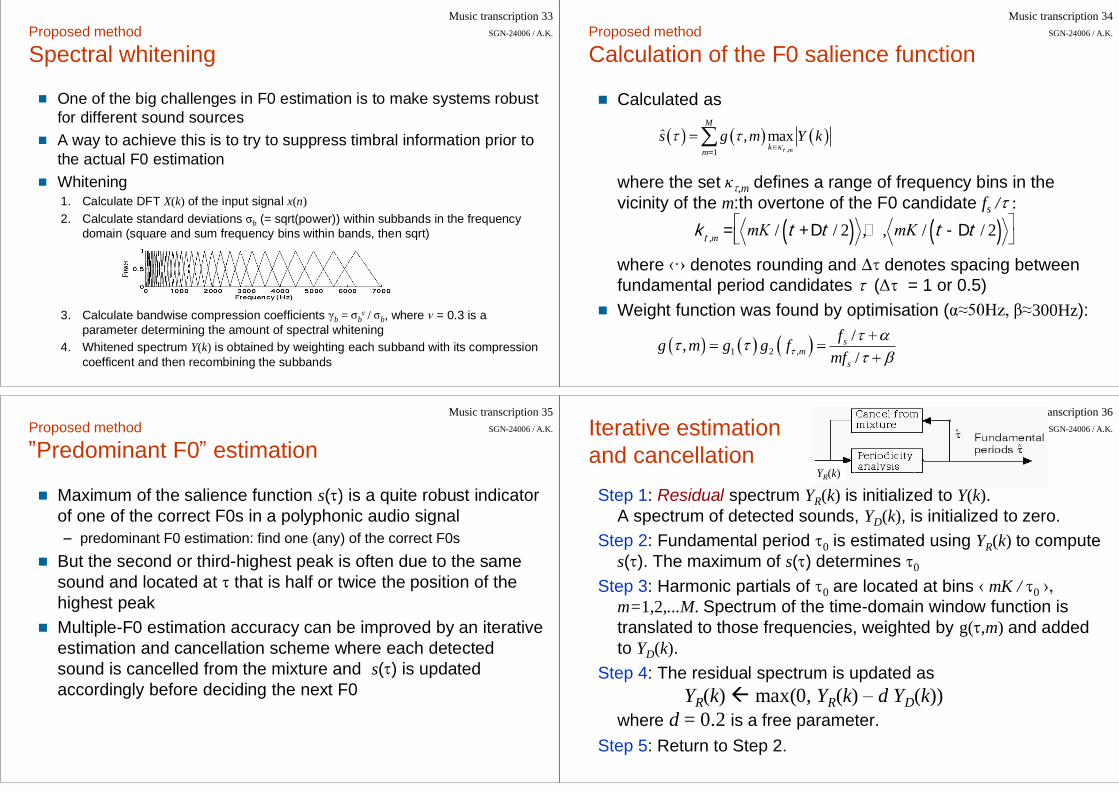
Spectral whitening
One of the big challenges in F0 estimation is to make systems robustfor different sound sourcesA way to achieve this is to try to suppress timbral information prior tothe actual F0 estimationWhitening1. Calculate DFT X(k) of the input signal x(n)2. Calculate standard deviations b (= sqrt(power)) within subbands in the frequency
domain (square and sum frequency bins within bands, then sqrt)
3. Calculate bandwise compression coefficients b = b / b, where = 0.3 is aparameter determining the amount of spectral whitening
4. Whitened spectrum Y(k) is obtained by weighting each subband with its compressioncoefficent and then recombining the subbands
Music transcription 34SGN-24006 / A.K.Proposed method
Calculation of the F0 salience function
Calculated as
where the set ,m defines a range of frequency bins in thevicinity of the m:th overtone of the F0 candidate fs / :
where denotes rounding and denotes spacing betweenfundamental period candidates ( = 1 or 0.5)Weight function was found by optimisation ( 300Hz):
,1
, maxm
M
kms g m Y k
kt , = / t + Dt / 2( ) , , / t - Dt / 2( )
1 2 ,/,/
sm
s
fg m g g fmf
Music transcription 35SGN-24006 / A.K.Proposed method
Predominant F0 estimation
Maximum of the salience function s( ) is a quite robust indicatorof one of the correct F0s in a polyphonic audio signal
predominant F0 estimation: find one (any) of the correct F0s
But the second or third-highest peak is often due to the samesound and located at that is half or twice the position of thehighest peakMultiple-F0 estimation accuracy can be improved by an iterativeestimation and cancellation scheme where each detectedsound is cancelled from the mixture and s( ) is updatedaccordingly before deciding the next F0
Music transcription 36SGN-24006 / A.K.Iterative estimation
and cancellationStep 1: Residual spectrum YR(k) is initialized to Y(k).
A spectrum of detected sounds, YD(k), is initialized to zero.Step 2: Fundamental period 0 is estimated using YR(k) to compute
s( ). The maximum of s( ) determines 0
Step 3: Harmonic partials of 0 are located at bins mK / 0m=1,2,...M. Spectrum of the time-domain window function istranslated to those frequencies, weighted by g( ,m) and addedto YD(k).
Step 4: The residual spectrum is updated asYR(k) max(0, YR(k) d YD(k))
where d = 0.2 is a free parameter.Step 5: Return to Step 2.
YR(k)
Music transcription 37SGN-24006 / A.K.
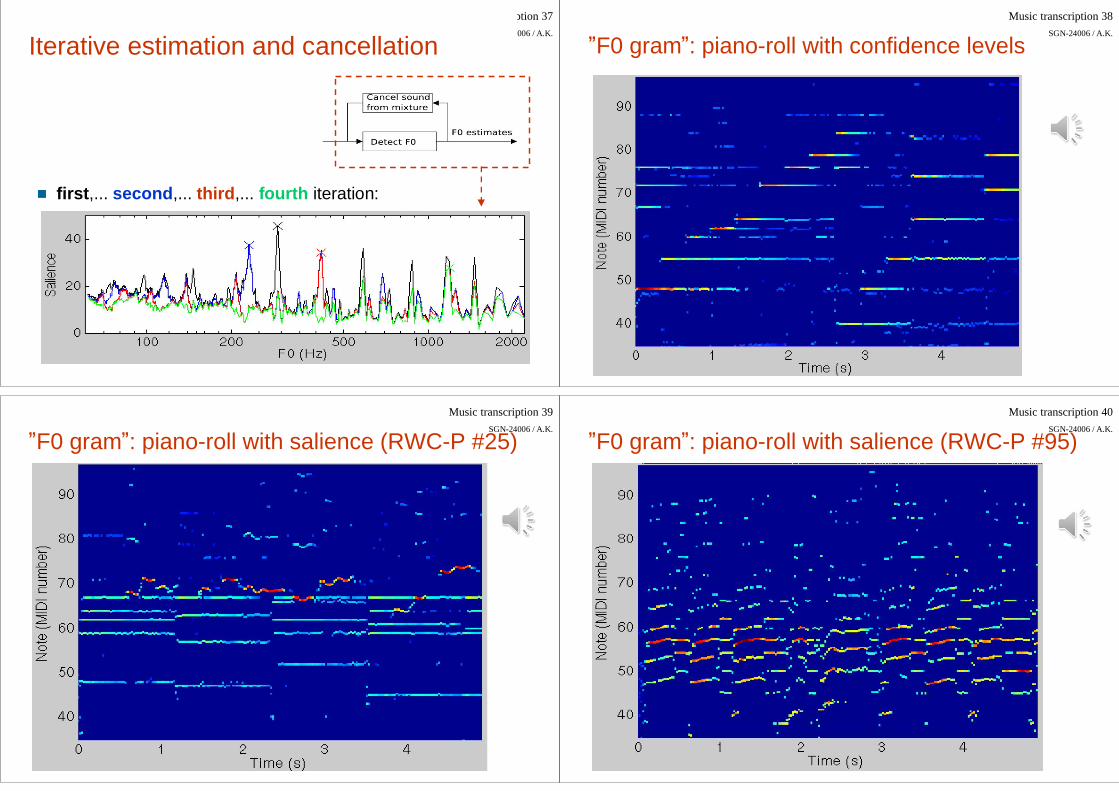
first,... second,... third,... fourth iteration:
Iterative estimation and cancellationMusic transcription 38
SGN-24006 / A.K.
F0 gram : piano-roll with confidence levels
Music transcription 39SGN-24006 / A.K.
F0 gram : piano-roll with salience (RWC-P #25)Music transcription 40
SGN-24006 / A.K.
F0 gram : piano-roll with salience (RWC-P #95)

Music transcription 41SGN-24006 / A.K.
Remarks
The principle of summing harmonic amplitude is very simple,yet it suffices for predominant-F0 estimation in polyphonicsignals, provided that the weight g( ,m) are appropriateIterative detection and cancellation helps to remove harmonicsand subharmonics of already detected sounds and to revealremaining sounds behind the most prominent onesReasonably accurate for a wide range of instruments and F0s
Music transcription 42SGN-24006 / A.K.
4 Acoustic and musicological modeling
Music transcription 43SGN-24006 / A.K.
Why acoustic modeling of notes?
Frame-wise F0 strengthsmust be processed to getdiscrete notes (MIDI, score)
pitch quantization, onsets, offsetsclean up frame-wise errors
Examples in the followingRyynänen, M. and Klapuri, A., Automatic transcription of melody, bass line,and chords in polyphonic music, Computer Music Journal, 32(3), Fall 2008.Ryynänen, Klapuri, WASPAA 2005.
Music transcription 44SGN-24006 / A.K.
Acoustic modeling of notes
1. Extract frame-wiseF0 salience (strength)and its differential(here not doingpeak-picking oriterative cancellation)
2. Use training data (RWC Popular Music database) to learn acoustic modelsfor note events (100 pieces with audio + time-aligned MIDI)

Music transcription 45SGN-24006 / A.K.
Music transcription system
Figure:Acoustic modelMusicologicalmodel:
musical keyestimationN-gram modelsfor note sequences
Music transcription 46SGN-24006 / A.K.
Music transcription system
Combination of an acoustic model and a musicological model (HMMs)
Music transcription 47SGN-24006 / A.K.
Transcription examples
Complete polyphonictranscriptionhttp://www.cs.tut.fi/sgn/arg/matti/demos/polytrans.html
Transcription of melody, bass, and chords:http://www.cs.tut.fi/sgn/arg/matti/demos/mbctrans/
Music transcription 48SGN-24006 / A.K.
Case study: Singing transcription
Ryynänen, Klapuri, Modeling of note events for singing transcription, SAPAWorkshop, 2004.
Estimated pitch track has to be post-processed to get notes
Featureextraction
Probabilisticmodels
pitch
voicing,accent, meter
acousticsignal
discretenote sequence

Music transcription 49SGN-24006 / A.K.
Case study: Singing transcription
Brother can you spare me a dime
Pieni tytön tylleröinen