set sail with asset allocation - privatebank.citibank.com · 2 set sail with asset allocation build...
TRANSCRIPT
INVESTMENT PRODUCTS: NOT FDIC INSURED • NOT CDIC INSURED • NOT GOVERNMENT INSURED • NO BANK GUARANTEE • MAY LOSE VALUE
February 2018
Set Sail with Asset Allocation
Both of these statements are common investor sentiments. But they may be driven more by emotion and gut feelings rather than a disciplined investment strategy. A large cash position may indicate fear and excessive loss aversion, while concentrated holdings could signal overconfidence, following the herd mentality, or even greed.1
Although fear-driven or herd behaviors contributed to the survival of our species a million years ago, those emotions are not helpful when constructing a long-term investment strategy designed to help you survive threats, such as bubbles, volatility, and other extreme market events, to your investment goals.2
“I’m nervous about markets so I’m keeping a large portion of my investments in cash.”
“Why would I sell my winners? I’m making lots of money in these concentrated positions.”
1 For a more in-depth discussion of the cognitive biases in investors’ decision-making process, please see: Kahneman, Daniel. Thinking, Fast and Slow. New York: Farrar, Straus and Giroux, 2011.2 Lo, Andrew W. Adaptive Markets: Financial Evolution at the Speed of Thought. Princeton, NJ: Princeton University Press, 2017.
The author, Gregory van Inwegen, is a Managing Director and the Global Head of Quantitative Research, Asset Allocation, and Investment Risk Management at Citi Investment Management (CIM), where he is responsible for three CIM teams: Quantitative Research, Global Asset Allocation, and Investment Risk Management. Greg also serves as Vice Chairman of the Private Bank’s Global Investment Committee. Greg received an MS and a PhD with a concentration in Finance from The Wharton School, University of Pennsylvania, an SM in Management from the Sloan School of Management, Massachusetts Institute of Technology, and a BS from the Haas School, University of California at Berkeley.
2 Set Sail with Asset Allocation
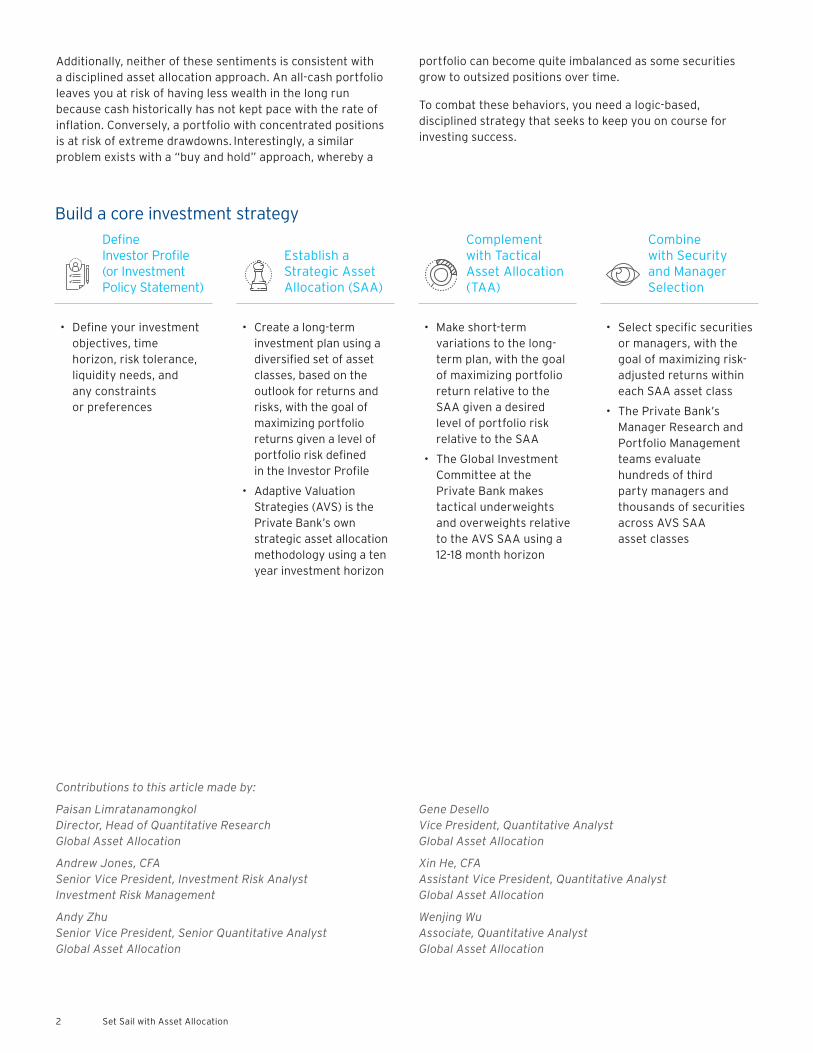
Build a core investment strategy
Additionally, neither of these sentiments is consistent with a disciplined asset allocation approach. An all-cash portfolio leaves you at risk of having less wealth in the long run because cash historically has not kept pace with the rate of inflation. Conversely, a portfolio with concentrated positions is at risk of extreme drawdowns. Interestingly, a similar problem exists with a “buy and hold” approach, whereby a
portfolio can become quite imbalanced as some securities grow to outsized positions over time.
To combat these behaviors, you need a logic-based, disciplined strategy that seeks to keep you on course for investing success.
Define Investor Profile (or Investment Policy Statement)
Establish a Strategic Asset Allocation (SAA)
Complement with Tactical Asset Allocation (TAA)
Combine with Security and Manager Selection
• Define your investment objectives, time horizon, risk tolerance, liquidity needs, and any constraints or preferences
• Create a long-term investment plan using a diversified set of asset classes, based on the outlook for returns and risks, with the goal of maximizing portfolio returns given a level of portfolio risk defined in the Investor Profile
• Adaptive Valuation Strategies (AVS) is the Private Bank’s own strategic asset allocation methodology using a ten year investment horizon
• Make short-term variations to the long-term plan, with the goal of maximizing portfolio return relative to the SAA given a desired level of portfolio risk relative to the SAA
• The Global Investment Committee at the Private Bank makes tactical underweights and overweights relative to the AVS SAA using a 12-18 month horizon
• Select specific securities or managers, with the goal of maximizing risk-adjusted returns within each SAA asset class
• The Private Bank’s Manager Research and Portfolio Management teams evaluate hundreds of third party managers and thousands of securities across AVS SAA asset classes
Contributions to this article made by:
Paisan Limratanamongkol Director, Head of Quantitative Research Global Asset Allocation
Andrew Jones, CFA Senior Vice President, Investment Risk Analyst Investment Risk Management
Andy Zhu Senior Vice President, Senior Quantitative Analyst Global Asset Allocation
Gene Desello Vice President, Quantitative Analyst Global Asset Allocation
Xin He, CFA Assistant Vice President, Quantitative Analyst Global Asset Allocation
Wenjing Wu Associate, Quantitative Analyst Global Asset Allocation
3Set Sail with Asset Allocation
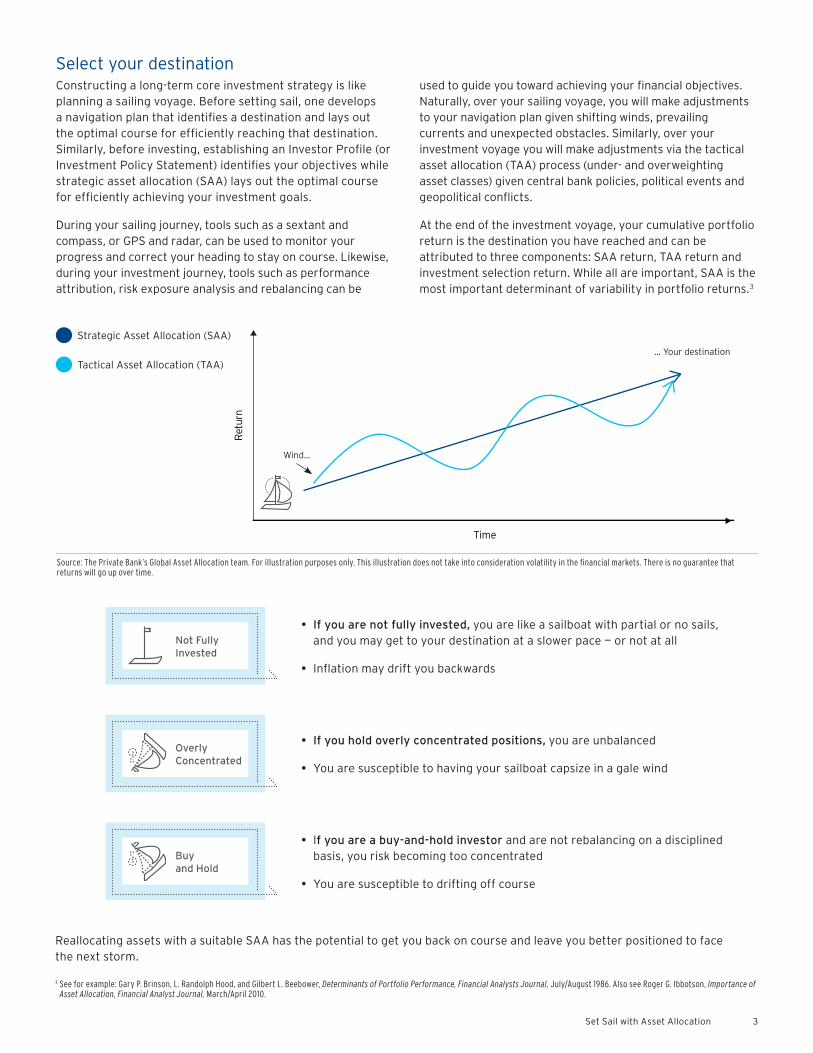
Select your destinationConstructing a long-term core investment strategy is like planning a sailing voyage. Before setting sail, one develops a navigation plan that identifies a destination and lays out the optimal course for efficiently reaching that destination. Similarly, before investing, establishing an Investor Profile (or Investment Policy Statement) identifies your objectives while strategic asset allocation (SAA) lays out the optimal course for efficiently achieving your investment goals.
During your sailing journey, tools such as a sextant and compass, or GPS and radar, can be used to monitor your progress and correct your heading to stay on course. Likewise, during your investment journey, tools such as performance attribution, risk exposure analysis and rebalancing can be
used to guide you toward achieving your financial objectives. Naturally, over your sailing voyage, you will make adjustments to your navigation plan given shifting winds, prevailing currents and unexpected obstacles. Similarly, over your investment voyage you will make adjustments via the tactical asset allocation (TAA) process (under- and overweighting asset classes) given central bank policies, political events and geopolitical conflicts.
At the end of the investment voyage, your cumulative portfolio return is the destination you have reached and can be attributed to three components: SAA return, TAA return and investment selection return. While all are important, SAA is the most important determinant of variability in portfolio returns.3
Source: The Private Bank’s Global Asset Allocation team. For illustration purposes only. This illustration does not take into consideration volatility in the financial markets. There is no guarantee that returns will go up over time.
Reallocating assets with a suitable SAA has the potential to get you back on course and leave you better positioned to face the next storm.
Not Fully Invested
• If you are not fully invested, you are like a sailboat with partial or no sails, and you may get to your destination at a slower pace — or not at all
• Inflation may drift you backwards
Overly Concentrated
• If you hold overly concentrated positions, you are unbalanced
• You are susceptible to having your sailboat capsize in a gale wind
Buy and Hold
• If you are a buy-and-hold investor and are not rebalancing on a disciplined basis, you risk becoming too concentrated
• You are susceptible to drifting off course
Define Investor Profile (or Investment Policy Statement)
Establish a Strategic Asset Allocation (SAA)
Complement with Tactical Asset Allocation (TAA)
Combine with Security and Manager Selection
• Define your investment objectives, time horizon, risk tolerance, liquidity needs, and any constraints or preferences
• Create a long-term investment plan using a diversified set of asset classes, based on the outlook for returns and risks, with the goal of maximizing portfolio returns given a level of portfolio risk defined in the Investor Profile
• Adaptive Valuation Strategies (AVS) is the Private Bank’s own strategic asset allocation methodology using a ten year investment horizon
• Make short-term variations to the long-term plan, with the goal of maximizing portfolio return relative to the SAA given a desired level of portfolio risk relative to the SAA
• The Global Investment Committee at the Private Bank makes tactical underweights and overweights relative to the AVS SAA using a 12-18 month horizon
• Select specific securities or managers, with the goal of maximizing risk-adjusted returns within each SAA asset class
• The Private Bank’s Manager Research and Portfolio Management teams evaluate hundreds of third party managers and thousands of securities across AVS SAA asset classes Time
Ret
urn
... Your destination
Wind...
Strategic Asset Allocation (SAA)
Tactical Asset Allocation (TAA)
3 See for example: Gary P. Brinson, L. Randolph Hood, and Gilbert L. Beebower, Determinants of Portfolio Performance, Financial Analysts Journal, July/August 1986. Also see Roger G. Ibbotson, Importance of Asset Allocation, Financial Analyst Journal, March/April 2010.
4 Set Sail with Asset Allocation
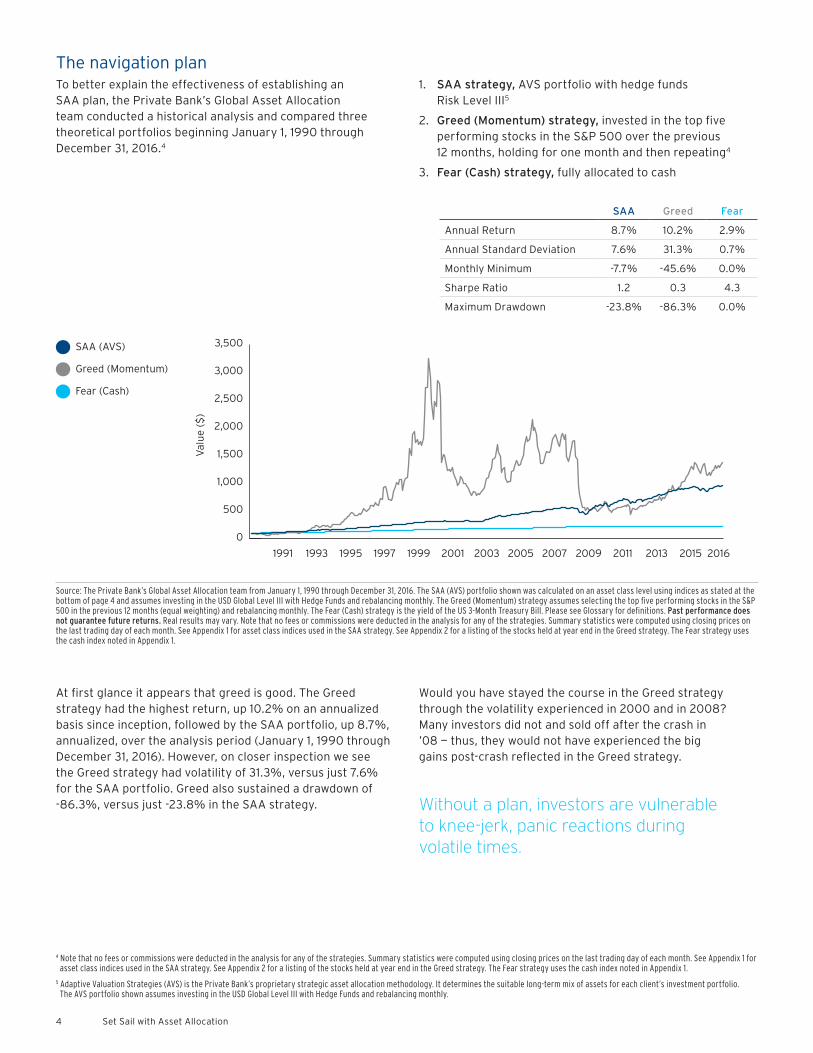
The navigation planTo better explain the effectiveness of establishing an SAA plan, the Private Bank’s Global Asset Allocation team conducted a historical analysis and compared three theoretical portfolios beginning January 1, 1990 through December 31, 2016.4
1. SAA strategy, AVS portfolio with hedge funds Risk Level III5
2. Greed (Momentum) strategy, invested in the top five performing stocks in the S&P 500 over the previous 12 months, holding for one month and then repeating4
3. Fear (Cash) strategy, fully allocated to cash
At first glance it appears that greed is good. The Greed strategy had the highest return, up 10.2% on an annualized basis since inception, followed by the SAA portfolio, up 8.7%, annualized, over the analysis period (January 1, 1990 through December 31, 2016). However, on closer inspection we see the Greed strategy had volatility of 31.3%, versus just 7.6% for the SAA portfolio. Greed also sustained a drawdown of -86.3%, versus just -23.8% in the SAA strategy.
Would you have stayed the course in the Greed strategy through the volatility experienced in 2000 and in 2008? Many investors did not and sold off after the crash in ’08 — thus, they would not have experienced the big gains post-crash reflected in the Greed strategy.
4 Note that no fees or commissions were deducted in the analysis for any of the strategies. Summary statistics were computed using closing prices on the last trading day of each month. See Appendix 1 for asset class indices used in the SAA strategy. See Appendix 2 for a listing of the stocks held at year end in the Greed strategy. The Fear strategy uses the cash index noted in Appendix 1.
5 Adaptive Valuation Strategies (AVS) is the Private Bank’s proprietary strategic asset allocation methodology. It determines the suitable long-term mix of assets for each client’s investment portfolio. The AVS portfolio shown assumes investing in the USD Global Level III with Hedge Funds and rebalancing monthly.
1991 1993 1995 1997 1999 2001 2003 2005 2007 2009 2011 2013 2015 2016
0
500
1,000
1,500
2,000
2,500
3,000
3,500
Valu
e ($
)
Source: The Private Bank’s Global Asset Allocation team from January 1, 1990 through December 31, 2016. The SAA (AVS) portfolio shown was calculated on an asset class level using indices as stated at the bottom of page 4 and assumes investing in the USD Global Level III with Hedge Funds and rebalancing monthly. The Greed (Momentum) strategy assumes selecting the top five performing stocks in the S&P 500 in the previous 12 months (equal weighting) and rebalancing monthly. The Fear (Cash) strategy is the yield of the US 3-Month Treasury Bill. Please see Glossary for definitions. Past performance does not guarantee future returns. Real results may vary. Note that no fees or commissions were deducted in the analysis for any of the strategies. Summary statistics were computed using closing prices on the last trading day of each month. See Appendix 1 for asset class indices used in the SAA strategy. See Appendix 2 for a listing of the stocks held at year end in the Greed strategy. The Fear strategy uses the cash index noted in Appendix 1.
SAA Greed Fear
Annual Return 8.7% 10.2% 2.9%
Annual Standard Deviation 7.6% 31.3% 0.7%
Monthly Minimum -7.7% -45.6% 0.0%
Sharpe Ratio 1.2 0.3 4.3
Maximum Drawdown -23.8% -86.3% 0.0%
Without a plan, investors are vulnerable to knee-jerk, panic reactions during volatile times.
SAA (AVS)
Greed (Momentum)
Fear (Cash)
5Set Sail with Asset Allocation
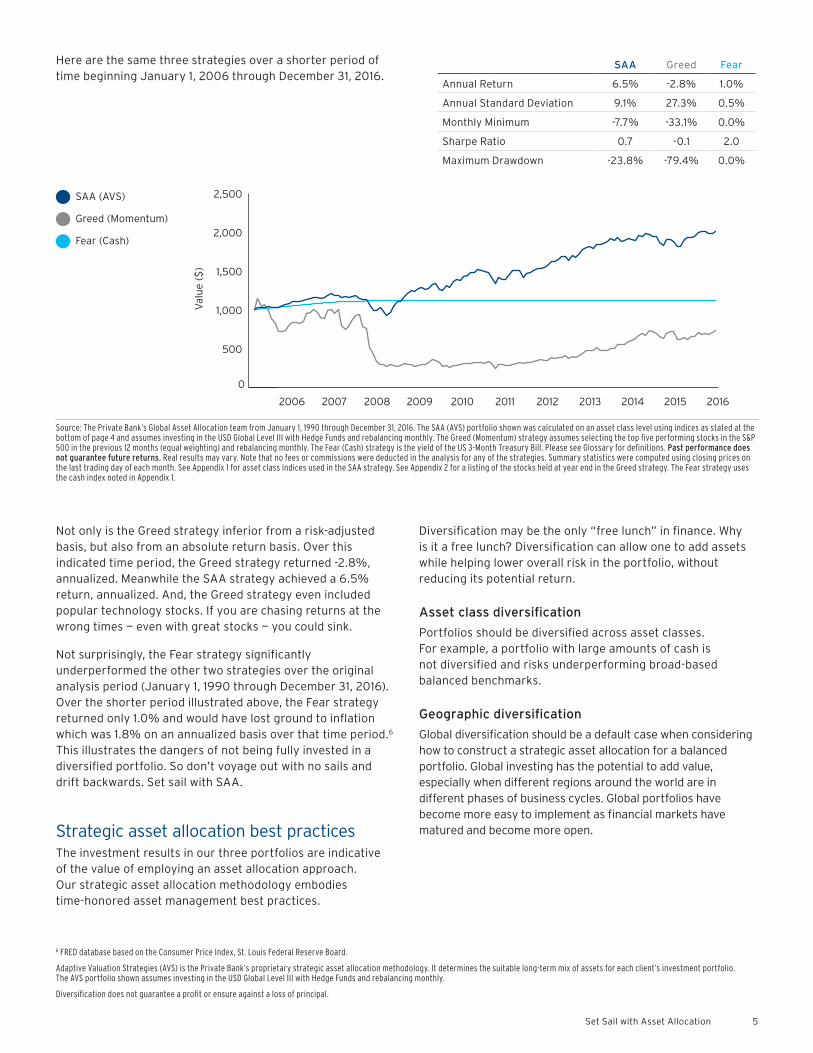
Here are the same three strategies over a shorter period of time beginning January 1, 2006 through December 31, 2016.
Not only is the Greed strategy inferior from a risk-adjusted basis, but also from an absolute return basis. Over this indicated time period, the Greed strategy returned -2.8%, annualized. Meanwhile the SAA strategy achieved a 6.5% return, annualized. And, the Greed strategy even included popular technology stocks. If you are chasing returns at the wrong times — even with great stocks — you could sink.
Not surprisingly, the Fear strategy significantly underperformed the other two strategies over the original analysis period (January 1, 1990 through December 31, 2016). Over the shorter period illustrated above, the Fear strategy returned only 1.0% and would have lost ground to inflation which was 1.8% on an annualized basis over that time period.6 This illustrates the dangers of not being fully invested in a diversified portfolio. So don’t voyage out with no sails and drift backwards. Set sail with SAA.
Strategic asset allocation best practicesThe investment results in our three portfolios are indicative of the value of employing an asset allocation approach. Our strategic asset allocation methodology embodies time-honored asset management best practices.
Diversification may be the only “free lunch” in finance. Why is it a free lunch? Diversification can allow one to add assets while helping lower overall risk in the portfolio, without reducing its potential return.
Asset class diversificationPortfolios should be diversified across asset classes. For example, a portfolio with large amounts of cash is not diversified and risks underperforming broad-based balanced benchmarks.
Geographic diversificationGlobal diversification should be a default case when considering how to construct a strategic asset allocation for a balanced portfolio. Global investing has the potential to add value, especially when different regions around the world are in different phases of business cycles. Global portfolios have become more easy to implement as financial markets have matured and become more open.
Source: The Private Bank’s Global Asset Allocation team from January 1, 1990 through December 31, 2016. The SAA (AVS) portfolio shown was calculated on an asset class level using indices as stated at the bottom of page 4 and assumes investing in the USD Global Level III with Hedge Funds and rebalancing monthly. The Greed (Momentum) strategy assumes selecting the top five performing stocks in the S&P 500 in the previous 12 months (equal weighting) and rebalancing monthly. The Fear (Cash) strategy is the yield of the US 3-Month Treasury Bill. Please see Glossary for definitions. Past performance does not guarantee future returns. Real results may vary. Note that no fees or commissions were deducted in the analysis for any of the strategies. Summary statistics were computed using closing prices on the last trading day of each month. See Appendix 1 for asset class indices used in the SAA strategy. See Appendix 2 for a listing of the stocks held at year end in the Greed strategy. The Fear strategy uses the cash index noted in Appendix 1.
2006 2007 2008 2009 2010 2011 2012 2013 2014 2015 2016
0
500
1,000
1,500
2,000
2,500Va
lue
($)
SAA Greed Fear
Annual Return 6.5% -2.8% 1.0%
Annual Standard Deviation 9.1% 27.3% 0.5%
Monthly Minimum -7.7% -33.1% 0.0%
Sharpe Ratio 0.7 -0.1 2.0
Maximum Drawdown -23.8% -79.4% 0.0%
SAA (AVS)
Greed (Momentum)
Fear (Cash)
6 FRED database based on the Consumer Price Index, St. Louis Federal Reserve Board.
Adaptive Valuation Strategies (AVS) is the Private Bank’s proprietary strategic asset allocation methodology. It determines the suitable long-term mix of assets for each client’s investment portfolio. The AVS portfolio shown assumes investing in the USD Global Level III with Hedge Funds and rebalancing monthly.
Diversification does not guarantee a profit or ensure against a loss of principal.
6 Set Sail with Asset Allocation
Sector diversificationDiversifying across sectors is also important as industries have become more globalized (e.g., energy). Researchers have debated which is more important: diversifying across countries/regions or across sectors.7 We recommend, to the extent possible, do both.
Factor diversificationLess obvious to the naked eye is factor diversification. Factors can be viewed as the underlying forces driving financial assets and are thus, understandably, an important lens through which to view portfolio risk and return exposures. Diversifying across factors (e.g., value versus growth or market capitalization) can be an important way to enhance portfolio efficiency.8
Target riskInvestors consider both return and risk when constructing portfolios, but often focus on targeting a specific level of return. And for very good reasons. This is important information for budgeting purposes. However, selecting a return can be difficult for two reasons: First, it is well known that returns are much more difficult to precisely estimate than risk.9 Second, return environments vary over time. Thus, setting an ambitious return goal in a lower return market environment will force an investor into a higher risk portfolio that may have undesirable consequences. For these two reasons, it may be preferable for investors to construct portfolios using long-term volatility measures and to select a portfolio risk level consistent with their risk aversion rather than constructing a portfolio solely based on a return objective.
RebalancingNot frequently discussed is that portfolio rebalancing can be thought of as diversifying a portfolio over time. Disciplined portfolio rebalancing — taking profits on securities that have appreciated and reallocating to securities that have depreciated — can provide incremental return relative to a buy-and-hold approach. So while initial diversification (geography, sector, etc.) in portfolio construction adds value in and of itself, maintaining that diversification through disciplined rebalancing over time can add even more incremental value in many cases. If diversification is the free lunch, then portfolio rebalancing is the free dessert.10
Valuation mattersWhen investors are fearful of markets, you should be greedy and when they are greedy, you should be fearful. If returns in an asset class have been attractive over the past 10 years, AVS implies that strategic return estimates (SRE) over the coming 10 years will be less attractive. Conversely, if an asset class has struggled over the past 10 years, our forecast is generally for more attractive returns in the coming 10 years. This effectively means: be a contrarian investor.
Risk managementTraditional approaches define risk as standard deviation, with no distinction between profitable and unprofitable volatility. However, what is most important to investors is avoiding downside losses. Constructing a portfolio using downside risk measures can help you sleep at night.
Get fully investedIn order to take full advantage of a long-term strategic asset allocation, investors should not sit in cash, but rather be fully invested. When incepting a new portfolio, investors need to first decide how to put their money to work right away. One popular approach is to dollar-cost average into your SAA plan over a period of time (e.g., 18 or 36 months). A more institutionally-oriented approach is to invest immediately based on your Investor Profile (or Investor Policy Statement) and SAA, at least initially, into market-tracking vehicles. Otherwise you are exposing the portfolio to the potential risk of underperforming your SAA benchmark.11
Now that we have shown the value of implementing a long-term investment strategy not based on return-eating emotional reactions, we can discuss how to construct an SAA.
7 See for example Heston, S. and Rouwenhorst, K. G., “Industry and Country Effects in International Stock Returns,” Journal of Portfolio Management, Spring 1995, vol. 21, no. 3.8 See for example Ang, A., Asset Management-A Systematic Approach to Factor Investing, Oxford University Press, 2014.9 See Merton, R. C, “On Estimating the Expected Return on the Market,” Journal of Financial Economics, vol. 8, no. 4, 1980.10 Willenbrock, S. “Diversification Return, Portfolio Rebalancing, and the Commodity Return Puzzle,” Financial Analyst Journal, vol. 67, no.4, 2011.11 See for example Rozeff, M. S., “Lump-Sum Investing versus Dollar-Averaging: Those Who Hesitate, Lose,” Journal of Portfolio Management, Winter 1994.
Quote from: Adaptive Valuation Strategies, A New Approach to Strategic Asset Allocation, 2017 Annual Update
Diversification does not guarantee a profit or ensure against a loss of principal.
Strategic Return Estimates (SRE) are not a guarantee of future returns.
See glossary for definitions of Strategic Return Estimates (SRE) and Extreme Downside Risk (EDR).
AVS uses a specialized risk measure called Extreme Downside Risk (EDR). This measure calculates the worst potential loss that a particular allocation may suffer within a rolling twelve-month period over ten years. We use this measure to inform how we construct our strategic asset allocations.

7Set Sail with Asset Allocation
41% Global Developed Equities
6% Global Emerging Equities
12% Global Investment Grade Fixed Income
2% Global High Yield Fixed Income
2% Global Emerging Fixed Income
35% Global Government Fixed Income
3% Cash
The chart above corresponds to AVS’ Global USD Risk Level II portfolio. The chart is fairly detailed, but perhaps a more intuitive way to think about the SAA is to group the allocations into three investment “buckets.”
Source: The Private Bank’s Global Asset Allocation team.
Process of creating a strategic asset allocation plan
Three investment buckets
It is important to review your SAA on a periodic basis to help ensure it remains consistent with lifestyle changes and needs. We believe that implementing a strategic asset allocation is one of the most important investment decisions that you can make to help ensure a sustainable asset base. It is the foundation of a disciplined investment plan.
38% Safety (Liquid)
16% Income Oriented
46% Risky (Growth)
Sourced internally or from advisors
Sourced internally or from advisors
Quantitative and/or qualitative process or algorithm to optimize these inputs into optimal asset class allocations
Investor-specific
Capital Market Return Assumptions on Asset Classes
Risk Assumptions
Optimize Allocations
Constraints
1 Inputs 2 Optimization 3 Output
Safety (Liquid)• The “sleep at night” bucket is intended to be a buffer
to help protect against unexpected expenses
• Includes assets such as sovereign short-term or treasury inflation securities
Income Oriented• Accounts for lifestyle needs
• Includes assets such as medium/long duration investment bonds and higher dividend-yielding equities
Risky (Growth)• The higher risk/higher return potential bucket may drop
in value at times — sometimes precipitously — but the other two buckets help to diversify some of the risk
• It is expected that this bucket will be the growth engine for the portfolio over time
8 Set Sail with Asset Allocation
Tactical asset class calls are made by our Global Investment Committee (GIC) on a globally diversified set of asset classes and are intended to take advantage of shorter-term market opportunities and help mitigate shorter-term risks. The GIC’s investment horizon is 12 to 18 months and therefore considers return and risk on a shorter-term basis than AVS.
While AVS is a quantitative methodology, the GIC’s decision-making process blends quantitative with qualitative inputs from asset-class specialists at Citi Research and from within the Private Bank.
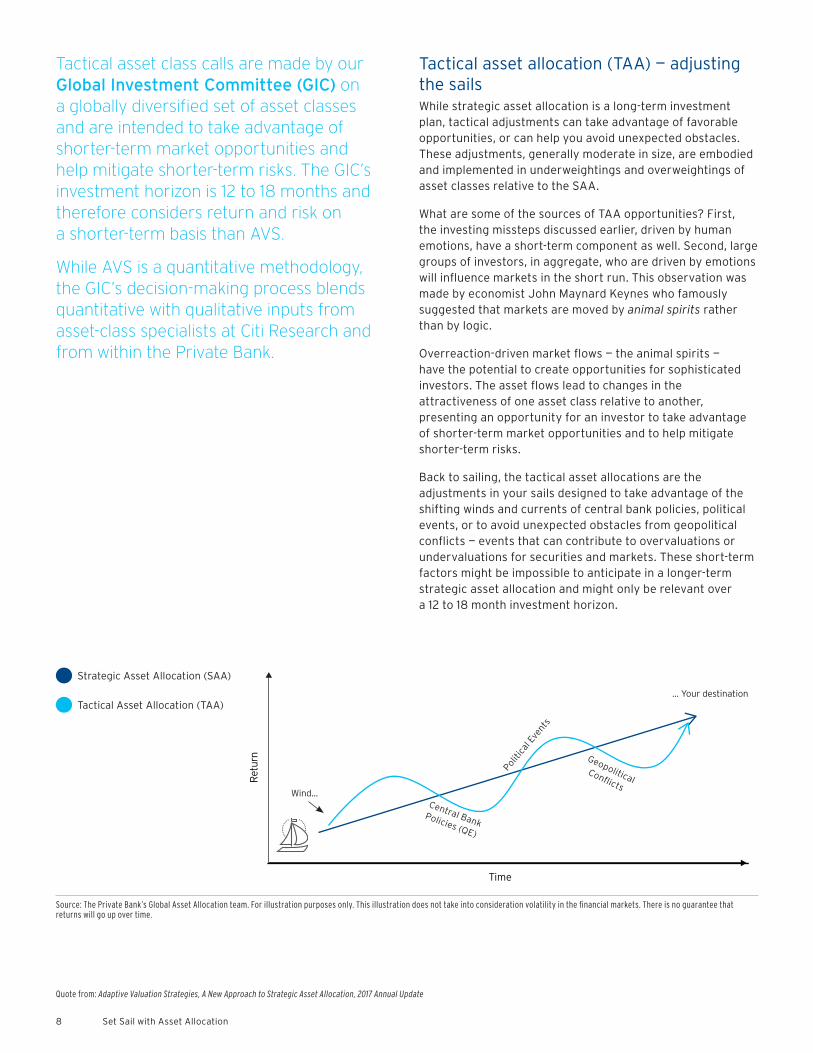
Tactical asset allocation (TAA) — adjusting the sails While strategic asset allocation is a long-term investment plan, tactical adjustments can take advantage of favorable opportunities, or can help you avoid unexpected obstacles. These adjustments, generally moderate in size, are embodied and implemented in underweightings and overweightings of asset classes relative to the SAA.
What are some of the sources of TAA opportunities? First, the investing missteps discussed earlier, driven by human emotions, have a short-term component as well. Second, large groups of investors, in aggregate, who are driven by emotions will influence markets in the short run. This observation was made by economist John Maynard Keynes who famously suggested that markets are moved by animal spirits rather than by logic.
Overreaction-driven market flows — the animal spirits — have the potential to create opportunities for sophisticated investors. The asset flows lead to changes in the attractiveness of one asset class relative to another, presenting an opportunity for an investor to take advantage of shorter-term market opportunities and to help mitigate shorter-term risks.
Back to sailing, the tactical asset allocations are the adjustments in your sails designed to take advantage of the shifting winds and currents of central bank policies, political events, or to avoid unexpected obstacles from geopolitical conflicts — events that can contribute to overvaluations or undervaluations for securities and markets. These short-term factors might be impossible to anticipate in a longer-term strategic asset allocation and might only be relevant over a 12 to 18 month investment horizon.
Source: The Private Bank’s Global Asset Allocation team. For illustration purposes only. This illustration does not take into consideration volatility in the financial markets. There is no guarantee that returns will go up over time.
Quote from: Adaptive Valuation Strategies, A New Approach to Strategic Asset Allocation, 2017 Annual Update
Time
Ret
urn
Politi
cal E
vent
s
Central Bank Policies (QE)
Geopolitical Conflicts
... Your destination
Wind...
Strategic Asset Allocation (SAA)
Tactical Asset Allocation (TAA)
9Set Sail with Asset Allocation
Overreactions are evident from the herd behavior and flows into “hot” asset classes:
“Risk-on” periods Investors generally become more risk tolerant and we see large asset flows into momentum strategies — recall the Greed strategy.
“Risk-off” periodsInvestors generally become more risk averse and we see large asset flows into cash and highly defensive strategies — recall the Fear strategy.
Purposely navigating off course for a short period of time to avoid a risk has the potential to add value to your portfolio: you may get to your destination faster by taking advantage of a puff of wind, while simultaneously reducing risk by not colliding with the hazard on your course.
There are opportunities for TAA to add value, but TAA also comes with a challenge. This relates to the “Fundamental Law of Active Management” which states that the magnitude of the potential return/risk ratio for a strategy increases with forecasting accuracy and the number of independent investment decisions made in the strategy.12
To understand the implication of this, compare an equity or a bond portfolio manager to an asset allocator. In the security selection process, the portfolio manager makes decisions on which securities to overweight or underweight relative to a benchmark. This requires a large number of decisions, as there is a large number of securities in the investment universe. However, in the TAA process, while the asset allocator also makes decisions on which investments to emphasize (i.e., asset classes) relative to the strategic allocation, there are far fewer asset classes than there are securities.
Assuming similar forecasting accuracy, the asset allocator faces a higher hurdle than the portfolio manager in achieving high return/risk ratios as the allocator is making fewer independent decisions. This is why trying to time just two asset classes, say cash versus equities, like a wager on a single coin toss, is a risky proposition. But research has shown that diversified TAA strategies, which make tactical adjustments to many asset classes, have the potential to contribute economically to core portfolio returns.13 So, from a performance perspective, both investment selection and tactical asset allocation can independently be a meaningful source of additional value to a strategic asset allocation.
Oliver Wendell Holmes, Sr.
“To reach a port we must sail, sometimes with the wind, and sometimes against it. But we must not drift or lie at anchor.”
12 Fundamental Law of Active Portfolio Management is IR=IC x √BR, where IR is Information Ratio (i.e., return/risk ratio), IC is Information Coefficient (i.e., forecasting accuracy) and BR is Breadth (i.e., number of independent decisions). For details see Grinold, R and Kahn, R, Active Portfolio Management, McGraw Hill, 1999.
13 Blitz, David and van Vliet, Pim, Global Tactical Cross-Asset Allocation: Applying Value and Momentum Across Asset Classes (2008).
10 Set Sail with Asset Allocation
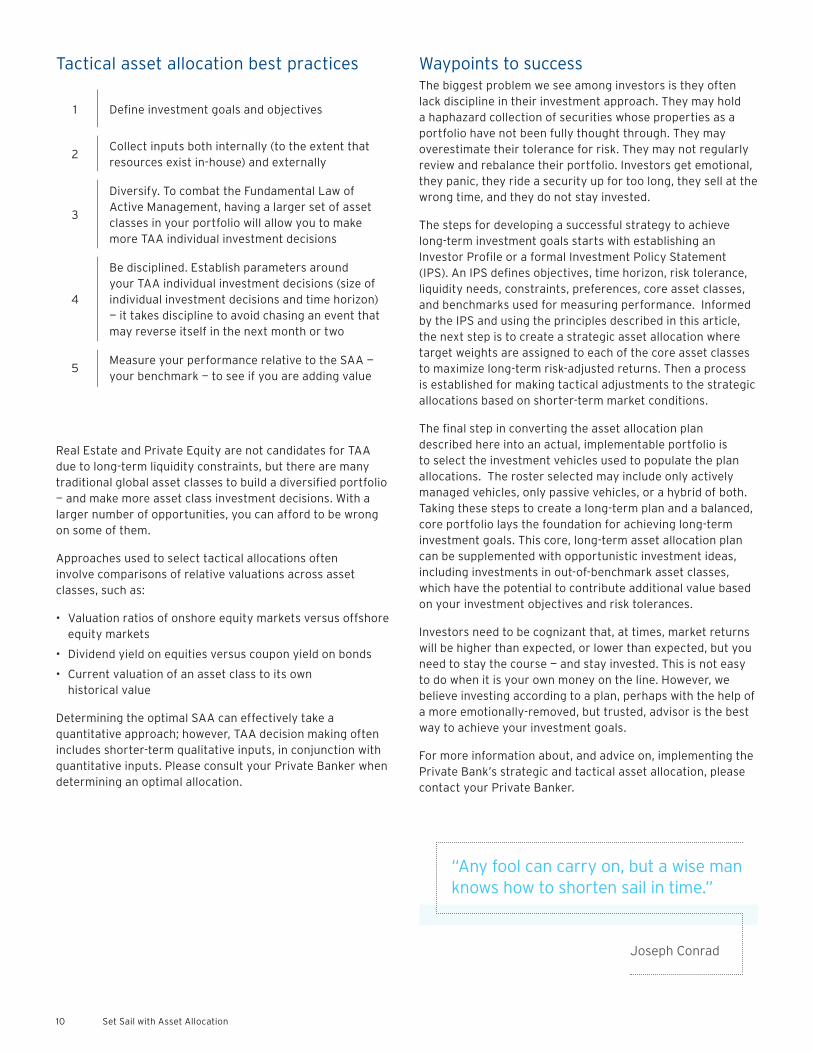
Real Estate and Private Equity are not candidates for TAA due to long-term liquidity constraints, but there are many traditional global asset classes to build a diversified portfolio — and make more asset class investment decisions. With a larger number of opportunities, you can afford to be wrong on some of them.
Approaches used to select tactical allocations often involve comparisons of relative valuations across asset classes, such as:
• Valuation ratios of onshore equity markets versus offshore equity markets
• Dividend yield on equities versus coupon yield on bonds
• Current valuation of an asset class to its own historical value
Determining the optimal SAA can effectively take a quantitative approach; however, TAA decision making often includes shorter-term qualitative inputs, in conjunction with quantitative inputs. Please consult your Private Banker when determining an optimal allocation.
Joseph Conrad
“Any fool can carry on, but a wise man knows how to shorten sail in time.”
1 Define investment goals and objectives
2Collect inputs both internally (to the extent that resources exist in-house) and externally
3
Diversify. To combat the Fundamental Law of Active Management, having a larger set of asset classes in your portfolio will allow you to make more TAA individual investment decisions
4
Be disciplined. Establish parameters around your TAA individual investment decisions (size of individual investment decisions and time horizon) — it takes discipline to avoid chasing an event that may reverse itself in the next month or two
5Measure your performance relative to the SAA — your benchmark — to see if you are adding value
Tactical asset allocation best practices Waypoints to successThe biggest problem we see among investors is they often lack discipline in their investment approach. They may hold a haphazard collection of securities whose properties as a portfolio have not been fully thought through. They may overestimate their tolerance for risk. They may not regularly review and rebalance their portfolio. Investors get emotional, they panic, they ride a security up for too long, they sell at the wrong time, and they do not stay invested.
The steps for developing a successful strategy to achieve long-term investment goals starts with establishing an Investor Profile or a formal Investment Policy Statement (IPS). An IPS defines objectives, time horizon, risk tolerance, liquidity needs, constraints, preferences, core asset classes, and benchmarks used for measuring performance. Informed by the IPS and using the principles described in this article, the next step is to create a strategic asset allocation where target weights are assigned to each of the core asset classes to maximize long-term risk-adjusted returns. Then a process is established for making tactical adjustments to the strategic allocations based on shorter-term market conditions.
The final step in converting the asset allocation plan described here into an actual, implementable portfolio is to select the investment vehicles used to populate the plan allocations. The roster selected may include only actively managed vehicles, only passive vehicles, or a hybrid of both. Taking these steps to create a long-term plan and a balanced, core portfolio lays the foundation for achieving long-term investment goals. This core, long-term asset allocation plan can be supplemented with opportunistic investment ideas, including investments in out-of-benchmark asset classes, which have the potential to contribute additional value based on your investment objectives and risk tolerances.
Investors need to be cognizant that, at times, market returns will be higher than expected, or lower than expected, but you need to stay the course — and stay invested. This is not easy to do when it is your own money on the line. However, we believe investing according to a plan, perhaps with the help of a more emotionally-removed, but trusted, advisor is the best way to achieve your investment goals.
For more information about, and advice on, implementing the Private Bank’s strategic and tactical asset allocation, please contact your Private Banker.
11Set Sail with Asset Allocation
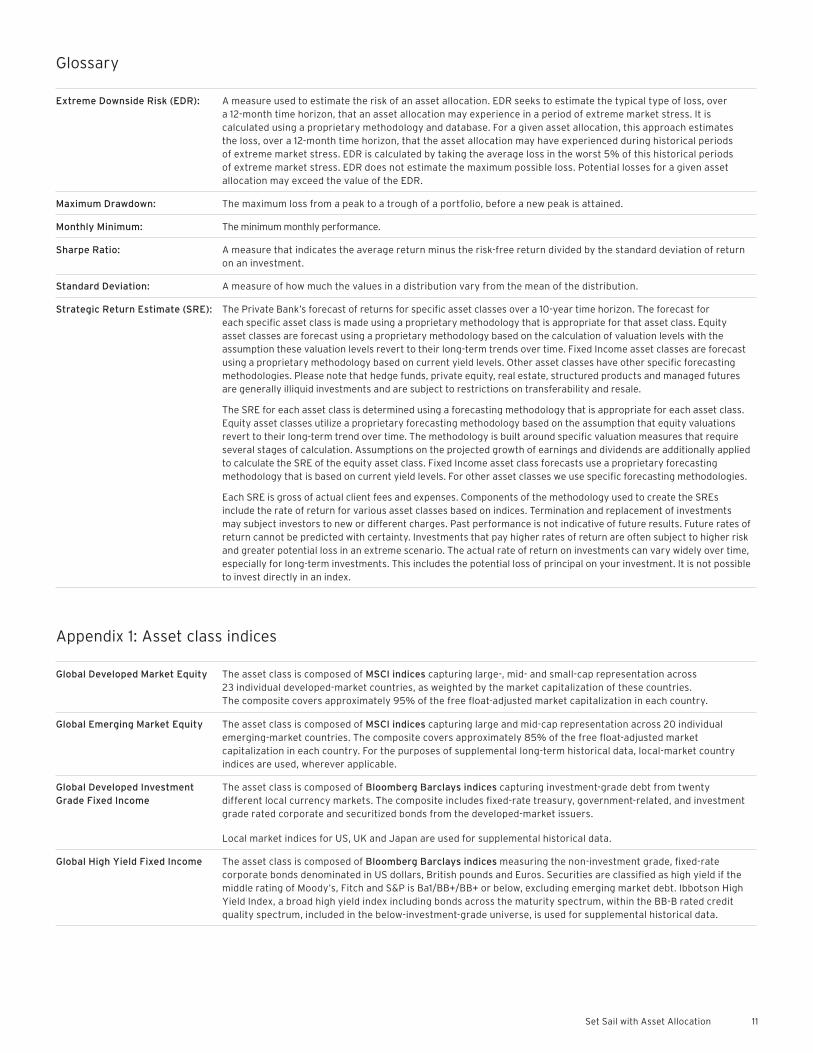
Appendix 1: Asset class indices
Global Developed Market Equity The asset class is composed of MSCI indices capturing large-, mid- and small-cap representation across 23 individual developed-market countries, as weighted by the market capitalization of these countries. The composite covers approximately 95% of the free float-adjusted market capitalization in each country.
Global Emerging Market Equity The asset class is composed of MSCI indices capturing large and mid-cap representation across 20 individual emerging-market countries. The composite covers approximately 85% of the free float-adjusted market capitalization in each country. For the purposes of supplemental long-term historical data, local-market country indices are used, wherever applicable.
Global Developed Investment Grade Fixed Income
The asset class is composed of Bloomberg Barclays indices capturing investment-grade debt from twenty different local currency markets. The composite includes fixed-rate treasury, government-related, and investment grade rated corporate and securitized bonds from the developed-market issuers.
Local market indices for US, UK and Japan are used for supplemental historical data.
Global High Yield Fixed Income The asset class is composed of Bloomberg Barclays indices measuring the non-investment grade, fixed-rate corporate bonds denominated in US dollars, British pounds and Euros. Securities are classified as high yield if the middle rating of Moody’s, Fitch and S&P is Ba1/BB+/BB+ or below, excluding emerging market debt. Ibbotson High Yield Index, a broad high yield index including bonds across the maturity spectrum, within the BB-B rated credit quality spectrum, included in the below-investment-grade universe, is used for supplemental historical data.
Glossary
Extreme Downside Risk (EDR): A measure used to estimate the risk of an asset allocation. EDR seeks to estimate the typical type of loss, over a 12-month time horizon, that an asset allocation may experience in a period of extreme market stress. It is calculated using a proprietary methodology and database. For a given asset allocation, this approach estimates the loss, over a 12-month time horizon, that the asset allocation may have experienced during historical periods of extreme market stress. EDR is calculated by taking the average loss in the worst 5% of this historical periods of extreme market stress. EDR does not estimate the maximum possible loss. Potential losses for a given asset allocation may exceed the value of the EDR.
Maximum Drawdown: The maximum loss from a peak to a trough of a portfolio, before a new peak is attained.
Monthly Minimum: The minimum monthly performance.
Sharpe Ratio: A measure that indicates the average return minus the risk-free return divided by the standard deviation of return on an investment.
Standard Deviation: A measure of how much the values in a distribution vary from the mean of the distribution.
Strategic Return Estimate (SRE): The Private Bank’s forecast of returns for specific asset classes over a 10-year time horizon. The forecast for each specific asset class is made using a proprietary methodology that is appropriate for that asset class. Equity asset classes are forecast using a proprietary methodology based on the calculation of valuation levels with the assumption these valuation levels revert to their long-term trends over time. Fixed Income asset classes are forecast using a proprietary methodology based on current yield levels. Other asset classes have other specific forecasting methodologies. Please note that hedge funds, private equity, real estate, structured products and managed futures are generally illiquid investments and are subject to restrictions on transferability and resale.
The SRE for each asset class is determined using a forecasting methodology that is appropriate for each asset class. Equity asset classes utilize a proprietary forecasting methodology based on the assumption that equity valuations revert to their long-term trend over time. The methodology is built around specific valuation measures that require several stages of calculation. Assumptions on the projected growth of earnings and dividends are additionally applied to calculate the SRE of the equity asset class. Fixed Income asset class forecasts use a proprietary forecasting methodology that is based on current yield levels. For other asset classes we use specific forecasting methodologies.
Each SRE is gross of actual client fees and expenses. Components of the methodology used to create the SREs include the rate of return for various asset classes based on indices. Termination and replacement of investments may subject investors to new or different charges. Past performance is not indicative of future results. Future rates of return cannot be predicted with certainty. Investments that pay higher rates of return are often subject to higher risk and greater potential loss in an extreme scenario. The actual rate of return on investments can vary widely over time, especially for long-term investments. This includes the potential loss of principal on your investment. It is not possible to invest directly in an index.
12 Set Sail with Asset Allocation
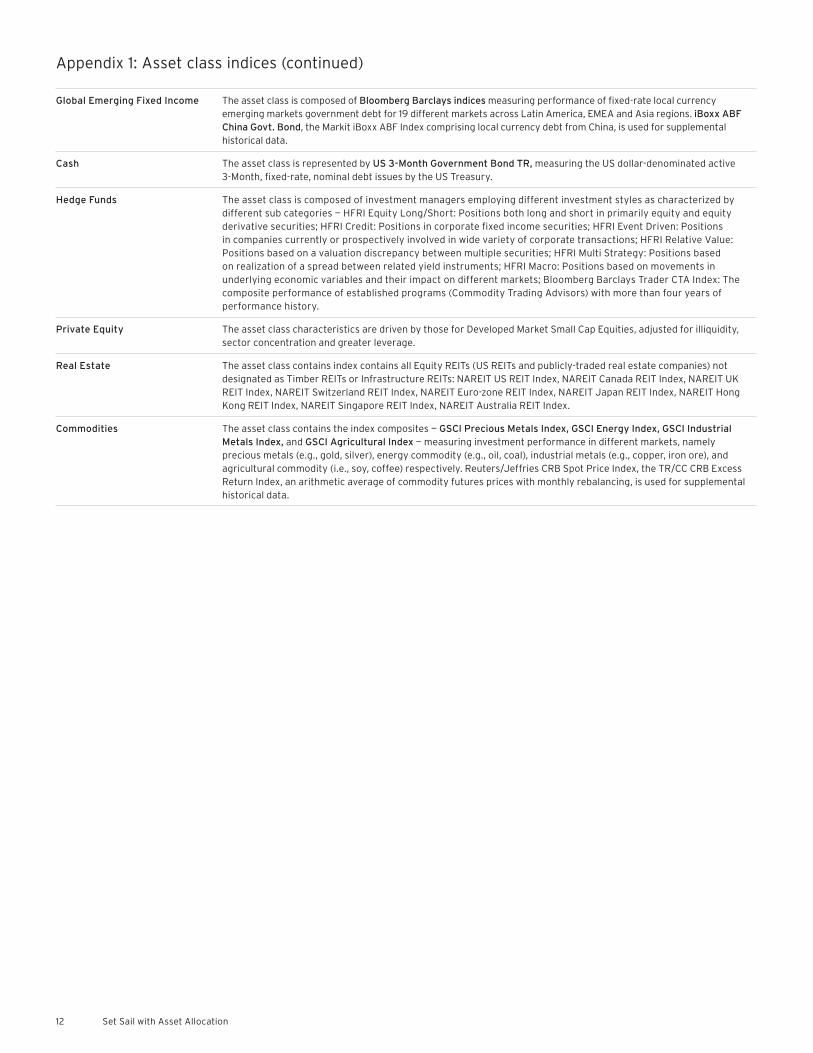
Global Emerging Fixed Income The asset class is composed of Bloomberg Barclays indices measuring performance of fixed-rate local currency emerging markets government debt for 19 different markets across Latin America, EMEA and Asia regions. iBoxx ABF China Govt. Bond, the Markit iBoxx ABF Index comprising local currency debt from China, is used for supplemental historical data.
Cash The asset class is represented by US 3-Month Government Bond TR, measuring the US dollar-denominated active 3-Month, fixed-rate, nominal debt issues by the US Treasury.
Hedge Funds The asset class is composed of investment managers employing different investment styles as characterized by different sub categories — HFRI Equity Long/Short: Positions both long and short in primarily equity and equity derivative securities; HFRI Credit: Positions in corporate fixed income securities; HFRI Event Driven: Positions in companies currently or prospectively involved in wide variety of corporate transactions; HFRI Relative Value: Positions based on a valuation discrepancy between multiple securities; HFRI Multi Strategy: Positions based on realization of a spread between related yield instruments; HFRI Macro: Positions based on movements in underlying economic variables and their impact on different markets; Bloomberg Barclays Trader CTA Index: The composite performance of established programs (Commodity Trading Advisors) with more than four years of performance history.
Private Equity The asset class characteristics are driven by those for Developed Market Small Cap Equities, adjusted for illiquidity, sector concentration and greater leverage.
Real Estate The asset class contains index contains all Equity REITs (US REITs and publicly-traded real estate companies) not designated as Timber REITs or Infrastructure REITs: NAREIT US REIT Index, NAREIT Canada REIT Index, NAREIT UK REIT Index, NAREIT Switzerland REIT Index, NAREIT Euro-zone REIT Index, NAREIT Japan REIT Index, NAREIT Hong Kong REIT Index, NAREIT Singapore REIT Index, NAREIT Australia REIT Index.
Commodities The asset class contains the index composites — GSCI Precious Metals Index, GSCI Energy Index, GSCI Industrial Metals Index, and GSCI Agricultural Index — measuring investment performance in different markets, namely precious metals (e.g., gold, silver), energy commodity (e.g., oil, coal), industrial metals (e.g., copper, iron ore), and agricultural commodity (i.e., soy, coffee) respectively. Reuters/Jeffries CRB Spot Price Index, the TR/CC CRB Excess Return Index, an arithmetic average of commodity futures prices with monthly rebalancing, is used for supplemental historical data.
Appendix 1: Asset class indices (continued)
13Set Sail with Asset Allocation
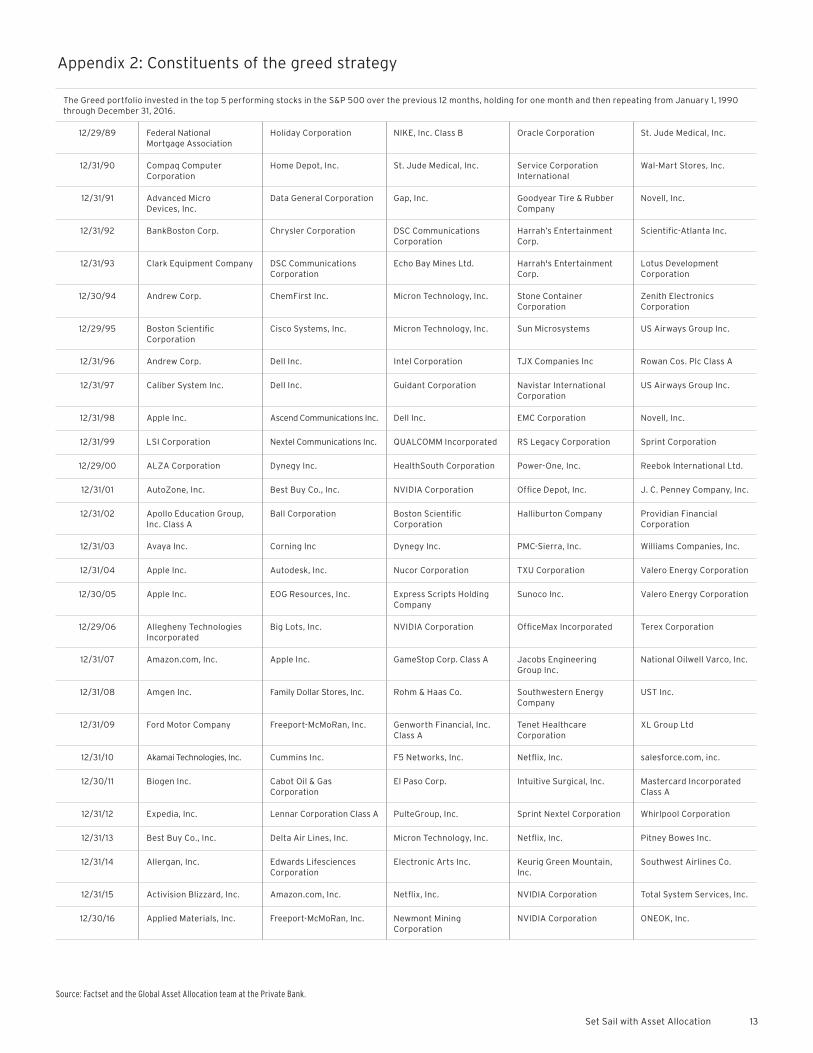
Appendix 2: Constituents of the greed strategy
The Greed portfolio invested in the top 5 performing stocks in the S&P 500 over the previous 12 months, holding for one month and then repeating from January 1, 1990 through December 31, 2016.
12/29/89 Federal National Mortgage Association
Holiday Corporation NIKE, Inc. Class B Oracle Corporation St. Jude Medical, Inc.
12/31/90 Compaq Computer Corporation
Home Depot, Inc. St. Jude Medical, Inc. Service Corporation International
Wal-Mart Stores, Inc.
12/31/91 Advanced Micro Devices, Inc.
Data General Corporation Gap, Inc. Goodyear Tire & Rubber Company
Novell, Inc.
12/31/92 BankBoston Corp. Chrysler Corporation DSC Communications Corporation
Harrah’s Entertainment Corp.
Scientific-Atlanta Inc.
12/31/93 Clark Equipment Company DSC Communications Corporation
Echo Bay Mines Ltd. Harrah's Entertainment Corp.
Lotus Development Corporation
12/30/94 Andrew Corp. ChemFirst Inc. Micron Technology, Inc. Stone Container Corporation
Zenith Electronics Corporation
12/29/95 Boston Scientific Corporation
Cisco Systems, Inc. Micron Technology, Inc. Sun Microsystems US Airways Group Inc.
12/31/96 Andrew Corp. Dell Inc. Intel Corporation TJX Companies Inc Rowan Cos. Plc Class A
12/31/97 Caliber System Inc. Dell Inc. Guidant Corporation Navistar International Corporation
US Airways Group Inc.
12/31/98 Apple Inc. Ascend Communications Inc. Dell Inc. EMC Corporation Novell, Inc.
12/31/99 LSI Corporation Nextel Communications Inc. QUALCOMM Incorporated RS Legacy Corporation Sprint Corporation
12/29/00 ALZA Corporation Dynegy Inc. HealthSouth Corporation Power-One, Inc. Reebok International Ltd.
12/31/01 AutoZone, Inc. Best Buy Co., Inc. NVIDIA Corporation Office Depot, Inc. J. C. Penney Company, Inc.
12/31/02 Apollo Education Group, Inc. Class A
Ball Corporation Boston Scientific Corporation
Halliburton Company Providian Financial Corporation
12/31/03 Avaya Inc. Corning Inc Dynegy Inc. PMC-Sierra, Inc. Williams Companies, Inc.
12/31/04 Apple Inc. Autodesk, Inc. Nucor Corporation TXU Corporation Valero Energy Corporation
12/30/05 Apple Inc. EOG Resources, Inc. Express Scripts Holding Company
Sunoco Inc. Valero Energy Corporation
12/29/06 Allegheny Technologies Incorporated
Big Lots, Inc. NVIDIA Corporation OfficeMax Incorporated Terex Corporation
12/31/07 Amazon.com, Inc. Apple Inc. GameStop Corp. Class A Jacobs Engineering Group Inc.
National Oilwell Varco, Inc.
12/31/08 Amgen Inc. Family Dollar Stores, Inc. Rohm & Haas Co. Southwestern Energy Company
UST Inc.
12/31/09 Ford Motor Company Freeport-McMoRan, Inc. Genworth Financial, Inc. Class A
Tenet Healthcare Corporation
XL Group Ltd
12/31/10 Akamai Technologies, Inc. Cummins Inc. F5 Networks, Inc. Netflix, Inc. salesforce.com, inc.
12/30/11 Biogen Inc. Cabot Oil & Gas Corporation
El Paso Corp. Intuitive Surgical, Inc. Mastercard Incorporated Class A
12/31/12 Expedia, Inc. Lennar Corporation Class A PulteGroup, Inc. Sprint Nextel Corporation Whirlpool Corporation
12/31/13 Best Buy Co., Inc. Delta Air Lines, Inc. Micron Technology, Inc. Netflix, Inc. Pitney Bowes Inc.
12/31/14 Allergan, Inc. Edwards Lifesciences Corporation
Electronic Arts Inc. Keurig Green Mountain, Inc.
Southwest Airlines Co.
12/31/15 Activision Blizzard, Inc. Amazon.com, Inc. Netflix, Inc. NVIDIA Corporation Total System Services, Inc.
12/30/16 Applied Materials, Inc. Freeport-McMoRan, Inc. Newmont Mining Corporation
NVIDIA Corporation ONEOK, Inc.
Source: Factset and the Global Asset Allocation team at the Private Bank.

1653768 02/18
In any instance where distribution of this communication (“Communication”) is subject to the rules of the U.S. Commodity Futures Trading Commission (“CFTC”), this communication constitutes an invitation to consider entering into a derivatives transaction under U.S. CFTC Regulations §§ 1.71 and 23.605, where applicable, but is not a binding offer to buy/sell any financial instrument. This communication is prepared by Citi Private Bank (“CPB”), a business of Citigroup, Inc. (“Citigroup”), which provides its clients access to a broad array of products and services available through Citigroup, its bank and non-bank affiliates worldwide (collectively, “Citi”). Not all products and services are provided by all affiliates, or are available at all locations. CPB personnel are not research analysts, and the information in this communication is not intended to constitute “research”, as that term is defined by applicable regulations.
This document is for informational purposes only and does not constitute a solicitation to buy or sell securities. All expressions of opinion are subject to change without notice and are not intended to be a forecast of future events or a guarantee of future results. Opinions expressed herein may differ from the opinions expressed by other businesses of Citigroup Inc., are not intended to be a forecast of future events or a guarantee of future results or investment advice and are subject to change based on market and other conditions. Past performance is not a guarantee of future results. Although information in this document has been obtained from sources believed to be reliable, Citigroup Inc. and its affiliates do not guarantee its accuracy or completeness and accept no liability for any direct or consequential losses arising from its use. Throughout this publication where charts indicate that a third party (parties) is the source, please note that the attributed may refer to the raw data received from such parties.
Citi Private Bank is a business of Citigroup Inc. (“Citigroup”), which provides its clients access to a broad array of products and services available through bank and non-bank affiliates of Citigroup. Not all products and services are provided by all affiliates or are available at all locations. In the U.S., investment products and services are provided by Citigroup Global Markets Inc. (“CGMI”), member FINRA and SIPC, and Citi Private Advisory, LLC (“Citi Advisory”), member FINRA and SIPC. CGMI accounts are carried by Pershing LLC, member FINRA, NYSE, SIPC. Citi Advisory acts as distributor of certain alternative investment products to clients of Citi Private Bank. CGMI, Citi Advisory and Citibank, N.A. are affiliated companies under the common control of Citigroup.
Outside the U.S., investment products and services are provided by other Citigroup affiliates. Investment Management services (including portfolio management) are available through CGMI, Citi Advisory, Citibank, N.A. and other affiliated advisory businesses. These Citigroup affiliates, including Citi Advisory, will be compensated for the respective investment management, advisory, administrative, distribution and placement services they may provide.
In Hong Kong, this document is issued by Citi Private Bank (“CPB”) operating through Citibank N.A., Hong Kong branch, which is regulated by the Hong Kong Monetary Authority. Any questions in connection with the contents in this document should be directed to registered or licensed representatives of the aforementioned entity. To the extent this document is provided to clients who are booked and/or managed in Hong Kong: No other statement(s) in this document shall operate to remove, exclude or restrict any of your rights or obligations of Citibank under applicable laws and regulations. Citibank, N.A., Hong Kong Branch does not intend to rely on any provisions herein which are inconsistent with its obligations under the Code of Conduct for Persons Licensed by or Registered with the Securities and Futures Commission, or which mis-describes the actual services to be provided to you.
In Singapore, this document is issued by CPB operating through Citibank N.A., Singapore branch, which is regulated by the Monetary Authority of Singapore. Any questions in connection with the contents in this document should be directed to registered or licensed representatives of the aforementioned entity.
Citibank N.A., London Branch (registered branch number BR001018), Citigroup Centre, Canada Square, Canary Wharf, London, E14 5LB, is authorised and regulated by the Office of the Comptroller of the Currency (USA) and authorised by the Prudential Regulation Authority. Subject to regulation by the Financial Conduct Authority and limited regulation by the Prudential Regulation Authority. Details about the extent of our regulation by the Prudential Regulation Authority are available from us on request. The contact number for Citibank N.A., London Branch is +44 (0)20 7508 8000.
Citibank Europe plc is regulated by the Central Bank of Ireland. It is authorised by the Central Bank of Ireland and by the Prudential Regulation Authority. It is subject to supervision by the Central Bank of Ireland, and subject to limited regulation by the Financial Conduct Authority and the Prudential Regulation Authority. Details about the extent of our authorisation and regulation by the Prudential Regulation Authority, and regulation by the Financial Conduct Authority are available from us on request. Citibank Europe plc, UK Branch is registered as a branch in the register of companies for England and Wales with registered branch number BR017844. Its registered address is Citigroup Centre, Canada Square, Canary Wharf, London E14 5LB. VAT No.: GB 429 6256 29. Citibank Europe plc is registered in Ireland with number 132781, with its registered office at 1 North Wall Quay, Dublin 1. Citibank Europe plc is regulated by the Central Bank of Ireland. Ultimately owned by Citigroup Inc., New York, USA.
In Jersey, this document is communicated by Citibank N.A., Jersey Branch which has its registered address at PO Box 104, 38 Esplanade, St Helier, Jersey JE4 8QB. Citibank N.A., Jersey Branch is regulated by the Jersey Financial Services Commission.
In Canada, Citi Private Bank is a division of Citibank Canada, a Schedule II Canadian chartered bank. Certain investment products are made available through Citibank Canada Investment Funds Limited (“CCIFL”), a wholly owned subsidiary of Citibank Canada. Investment Products are subject to investment risk, including possible loss of principal amount invested. Investment Products are not insured by the CDIC, FDIC or depository insurance regime of any jurisdiction and are not guaranteed by Citigroup or any affiliate thereof.
This document is for information purposes only and does not constitute an offer to sell or a solicitation of an offer to buy any securities to any person in any jurisdiction. The information set out herein may be subject to updating, completion, revision, verification and amendment and such information may change materially.
Citigroup, its affiliates and any of the officers, directors, employees, representatives or agents shall not be held liable for any direct, indirect, incidental, special, or consequential damages, including loss of profits, arising out of the use of information contained herein, including through errors whether caused by negligence or otherwise.
CCIFL is not currently a member, and does not intend to become a member of the Mutual Fund Dealers Association of Canada (“MFDA”); consequently, clients of CCIFL will not have available to them investor protection benefits that would otherwise derive from membership of CCIFL in the MFDA, including coverage under any investor protection plan for clients of members of the MFDA.
© 2018 Citigroup Inc. All Rights Reserved. Citi, Citi and Arc Design and other marks used herein are service marks of Citigroup Inc. or its affiliates, used and registered throughout the world.
www.citiprivatebank.com