ser - int-res.com · absorption of light by phytoplankton, ... tions, only surface water was...
TRANSCRIPT
MARINE ECOLOGY PROGRESS SERIES Mar Ecol Prog Ser
, Published December 14
Primary production, physiological state and composition of phytoplankton in the
Atlantic Sector of the Southern Ocean
'Alfred Wegener Institute for Polar and Marine Research. Postfach 120161, 27515 Bremerhaven, Germany 'Zoology Department. University of Cape Town. Rondebosch 7700. Souih Africa
'George Deacon Division, Southampton Oceanography Centre. Empress Dock. Southampton SO14 3ZH. United Kingdom
ABSTRACT Phytoplankton species composition and primary production 'ivere studied in the Atlantic Sector of the Southern Ocean in early austral Summer 1995/1996 Results from photosynthasis-irradi- ance expenments (P vs E curves) were used to examine photosvnthetic adaptation in this pdrt of the ocean. The study area comprised 3 different provinces: the Antarctic Polar Front (APF). the Antarctic Circumpolar Current (ACC) beyond the influence of frontal systems, and the marginal ice Zone (411Z). Phytoplankton cornposition denved from HPLC data, P', (maximum biomass-specific photosynthetic production rate) values arid areal daily pnmary production (ADP) rates showed different features for these Tones. The central core of the APF was dominated (60°:7] by a bloom of large (>20 pm) diatoms (Thalassiothrix spp., Pseudonitzschia cf. lineola and Chaetoceros spp.), equal values for P;, at the sur- face and 1 ''o Light depths and ADP rates exceeding 900 mg C m-2 d-'. At the fringes of the APF core, phytoplankton were smaller, diatom abundance decreased and dinoflagellates, prymnesiophytes and chrysophytes became more important within the rommunity. Chlorophyll a concentrations and ADP rates were low and comparable to values for the A<:C outside the front: ~ 0 . 5 mg m-"nd 1300 mg C mv2 d- ' respectively. Beyond the frontal systems, P',,, values from the I?!, light depth were significantly higher than at the surface. There was also a bloom of large phytoplankton species within the MIZ, dom- inated in contrast by Phaeocystis spp.; this province was charactensed by ADP rates of 558 mg C m-2 d". Vertical mixing processes. temperature, silicate concentrations and zooplankton grazing seem to be the factors controlling production and growth of phytoplankton at this time.
KEY WORDS: Southern Ocean . Phytoplankton . Photosynthesis . Photoacclimation . Pigment compo- sition
INTRODUCTION
A current objective of biological oceanography is to quantify the mean and variance of phytoplankton bio- mass and production on basin-wide and global scales (Bidigare et al. 1992). Early productivity studies in the Southern Ocean were carried out in areas with localised high biornass and production, leading to erro- neously high estimates of total productivity for the entire Southern Ocean (EI-Sayed 1984, Jacques 1989). Today, it is clear that productivity in the Southern
Ocean is highly variable (Sullivan et al. 1993, Arrigo et al. 1998, Bathmann et al. 1998). However, cornpared to other regions maximum phytoplankton growth rates are generally low (<0.6 d-') due to the low ternperature (Sakshaug & Slagstad 1991).
Despite high macronutrient concentrations, the main body of the Antarctic Circumpolar Current (ACC) is typified by chlorophyll a (chl a) concentrations of <0.3 mg m-3 over a deep mixed layer and correspond- ingly low productivity by nano- and picoplankton (e .g . Jacques 1989) cha.ractenstic of an HNLC (high-nutri- ents-low-chlorophyll) ocean (Chisholm & More1 1991). Low surface temperatures, weak density stratification, little summertime surface irradiance, 1ow iron concen-
O Inter-Research 1999 Resale of fuU article not permitted
2 Mar Ecol Prog Ser 190: 1-16, 1999
trations, strong wind Stress and high microzooplankton grazing pressures ail contnbute to the low biomass and productivity typical of the ACC (Bathmann et al. 1998).
However, more productive regions do exist. The northern ACC is separated from the southern ACC by the Antarctic Polar Front (APF) located at about 50" S (Treguer & Jacques 1992, Orsi et al. 1995). Here, warmer water masses from rnid-latitudes converge with colder ones from further south so that the APF is marked by meanders, mesoscale eddies and strong west-east zonal flow characterised by enhanced diatom dorninated biomass and production (Comiso et al. 1990, Laubscher et al. 1993, Sullivan et al. 1993, Dafner & Mordasova 1994, Bathmann et al. 1997a, Hense et al. 1998). One consequence of this is the sed- imentation of silica-nch biogenic material giving rise to benthic opal concentrations which are higher than in any other ocean (Carmack 1977, DeMaster 1981, DeMaster et al. 1991, Mortlock et al. 1991, Pondaven et al. 1998).
The marginal ice Zone (MIZ) region of the southern ACC is marked by seasonal sea ice formation and melt. As sea ice has a low salinity, one paradigm is that spnng ice melt stabilises the water column, which, in conjunction with increasing light, stimulates the devel- opment of dense phytoplankton blooms in the upper stratified water column (Gran 1931, Sakshaug & Holm- Hansen 1984, Smith & Nelson 1986). While there is good evidence for this in many regions, it is not a uni- versal finding. Recently, Pollard et al. (1995) noted that in the Bellingshausen Sea, the frontal dynamics of the Southern Polar Front exerted a stronger influence on phytoplankton distnbution and productivity than did the retreating seasonal sea ice.
Many researchers have speculated on the factors responsible for causing differences in phytoplankton biomass and taxonomic distnbution within the South- ern Ocean. Light, temperature, trace nutrients, zoo- plankton grazing and physical mixing processes have all been commonly invoked over several decades as key factors governing phytoplankton biomass and pro- ductivity (e.g. Hart 1934, and reviews by Holm- Hansen et al. 1977, El-Sayed 1987, Bathmann et al. 1998). Rates of productivity and taxonomic groupings are also important determinants of biogeochemical processes within the Southern Ocean. Larger diatom blooms frequently charactenstic of frontal Systems are associated with a significant export flux of carbon and CO2 draw-down. The smaller flagellated algae domi- nate in areas of low biomass, and although they may occasionally form blooms, their role in the biogeo- chemical cycles of the Southern Ocean ecosystem is considered less important due to their low sedimenta- tion rates (Smetacek 1985, Michaels & Silver 1988). Different types of Southern Ocean phytoplankton
blooms in the Ross Sea are showing significant differ- ences in terms of carbon export (Arngo et al. 1999). However, in this paper we concentrate on the physio- logical responses of phytoplankton to their light envi- ronment as a means of explaining phytoplankton bio- mass and productivity within different zones of the Southern Ocean.
Phytoplankton photosynthetic rates respond to van- ations in the light regime by photoacclimational pro- cesses (Prezelin & Sweeney 1979, Falkowski & Owens 1980, Perry et al. 1981, Platt et al. 1982, Neori et al. 1984); 3 of these processes will be dealt with here: the absorption of light by phytoplankton, the characteris- tics of photosynthesis ac a function of irradiance (P vs E curves) and variations in pigment composition. This information is used both to explain the observed bio- mass and taxonomic distnbution Patterns and to calcu- late areal pnmary production rates.
In early austral sunlmer 1995/1996 we investigated phytoplankton distribution and photosynthetic charac- teristics in the Atlantic Sector of the Southern Ocean. Areal daily production rates were determined by using P vs E Parameters in consideration of the spectral reso- lution of the underwater light field and absorbance by phytaplankton. The results were related to zooplank- ton grazing, nutnent conditions and hydrography to provide insight into the factors which determine differ- ences in phytoplankton composition and pnmary pro- duction in this part of the Southern Ocean.
MATERIALS AND METHODS
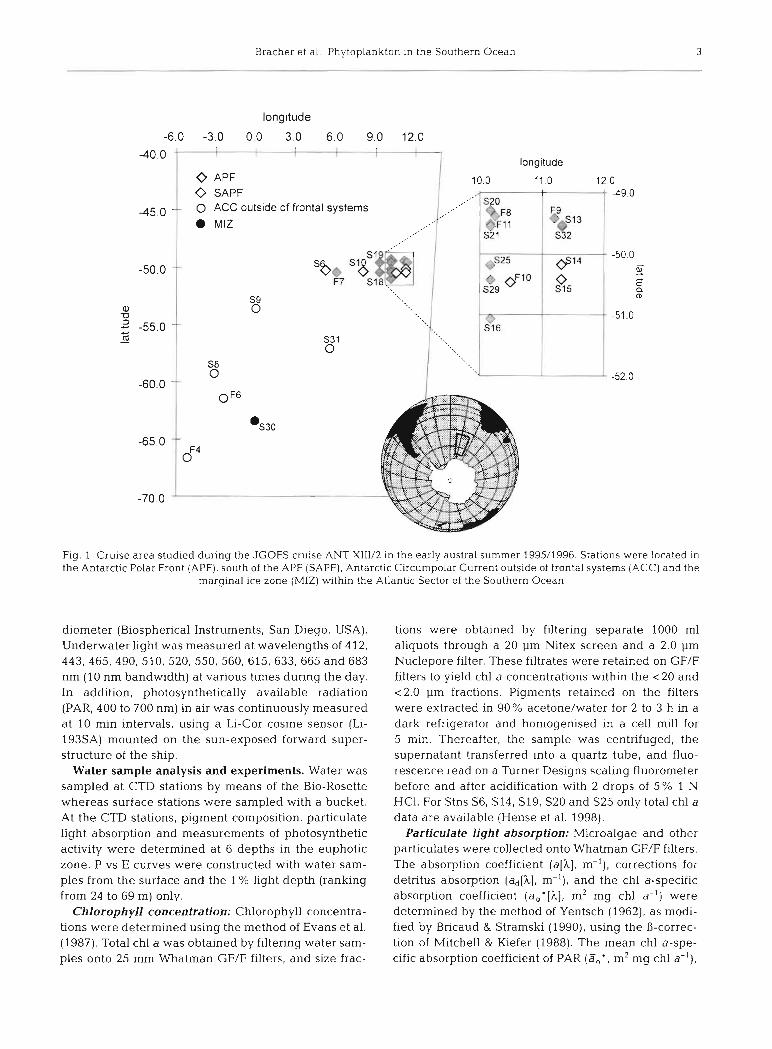
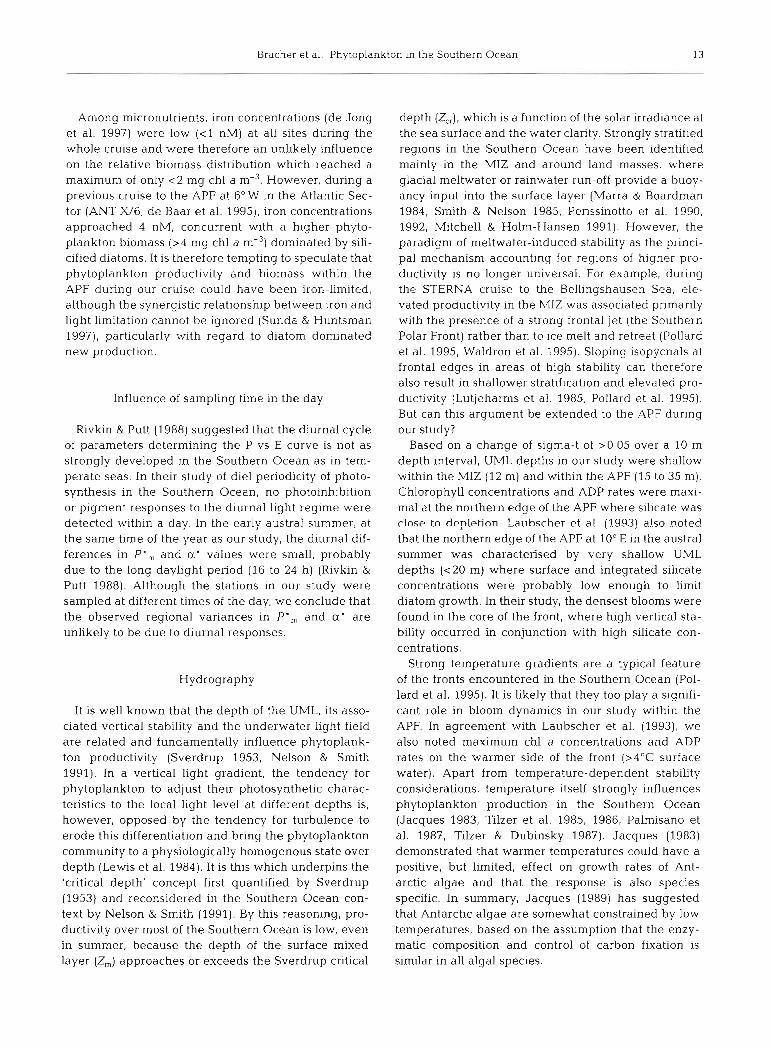
Work at sea. Data were coilected from 24 open- water stations in the region 49"-67'S, 6" W-12"E in the Atlantic Sector of the Southern Ocean during the JGOFS cruise ANT XIIV2 (December 1995 to January 1996) on RV 'Polarstern' (Fig. 1). Seventeen stations were sampled and profiled down to 120 m depth (S6, S8-S10, S13-S16, S18-S21, 525, S29-S32). At 7 sta- tions, only surface water was sarnpled (F4, F6-Fll) . Icebergs were Seen in the vicinity of Stns F4, F6, S8 and S31, and S30 was close to the ice edge.
Physical characteristics. The physical characteristics of the water column were determined with a CTD (NBIS Mark 111), connected to a General Oceanics Bio- Rosette water sampler with 24 X 12 1 bottles. The depth of the upper mixed layer (UML) was defined as a >0.05 change in sigma-t over a 10 m depth interval, deter- mined by evaluation of CTD profiles (Strass et al. 1997).
Radiation measurements. Vertical profiles of the downwelling spectral distnbution of the underwater light field were measured as described in Bracher & Tilzer (1998) using a MER-2040 underwater spectrora-
Bracher et al . . Phytoplankton in the Southern Ocean 3
longitude
-6.0 -3.0 0.0 3.0 6.0 9.0 12.0
-40.0 -L- 1 - -.- ' -T
I longitude 0 APF 1 10.0 11.0 12.0
1 0 SAPF 0 ACC outside of frontal sys tems
MIZ
-50.0 - -50.0 %.
E (1
I (D
Fig. 1. Cruise area studied dunng the JGOFS cruise ANT XIII/2 in the early austral sumrner 1995/1996. Stations were located in the Antarctic Polar Front (APF), south of the APF (SAPF), Antarctic Circumpolar Current outside of frontal systems (ACC) and the
marginal ice Zone (MIZ) within the Atlantic Sector of the Southern Ocean
diometer (Biospherical Instruments, San Diego, USA). Underwater light was measured at wavelengths of 412, 443,465,490,510, 520, 550, 560, 615, 633, 665 and 683 nm (10 nm bandwidth) at various times during the day. In addition, photosynthetically available radiation (PAR, 400 to 700 nm) in air was continuously measured at 10 min intervals, using a Li-Cor cosine Sensor (Li- 193SA) mounted on the sun-exposed forward super- structure of the ship.
Water sample analysis and experiments. Water was sampled at CTD stations by means of the Bio-Rosette whereas surface stations were sampled with a bucket. At the CTD stations, pigment composition, particulate light absorption and measurements of photosynthetic activity were determined at 6 depths in the euphotic Zone. P vs E curves were constructed with water sam- ples from the surface and the 1 % light depth (ranking from 24 to 69 m) only.
Chlorophyll concentration: Chlorophyll concentra- tions were determined using the method of Evans et al. (1987). Total chl a was obtained by filtering water sam- ples onto 25 mm Whatman GF/F filters, and size frac-
tions were obtained by filtenng separate 1000 11-11
aliquots through a 20 pm Nitex screen and a 2.0 pm Nuclepore filter. These filtrates were retained on GF/F filters to yield chl a concentrations within the <20 and ~ 2 . 0 pm fractions. Pigments retained on the filters were extracted in 90% acetone/water for 2 to 3 h in a dark refrigerator and homogenised in a cell mill for 5 min. Thereafter, the sample was centnfuged, the supernatant transferred into a quartz tube, and fluo- rescence read on a Turner Designs scaling fluorometer before and after acidification with 2 drops of 5% 1 N HC1. For Stns S6, S14, S19, S20 and S25 only total chl a data are available (Hense et al. 1998).
Particulate light absorption: Microalgae and other particulates were collected onto Whatman GF/F filters. n i e absorption coefficient (a[h] , m-'), corrections for detntus absorption (ad[h], m-I), and the chl a-specific absorption coefficient (aoW[k], m2 mg chl a-') were determined by the method of Yentsch (1962), as modi- fied by Bricaud & Stramski (1990), using the ß-correc- tion of Mitchell & Kiefer (1988). The mean chl a-spe- cific absorption coefficient of PAR (3,'. m2 mg chl a-I),
4 Mar Ecol Prog Ser 190: 1-16, 1999
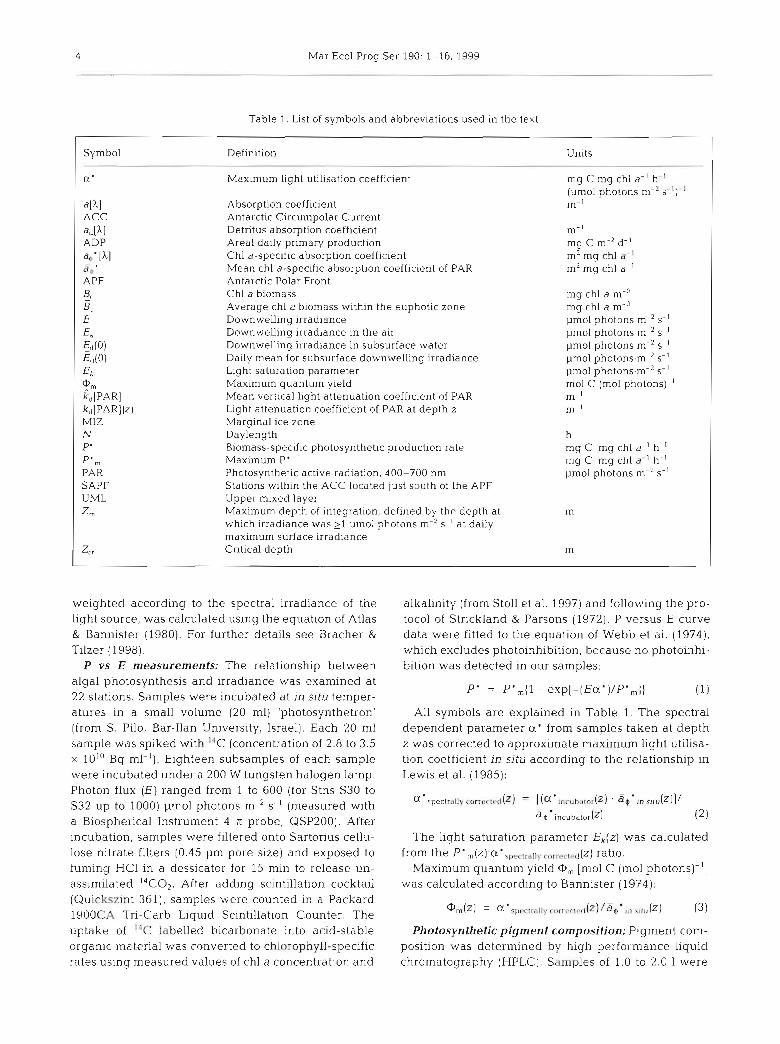
Table 1. List of symbols and abbreviations used in the text -
Symbol Definition Units
a' Maximum light utilisation coefficient mg C mg chl a-' h ' (pmol photons m-2 s 'J '
all~l Absorption coefficient rn- ACC Antarctic Circumpolar Current ad[xl Detritus absorption coefficient m- ' ADP Areal daily prirnary production mg C m-2 d-' ae'[hl Chl a-specific absorption coefficient m2 mg chl a ' so' Mean chl a-specific absorption coefficient of PAR rn2 mg chl a- ' APF Antarctic Polar Front
Chl a biomass mg chl a m-3 5, Average chl a biomass within the euphotic Zone mg chl a m-" E Downweiling irradiance pmol photons m-2 s- ' E, Downweiling irradiance in the air pmol photons m-2 s-' &(o) Downweiiing irradiance in subsurface \Vater pmol photons m-2 s-' Ed(O) Daily mean for subsurface downwelling irradiance pmol photons-m-'s-' Ek Light saturation parameter pmol photons-n1-' s-' d'"~ Maximum quantum yield mol C (mol photons)-' &[PAR] Mean vertical light attenuation coefficient of PAR 1n-I
kd[PARl(z) Light attenuation coefficient of PAR at depth z m- MIZ h4arginal ice Zone N Daylength h P' Biomass-specific photosynthetic production rate rng C. mg chl a-I h - ' P ' , Maximum P' rng C. mg chl a ' h- ' PAR Photosynthetic active radiation; 400-700 nm pmol photons m s- ' SAPF Stations within the ACC located just south of the APF UML Upper rnixed layer Zr" Maximum depth of integration. defined by thc depth at m
which irradiance was 21 pmol photons m-2 s ' a t daily maximum surface irradiance
ZC r Critical depth m
weighted according to the spectral irradiance of the light source, was calculated using the equation of Atlas & Bannister (1980). For further details See Bracher &
Tilzer (1998). P vs E rneasurernents: The relationship between
algal photosynthesis and irradiance was examined at 22 stations. Samples were incubated at in situ temper- atures in a small volume (20 ml) 'photosynthetron' (from S. Pilo, Bar-Ilan University, Israel). Each 20 ml sample was spiked with ''C (concentration of 2.8 to 3.5 X 10" Bq ml-I). Eighteen subsamples of each sample were incubated under a 200 W tungsten halogen lamp. Photon flux (E) ranged from 1 to 600 (for Stns S30 to S32 up to 1000) ~irnol photons m-2 s-' (rneasured with a Biospherical Instrument 4 rr probe, QSP200). After incubation, samples were filtered onto Sartorius cellu- lose nitrate filters (0.45 p n ~ Pore size) and exposed to fuming HC1 in a dessicator for 15 min to release un- assimilated I4CO2. After adding scintillation cocktail (Quickszint 361), samples were counted in a Packard 1900CX Tri-Carb Liquid Scintillation Counter. The uptake of ' 'C labelled bicarbonate into acid-stable organic material was converted to chlorophyll-specific rates using measured values of chl a concentration and
alkalinity (from Stoll et al. 1997) and follo~ring the pro- tocol of Strickland & Parsons (1972). P versus E curve data were fitted to the equation of Webb et al. (1974), which excludes photoinhibition, because no photoinhi- bition was detected in our samples:
P' = P m m ( l - exp[-(Ea')lP' ,]J (1)
All symbols are explained in Table 1. The spectral dependent parameter a ' from samples taken a t depth z was corrected to approximate maximum light utilisa- tion coefficient i n situ according to the relationship in Lewis et al. (1985):
Q ' speclriiliv corrcclerl(2) = [ ( U ' incubdlor(z) ' ab' in <i,u(z)]/ -
~ * i n c u b a l o r ( ~ ) (2)
The light saturation parameter E,(z) was calculated from the P',(z):a' „„„II~ ,,,„„„,.,dz) ratio.
Maximum quantum yield <t>„ [mol C (mol photons)-'j was calculated according to Bannister (1974):
Q>rn(z) = ' ~p l~r l r< i l iy r r i r r r . r l n d ( ~ ) / a O ' in h i , l i ( ~ ) (3)
Photosynthetic pigment composition: Pigment com- position was determined by high perfoi-mance liquid chromatography (HPLC). Samples of 1.0 to 2.0 1 were
Bracher et al.: Ph.ytoplankton in the Southern Ocean 5
filtered onto 25 mm Whatman GF/F filters to retain pigments. These were placed in Eppendorf tubes and immediately frozen in liquid nitrogen. The filters were then stored at -80°C for about 8 mo prior to pigment extraction in 90% acetone and subsequent HPLC analysis of the pigment extracts at the AWI, Bremer- haven, Germany. HPLC protocols followed those of Karsten & Garcia-Piche1 (1996) with some modifica- tions. After evaporation of the pigment extracts under a stream of nitrogen, they were redissolved in 100 p1 100% acetone. Pigments were separated using a Waters Associates HPLC system which includes a 600 MS gra- dient module with system controller and a Model 996 photodiode array detector. Samples (80 ~ 1 ) were in- jected into the HPLC column by an autosampler (717 plus). The column was a stainless-steel Merck LiChrospher RP 18 cartridge (5 pm packing; 12.5 mm X
4 mm inner diameter [i.d.]) behind a Merck RP 18 guard column (4 mm X 4 mm i.d.) filled with the Same material. Pigments were monitored a t 436 nm and sep- arated by a binary gradient system of helium-degased solvents. The mobile phase of solvent A (distilled water) and solvent B (acetonitiril-methanol-tetrahy- drofuran, 75:15:10, vol/vol) was regulated at a flow rate of 1.5 ml min-' using the following program: 0 to 15 min for a linear increase from 15% solvent A to 100% solvent B and 15 to 24 min for 100% solvent B.
The individual pigments were identified by their absorption at 436 nm in a mixture of solvent A and sol- vent B at the appropnate retention time. Their identifi- cation was evaluated against CO-chromatography with commercially available standards (The International Agency for 14C Determination, VKI, Denmark). Pig- ments were quantified by peak area with reference to response Signals obtained from the standards using the Waters 996 photodiode array detector and integrator. Additional confirmation for each pigment was done by using on-line diode array absorbance spectra between 300 and 700 nm.
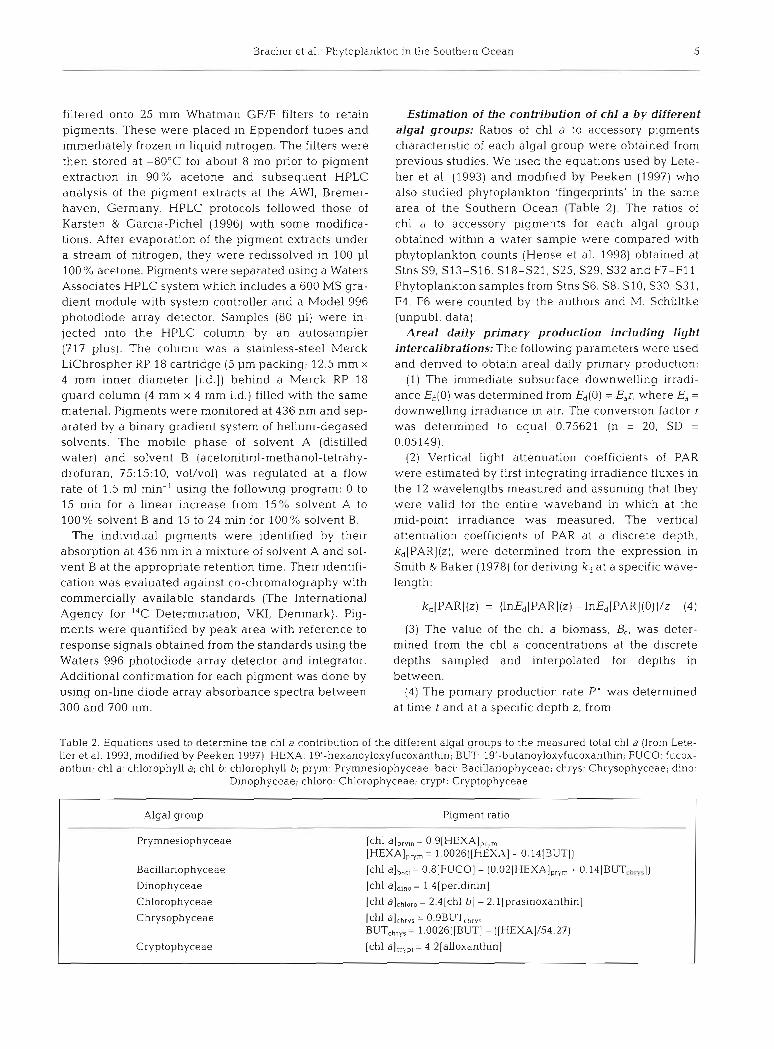
Estimation of the contribution of chl a by different algal groups: Ratios of chl a to accessory pigments charactenstic of each algal group were obtained from previous studies. We used the equations used by Lete- lier et al. (1993) and modified by Peeken (1997) who also studied phytoplankton 'fingerprints' in the Same area of the Southern Ocean (Tahle 2). The ratios of chl a to accessory pigments for each algal group obtained within a water sample were compared with phytoplankton Counts (Hense et al. 1998) obtained at Stns S9, S13-S16, S18-S21, S25, S29, C32 and F7-F11 Phytoplankton samples from Stns S6, S8, S10, S30, S31, F4, F6 were counted by the authors and M. Schültke (unpubl. data).
Areal daily primary production including light interca1ibrations:The following Parameters were used and derived to obtain areal daily primary production:
(1) The immediate subsurface downwelling irradi- ance Ed(0) was determined from Ed(0) = E,r, where E, =
downwelling irradiance in air. The conversion factor r was determined to equal 0.75621 (n = 20, SD =
0.05149). (2) Vertical light attenuation coefficients of PAR
were estimated by First integrating irradiance fluxes in the 12 wavelengths measured and assuming that they were valid for the entire waveband in which at the mid-point irradiance was measured. The vertical attenuation coefficients of PAR at a discrete depth, kd[PAR](z), were determined from the expression in Smith & Baker (1978) for deriving kd at a specific wave- length:
(3) The value of the chl a biomass, B„ was deter- mined from the chl a concentrations at the discrete depths sampled and interpolated for depths in between.
(4) The primary production rate P' was determined at time t and at a specific depth z, from
Table 2. Equations used to determine the chl a contribution of the different algal groups to the measured total chl a (from Lete- lier e t al. 1993, modified by Peeken 1997). HEXA: 19'-hexanoyloxyfucoxanthin; BUT. 19'-butanoyloxyfucoxanthin; FUCO: fucox- anthin; chl a: chlorophyll a; chl b: chlorophyll b; prym: Prymnesiophyceae; baci: Bacillanophyceae; chrys: Chrysophyceae; dino:
Dinophyceae; chloro: Chlorophyceae; crypt: Cryptophyceae
I Algal group Pigment ratio I Prymnesiophyceae
Bacillanophyceae
Dinophyceae
Chlorophyceae
Chrysophyceae
Cryptophyceae
[chl a]„„ = 1.4[peridinin]
[chl ajChl„, = 2.4[chl b] - 2.1 [prasinoxanthin]
Ich1 alchrys = O.gBUT, I„-
BUTCh„„ = 1.0026([BUT] - ([HEXA]/54.2?)
[chl a]„„, = 4.2[ailoxanthin]
6 Mar Ecol Prog Cer 190: 1-16, 1999
using the following equation:
(5) To denve the areal daily primary production, ADP (mg C m-2 d-I), we integrated over the depth and over the time of 1 d. The maximum depth of integration Z, is defined at the depth at which the irradiance was >1 pmol photons m-2 s-' at the maximum surface irra- diance during the day. Only values of Ed(t,O) 21 pmol photons m-2 s-' were used:
t = 24h z = Zm ADP = C C P ' (2, t ) (6)
t = O z = o
To compare our results with ADP rates obtained by other calculation methods, additional Parameters were determined. The daylength, N, was determined from the time at which immediate subsurface downwelling irradiance, Ed(0), was > 1 pmol photons m-2 s-'. These values were used to calculate the daily mean value of subsurface downwelling irradiance E(0).
We used a reformulated version of Sverdrup's cntical depth equation (Nelson & Smith 1991) to derive an estimate of the depth at which the vertically integrated
rates of photosynthesis and phytoplankton respiration were equal:
where Ed[PARJ(0)+ is the flux of PAR at the sea surface integrated over 24 h and the mean vertical attenuation coefficient of PAR, &[PAR], was determined from lin- ear regression analysis of the natural loganthms of PAR at 25 incremental depth points for each determi- nation. The value thus obtained was assumed to be representative for the centre of the depth range con- sidered. Correlations in these regression analyses were extremely high (>0.99).
RESULTS
Sampling sites and phytoplankton biomass
The cruise transect from 49" S to 67's comprised 3 different zones, according to the descnption by Treguer & Jacques (1992); viz. the Antarctic Polar Front (APF), the Antarctic Circumpolar Current out- side of frontal Systems (ACC) and the marginal ice Zone (MIZ). One station (S30) occurred in the MIZ and 13 stations (F?-F9, F11, S13, S16, S18-S21, S25, S29 and S32) occurred within the APF. Five stations (F10,
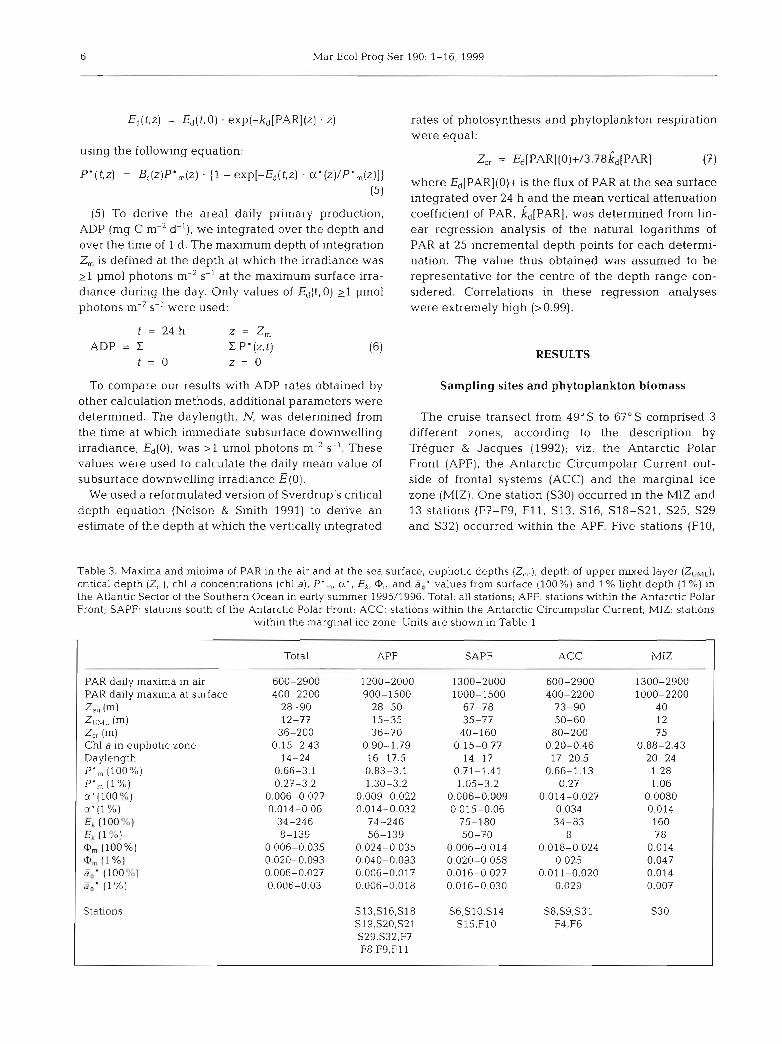
Table 3. Maxima and minima of PAR in the air and at the sea surface, euphotic depths (Z,.„), depth of upper rnixed layer (Zu„,), cntical depth (Zn), chl a concentrations (chl a). P',,,, a', E,, @, and a,' values from surface (100%) and 1 % light depth (1 96) in the Atlantic Sector of the Southern Ocean in early summer 1995/1996. Total: ail stations; APF: stations within the Antarctic Polar Front; SAPF: stations south of the Antarctic Polar Front; ACC: stations within the Antarctic Circumpolar Current; MIZ: stations
within the marginal ice Zone. Units are shown in Table 1
PAR daily maxima in air PAR daily maxima at surface ze" (m) ZLML (m) zu (m) Chl a in euphotic Zone Daylength P * , (100%) P ' , (1 %) a'(lOO%) rx* (1 %) E, (1 00 U/'>)
Ek (1 ?/C) 0, (100%) @,,, (1 Yo) ä*. (lOOY>) a; (1%)
Stations
Total APF
600-2900 1200-2000 400-2200 900-1500
28-90 28-50 12-77 15-35
36-200 36-70 0.15-2.43 0.90-1.79
14-24 16-17.5 0.66-3.1 0.83-3.1 0.27-3.2 1.30-3.2
0.006-0.027 0.009-0.022 0.014-0.06 0.014-0.032
34-246 74-246 8-139 56-139
0.006-0.035 0.024-0.035 0.020-0.093 0.040-0.093 0.006-0.027 0.006-0.017 0.006-0.03 0.006-0.018
SAPF
1300-2000 1000-1500
67-78 35-77
40-160 0.15-0 77
14-17 0.71-1.41 1.05-3.2
0.006-0.009 0.015-0.06
75-180 50-70
0 006-0.014 0.020-0.058 0.016-0.027 0.016-0.030
ACC
600-2900 400-2200
73-90 50-60 80-200
0.20-0.46 17-20.5
0.66-1.13 0.27
0.014-0.027 0.034 34-83
8 0.018-0.024
0.025 0.011-0.020
0.029
Bracher et al.: Phytoplankton in the Southern Ocean 7
S6, S10, S14, S15) within the ACC were located just south of the APF (termed SAPF) between 50.2"s and 51.1"s. The remaining 5 stations (F4, F6, S8, S9, S31) were located further south (> 53.5" S) within the ACC (Fig. 1).
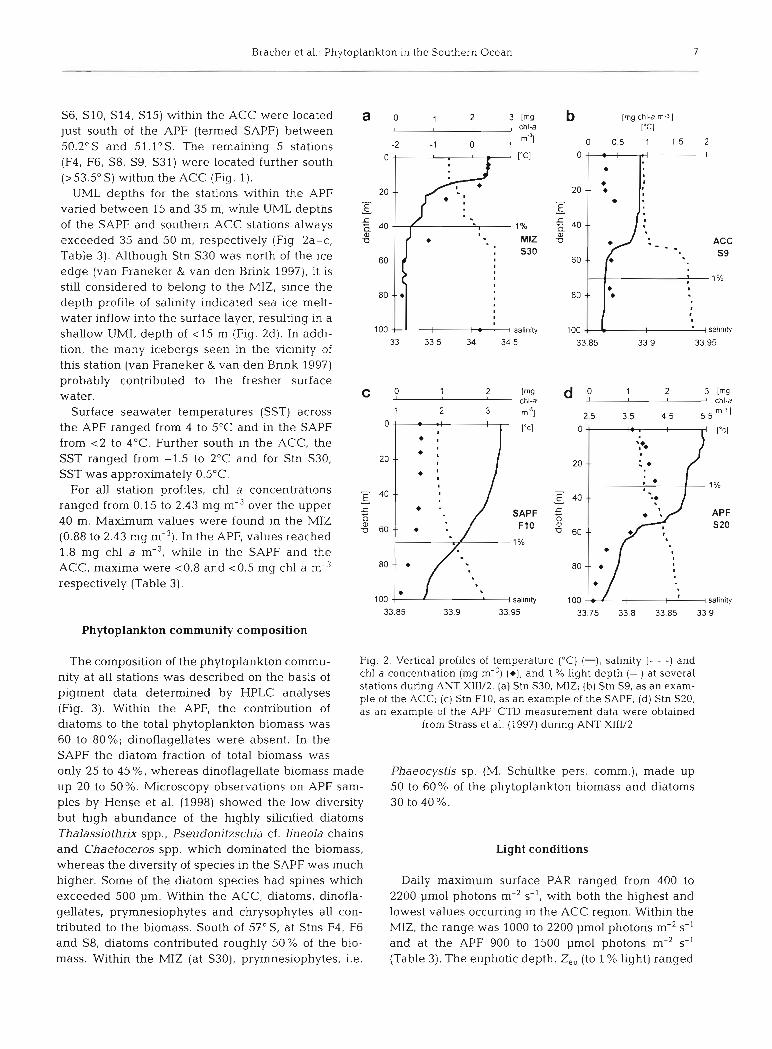
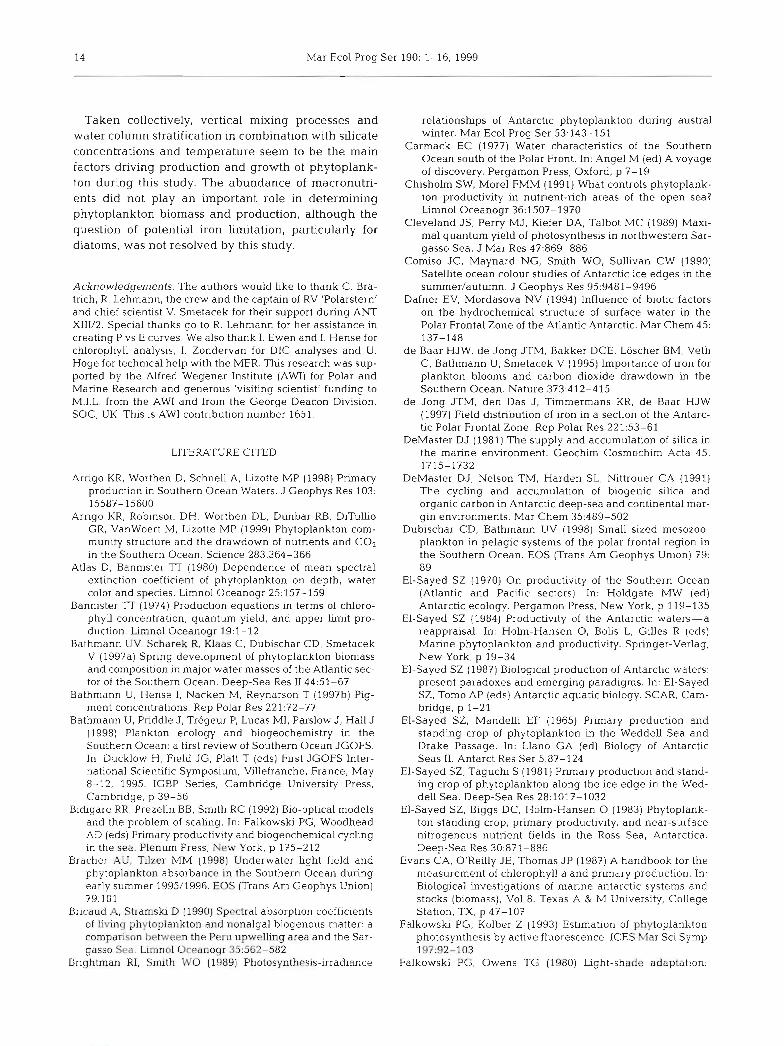
UML depths for the stations within the APF varied between 15 and 35 m, while UML depths of the SAPF and southern ACC stations always exceeded 35 and 50 m, respectively (Fig 2a-C, Table 3) . Although Stn S30 was north of the ice edge (van Franeker & van den Bnnk 1997), it is stiil considered to belong to the MIZ, since the depth profile of salinity indicated sea ice melt- water inflow into the surface layer, resulting in a shallow UML depth of <15 m (Fig. 2d). In addi- tion, the many icebergs Seen in the vicinity of this station (van Franeker & van den Bnnk 1997) probably contnbuted to the fresher surface water.
Surface seawater temperatures (SST) across the APF ranged from 4 to 5°C and in the SAPF from <2 to 4OC. Further south in the ACC, the SST ranged from -1.5 to 2°C and for Stn S30, SST was approximately 0.5"C.
For all station profiles, chl a concentrations ranged from 0.15 to 2.43 mg m-3 over the upper 40 m. Maximum values were found in the MIZ (0.88 to 2.43 mg m-3). In the APF, values reached 1.8 mg chl a m-3, while in the SAPF and the ACC, maxima were ~ 0 . 8 and ~ 0 . 5 mg chl a m-3 respectively (Table 3).
a o 1 2 3 img b [mg C ~ I - a m.11 , chld ["Cl
-2 - 1 0 "'7 0 0.5 1 1 5 2
['Cl
1%
M IZ S30
salinity
U I '- / SAPF a a> - F10
d ,o 1 2 3 ["L! I chl-a
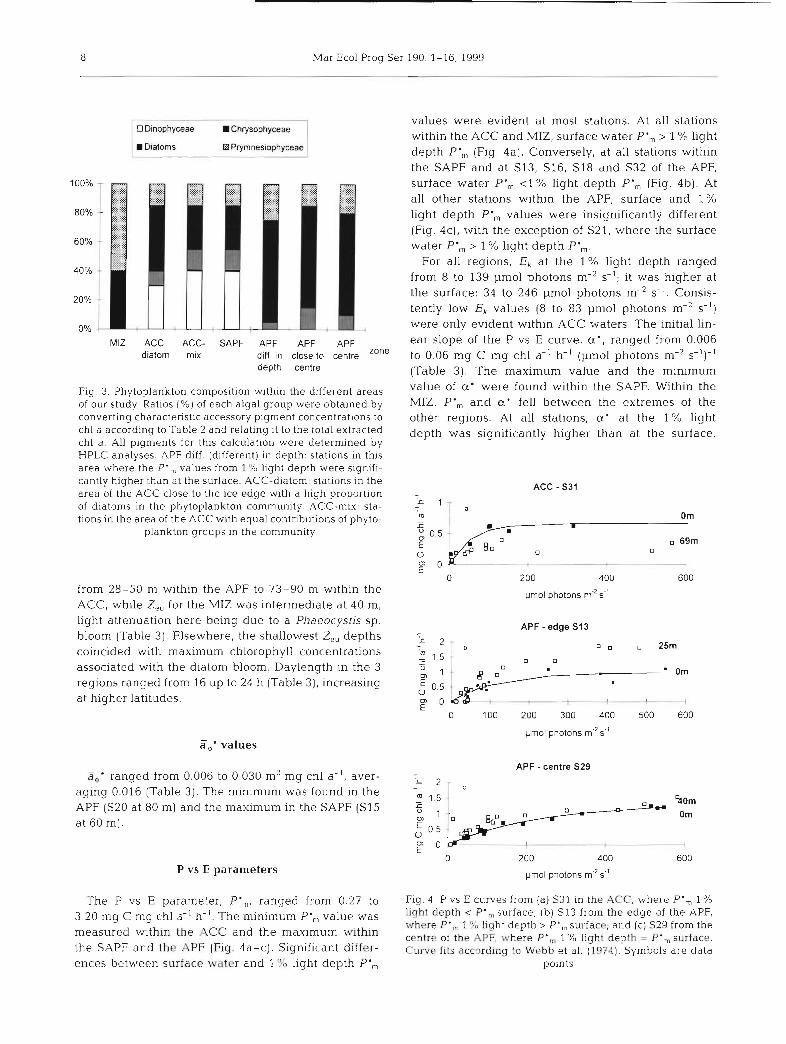
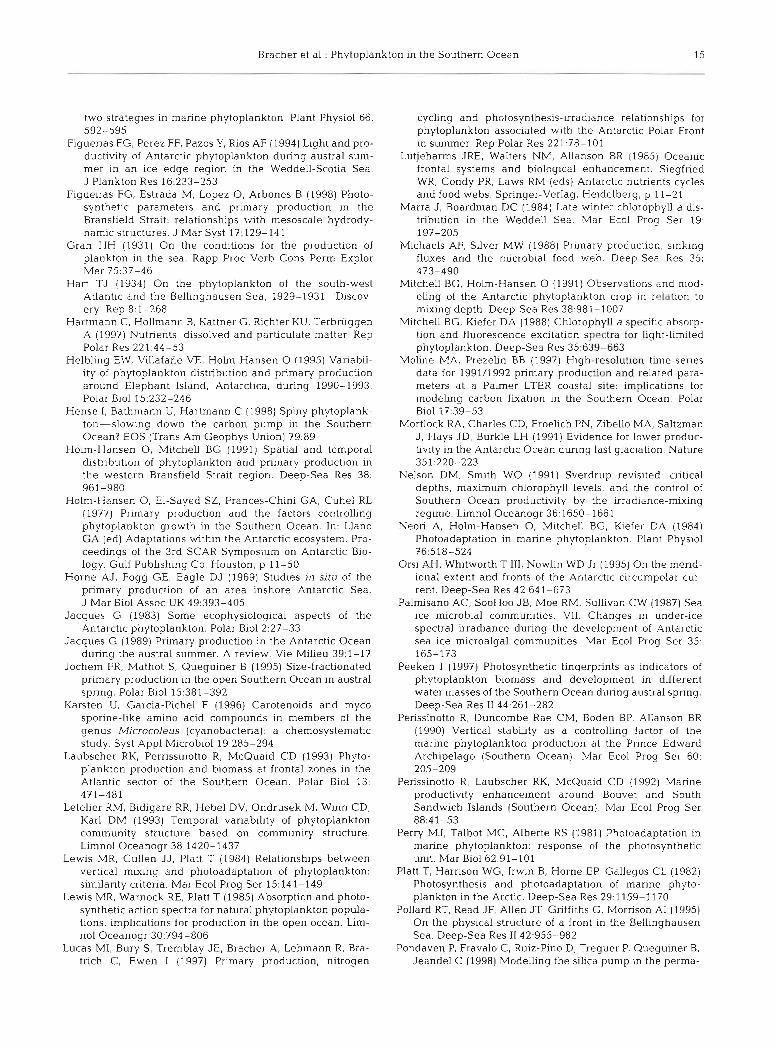
Phytoplankton community composition
The composition of the phytoplankton commu- Fig. 2. Vertical profiles of temperature ("C) (-), salinity (- - -) and
nity at all was described the basis of chl a concentration (mg m-3) (*), and 1 % light depth (-) at several stations during ANT X111/2. (a) Stn S30, MlZ; (b) Stn S9, as an exam-
pigment data determined by ple of the ACC; (C) Stn F10. as an example of the SAPF; (d) Stn S20, (Fig. 3). Within the APFl the contnbution of as an example of the APF. CTD rneasurernent data were obtained diatoms to the total phytoplankton biomass was from Strass et al. (1997) during ANT X111/2
60 to 80%; dinoflagellates were absent. In the SAPF the diatom fraction of total biomass was only 25 to 45%, whereas dinoflagellate biomass made Phaeocystis sp. (M. Schültke pers. comm.), made up up 20 to 50%. Microscopy observations on APF Sam- 50 to 60% of the phytoplankton biomass and diatoms ples by Hense et al. (1998) showed the low diversity 30 to 40%. but high abundance of the highly silicified diatoms Thalassiothrix spp., Pseudonitzschia cf. lineola chains and Chaetoceros spp. which dominated the biomass, Light conditions whereas the diversity of species in the SAPF was much higher. Some of the diatom species had spines which Daily maximum surface PAR ranged from 400 to exceeded 500 Pm. Within the ACC, diatoms, dinofla- 2200 pmol photons m-2 s-I, with both the highest and gellates. prymnesiophytes and chrysophytes all con- lowest values occurnng in the ACC region. Within the tnbuted to the biomass. South of 57" S, at Stns F4, F6 MIZ, the range was 1000 to 2200 pmol photons m-2 s-' and S8, diatoms contributed roughly 50% of the bio- and at the APF 900 to 1500 pmol photons m-2 s-' mass. Within the MIZ (at S30), prymnesiophytes, i.e. (Table 3). The euphotic depth, Z„ (to 1 % light) ranged
3 Mar Ecol Prog Ser 190: 1-16, 1999
MI2 ACC- ACC- SAPF APF APF APF diatom mix diff. in close to centre 'One
depth centre
Fig. 3. Phytoplankton composition within the different areas of our study. Ratios (%) of each algal group were obtained by converting charactenstic accessory pigment concentrations to chl a according to Table 2 and relating it to the total extracted chl a . AU pigments for this calculation were determined by HPLC analyses. APF diff. (different) in depth: stations in this area where the P', values from 1 e/u light depth were signifi- cantly higher thdn at the surface. ACC-diatom: stations in the area of the ACC close to the ice edge ~ 4 t h a high proportion of diatoms in the phytoplankton community. ACC-mix: sta- tions in the area of the ACC with equal contributions of phyto-
plankton groups in the community
from 28-50 n~ within the APF to 73-90 m within the ACC, while Z„ for the MIZ was intermediate at 40 m, light attenuation here being due to a Phaeocystis sp. bloom (Table 3). Elsewhere, the shallowest Z„ depths coincided with maximum chlorophyll concentrations associated with the diatoni bloom. Daylength in the 3 regions ranged from 16 up to 24 h (Table 3), increasing at higher latitudes.
a ,' values
2,' ranged from 0.006 to 0.030 ni2 mg chl a- I , aver- aging 0.016 (Table 3). The minimum was found in the APF (S20 at 80 m) and the maximum in the SAPF (SI5 at 60 m) .
P vs E paranieters
values were evident at most stations. At all stations within the ACC and MIZ, surface water P', > 1 % light depth P', (Fig. 4a). Conversely, at all stations within the SAPF and at S13, S16, S I8 and S32 of the APF, surface water P', <1% light depth P', (Fig. 4b). At all other stations within the APF, surface and 1 % light depth P', values were insignificantly different (Fig. 4c), with the exception of S21, where the surface water P', > 1 % light depth P',.
For all regions, Ek at the 1 % light depth ranged from 8 to 139 pmol photons m-2 s-'; it was higher at the surface: 34 to 246 pmol photons m-2 s-I. Consis- tently low Ek values (8 to 83 pmol photons m-2 s-') were only evident within ACC waters. The initial lin- ear slope of the P vs E curve, a', ranged from 0.006 to 0.06 mg C mg chl a-' h-' (pmol photons m-* s-')-I (Table 3). The maximum value and the miniinum value of a' were found within the SAPF. Within the MIZ, P', and cr' fell between the extremes of the other regions. At all stations, cc' at the 1% light depth was significantly higher than at the surface.
ACC - S31
C
0 200 400 600
pmol photons m-* s-'
APF - edge S i 3
L
0 100 200 300 400 500 600
prnol photons rn'2 s"
APF - centre S29
L
0 200 400 600
prnol photons rnZs"
The P vs E Parameter, P',,,, ranged from 0.27 to Fig. 4. P vs E curves from (a) S31 in the ACC, where P', 1 O/o
3.20 mg C mg chl a - ~ h-I, P-„ T,7as light depth P ' , surface; (b) SI3 from the edge of the APF, where P ' , 1 % light depth > P ' „ surface; and (C) S29 from the
ineasured within the ACC and the maximum within centre of the APE where P., % light depth = P., surface, the SAPF arid the APF (Fig. 4a-C). Significant differ- C w e fits accordinq to Webb et al. (19741. Symbols are data ences between surface water and 1 % light depth P',
Bracher et al.: Phytoplankton in the Southern Ocean 9
[mg C m-' d-'1
1000 ;
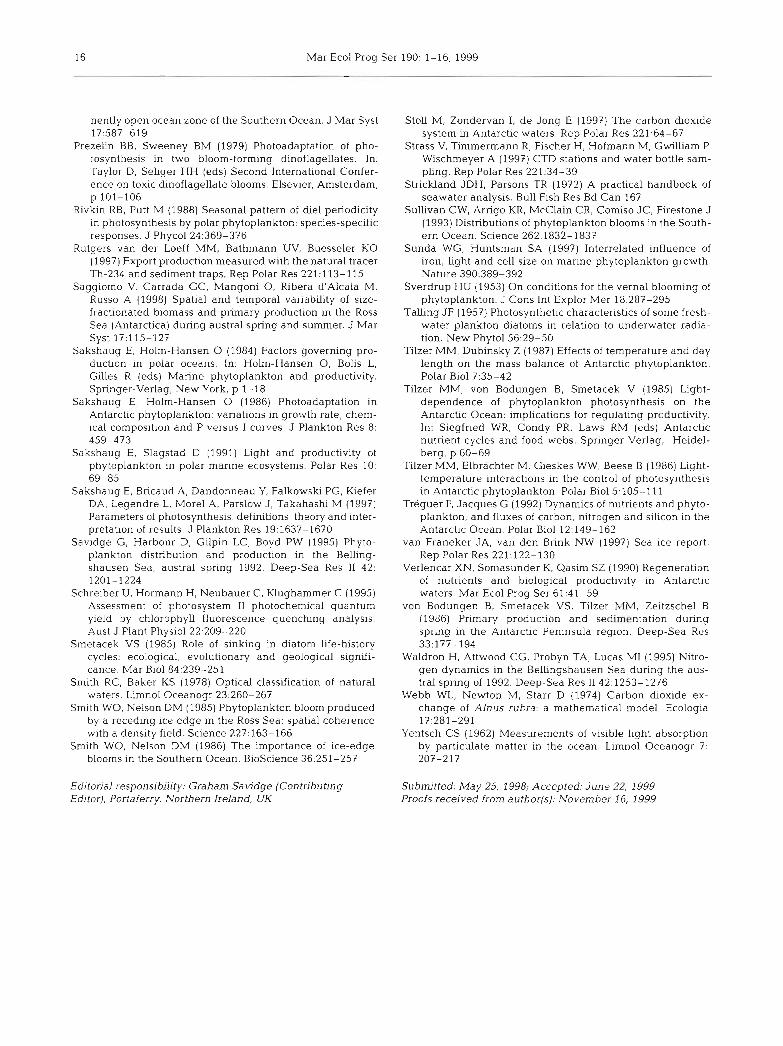
S30 F6 CS S9 S31 S l 4 S 1 5 F10 S6 S I 6 F8 S I 3 S 3 2 S 1 8 F7 S29S19 F9 F11 S2OS21 SZ5 station MlZl ACC I SAPF I APF diff in depth I APF close to I APF centre zone
centre
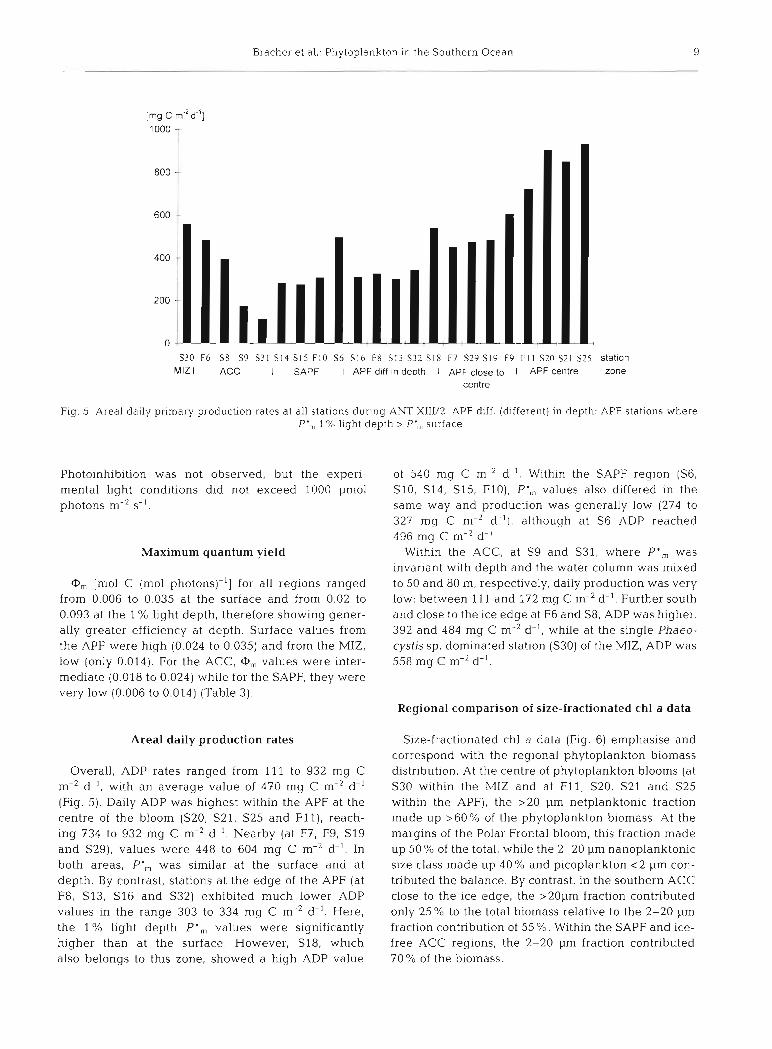
Fig. 5. Areal daily primary production rates at all stations during ANT XIII/2. APF diff. (different) in depth: APF stations where P', 1 % light depth > P', surface
Photoinhibition was not observed, but the experi- mental light conditions did not exceed 1000 pmol photons m-2 s-I.
Maximum quantum yield
@, [mol C (mol photons)-I] for all regions ranged from 0.006 to 0.035 at the surface and from 0.02 to 0.093 at the 1 % light depth, therefore showing gener- ally greater efficiency at depth. Surface values from the APF were high (0.024 to 0.035) and from the MIZ, low (only 0.014). For the ACC, Q, values were inter- mediate (0.018 to 0.024) while for the SAPF, they were very low (0.006 to 0.014) (Table 3).
Areal daily production rates
Overall, ADP rates ranged from 111 to 932 mg C me2 d-I. with an average value of 470 mg C m-2 d-' (Fig. 5). Daily ADP was highest within the APF at the centre of the bloom (S20, S21, S25 and F l t ) , reach- ing 734 to 932 mg C m-* d-I. Nearby (at F7, F9, SI9 and S29), values were 448 to 604 Ing C m-2 d-I. In both areas, P', was similar at the surface and at depth. By contrast, stations a t the edge of the APF (at F8, S13, S I 6 and S32) exhibited much lotver ADP values in the range 303 to 334 mg C m-2 d-'. Here, the 1 % light depth P',,, values were significantly higher than at the surface. However, S18, which also belongs to this zone, showed a high ADP value
of 540 mg C m-2 d-I. Within the SAPF region (S6, S10, S14, S15, FlO), P',,, values also differed in the same way and production was generally low (274 to 327 mq C m-2 d-'I, although at S6 ADP reached 496 mg C m-2 d-'
Within the ACC, at S9 and S31, where P ' „ was invariant with depth and the water column was mixed to 50 and 80 m, respectively, daily production was very low: between 111 and 172 mg C m-2 d-'. Further south and close to the ice edge at F6 and S8, ADP was higher, 392 and 484 mg C rn-' d- ' , while at the single Phaeo- cystis sp. dominated station (S30) of the MIZ, ADP was 558 mg C m-2 d-'.
Regional comparison of size-fractionated chl a data
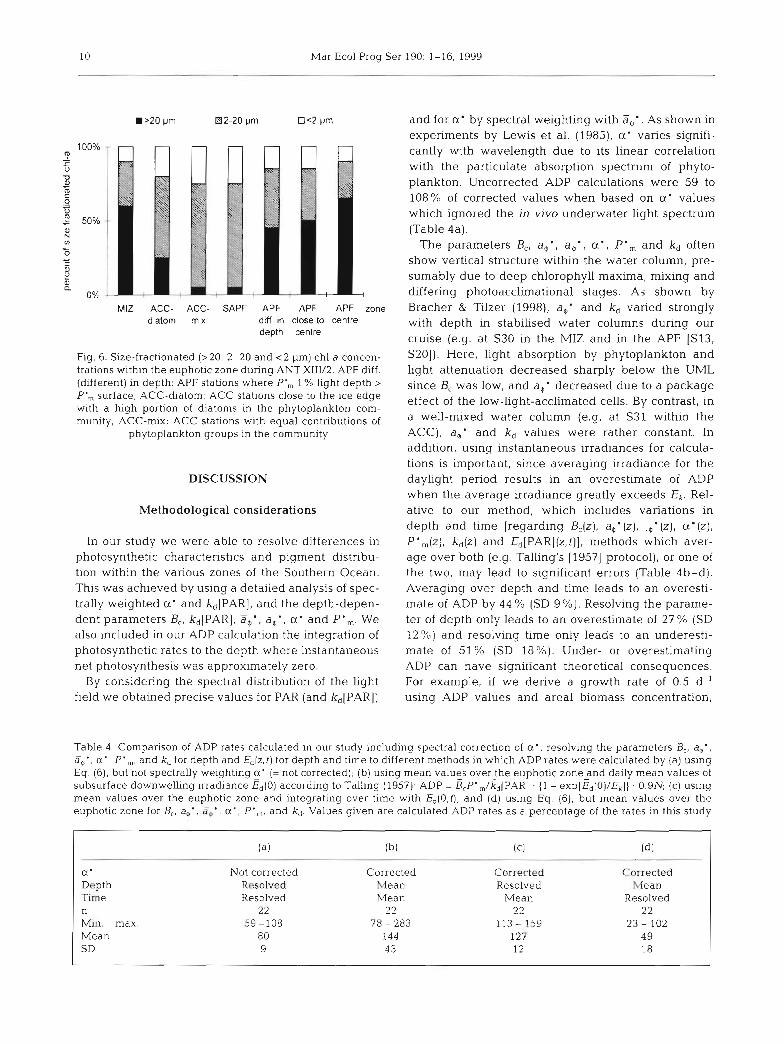
Size-fractionated chl a data (Fig. 6) emphasise and correspond with the regional phytoplankton biomass distribution. At the centre of phytoplankton blooms (at S30 within the MIZ and at F11, S20, S21 and S25 within the APF), the >20 pm netplanktonic fraction made up >60% of the phytoplankton biomass. At the margins of the Polar Frontal bloom, this fraction made up 50 % of the total, while the 2-20 pm nanoplanktonic size class made up 40 % and picoplankton <2 pm con- tributed the balance. By contrast, in the southern ACC close to the ice edge, the >20pm fraction contributed only 25% to the total biomass relative to the 2-20 pm fraction contnbution of 55 %. Within the SAPF and ice- free ACC regions, the 2-20 Pm fraction contributed 70% of the biomass.
10 Mar Ecol Prog Ser 190: 1-16, 1999
MI2 ACC- ACC- SAPF APF APF APF zone diatom mir diff. in close 10 centre
depth cenlre
Fig. 6. Size-fractionated (>20, 2-20 and < 2 pm) chl a concen- trations within the euphotic Zone dunng ANT XIII/2. APF diff. (different) in depth: APF stations where P', 1 % light depth > P', surface; ACC-diatom: ACC stations close to the ice edge with a high portion of diatoms in the phytoplankton com- munity. ACC-mut: ACC stations with equal contributions of
phytoplankton groups in the community
DISCUSSION
Methodological considerations
In our study we were able to resolve differences in photosynthetic characteristics and pigment distribu- tion within the vanous zones of the Southern Ocean. This was achieved by using a detailed analysis of spec- trally weighted a' and kd[PAR], and the depth-depen- dent parameters B,, kd[PAR], ä,' , a,' , a' and P',. We also included in our ADP calculation the integration of photosynthetic rates to the depth where instantaneous net photosynthesis was approximately Zero.
By considering the spectral distribution of the light field we obtained precise values for PAR (and kd[PAR])
and for a* by spectral weighting with 3,'. As shown in expenments by Lewis et al. (1985), a' vanes signifi- cantly with wavelength due to its linear correlation with the particulate absorption spectrum of phyto- plankton. Uncorrected ADP calculations were 59 to 108% of corrected values when based on a' values which ignored the in viv0 underwater light spectrum (Table 4a).
The parameters B„ a,', ä+', a ' , P', and kd often show vertical structure within the water column, pre- sumably due to deep chlorophyll maxima, mixing and differing photoacclimational Stages. As shown by Bracher & Tilzer (1998), a,' and kd varied strongly with depth in stabilised water columns during our cruise (e.g. at S30 in the MIZ and in the APF IS13, S201). Here, light absorption by phytoplankton and light attenuation decreased sharply below the UML since B, was low, and a,' decreased due to a package effect of the low-light-acclimated cells. By contrast, in a well-mixed water column (e.g. at S31 within the ACC), a,' and kd values were rather constant. In addition, using instantaneous irradiances for calcula- tions is important, since averaging irradiance for the daylight penod results in an overestimate of ADP when the average irradiance greatly exceeds Ek. Rel- ative to our method, which includes vanations in depth and time [regarding B,(z), ao' (z) , ,$' (z), a' (z), P',(z), kd(z) and E,IPAR](z,t)], methods which aver- age over both (e.g. Talling's 119571 protocol), or one of the two, may lead to significant errors (Table 4b-d). Averaging over depth and time leads to an overesti- mate of ADP by 44 % (SD 9 %). Resolving the parame- ter of depth only leads to an overestimate of 27 % (SD 12 %) and resolving time only leads to an underesti- mate of 51 % (SD 18%). Under- or overestimating ADP can have significant theoretical consequences. For example, if we denve a growth rate of 0.5 d-' using ADP values and areal biomass concentration,
Table 4. Comparison of ADP rates calculated in our study including spectral correction of a', resolving the parameters B,. a,', ä,', a'. P',,,, and kd for depth and E,(z,t) for depth and time to different methods in which ADP rates were calculated by (a) using E q . ( 6 ) , but not spectrally weighting g' (= not corrected); (b) using mean valugs overthe euphotic Zone and daily mean values of subsurface downwehng irradiance Ed(0) according to Talling (1957): ADP = B,P',/kd[PAR] . (1 - ~ x ~ [ E ~ ( o ) / E ~ ] ] . O.9N; (C) using mean values over the euphotic Zone and integrating over time with Ed(O,t); and (d) using Eq. (6), but mean values over the euphotic zone for B„ ao'. So', a' , P ' „ and kd. Values given are calculated ADP rates as a percentage of the rates in this study
a' Depth Time n Min. - max Mean SD
Not corrected Resolved Resolved
22 59 -108
80 9
Corrected Mean Mean
22 78 - 283
144 4 3
Corrected Corrected Resolved Mean
Mean Resolved 2 2 22
113 - 159 23 - 102 127 49 12 18
Bracher et al.. Phytoplank :ton in the Southern Ocean 11
then an overestimate of daily production by 20% can lead to an error of 270% in biomass after 10 d.
The problems associated with the estimation of pn- mary production based on P vs E curves have been weil documented by Sakshaug et al. (1997). In the near future, some of these problems may be resolved by new techniques, such as the fast-repetition-rate fluo- rometer (FRRF), or the pulse-amplitude-modulated flu- orometer (PAM) (Falkowski & Kolber 1993, Schreiber et al. 1995). When these techniques, which are fast and non-destructive, are proven to provide robust and direct in situ measures of P vs E parameters, productiv- ity and physiological responses to light and nutnent regimes over time and space scales hitherto unknown will become available.
Phytoplankton physiology, biomass and composition in the Southern Ocean
We encountered significant phytoplankton blooms only at the APF and withm the MIZ. The >20 pm size class dominated the biomass at both bloom sites, but while at the bloom within the APF diatoms dominated the algal community, contnbuting to high ADP and P', values (>730 mg C m-2 d-' and > 2 mg C mg chl a-' h-'. respectively): Phaeocystis sp. dominated within the MIZ bloom and ADP and P', values were lower (558 mg C m-2 d-' and <1.3 mg C mg chl a-' h-', respectively). The large, spiny diatoms dominating the bloom at the APF were slow growing, exhbiting a high uptake rate of silicate over a long period. but were nev- ertheless buoyant (Hense et al. 1998). Export produc- tion was therefore low (<I00 mg C m-2 d-'; Rutgers van der Loeff et al. 1997) and the P0C:PON (particulate organic carbon to nitrogen) ratio (<6.5:1) and phaeo- phytin:chl a ratio (<0.22 at the upper 50 m) indicate that these phytoplankton were in a healthy phase (Hense et al. 1998). By contrast, the MIZ Phaeocystis sp. bloom exhibited a P0C:PON ratio of >20:1 at 90 m depth and an increase in the phaeophytin:chl a ratio to >0.4:1 at 40 m (Bathmann et al. 1997b). Apart from taxon-specific differences, these ratios are indicative of an aged phytoplankton bloom. In Support of this, Q>, for the MIZ Phaeocystis sp. bloom was low, which Cleveland et al. (1989) interpret as being indicative of a terminal phase. The APF bloom, by contrast. was charactensed by a high @, value [close to the theoret- ical maximum of 0.094 mol C (mol photons)-' at S20] indicative of an actively growing population.
The ADP rates of phytoplankton at Stns SI8 and S6 are of special interest since, despite a relatively low biomass (<0.9 and ~ 0 . 6 mg chl a m-3 within the euphotic zone, respectively), the ADP rates were sirni- lar to those exhibited by a higher biomass (>1.5 mg
chl a m-3) close to the centre of the APF (Fig. 5). Stn 18 was charactensed by an unusually high density of coc- colithophond prymnesiophytes (>30%) while at Stn S6, both dinoflagellates and coccolithophonds (20 to 25 % each) contnbuted to the phytoplankton composi- tion (M. Schültke pers. cornm.). We attribute the low biomass of phytoplankton at these 2 stations to the strong grazing pressure exerted by high concentra- tions of cyclopoid copepods which removed 80 % d-' of the phytoplankton standing stock, mainly dinoflagel- lates and coccolithophonds (Dubischar & Bathman 1998).
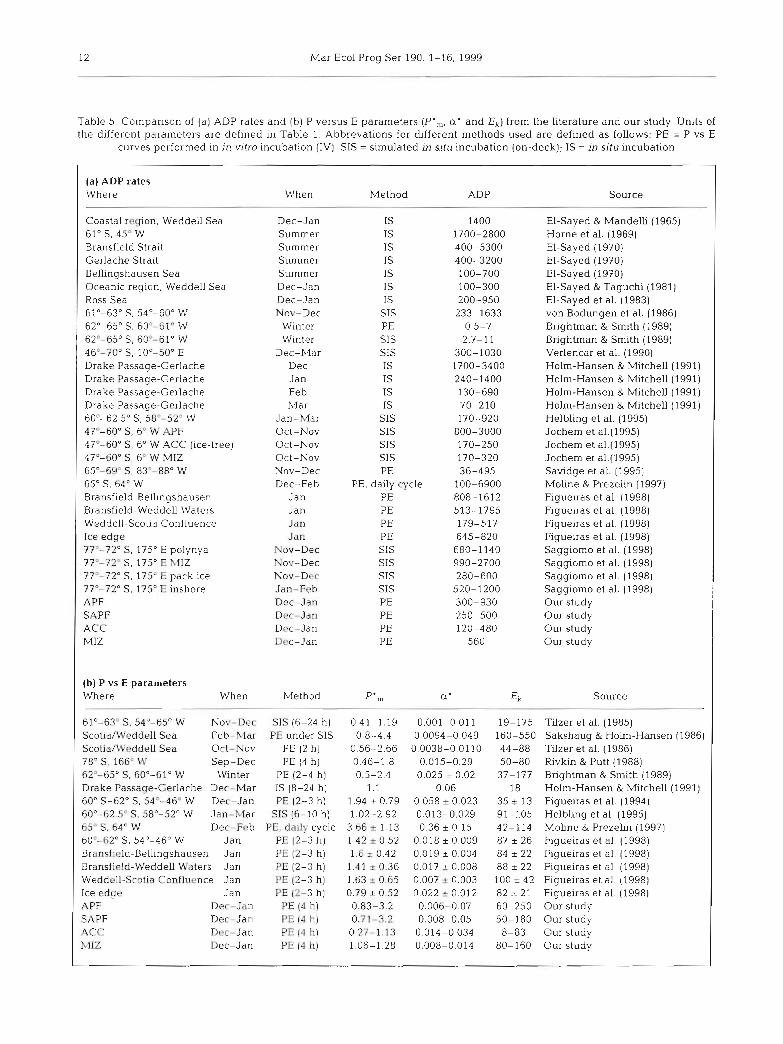
In general, the values of the parameters character- ising the P vs E curve and the ADP rates measured in our study are in the range of values measured in other primary production studies performed with phytoplankton of the Southern Ocean (Table 5). The differences between values can be caused either by differences in phytoplankton physiology and biomass influenced by species composition, photoacclirnation, time of sampling, and differences in abiotic factors at the vanous sites or by differences in methods used for obtaining such data (especiaiiy regarding the light field dunng incubation, the incubation time and the calculation of ADP from P vs E data, as pointed out above).
Abiotic controls of phytoplankton distribution, biomass and productivity
Nutrients
Overail, macronutrient concentrations exceeded the requirements for phytoplankton growth (Hartrnann et al. 1997, Hense et al. 1998), as is generaiiy the case in the Southern Ocean. Among nutrients, surface silicate concentrations varied the most, with concentrations ranging from 80 pM at 68" S to 0.41 pM at the northern edge of the APF, where Si could well have been limit- ing (Pondaven et al. 1998). By contrast, surface nitrate and phosphate concentrations were largely invanate (> 18 and > 1.3 PM, respectively) throughout the whole sampling area. This observation means that the sur- face Si:N03 ratio shifts, south to north, from 4.4:l to 0.023:1, implying not only potential Si limitation, but uncoupled recycling rates for the 2 nutrients, where Si is exported out of the euphotic Zone but NO3 is not or is at least in balance with inputs. Measured low f-ratios (<0.4) throughout the region confirrn that the utilisa- tion and export of NO3 as PON is indeed low and accounts, in part, for the sustained meridional NO3 concentrations (Lucas et al. 1997) which must never- theless also be maintained by the upwelling of NO3 nch water.
12 Mar Ecol Prog Ser 190: 1-16, 1999
Table 5 . Cornparison of (a) ADP rates and (b) P versus E Parameters (P'„ a' and E,) from the literature and our study. Units of the different pararneters a r e defined in Table 1. Abbrevations for different methods used a re defined a s follows: PE = P vs E
curves performed in in vitro incubation (IV); SIS = simulated in situ incubation (on-deck); IS = in situ incubation
(a) ADP rates Where
Coastal region, Weddell Sea 61" S, 45O W Bransfield Strait Gerlache Strait Bellingshausen Sea Oceanic region, Weddell Sea Ross Sea 61'-63" S, 54'-60" W 62"-65" S, 60"-61" W 62'-65" C, 60"-61" W 46'-70" S. 10'-50" E Drake Passage-Gerlache Drake Passage-Gerlache Drake Passage-Gerlache Drake Passage-Gerlache 60'-62 5" C, 58"-52" W 47'-60" S, 6- W APF 47"-60" S. 6' W ACC (ice-fi-ee) 47'-60" S. 6' W MIZ 65"-69" S, 83"- 88" W 65" S, 64" W Bransfield-Bellingshausen Bransfield-Weddell Waters Weddell-Scotia Confluence Ice edge 77'-72" C. 175" E polynya 77'-72" S. 175" E hlIZ 77"-72" S, 175" E pack ice 77'-72" S, 175' E inshore APF SAPF ACC MI2
(b) P vs E parameters Where When
When Method ADP Source
61'-63" Sr 54'-65" W Nov-Dec Scotia/Weddell Sea Feb-Mdr Scotia/Wrddell Sea Oct-No\( 78" C, 166' W Sep-Dec 62"-65" 5 , 60"-61" W Winter Drake Passaqe-C~rlache Dec- Mar 60' S-62" S, 54"-46" W Des-Jan 60'-62 5' S, 58"-52" W Jan- 3lar 65" Sr 64" W D e c - F P ~ 60'-62" C , 54'-46' M1 Jan Bransfi~id-Bellingshausen Jan Bransfi~ld-Weddell U'uters Jan Weddcll-Scotia Confliicnce Jan Ice e d g ~ APF SAPF ACC: hllZ
Jan Dec- Jan Dec-Jan Doc- Jan Dec-Jan
Dec-Jan Summer Summer Summer Summer Dec-Jan Dec-Jan Nov-Dec
Winter Winter
Dec-Mar Dec Jan Feb Mar
Jan-Mar Oct-Nov Oct-Nov Oct-Nov Nov-Dec Dec-Feb
Jan Jan Jan Jan
Nov-Dec Nov-Dec Nov-DFC Jan-Feb DPC-Jan Dcc-Jan Dec-Jan Dec-Ja11
Method --
SIS (6-24 h) PE under SIS
PE (2 h) PE (4 h)
PE (2-4 h) 1s (8-24 h) PE (2-3 h)
SIS (6-10 h) PE, daily cycle
PE 12-3 h ] PE (2-3 h) PE (2-3 h) PE (2-3 h) PE (2-3 h)
PE (4 h) PE (4 h) PE (3 11) PE [4 h)
1s 1s 1s 1s 1s 1s 1s
SIS PE CIS CIS 1s 1s 1s 1s
SIS CIS CIS CIS PE
PE, daily cycle PE PE PE PE SIS SIS SIS CIS PE PE PE PE
EI-Sayed & Mandeiii (1965) Horne et al. (1969) El-Sayed (1970) EI-Sayed (1970) El-Sayed (1970) El-Sayed & Taguchi (1981) El-Sayed et al. (1983) von Bodungen et al. (1986) Brightman & Smith (1989) Brightrnan & Smith (1989) Verlencar et al. (1990) Holm-Hansen & Mitchell (1991) Holm-Hansen & Mitchell (1991) Holm-Hansen & Mitchell (1991) Holm-Hansen & MitcheU (1991) Helbling et al. (1995) Jochem et a1.(1995) Jochem et a1.(1995) Jochem et a1.(1995) Savidge et al. (1995) Moline & Prezelin (1997) Figueiras et al. (1998) Figueiras e t al. (1998) Figueiras et al. (1998) Figueiras et al. (1998) Saggiomo et al. (1998) Saggiomo et al. (1998) Saggiomo et al. (1998) Saggiomo et al. (1998) Our study Our study Our study Our study
Ek Source
19-175 Tilzer et a1. (1985) 160-550 Sakshaug & Holm-Hansen (1986) 44-88 Tilzer et al. (1986) 50-80 Rivkin & Putt (1988) 37-177 Bnghtman & Smith (1989)
18 Holm-Hansen & Mitchell (1991) 35 2 13 Figueiras et al. (1994) 91-105 Helbiing et al. (1995) 42-114 Moline & Prezelin (1997) 87 1 2 6 Figueiras et al. (1998) 84 I 22 Figueiras et al. (1998) 88 I 22 Figueiras et al. (1998) 100 + 42 Figueiras e t al. (1998) 82 I 21 Figueiras et al. (1998) 60-250 Our study 50-180 Our study 8-83 Our study
80-160 Our study
Bracher et al.: Phytoplankton in the Southern Ocean 13
Among micronutnents, iron concentrations (de Jong et al. 1997) were low (<1 nM) at all sites dunng the whole cruise and were therefore an unlikely influence on the relative biomass distnbution which reached a maximum of only < 2 mg chl a m-3. However, during a previous cruise to the APF at 6" W in the Atlantic Sec- tor (ANT X/6, de Baar et al. 1995), iron concentrations approached 4 nM, concurrent with a higher phyto- plankton biomass (>4 mg chl a m-3) dominated by sili- cified diatoms. It is therefore tempting to speculate that phytoplankton productivity and biomass within the APF dunng our cruise could have been iron-limited, although the synergistic relationship between iron and light limitation cannot be ignored (Sunda & Huntsman 1997), particularly with regard to diatom dominated new production.
Influence of sampling time in the day
Rivkin & Putt (1988) suggested that the diurnal cycle of parameters determining the P vs E curve is not as strongly developed in the Southern Ocean as in tem- perate seas. In their study of die1 penodicity of photo- synthesis in the Southern Ocean, no photoinhibition or pigment responses to the diurnal light regime were detected within a day. In the early austral summer, at the Same time of the year as our study, the diurnal dif- ferences in P', and U.' values were small, probably due to the long daylight penod (16 to 24 h) (Rivkin & Putt 1988). Although the stations in our study were sampled at different times of the day, we conclude that the observed regional vanances in P', and a' are unlikely to be due to diurnal responses.
Hydrography
It is well known that the depth of the UML, its asso- ciated vertical stability and the underwater light field are related and fundamentally influence phytoplank- ton productivity (Sverdrup 1953, Nelson & Smith 1991). In a vertical light gradient, the tendency for phytoplankton to adjust their photosynthetic charac- teristics to the local light level at different depths is, however, opposed by the tendency for turbulence to erode this differentiation and bring the phytoplankton community to a physiologically homogenous state over depth (Lewis et al. 1984). It is this which underpins the 'critical depth' concept first quantified by Sverdrup (1953) and reconsidered in the Southern Ocean con- text by Nelson & Smith (1991). By this reasoning, pro- ductivity over most of the Southern Ocean is low, even in summer, because the depth of the surface mixed layer (Z,) approaches or exceeds the Sverdrup cntical
depth (Z„), which is a function of the solar irradiance at the sea surface and the water clarity. Strongly stratified regions in the Southern Ocean have been identified mainly in the MIZ and around land masses, where glacial meltwater or rainwater run-off provide a buoy- ancy input into the surface layer (Marra & Boardman 1984, Smith & Nelson 1985, Penssinotto et al. 1990, 1992, Mitchell & Holm-Hansen 1991). However, the paradigm of meltwater-induced stabiiity as the princi- pal mechanism accounting for regions of higher pro- ductivity is no longer universal. For example, during the STERNA cruise to the Bellingshausen Sea, ele- vated productivity in the MIZ was associated primanly with the presence of a strong frontal jet (the Southern Polar Front) rather than to ice melt and retreat (Pollard et al. 1995, Waldron et al. 1995). Sloping isopycnals at frontal edges in areas of high stability can therefore also result in shaliower stratification and elevated pro- ductivity (Lutjeharms et al. 1985, Pollard et al. 1995). But can this argument be extended to the APF during our study?
Based on a change of sigma-t of >0.05 over a 10 m depth intenral, UML depths in our study were shallow within the MIZ (12 m) and within the APF (15 to 35 m). Chlorophyll concentrations and ADP rates were maxi- mal at the northern edge of the APF where silicate was close to rl~pletion Laiihscher et al (1493) also noted that the northern edge of the APF at 10" E in the austral summer was charactensed by very shaiiow UML depths (<20 m) where surface and integrated silicate concentrations were probably low enough to limit diatom growth. In their study, the densest blooms were found in the core of the front, where high vertical sta- bility occurred in conjunction with high silicate con- centrations.
Strong temperature gradients are a typical feature of the fronts encountered in the Southern Ocean (Pol- lard et al. 1995). It is likely that they too play a signifi- Cant role in bloom dynamics in our study within the APF. In agreement with Laubscher et al. (1993), we also noted maximum chl a concentrations and ADP rates on the warmer side of the front (>4"C surface water). Apart from temperature-dependent stability considerations, temperature itself strongly influences phytoplankton production in the Southern Ocean (Jacques 1983, Tilzer et al. 1985, 1986, Palmisano et al. 1987, Tilzer & Dubinsky 1987). Jacques (1983) demonstrated that warmer temperatures could have a positive, but limited, effect on growth rates of Ant- arctic algae and that the response is also species specific. In Summary, Jacques (1989) has suggested that Antarctic algae are somewhat constrained by low temperatures, based on the assumption that the enzy- matic composition and control of carbon fixation is sirnilar in all algal species.
14 Mar Ecol Prog Ser 190: 1- 16. 1999
Taken collectively, vertical mixing processes and water colun~n stratification in combination with silicate concentrations and temperature seem to be the main factors dnving production and growth of phytoplank- ton during this study. The abundance of macronutri- ents did not play an important role in determining phytoplankton biomass and production, although the question of potential iron limitation, particularly for diatoms, was not resolved by this study.
Acknowledgements. The authors would like to thank C. Bra- trich, R. Lehmann, the Crew and the captain of RV 'Polarstern' and chief scientist V. Smetacek for their support during ANT XIII/2. Special thanks go to R. Lehmann for her assistance in creating P vs E curves. We also thank I. Ewen and I. Hense for chlorophyll analysis, I. Zondervan for DIC analyses and U. Hoge for technical help with the MER. This research was sup- ported by the Alfred Wegener Institute (AWI) for Polar and Manne Research and generous 'visiting scientist' funding to M.I.L. from the AWI and from the George Deacon Division, SOC, UK. This is AWI contribution number 1651.
LITERATURE CITED
Arrigo KR, Worthen D, Schnell A, Lizotte MP (1998) Primary production in Southern Ocean Waters. J Geophys Res 103: 15587-15600
Arrigo KR, Robinson DH, Worthen DL, Dunbar RB, DiTuiiio GR, VanWoert M, Lizotte MP (1999) Phytoplankton com- munity structure and the drawdown of nutrients and CO2 in the Southern Ocean. Science 283:364-366
Atlas D, Bannister TT (1980) Dependence of mean spectral extinction coefficient of phytoplankton on depth. water color and species. Limnol Oceanogr 25:157-159
Bannister lT (1974) Production equations in terms of chloro- phyii concentration, quantum yield, and upper liniit pro- duction. Limnol Oceanogr 19:l-12
Bathrnann UV, Scharek R, Klaas C, Dubischar CD, Smetacek V (1997a) Spring development of phytoplankton biomass and composition in major water masses of the Atlantic sec- tor of the Southern Ocean. Deep-Sea Res I1 44:51-67
Bathmann U, Hense I, Nacken M, Reynarson T (1997b) Pig- ment concentrations. Rep Polar Res 221:72-77
Bathmann U, Priddle J , Tregeur P, Lucas MI, Parslow J , Hall J (1998) Plankton ecology and biogeochemistry in the Southern Ocean: a first review of Southern Ocean JGOFS. In: Ducklow H, Field JG, Platt T (eds) First JGOFS Inter- national Scientific Symposium, Viiiefranche, France, May 8-12, 1995. IGBP Senes, Cambndge University Press, Cambndge, p 39-56
Bidigare RR, Prezelin BB, Smith RC (1992) Bio-optical models and the problem of scaling. In: Falkowski PG, Woodhead AD (eds) Primary productivity and biogeochernical cycling in the sea. Plenum Press, New York, p 175-212
Bracher AU, Tilzer MM (1998) Underwater light field and phytoplankton absorbance in the Southern Ocean during early summer 1995/1996. EOS (Trans Am Geophys Union) 79-181
Bricaud A, Stramsh D (1990) Spectral absorption coefficients of living phytoplankton and nonalgal biogenous matter: a companson between the Peru u p w e l h g area and the Sar- gasso Sea. Limnol Oceanogr 35:562-582
Bnghtman R1, Smith WO (1989) Photosynthesis-irradiance
relationships of Antarctic phytoplankton dunng austral winter. Mar Ecol Prog Ser 53.143-151
Carmack EC (1977) Water charactenstics of the Southern Ocean south of the Polar Front. In: Angel M (ed) A voyage of discovery. Pergamon Press, Oxford, p 7-19
Chisholm SW, More1 FMM (1991) What controls phytoplank- ton productivity in nutrient-nch areas of the Open sea? Limnol Oceanogr 36: 1507-1970
Cleveland JS, Perry MJ, Kiefer DA, Talbot MC (1989) Maxi- mal quantum yield of photosynthesis in northwestern Sar- gasso Sea. J Mar Res 47:869-886
Comiso JC, Maynard NG, Smith WO, Sullivan CW (1990) Satehte ocean colour studies of Antarctic ice edges in the summer/autumn. J Geophys Res 95:9481-9496
Dafner EV, Mordasova NV (1994) Influence of biotic factors on the hydrochernical structure of surface water in the Polar Frontal Zone of the Atlantic Antarctic. Mar Chem 45: 137-148
de Baar HJW, de Jong JTM, Bakker DCE, Löscher BM. Veth C, Bathmann U, Smetacek V (1995) Importance of iron for plankton blooms and carbon dioxide drawdown in the Southern Ocean. Nature 373:412-415
de Jong JTM, den Das J, Timmermans KR, de Baar HJW (1997) Field distribution of iron in a section of the Antarc- tic Polar Frontal Zone. Rep Polar Res 221:53-61
DeMaster DJ (1981) The supply and accumulation of silica in the marine environment. Geochim Cosmochim Acta 45: 1715-1732
DeMaster DJ, Nelson TM, Harden SL, Nittrouer CA (1991) The cycling and accumulation of biogenic silica and organic carbon in Antarctic deep-sea and continental mar- gin environments. Mar Chem 351489-502
Dubischar CD, Bathmann UV (1998) Small sized mesozoo- plankton in pelagic systems of the polar frontal region in the Southern Ocean. EOS (Trans Am Geophys Union) 79. 89
EI-Sayed SZ (1970) On productivity of the Southern Ocean (Atlantic and Pacific sectors). In: Holdgate MW (ed) Antarctic ecology. Pergamon Press, New York, p 119-135
El-Sayed SZ (1984) Productivity of the Antarctic waters-a reappraisal. In: Holm-Hansen 0, Bolis L. Gilles R (eds) Marine phytoplankton and productivity. Springer-Verlag, New York, p 19-34
El-Sayed SZ (1987) Biological production of Antarctic waters: present paradoxes and emerging paradigms. In: El-Sayed SZ, Tomo AP (eds) Antarctic aquatic biology. SCAR, Cam- bridge. p 1-21
EI-Sayed SZ, Mandelli EF (1965) Prirnary production and standing crop of phytoplankton in the Weddell Sea and Drake Passage. In: Llano GA (ed) Biology of Antarctic Seas 11. Antarct Res Ser 587-124
El-Sayed SZ, Taguchi S (1981) Primary production and stand- ing crop of phytoplankton along the ice edge in the Wed- deli Sea. Deep-Sea Res 28:101?-1032
El-Sayed SZ, Biggs DC, Holm-Hansen 0 (1983) Phytoplank- ton standing crop, primary productivity, and near-surface nitrogenous nutrient fields in the Ross Sea, Antarctica. Deep-Sea Res 30:871-886
Evans CA, O'Reilly JE, Thomas JP (1987) A handbook for the measurement of chlorophyll a and primary production. In: Biological investigations of marine antarctic systems and stocks (biomass), Vol 8. Texas A & M University, College Station, TX, p 47-107
Falkowski PG, Kolber Z (1993) Estimation of phytoplankton photosynthesis by active fluorescence. ICES Mar Sci Symp 197:92-103
Falkowski PG, Owens TG (1980) Light-shade adaptation:
Bracher et al.: Phytoplankton in the Southern Ocean 15
two strategies in manne phytoplankton. Plant Physiol 66. 592-595
Figuenas FG, Perez FF, Pazos Y, Rios AF (1994) Light and pro- ductivity of Antarctic phytoplankton during austral sum- mer in an ice edge region in the Weddell-Scotia Sea J Plankton Res 16:233-253
Figueiras FG, Estrada M, Lopez 0, Arbones B (1998) Photo- synthetic parameters and primary production in the Bransfield Strait: relationships with mesoscale hydrody- namic structures. J Mar Syst 17:129-141
Gran HH (1931) On the conditions for the production of plankton in the sea. Rapp Proc Verb Cons Perm Explor Mer 75:37-46
Hart TJ (1934) On the phytoplankton of the south-west Atlantic and the Bellinghausen Sea. 1929-1931. 'Discov- ery' Rep 8:l-268
Hartmann C, Hollmann B, Kattner G , Richter KU, Terbrüggen A (1997) Nutnents, dissolved and particulate matter Rep Polar Res 221:44-53
Helbling EW. Vülafafie VE, Holm-Hansen 0 (1995) Vanabil- ity of phytoplankton distnbution and primary production around Elephant lsland, Antarctica, dunng 1990-1993. Polar Biol 15:232-246
Hense I, Bathmann U, Hartmann C (1998) Spiny phytoplank- ton-slowing down the carbon pump in the Southern Ocean? EOS (Trans Am Geophys Union) 79:89
Holm-Hansen 0, iMitcheli BG (1991) Spatial and temporal distnbution of phytoplankton and pnmary production in the Western Bransfield Strait region. Deep-Sea Res 38: 961-980
Holm-Hansen 0, El-Sayed SZ, Frances-Chini GA, Cuhel RL (1977) Pnmary production and the factors controlling phytoplankton growth in the Southern Ocean. In: Llano GA (ed) Adaptations within the Antarctic ecosystem Pro- ceedings of the 3rd SCAR Symposium on Antarctic Bio- logy. Gulf Publishing Co, Houston. p 11-50
Horne AJ, Fogg GE, Eagle DJ (1969) Studies in situ of the primary production of an area inshore Antarctic Sea. J Mar Biol Assoc UK 49:393-405
Jacques G (1983) Some ecophysiological aspects of the Antarctic phytoplankton. Polar Biol 2:2?-33
Jacques G (1989) Primary production in the Antarctic Ocean dunng the austral summer. A review. Vie Milieu 39:l-17
Jochem FR, Mathot S, Queguiner B (1995) Size-fractionated primary production in the Open Southern Ocean in austral spring. Polar Biol 15:381-392
Karsten U, Garcia-Piche1 F (1996) Carotenoids and myco sporine-like amino acid compounds in members of the genus I\.ficrocoleus (cyanobactena): a chemosystematic study. Syst Appl Microbiol 19:285-294
Laubscher RK, Perrissinotto R, McQuaid CD (1993) Phyto- plankton production and bioinass at frontal zones in the Atlantic sector of the Southern Ocean. Polar Biol 13: 471-481
Letelier RM, Bidigare RR, Hebel DV, Ondrusek M, Winn CD, Kar1 DM (1993) Temporal variability of phytoplankton community structure based on community structure. Limnol Oceanogr 38:1420-1437
Lewis MR, Cullen J J , Platt T (1984) Relationships between vertical mixing and photoadaptation of phytoplankton: sirnilanty criteria. Mar Ecol Prog Ser 15:141-149
Lewis MR, Warnock RE. Platt T (1985) Absorption and photo- synthetic action spectra for natural phytoplankton popula- tions: implications for production in the Open ocean. Lim- nol Oceanogr 30:794-806
Lucas MI, Bury S, Tremblay JE, Bracher A, Lehmann R, Bra- trich C, Ewen I (1997) Primary production, nitrogen
cycling and photosynthesis-irradiance relationships for phytoplankton associated with the Antarctic Polar Front in summer. Rep Polar Res 22 1 :78-101
Lutjeharms JRE, Walters NM, AUanson BR (1985) Oceanic frontal Systems and biological enhancement. Siegfned WR, Condy PR, Laws RM (eds) Antarctic nutnents cycles and food webs. Springer-Verlag, Heidelberg, p 11-21
Marra J , Boardman DC (1984) Late winter chlorophyll a dis- tnbution in the Weddell Sea Mar Ecol Prog Ser 19: 197-205
Michaels AF. Silver MW (1988) Primary production, sinking fluxes and the rnicrobial food web. Deep-Sea Res 35: 473-490
Mitcheil BG, Holm-Hansen 0 (1991) Observations and mod- eling of the Antarctic phytoplankton crop in relation to mixing depth. Deep-Sea Res 38:981-1007
Mitchell BG, Kiefer DA (1988) Chlorophyll a specific absorp- tion and fluorescence excitation spectra for light-liinited phytoplankton. Deep-Sea Res 35:639-663
Mohne MA, Prezelin BB (1997) High-resolution time-senes data for 1991/1992 pnmary production and related para- meters at a Palmer LTER coastal site: implications for modeling carbon fixation in the Southern Ocean. Polar Biol 17:39-53
Mortlock RA. Charles CD, Froehch PN, Zibello MA, Saltzman J , Hays JD, Burkle LH (1991) Evidence for lower produc- tivity in the Antarctic Ocean dunng last glaciation. Nature 351:220-223
Nelson DM, Smith WO (1991) Sverdrup revisited: critical depths, maxirnum chlorophyll levels, and the control of Southern Ocean productivity by the irradiance-mixing regime. Limnol Oceanogr 36: 1650- 166 1
Neon A, Holm-Hansen 0, MitcheU BG, Kiefer DA (1984) Photoadaptation in manne phytoplankton Plant Physiol 76:518-524
Orsi AH, Whitworth T 111. Nowlin WD Jr (1995) On the merid- ional extent and fronts of the Antarctic circumpolar cur- rent. Deep-Sea Res 42:641-673
Palrnisano AC, SooHoo JB, Moe RM, Sullivan C W (1987) Sea ice microbial communities. VII. Changes in under-ice spectral irradiance dunng the development of Antarctic sea ice rnicroalgal communities. Mar Ecol Prog Ser 35: 165-173
Peeken I (1997) Photosynthetic fingerpnnts as indicators of phytoplankton biomass and development in different water masses of the Southern Ocean dunng austral spring. Deep-Sea Res I1 44:261-282
Penssinotto R, Duncombe Rae CM, Boden BP, Allanson BR (1990) Vertical stability as a controlling factor of the manne phytoplankton production at the Prince Edward Archipelago (Southern Ocean). Mar Ecol Prog Ser 60: 205-209
Perissinotto R. Laubscher RK, McQuaid CD (1992) Manne productivity enhancement around Bouvet and South Sandwich Islands (Southern Ocean). Mar Ecol Prog Ser 88:41-53
Perry MJ, Talbot MC, Alberte RS (1981.) Photoadaptation in manne phytoplankton: response of the photosynthetic unit. Mar Biol 62:91-101
Platt T, Harrison WG, Irwin B, Horne EP, Gallegos CL (1982) Photosynthesis and photoadaptation of marine phyto- plankton in the Arctic. Deep-Sea Res 29:1159-1170
Pollard RT, Read JF, Allen JT, Gnffiths G, Morrison AI (1 995) On the physical structure of a front in the Bellinghausen Sea. Deep-Sea Res I1 42:955-982
Pondaven P. Fravalo C. Ruiz-Pino D, Treguer P. Queguiner B, Jeandel C (1998) Modelling the silica pump in the perma-
16 Mar Ecol Prog Ser 190: 1-16. 1999
nently Open ocean Zone of the Southern Ocean. J Mar Syst 17:587-619
Prezelin BB, Sweeney BM (1979) Photoadaptation of pho- tosynthesis in two bloom-forming dinoflageiiates. In: Taylor D, Seliger HH (eds) Second International Confer- ence on toxic dinoflagellate blooms. Elsevier, Amsterdam, P 101-106
Rivkin RB, Putt M (1988) Seasonal Pattern of die1 periodicity in photosynthesis by polar phytoplankton: species-specific responses. J Phycol24:369-376
Rutgers van der Loeff MM, Bathmann UV, Buesseler KO (1997) Export production measured with the natural tracer Th-234 and sediment traps. Rep Polar Res 221:113-115
Saggiomo V, Carrada GC, Mangoni 0, Ribera d'Alcala M, Russo A (1998) Spatial and temporal vanabiiity of size- fractionated biomass and primary production in the Ross Sea (Antarctica) during austral spring and Summer. J Mar Syst 17:115-127
Sakshaug E, Holm-Hansen 0 (1984) Factors governing pro- duction in polar oceans. In: Holm-Hansen 0. Bolis L, Gilles R (eds) Manne phytoplankton and productivity. Springer-Verlag, New York, p 1-18
Sakshaug E, Holm-Hansen 0 (1986) Photoadaptation in Antarctic phytoplankton: variations in growth rate, chem- ical composition and P versus I curves. J Plankton Res 8: 459-473
Sakshaug E, Slagstad D (1991) Light and productivity of phytoplankton in polar marine ecosystems. Polar Res 10: 69-85
Sakshaug E, Bricaud A, Dandonneau Y, Falkowski PG, Kiefer DA, Legendre L, More1 A, Parslow J, Takahashi M (1997) Parameters of photosynthesis: definitions, theory and inter- pretation of results. J Plankton Res 19:1637-1670
Savidge G, Harbour D, Gilpin LC, Boyd PW (1995) Phyto- plankton distribution and production in the Bebng- shausen Sea, austral spnng 1992. Deep-Sea Res 11 42: 1201-1224
Schreiber U, Hormann H, Neubauer C, Klughanlnler C (1995) Assessment of photosystem I1 photochemical quantum yield by chlorophyll fluorescence quenchng analysis. Aust J Plant Physiol22:209-220
Smetacek VS (1985) Role of sinking in diatom life-history cycles: ecological, evolutionary and geological signifi- cance. Mar Biol 84:239-251
Smith RC, Baker KS (1978) Optical classification of natural waters. Limnol Oceanogr 23:260-267
Smith WO, Nelson DM (1985) Phytoplankton bloom produced by a receding ice edge in the Ross Sea: spatial coherence with a density field. Science 227:163-166
Smith WO, Nelson DM (1986) The irnportance of ice-edge blooms in the Southern Ocean. BioScience 36:251-257
Editorial responsjbility: Graham Savidge (Contributing Ed~tor), Portaferry, Nortliern Ireland, UK
Stoll M, Zondervan I, d e Jong E (1997) The carbon dioxide System in Antarctic waters. Rep Polar Res 221:64-67
Strass V, Timmermann R, Fischer H, Hofmann M, Gwiham P, Wischmeyer A (1997) CTD stations and water bottle sam- pling. Rep Polar Res 221:34-39
Strickland JDH, Parsons TR (1972) A practical handbook of seawater analysis. Bull Fish Res Bd Can 167
Sullivan CW, Arrigo KR, McClain CR, Comiso JC, Firestone J (1993) Distributions of phytoplankton blooms in the South- ern Ocean. Science 262:1832-1837
Sunda WG, Huntsman SA (1997) Interrelated influence of iron, light and cell size on manne phytoplankton growth Nature 390:389-392
Sverdrup HU (1953) On conditions for the vernal blooniing of phytoplankton. J Cons Int Explor Mer 18:28?-295
Talling JF (1957) Photosynthetic characteristics of some fresh- water plankton diatoms in relation to underwater radia- tion. New Phytol 56129-50
Tilzer MM, Dubinsky Z (1987) Effects of temperature and day length on the mass balance of Antarctic phytoplankton. Polar Biol 7:35-42
Tilzer MM, von Bodungen B, Smetacek V (1985) Light- dependence of phytoplankton photosynthesis on the Antarctic Ocean: irnplications for regulating productivity. In: Siegfried WR, Condy PR, Laws RM (eds) Antarctic nutrient cycles and food webs. Springer-Verlag. Heidel- berg, p 60-69
Tilzer MM, Elbrächter M, Gieskes WiV, Beese B (1986) Light- temperature interactions in the control of photosynthesis in Antarctic phytoplankton. Polar Biol 5: 105-1 11
Treguer P. Jacques G (1992) Dynamics of nutrients and phyto- plankton, and fluxes of carbon, nitrogen and silicon in the Antarctic Ocean. Polar Bio1 12:149-162
van Franeker JA, van den Brink NW (1997) Sea ice report. Rep Polar Res 221:122-130
Verlencar XN. Somasunder K. Qasim SZ (1990) Regeneration of nutrients and biological productivity in Antarctic waters. Mar Ecol Prog Cer 61141-59
von Bodiingen B, Smetacek VS, Tilzer MM, Zeitzschel B (1986) Primary production and sedim~ntation during spring in the Antarctic Peninsula region. Deep-Sea Res 33:177-194
Waldron H, Attwood CG, Probyn TA, Lucas MI (1995) Nitro- gen dynamics in the Bellingshausen Sea during the aus- tral spnng of 1992. Deep-Sea Res I1 42:1253-1276
Webb WL, Newton M, Starr D (1974) Carbon dioxide ex- change of Ainus rubra: a mathematical model. Ecologia 17:281-291
Yentsch CS (1962) Measurements of visible light absorption by particulate matter in the ocean Limnol Oceanogr 7: 207-217
Submitted: A4ay 25, 1998; Accepted: June 22, 1999 Proofs recejved from author(s): November 1 G, 1999