sentiment analysis using product review data - … analysis using product review data ... beauty,...
TRANSCRIPT
Fang and Zhan Journal of Big Data (2015) 2:5 DOI 10.1186/s40537-015-0015-2
METHODOLOGY Open Access
Sentiment analysis using product review dataXing Fang* and Justin Zhan
*Correspondence:[email protected] of Computer Science,North Carolina A&T State University,Greensboro, NC, USA
Abstract
Sentiment analysis or opinion mining is one of the major tasks of NLP (NaturalLanguage Processing). Sentiment analysis has gain much attention in recent years. Inthis paper, we aim to tackle the problem of sentiment polarity categorization, which isone of the fundamental problems of sentiment analysis. A general process forsentiment polarity categorization is proposed with detailed process descriptions. Dataused in this study are online product reviews collected from Amazon.com. Experimentsfor both sentence-level categorization and review-level categorization are performedwith promising outcomes. At last, we also give insight into our future work onsentiment analysis.
Keywords: Sentiment analysis; Sentiment polarity categorization; Natural languageprocessing; Product reviews
IntroductionSentiment is an attitude, thought, or judgment prompted by feeling. Sentiment analysis[1-8], which is also known as opinion mining, studies people’s sentiments towards cer-tain entities. Internet is a resourceful place with respect to sentiment information. From auser’s perspective, people are able to post their own content through various social media,such as forums, micro-blogs, or online social networking sites. From a researcher’s per-spective, many social media sites release their application programming interfaces (APIs),prompting data collection and analysis by researchers and developers. For instance, Twit-ter currently has three different versions of APIs available [9], namely the REST API, theSearch API, and the Streaming API.With the REST API, developers are able to gather sta-tus data and user information; the Search API allows developers to query specific Twittercontent, whereas the Streaming API is able to collect Twitter content in realtime. More-over, developers can mix those APIs to create their own applications. Hence, sentimentanalysis seems having a strong fundament with the support of massive online data.However, those types of online data have several flaws that potentially hinder the pro-
cess of sentiment analysis. The first flaw is that since people can freely post their owncontent, the quality of their opinions cannot be guaranteed. For example, instead ofsharing topic-related opinions, online spammers post spam on forums. Some spam aremeaningless at all, while others have irrelevant opinions also known as fake opinions[10-12]. The second flaw is that ground truth of such online data is not always available.A ground truth is more like a tag of a certain opinion, indicating whether the opinion ispositive, negative, or neutral. The Stanford Sentiment 140 Tweet Corpus [13] is one of the
© 2015 Fang and Zhan. This is an Open Access article distributed under the terms of the Creative Commons Attribution License(http://creativecommons.org/licenses/by/4.0), which permits unrestricted use, distribution, and reproduction in any medium,provided the original work is properly cited.
Fang and Zhan Journal of Big Data (2015) 2:5 Page 2 of 14
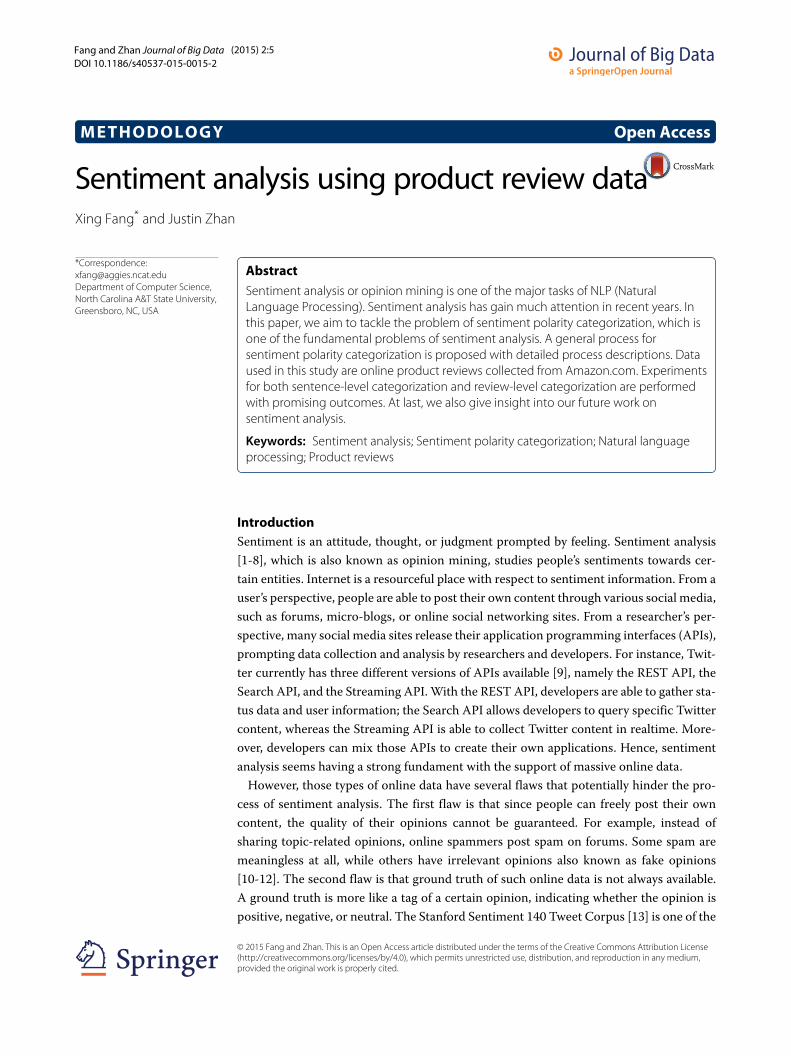
Figure 1 Rating System for Amazon.com.
datasets that has ground truth and is also public available. The corpus contains 1.6 millionmachine-tagged Twitter messages. Each message is tagged based on the emoticons (�aspositive, �as negative) discovered inside the message.Data used in this paper is a set of product reviews collected fromAmazon [14], between
February and April, 2014. The aforementioned flaws have been somewhat overcome inthe following two ways: First, each product review receives inspections before it can beposted a. Second, each review must have a rating on it that can be used as the groundtruth. The rating is based on a star-scaled system, where the highest rating has 5 stars andthe lowest rating has only 1 star (Figure 1).This paper tackles a fundamental problem of sentiment analysis, namely sentiment
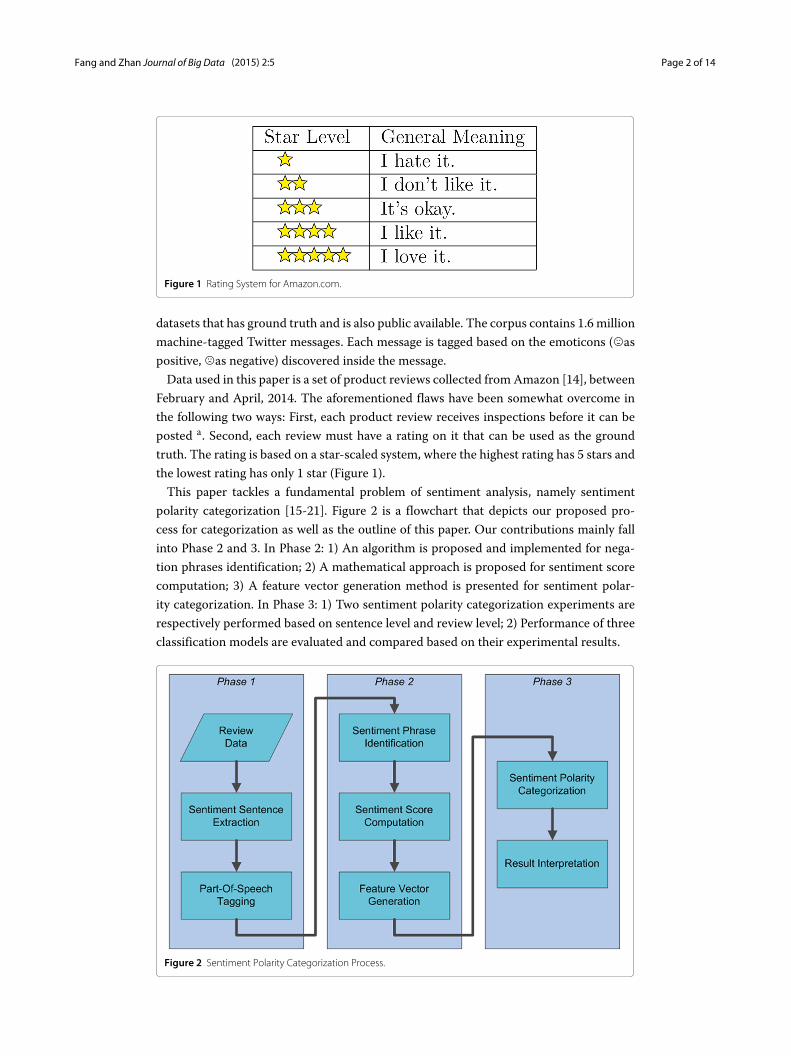
polarity categorization [15-21]. Figure 2 is a flowchart that depicts our proposed pro-cess for categorization as well as the outline of this paper. Our contributions mainly fallinto Phase 2 and 3. In Phase 2: 1) An algorithm is proposed and implemented for nega-tion phrases identification; 2) A mathematical approach is proposed for sentiment scorecomputation; 3) A feature vector generation method is presented for sentiment polar-ity categorization. In Phase 3: 1) Two sentiment polarity categorization experiments arerespectively performed based on sentence level and review level; 2) Performance of threeclassification models are evaluated and compared based on their experimental results.
Figure 2 Sentiment Polarity Categorization Process.
Fang and Zhan Journal of Big Data (2015) 2:5 Page 3 of 14
The rest of this paper is organized as follows: In section ‘Background and literaturereview’, we provide a brief review towards some related work on sentiment analysis.Software package and classification models used in this study are presented in section‘Methods’. Our detailed approaches for sentiment analysis are proposed in section‘Background and literature review’. Experimental results are presented in section ‘Resultsand discussion’. Discussion and future work is presented in section ‘Review-levelcategorization’. Section ‘Conclusion’ concludes the paper.
Background and literature reviewOne fundamental problem in sentiment analysis is categorization of sentiment polarity[6,22-25]. Given a piece of written text, the problem is to categorize the text into one spe-cific sentiment polarity, positive or negative (or neutral). Based on the scope of the text,there are three levels of sentiment polarity categorization, namely the document level, thesentence level, and the entity and aspect level [26]. The document level concerns whethera document, as a whole, expresses negative or positive sentiment, while the sentencelevel deals with each sentence’s sentiment categorization; The entity and aspect level thentargets on what exactly people like or dislike from their opinions.Since reviews of much work on sentiment analysis have already been included in [26], in
this section, we will only review some previous work, upon which our research is essen-tially based. Hu and Liu [27] summarized a list of positive words and a list of negativewords, respectively, based on customer reviews. The positive list contains 2006 wordsand the negative list has 4783 words. Both lists also include some misspelled words thatare frequently present in social media content. Sentiment categorization is essentially aclassification problem, where features that contain opinions or sentiment informationshould be identified before the classification. For feature selection, Pang and Lee [5] sug-gested to remove objective sentences by extracting subjective ones. They proposed atext-categorization technique that is able to identify subjective content using minimumcut. Gann et al. [28] selected 6,799 tokens based on Twitter data, where each tokenis assigned a sentiment score, namely TSI(Total Sentiment Index), featuring itself as apositive token or a negative token. Specifically, a TSI for a certain token is computedas:
TSI = p − tptn × n
p + tptn ∗ n
(1)
where p is the number of times a token appears in positive tweets and n is the number oftimes a token appears in negative tweets. tptn is the ratio of total number of positive tweetsover total number of negative tweets.
Research design andmethdologyData collection
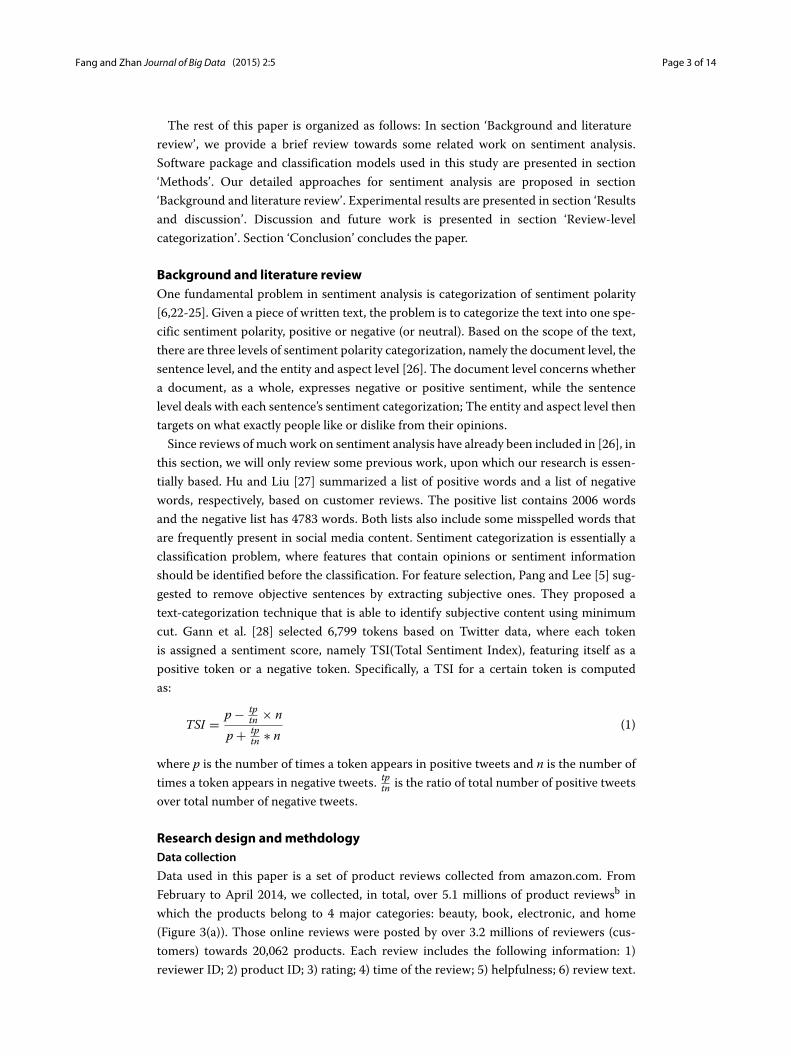
Data used in this paper is a set of product reviews collected from amazon.com. FromFebruary to April 2014, we collected, in total, over 5.1 millions of product reviewsb inwhich the products belong to 4 major categories: beauty, book, electronic, and home(Figure 3(a)). Those online reviews were posted by over 3.2 millions of reviewers (cus-tomers) towards 20,062 products. Each review includes the following information: 1)reviewer ID; 2) product ID; 3) rating; 4) time of the review; 5) helpfulness; 6) review text.
Fang and Zhan Journal of Big Data (2015) 2:5 Page 4 of 14
Figure 3 Data collection (a) Data based on product categories (b) Data based on review categories.
Every rating is based on a 5-star scale(Figure 3(b)), resulting all the ratings to be rangedfrom 1-star to 5-star with no existence of a half-star or a quarter-star.
Sentiment sentences extraction and POS tagging
It is suggested by Pang and Lee [5] that all objective content should be removed for senti-ment analysis. Instead of removing objective content, in our study, all subjective contentwas extracted for future analysis. The subjective content consists of all sentiment sen-tences. A sentiment sentence is the one that contains, at least, one positive or negativeword. All of the sentences were firstly tokenized into separated English words.Every word of a sentence has its syntactic role that defines how the word is used. The
syntactic roles are also known as the parts of speech. There are 8 parts of speech inEnglish: the verb, the noun, the pronoun, the adjective, the adverb, the preposition, theconjunction, and the interjection. In natural language processing, part-of-speech (POS)taggers [29-31] have been developed to classify words based on their parts of speech.For sentiment analysis, a POS tagger is very useful because of the following two reasons:1) Words like nouns and pronouns usually do not contain any sentiment. It is able to
Fang and Zhan Journal of Big Data (2015) 2:5 Page 5 of 14
Table 1 Part-of-Speech tags for verbs
Tag Definition
VB base form
VBP present tense, not 3rd person singular
VBZ present tense, 3rd person singular
VBD past tense
VBG present participle
VBN past participle
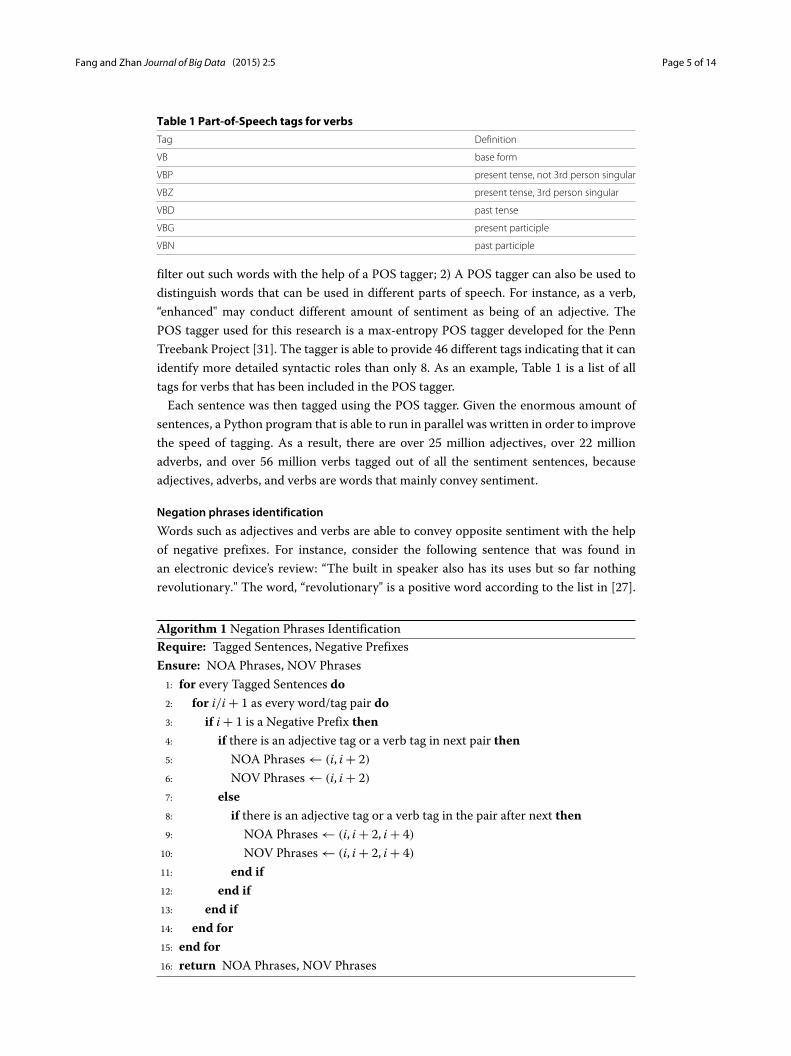
filter out such words with the help of a POS tagger; 2) A POS tagger can also be used todistinguish words that can be used in different parts of speech. For instance, as a verb,“enhanced" may conduct different amount of sentiment as being of an adjective. ThePOS tagger used for this research is a max-entropy POS tagger developed for the PennTreebank Project [31]. The tagger is able to provide 46 different tags indicating that it canidentify more detailed syntactic roles than only 8. As an example, Table 1 is a list of alltags for verbs that has been included in the POS tagger.Each sentence was then tagged using the POS tagger. Given the enormous amount of
sentences, a Python program that is able to run in parallel was written in order to improvethe speed of tagging. As a result, there are over 25 million adjectives, over 22 millionadverbs, and over 56 million verbs tagged out of all the sentiment sentences, becauseadjectives, adverbs, and verbs are words that mainly convey sentiment.
Negation phrases identification
Words such as adjectives and verbs are able to convey opposite sentiment with the helpof negative prefixes. For instance, consider the following sentence that was found inan electronic device’s review: “The built in speaker also has its uses but so far nothingrevolutionary." The word, “revolutionary" is a positive word according to the list in [27].
Algorithm 1 Negation Phrases IdentificationRequire: Tagged Sentences, Negative PrefixesEnsure: NOA Phrases, NOV Phrases1: for every Tagged Sentences do2: for i/i + 1 as every word/tag pair do3: if i + 1 is a Negative Prefix then4: if there is an adjective tag or a verb tag in next pair then5: NOA Phrases ← (i, i + 2)6: NOV Phrases ← (i, i + 2)7: else8: if there is an adjective tag or a verb tag in the pair after next then9: NOA Phrases ← (i, i + 2, i + 4)
10: NOV Phrases ← (i, i + 2, i + 4)11: end if12: end if13: end if14: end for15: end for16: return NOA Phrases, NOV Phrases
Fang and Zhan Journal of Big Data (2015) 2:5 Page 6 of 14
Table 2 Top 10 sentiment phrases based on occurrence
Phrase Type Occurrence
not worth NOA 26329
not go wrong NOA 15446
not bad NOA 15122
not be happier NOA 14892
not good NOA 12919
don’t like NOV 42525
didn’t work NOV 38287
didn’t like NOV 21806
don’t work NOV 10671
don’t recommend NOV 9670
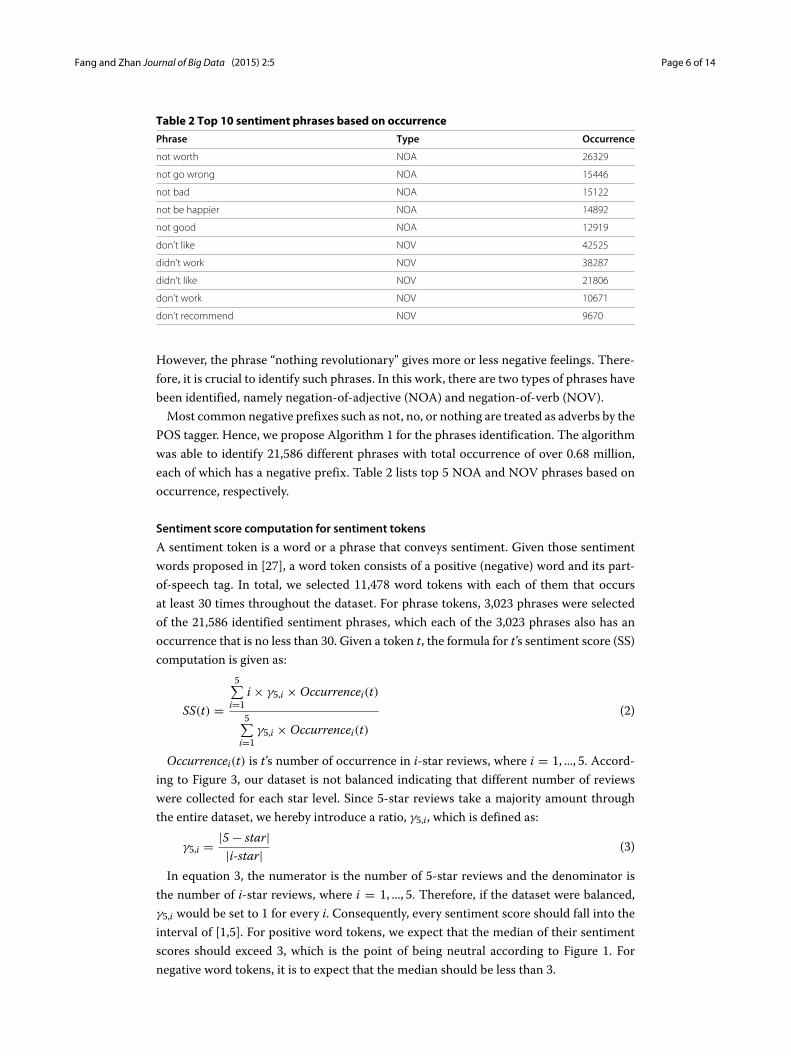
However, the phrase “nothing revolutionary" gives more or less negative feelings. There-fore, it is crucial to identify such phrases. In this work, there are two types of phrases havebeen identified, namely negation-of-adjective (NOA) and negation-of-verb (NOV).Most common negative prefixes such as not, no, or nothing are treated as adverbs by the
POS tagger. Hence, we propose Algorithm 1 for the phrases identification. The algorithmwas able to identify 21,586 different phrases with total occurrence of over 0.68 million,each of which has a negative prefix. Table 2 lists top 5 NOA and NOV phrases based onoccurrence, respectively.
Sentiment score computation for sentiment tokens
A sentiment token is a word or a phrase that conveys sentiment. Given those sentimentwords proposed in [27], a word token consists of a positive (negative) word and its part-of-speech tag. In total, we selected 11,478 word tokens with each of them that occursat least 30 times throughout the dataset. For phrase tokens, 3,023 phrases were selectedof the 21,586 identified sentiment phrases, which each of the 3,023 phrases also has anoccurrence that is no less than 30. Given a token t, the formula for t’s sentiment score (SS)computation is given as:
SS(t) =
5∑i=1
i × γ5,i × Occurrencei(t)
5∑i=1
γ5,i × Occurrencei(t)(2)
Occurrencei(t) is t’s number of occurrence in i-star reviews, where i = 1, ..., 5. Accord-ing to Figure 3, our dataset is not balanced indicating that different number of reviewswere collected for each star level. Since 5-star reviews take a majority amount throughthe entire dataset, we hereby introduce a ratio, γ5,i, which is defined as:
γ5,i = |5 − star||i-star| (3)
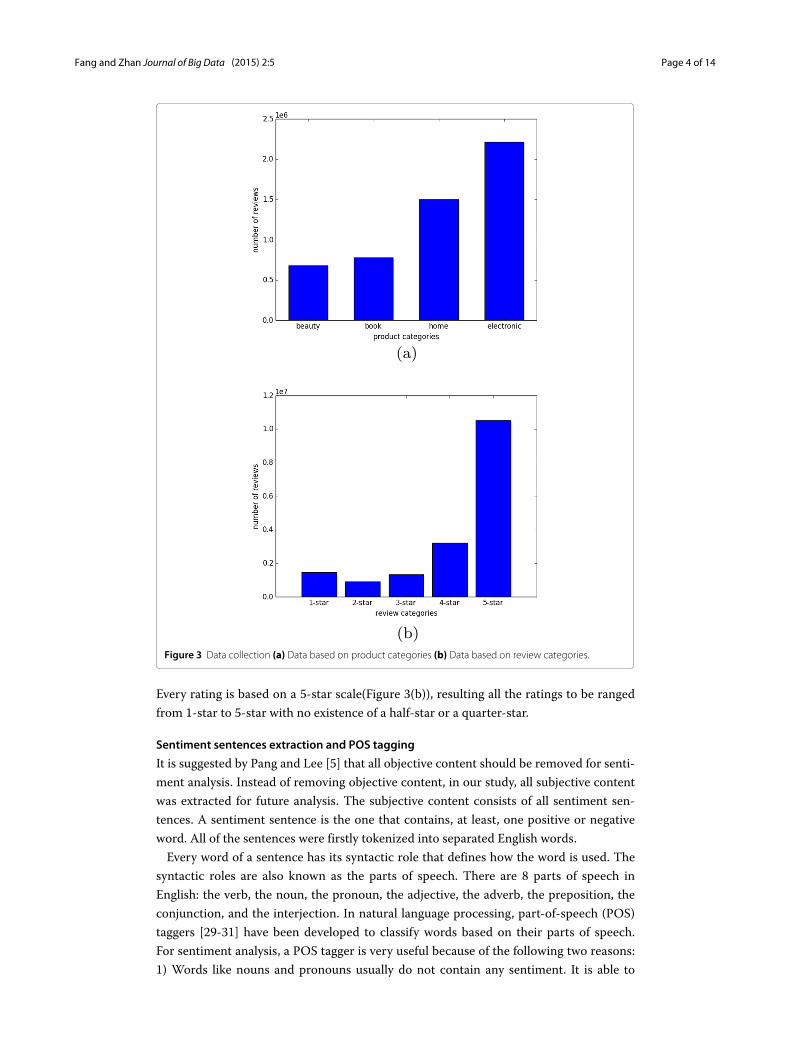
In equation 3, the numerator is the number of 5-star reviews and the denominator isthe number of i-star reviews, where i = 1, ..., 5. Therefore, if the dataset were balanced,γ5,i would be set to 1 for every i. Consequently, every sentiment score should fall into theinterval of [1,5]. For positive word tokens, we expect that the median of their sentimentscores should exceed 3, which is the point of being neutral according to Figure 1. Fornegative word tokens, it is to expect that the median should be less than 3.
Fang and Zhan Journal of Big Data (2015) 2:5 Page 7 of 14
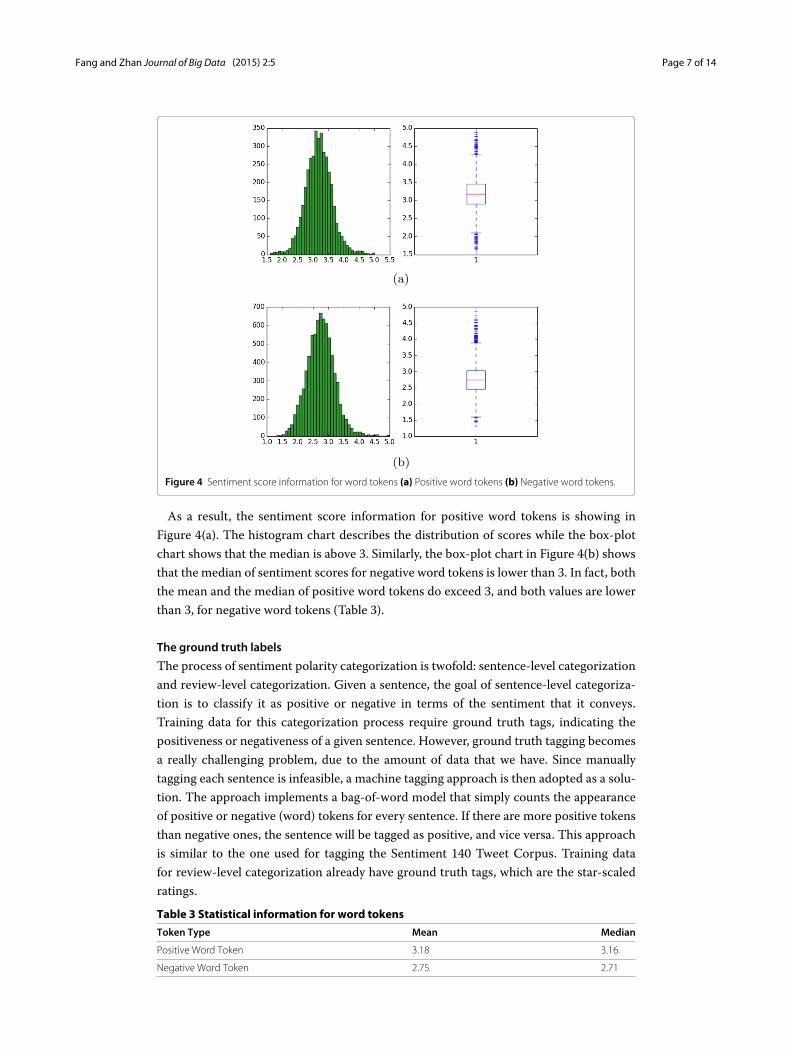
Figure 4 Sentiment score information for word tokens (a) Positive word tokens (b) Negative word tokens.
As a result, the sentiment score information for positive word tokens is showing inFigure 4(a). The histogram chart describes the distribution of scores while the box-plotchart shows that the median is above 3. Similarly, the box-plot chart in Figure 4(b) showsthat the median of sentiment scores for negative word tokens is lower than 3. In fact, boththe mean and the median of positive word tokens do exceed 3, and both values are lowerthan 3, for negative word tokens (Table 3).
The ground truth labels
The process of sentiment polarity categorization is twofold: sentence-level categorizationand review-level categorization. Given a sentence, the goal of sentence-level categoriza-tion is to classify it as positive or negative in terms of the sentiment that it conveys.Training data for this categorization process require ground truth tags, indicating thepositiveness or negativeness of a given sentence. However, ground truth tagging becomesa really challenging problem, due to the amount of data that we have. Since manuallytagging each sentence is infeasible, a machine tagging approach is then adopted as a solu-tion. The approach implements a bag-of-word model that simply counts the appearanceof positive or negative (word) tokens for every sentence. If there are more positive tokensthan negative ones, the sentence will be tagged as positive, and vice versa. This approachis similar to the one used for tagging the Sentiment 140 Tweet Corpus. Training datafor review-level categorization already have ground truth tags, which are the star-scaledratings.
Table 3 Statistical information for word tokens
Token Type Mean Median
Positive Word Token 3.18 3.16
Negative Word Token 2.75 2.71

Fang and Zhan Journal of Big Data (2015) 2:5 Page 8 of 14
Feature vector formation
Sentiment tokens and sentiment scores are information extracted from the originaldataset. They are also known as features, which will be used for sentiment categoriza-tion. In order to train the classifiers, each entry of training data needs to be transformedto a vector that contains those features, namely a feature vector. For the sentence-level(review-level) categorization, a feature vector is formed based on a sentence (review).One challenge is to control each vector’s dimensionality. The challenge is actually twofold:Firstly, a vector should not contain an abundant amount (thousands or hundreds) of fea-tures or values of a feature, because of the curse of dimensionality [32]; secondly, everyvector should have the same number of dimensions, in order to fit the classifiers. Thischallenge particularly applies to sentiment tokens: On one hand, there are 11,478 wordtokens as well as 3,023 phrase tokens; On the other hand, vectors cannot be formed bysimply including the tokens appeared in a sentence (or a review), because different sen-tences (or reviews) tend to have different amount of tokens, leading to the consequencethat the generated vectors are in different dimensions.Since we only concern each sentiment token’s appearance inside a sentence or a
review,to overcome the challenge, two binary strings are used to represent each token’sappearance. One string with 11,478 bits is used for word tokens, while the other one witha bit-length of 3,023 is applied for phrase tokens. For instance, if the ith word (phrase)token appears, the word (phrase) string’s ith bit will be flipped from “0" to “1". Finally,instead of directly saving the flipped strings into a feature vector, a hash value of eachstring is computed using Python’s built-in hash function and is saved. Hence, a sentence-level feature vector totally has four elements: two hash values computed based on theflipped binary strings, an averaged sentiment score, and a ground truth label. Compara-tively, one more element is exclusively included in review-level vectors. Given a review,if there are m positive sentences and n negative sentences, the value of the element iscomputed as: −1 × m + 1 × n.
Results and discussionEvaluation methods
Performance of each classification model is estimated base on its averaged F1-score (4):
F1avg =
n∑i=1
2×Pi×RiPi+Ri
n(4)
where Pi is the precision of the ith class, Ri is the recall of the ith class, and n is thenumber of classes. Pi and Ri are evaluated using 10-fold cross validation. A 10-fold crossvalidation is applied as follows: A dataset is partitioned into 10 equal size subsets, each ofwhich consists of 10 positive class vectors and 10 negative class vectors. Of the 10 sub-sets, a single subset is retained as the validation data for testing the classification model,and the remaining 9 subsets are used as training data. The cross-validation process isthen repeated 10 times, with each of the 10 subsets used exactly once as the validationdata. The 10 results from the folds are then averaged to produce a single estimation.Since training data are labeled under two classes (positive and negative) for the sentence-level categorization, ROC (Receiver Operating Characteristic) curves are also plotted fora better performance comparison.
Fang and Zhan Journal of Big Data (2015) 2:5 Page 9 of 14
Sentence-level categorization
Result onmanually-labeled sentences
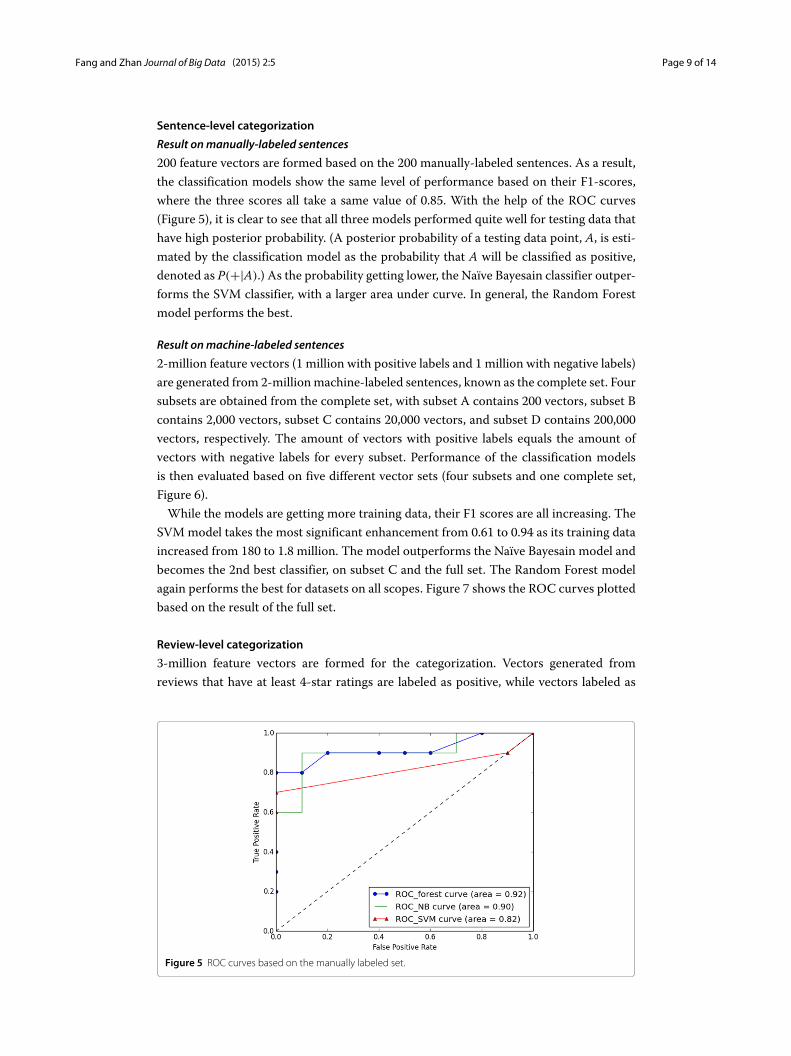
200 feature vectors are formed based on the 200 manually-labeled sentences. As a result,the classification models show the same level of performance based on their F1-scores,where the three scores all take a same value of 0.85. With the help of the ROC curves(Figure 5), it is clear to see that all three models performed quite well for testing data thathave high posterior probability. (A posterior probability of a testing data point, A, is esti-mated by the classification model as the probability that A will be classified as positive,denoted as P(+|A).) As the probability getting lower, the Naïve Bayesain classifier outper-forms the SVM classifier, with a larger area under curve. In general, the Random Forestmodel performs the best.
Result onmachine-labeled sentences
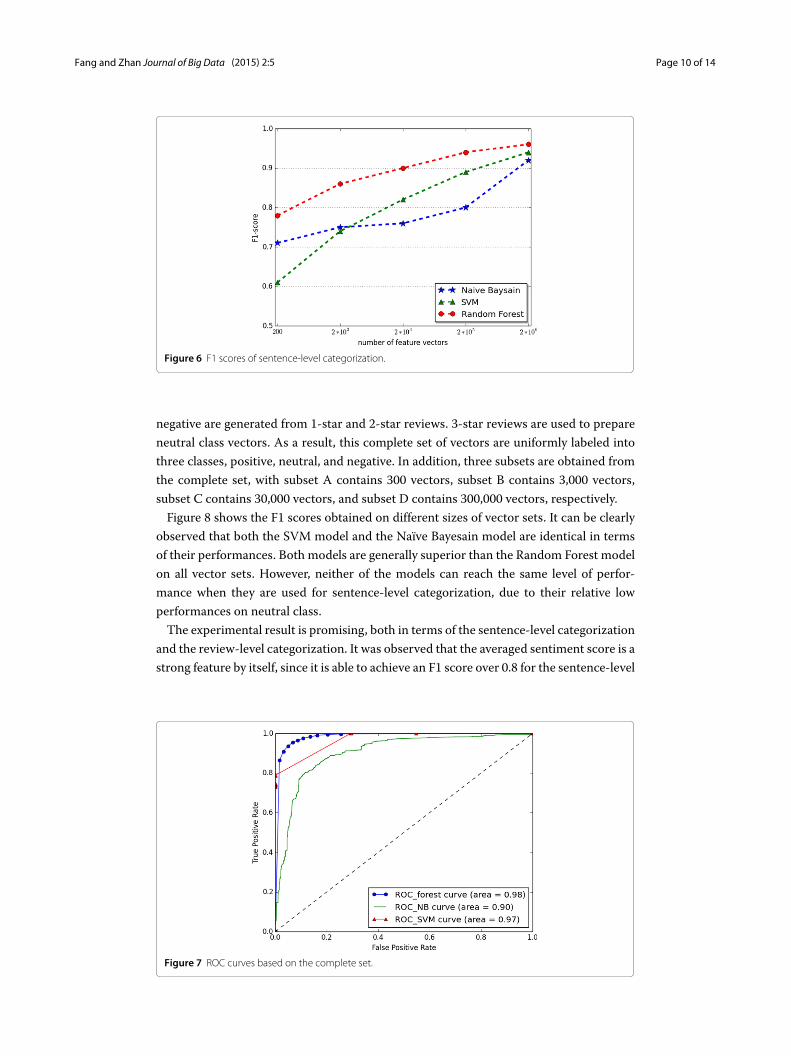
2-million feature vectors (1 million with positive labels and 1 million with negative labels)are generated from 2-millionmachine-labeled sentences, known as the complete set. Foursubsets are obtained from the complete set, with subset A contains 200 vectors, subset Bcontains 2,000 vectors, subset C contains 20,000 vectors, and subset D contains 200,000vectors, respectively. The amount of vectors with positive labels equals the amount ofvectors with negative labels for every subset. Performance of the classification modelsis then evaluated based on five different vector sets (four subsets and one complete set,Figure 6).While the models are getting more training data, their F1 scores are all increasing. The
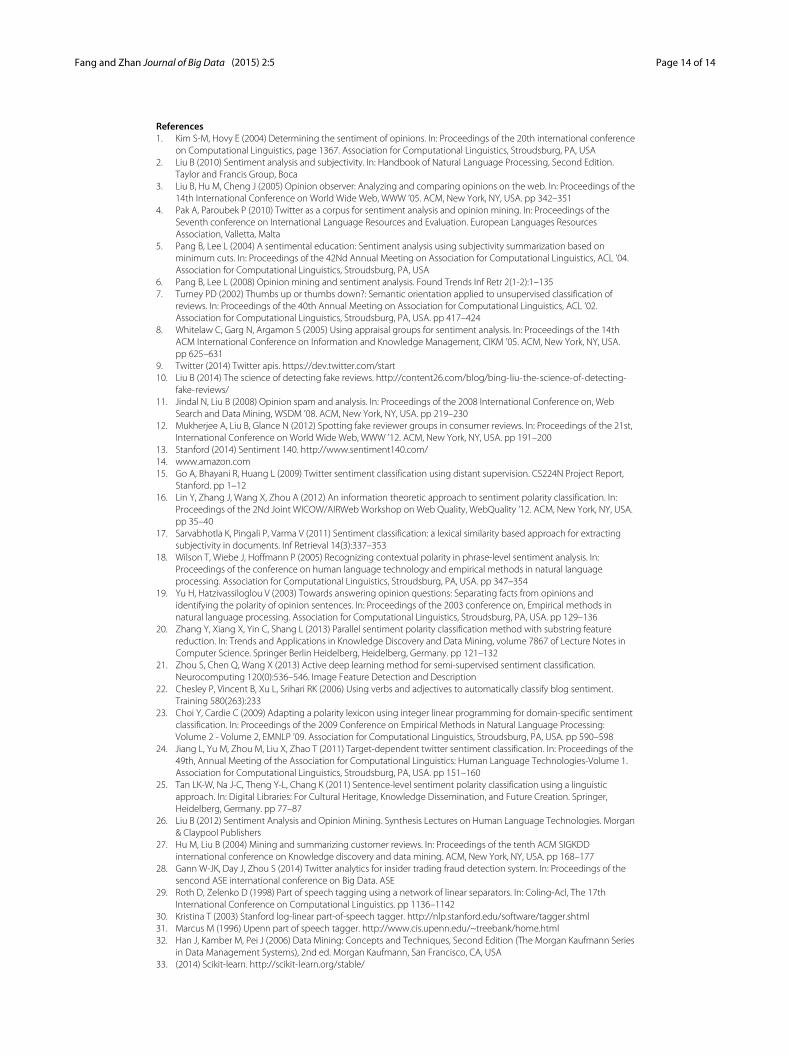
SVMmodel takes the most significant enhancement from 0.61 to 0.94 as its training dataincreased from 180 to 1.8 million. The model outperforms the Naïve Bayesain model andbecomes the 2nd best classifier, on subset C and the full set. The Random Forest modelagain performs the best for datasets on all scopes. Figure 7 shows the ROC curves plottedbased on the result of the full set.
Review-level categorization
3-million feature vectors are formed for the categorization. Vectors generated fromreviews that have at least 4-star ratings are labeled as positive, while vectors labeled as
Figure 5 ROC curves based on the manually labeled set.
Fang and Zhan Journal of Big Data (2015) 2:5 Page 10 of 14
Figure 6 F1 scores of sentence-level categorization.
negative are generated from 1-star and 2-star reviews. 3-star reviews are used to prepareneutral class vectors. As a result, this complete set of vectors are uniformly labeled intothree classes, positive, neutral, and negative. In addition, three subsets are obtained fromthe complete set, with subset A contains 300 vectors, subset B contains 3,000 vectors,subset C contains 30,000 vectors, and subset D contains 300,000 vectors, respectively.Figure 8 shows the F1 scores obtained on different sizes of vector sets. It can be clearly
observed that both the SVM model and the Naïve Bayesain model are identical in termsof their performances. Both models are generally superior than the Random Forest modelon all vector sets. However, neither of the models can reach the same level of perfor-mance when they are used for sentence-level categorization, due to their relative lowperformances on neutral class.The experimental result is promising, both in terms of the sentence-level categorization
and the review-level categorization. It was observed that the averaged sentiment score is astrong feature by itself, since it is able to achieve an F1 score over 0.8 for the sentence-level
Figure 7 ROC curves based on the complete set.

Fang and Zhan Journal of Big Data (2015) 2:5 Page 11 of 14
Figure 8 F1 scores of review-level categorization.
categorization with the complete set. For the review-level categorization with the com-plete set, the feature is capable of producing an F1 score that is over 0.73. However, thereare still couple of limitations to this study. The first one is that the review-level categoriza-tion becomes difficult if we want to classify reviews to their specific star-scaled ratings. Inother words, F1 scores obtained from such experiments are fairly low, with values lowerthan 0.5. The second limitation is that since our sentiment analysis scheme proposed inthis study relies on the occurrence of sentiment tokens, the scheme may not work wellfor those reviews that purely contain implicit sentiments. An implicit sentiment is usuallyconveyed through some neutral words, making judgement of its sentiment polarity diffi-cult. For example, sentence like “Item as described.", which frequently appears in positivereviews, consists of only neutral words.With those limitations in mind, our future work is to focus on solving those issues.
Specifically, more features will be extracted and grouped into feature vectors to improvereview-level categorizations. For the issue of implicit sentiment analysis, our next stepis to be able to detect the existence of such sentiment within the scope of a particu-lar product. More future work includes testing our categorization scheme using otherdatasets.
ConclusionSentiment analysis or opinion mining is a field of study that analyzes people’s sentiments,attitudes, or emotions towards certain entities. This paper tackles a fundamental problemof sentiment analysis, sentiment polarity categorization. Online product reviews fromAmazon.com are selected as data used for this study. A sentiment polarity categorizationprocess (Figure 2) has been proposed along with detailed descriptions of each step. Exper-iments for both sentence-level categorization and review-level categorization have beenperformed.
MethodsSoftware used for this study is scikit-learn [33], an open source machine learning soft-ware package in Python. The classification models selected for categorization are: NaïveBayesian, Random Forest, and Support Vector Machine [32].

Fang and Zhan Journal of Big Data (2015) 2:5 Page 12 of 14
Naïve Bayesian classifier
The Naïve Bayesian classifier works as follows: Suppose that there exist a set of train-ing data, D, in which each tuple is represented by an n-dimensional feature vector,X = x1, x2, .., xn, indicating n measurements made on the tuple from n attributes or fea-tures. Assume that there are m classes, C1,C2, ...,Cm. Given a tuple X, the classifier willpredict that X belongs to Ci if and only if: P(Ci|X) > P(Cj|X), where i, j ∈[ 1,m] andi �= j.P(Ci|X) is computed as:
P(Ci|X) =n∏
k=1P(xk|Ci) (5)
Random forest
The random forest classifier was chosen due to its superior performance over a singledecision tree with respect to accuracy. It is essentially an ensemble method based onbagging. The classifier works as follows: Given D, the classifier firstly creates k bootstrapsamples ofD, with each of the samples denoting asDi. ADi has the same number of tuplesas D that are sampled with replacement from D. By sampling with replacement, it meansthat some of the original tuples ofDmay not be included inDi, whereas others may occurmore than once. The classifier then constructs a decision tree based on each Di. As aresult, a “forest" that consists of k decision trees is formed. To classify an unknown tuple,X, each tree returns its class prediction counting as one vote. The final decision of X’sclass is assigned to the one that has the most votes.The decision tree algorithm implemented in scikit-learn is CART (Classification and
Regression Trees). CART uses Gini index for its tree induction. For D, the Gini index iscomputed as:
Gini(D) = 1 −m∑
i=1p2i (6)
where pi is the probability that a tuple in D belongs to class Ci. The Gini index measuresthe impurity of D. The lower the index value is, the better D was partitioned. For thedetailed descriptions of CART, please see [32].
Support vector machine
Support vector machine (SVM) is a method for the classification of both linear and non-linear data. If the data is linearly separable, the SVM searches for the linear optimalseparating hyperplane (the linear kernel), which is a decision boundary that separatesdata of one class from another. Mathematically, a separating hyperplane can be writtenas: W · X + b = 0, where W is a weight vector and W = w1,w2, ...,wn. X is a trainingtuple. b is a scalar. In order to optimize the hyperplane, the problem essentially trans-
forms to the minimization of ‖W‖, which is eventually computed as:n∑
i=1αiyixi, where αi
are numeric parameters, and yi are labels based on support vectors, Xi. That is: if yi = 1
thenn∑
i=1wixi ≥ 1; if yi = −1 then
n∑i=1
wixi ≥ −1.
If the data is linearly inseparable, the SVM uses nonlinear mapping to transform thedata into a higher dimension. It then solve the problem by finding a linear hyperplane.

Fang and Zhan Journal of Big Data (2015) 2:5 Page 13 of 14
Figure 9 A Classification Example of SVM.
Functions to perform such transformations are called kernel functions. The kernelfunction selected for our experiment is the Gaussian Radial Basis Function (RBF):
K(Xi,Xj) = e−γ ‖Xi−Xj‖2/2 (7)
where Xi are support vectors, Xj are testing tuples , and γ is a free parameter that uses thedefault value from scikit-learn in our experiment. Figure 9 shows a classification exampleof SVM based on the linear kernel and the RBF kernel.
EndnotesaEven though there are papers talking about spam on Amazon.com, we still contend
that it is a relatively spam-free website in terms of reviews because of the enforcement ofits review inspection process.
bThe product review data used for this work can be downloaded at: http://www.ilabsite.org/?page_id=1091.
Competing interestsThe authors declare that they have no competing interests.
Authors’ contributionsXF performed the primary literature review, data collection, experiments, and also drafted the manuscript. JZ workedwith XF to develop the articles framework and focus. All authors read and approved the final manuscript.
Authors’ informationXing Fang is a Ph.D. candidate at the Department of Computer Science, North Carolina A&T State University. His researchinterests include social computing, machine learning, and natural language processing. Mr. Fang holds one Master’sdegree in computer science from North Carolina A&T State University, and one Baccalaureate degree in electronicengineering from Northwestern Polytechnical University, Xi’an, China.Dr. Justin Zhan is an associate professor at the Department of Computer Science, North Carolina A&T State University. Hehas previously been a faculty member at Carnegie Mellon University and National Center for the Protection of FinancialInfrastructure in Dakota State University. His research interests include Big Data, Information Assurance, SocialComputing, and Health Science.
AcknowledgementsThis research was partially supported by the following grants: NSF No. 1137443, NSF No. 1247663, NSF No. 1238767, DoDNo. W911NF-13-0130, DoD No. W911NF-14-1-0119, and the Data Science Fellowship Award by the National Consortiumfor Data Science.
Received: 12 January 2015 Accepted: 20 April 2015
Fang and Zhan Journal of Big Data (2015) 2:5 Page 14 of 14
References1. Kim S-M, Hovy E (2004) Determining the sentiment of opinions. In: Proceedings of the 20th international conference
on Computational Linguistics, page 1367. Association for Computational Linguistics, Stroudsburg, PA, USA2. Liu B (2010) Sentiment analysis and subjectivity. In: Handbook of Natural Language Processing, Second Edition.
Taylor and Francis Group, Boca3. Liu B, Hu M, Cheng J (2005) Opinion observer: Analyzing and comparing opinions on the web. In: Proceedings of the
14th International Conference on World Wide Web, WWW ’05. ACM, New York, NY, USA. pp 342–3514. Pak A, Paroubek P (2010) Twitter as a corpus for sentiment analysis and opinion mining. In: Proceedings of the
Seventh conference on International Language Resources and Evaluation. European Languages ResourcesAssociation, Valletta, Malta
5. Pang B, Lee L (2004) A sentimental education: Sentiment analysis using subjectivity summarization based onminimum cuts. In: Proceedings of the 42Nd Annual Meeting on Association for Computational Linguistics, ACL ’04.Association for Computational Linguistics, Stroudsburg, PA, USA
6. Pang B, Lee L (2008) Opinion mining and sentiment analysis. Found Trends Inf Retr 2(1-2):1–1357. Turney PD (2002) Thumbs up or thumbs down?: Semantic orientation applied to unsupervised classification of
reviews. In: Proceedings of the 40th Annual Meeting on Association for Computational Linguistics, ACL ’02.Association for Computational Linguistics, Stroudsburg, PA, USA. pp 417–424
8. Whitelaw C, Garg N, Argamon S (2005) Using appraisal groups for sentiment analysis. In: Proceedings of the 14thACM International Conference on Information and Knowledge Management, CIKM ’05. ACM, New York, NY, USA.pp 625–631
9. Twitter (2014) Twitter apis. https://dev.twitter.com/start10. Liu B (2014) The science of detecting fake reviews. http://content26.com/blog/bing-liu-the-science-of-detecting-
fake-reviews/11. Jindal N, Liu B (2008) Opinion spam and analysis. In: Proceedings of the 2008 International Conference on, Web
Search and Data Mining, WSDM ’08. ACM, New York, NY, USA. pp 219–23012. Mukherjee A, Liu B, Glance N (2012) Spotting fake reviewer groups in consumer reviews. In: Proceedings of the 21st,
International Conference on World Wide Web, WWW ’12. ACM, New York, NY, USA. pp 191–20013. Stanford (2014) Sentiment 140. http://www.sentiment140.com/14. www.amazon.com15. Go A, Bhayani R, Huang L (2009) Twitter sentiment classification using distant supervision. CS224N Project Report,
Stanford. pp 1–1216. Lin Y, Zhang J, Wang X, Zhou A (2012) An information theoretic approach to sentiment polarity classification. In:
Proceedings of the 2Nd Joint WICOW/AIRWeb Workshop on Web Quality, WebQuality ’12. ACM, New York, NY, USA.pp 35–40
17. Sarvabhotla K, Pingali P, Varma V (2011) Sentiment classification: a lexical similarity based approach for extractingsubjectivity in documents. Inf Retrieval 14(3):337–353
18. Wilson T, Wiebe J, Hoffmann P (2005) Recognizing contextual polarity in phrase-level sentiment analysis. In:Proceedings of the conference on human language technology and empirical methods in natural languageprocessing. Association for Computational Linguistics, Stroudsburg, PA, USA. pp 347–354
19. Yu H, Hatzivassiloglou V (2003) Towards answering opinion questions: Separating facts from opinions andidentifying the polarity of opinion sentences. In: Proceedings of the 2003 conference on, Empirical methods innatural language processing. Association for Computational Linguistics, Stroudsburg, PA, USA. pp 129–136
20. Zhang Y, Xiang X, Yin C, Shang L (2013) Parallel sentiment polarity classification method with substring featurereduction. In: Trends and Applications in Knowledge Discovery and Data Mining, volume 7867 of Lecture Notes inComputer Science. Springer Berlin Heidelberg, Heidelberg, Germany. pp 121–132
21. Zhou S, Chen Q, Wang X (2013) Active deep learning method for semi-supervised sentiment classification.Neurocomputing 120(0):536–546. Image Feature Detection and Description
22. Chesley P, Vincent B, Xu L, Srihari RK (2006) Using verbs and adjectives to automatically classify blog sentiment.Training 580(263):233
23. Choi Y, Cardie C (2009) Adapting a polarity lexicon using integer linear programming for domain-specific sentimentclassification. In: Proceedings of the 2009 Conference on Empirical Methods in Natural Language Processing:Volume 2 - Volume 2, EMNLP ’09. Association for Computational Linguistics, Stroudsburg, PA, USA. pp 590–598
24. Jiang L, Yu M, Zhou M, Liu X, Zhao T (2011) Target-dependent twitter sentiment classification. In: Proceedings of the49th, Annual Meeting of the Association for Computational Linguistics: Human Language Technologies-Volume 1.Association for Computational Linguistics, Stroudsburg, PA, USA. pp 151–160
25. Tan LK-W, Na J-C, Theng Y-L, Chang K (2011) Sentence-level sentiment polarity classification using a linguisticapproach. In: Digital Libraries: For Cultural Heritage, Knowledge Dissemination, and Future Creation. Springer,Heidelberg, Germany. pp 77–87
26. Liu B (2012) Sentiment Analysis and Opinion Mining. Synthesis Lectures on Human Language Technologies. Morgan& Claypool Publishers
27. Hu M, Liu B (2004) Mining and summarizing customer reviews. In: Proceedings of the tenth ACM SIGKDDinternational conference on Knowledge discovery and data mining. ACM, New York, NY, USA. pp 168–177
28. Gann W-JK, Day J, Zhou S (2014) Twitter analytics for insider trading fraud detection system. In: Proceedings of thesencond ASE international conference on Big Data. ASE
29. Roth D, Zelenko D (1998) Part of speech tagging using a network of linear separators. In: Coling-Acl, The 17thInternational Conference on Computational Linguistics. pp 1136–1142
30. Kristina T (2003) Stanford log-linear part-of-speech tagger. http://nlp.stanford.edu/software/tagger.shtml31. Marcus M (1996) Upenn part of speech tagger. http://www.cis.upenn.edu/~treebank/home.html32. Han J, Kamber M, Pei J (2006) Data Mining: Concepts and Techniques, Second Edition (The Morgan Kaufmann Series
in Data Management Systems), 2nd ed. Morgan Kaufmann, San Francisco, CA, USA33. (2014) Scikit-learn. http://scikit-learn.org/stable/