sensorineural deafness - welcome | npeu · sensorineural deafness rate/1000 neonatal survivors, ......
TRANSCRIPT
45
SENSORINEURAL DEAFNESS
4Child Definition: Sensorineural loss of 50dB or more averaged across the range 0.5 to 4 kHz in the better ear. In the absence of a pure-tone audiogram, assessment is based on clinical judgement. Data about children fitted with hearing aids or a cochlear implant for sensorineural loss are included on the database.
___________________
In contrast to the previous section, the report from this point onwards will be concerned largely with prevalence rates of impairment, although percentages will also be used where appropriate. Generally the dataset analysed will be composed of data about children who were born in one of the four counties and usually those whose impairments are believed to have been present at birth or within the first four weeks. Where this varies, it will be stated on the table or figure.
There are now 617 children on the database with deafness who meet 4Child criteria for inclusion. A further 118 children with deafness moved into the area after birth and ten have unknown birth address. Data about these 128 children are not included here for the discussion of prevalence rates. The overall rate of sensorineural deafness for children notified to 4Child (births within the four counties, 1984 to 2003) remains at just less than one per 1000 live births. As in the 2008 report, Oxfordshire and Buckinghamshire have slightly lower rates than Berkshire and Northamptonshire (Table 15). Oxfordshire has consistently had a lower rate than the other counties although this difference is not statistically significant (p = 0.2). These differences in rate may be accounted for by chance or by a difference in detection or reporting of milder cases as the rates for severe/profound deafness are the same across the four counties.
Table 15. Children born during 1984-2003 with sensorineural deafness by mother's county of residence at birth
Children with
sensorineural deafness Children with severe/profound
hearing loss (71-95dB loss)County of residence
Number of live births
No. Rate /1000 live births
95% CI No. Rate /1000 live births
95% CI
Berkshire 219 084 214 1.0 0.9-1.1 116 0.5 0.4-0.6Bucks 168 644 147 0.9 0.7-1.0 81 0.5 0.4-0.6Northants 155 144 148 1.0 0.8-1.1 80 0.5 0.4-0.6Oxon 145 146 108 0.7 0.6-0.9 65 0.4 0.4-0.6 Total 688 018 617 0.9 0.8-1.0 342 0.5 0.5-0.6
46
346%
213% 29
5%
6611%
46476%
2500g and over
<1000g1000-1499g
1500-1999g
2000-2499g
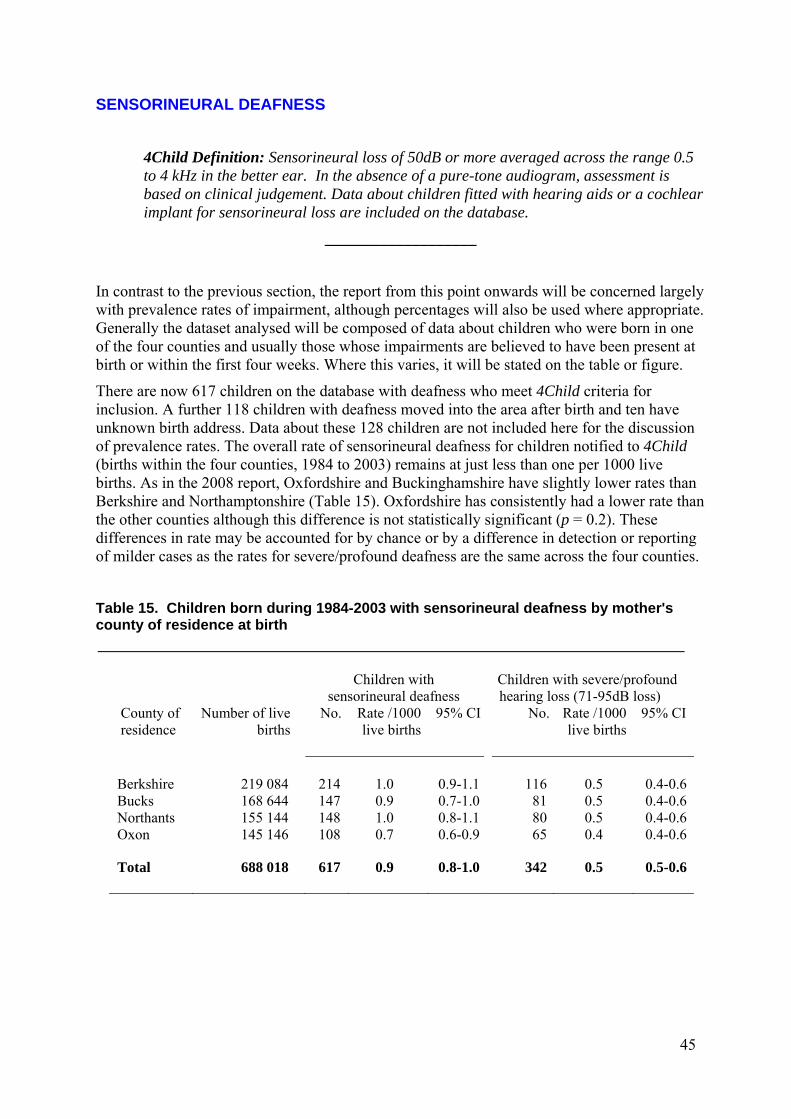
The rate of sensorineural deafness among low birthweight babies (<2500g) is five times2 that for babies with birthweights of 2500g and over (Figure 10).
Figure 10. Sensorineural deafness rate/1000 neonatal survivors, with 95% confidence limits, by birthweight group, among children born 1984-2002. Excludes data about three children with unknown birthweight.
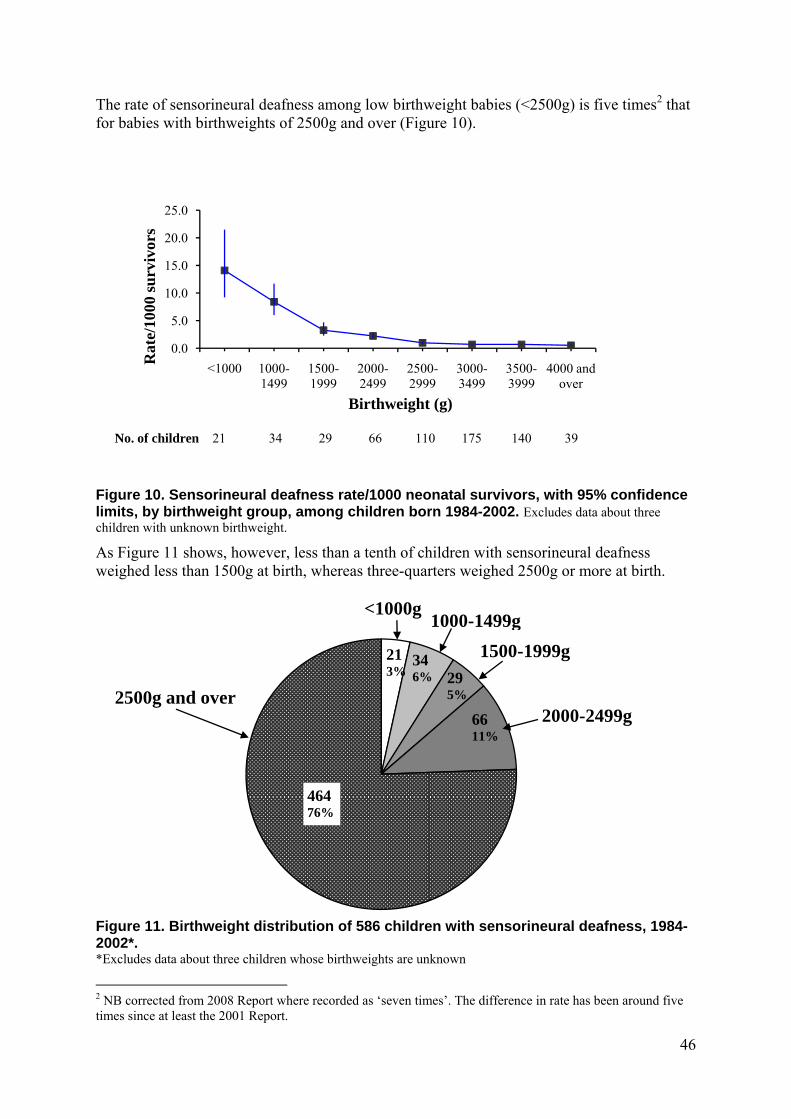
As Figure 11 shows, however, less than a tenth of children with sensorineural deafness weighed less than 1500g at birth, whereas three-quarters weighed 2500g or more at birth.
Figure 11. Birthweight distribution of 586 children with sensorineural deafness, 1984-2002*. *Excludes data about three children whose birthweights are unknown
2 NB corrected from 2008 Report where recorded as ‘seven times’. The difference in rate has been around five times since at least the 2001 Report.
0.0
5.0
10.0
15.0
20.0
25.0
<1000 1000-1499
1500-1999
2000-2499
2500-2999
3000-3499
3500-3999
4000 and over
Rat
e/10
00 s
urv
ivor
s
Birthweight (g)
No. of children 21 34 29 66 110 175 140 39
47
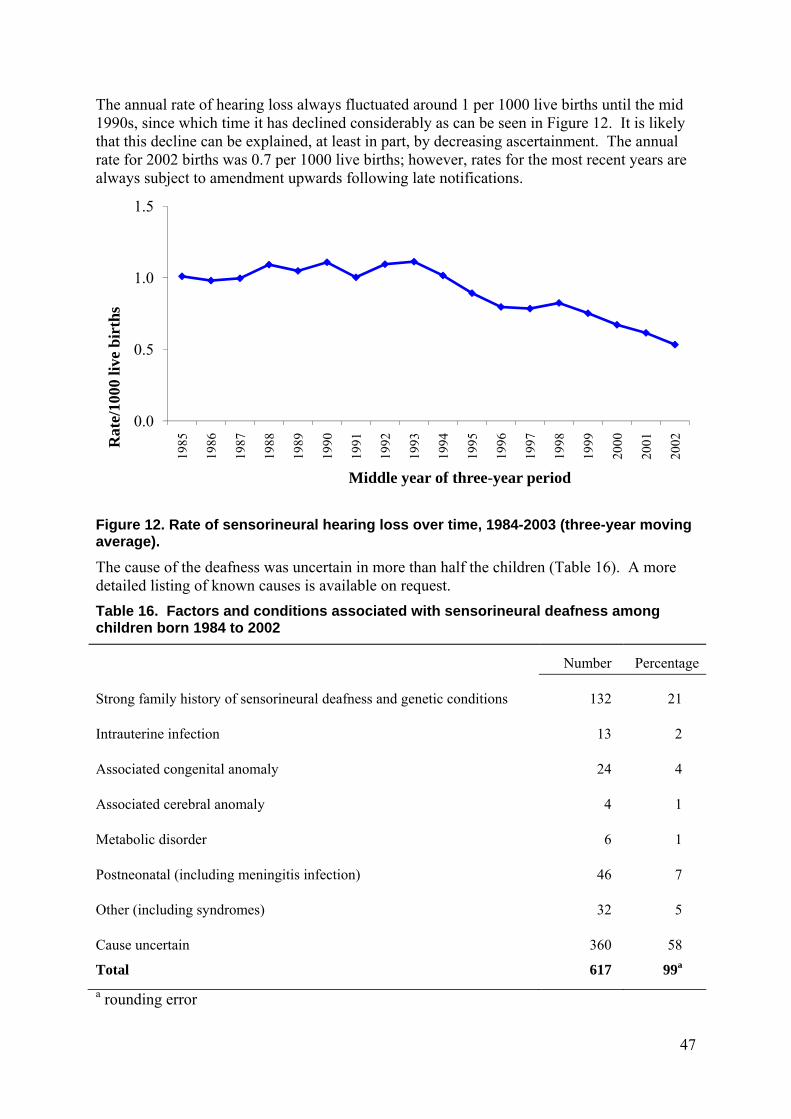
The annual rate of hearing loss always fluctuated around 1 per 1000 live births until the mid 1990s, since which time it has declined considerably as can be seen in Figure 12. It is likely that this decline can be explained, at least in part, by decreasing ascertainment. The annual rate for 2002 births was 0.7 per 1000 live births; however, rates for the most recent years are always subject to amendment upwards following late notifications.
Figure 12. Rate of sensorineural hearing loss over time, 1984-2003 (three-year moving average).
The cause of the deafness was uncertain in more than half the children (Table 16). A more detailed listing of known causes is available on request.
Table 16. Factors and conditions associated with sensorineural deafness among children born 1984 to 2002
Number Percentage
Strong family history of sensorineural deafness and genetic conditions
132 21
Intrauterine infection
13 2
Associated congenital anomaly
24 4
Associated cerebral anomaly
4 1
Metabolic disorder
6 1
Postneonatal (including meningitis infection)
46 7
Other (including syndromes)
32 5
Cause uncertain 360 58
Total 617 99a
a rounding error
0.0
0.5
1.0
1.5
1985
1986
1987
1988
1989
1990
1991
1992
1993
1994
1995
1996
1997
1998
1999
2000
2001
2002R
ate/
1000
live
bir
ths
Middle year of three-year period
48
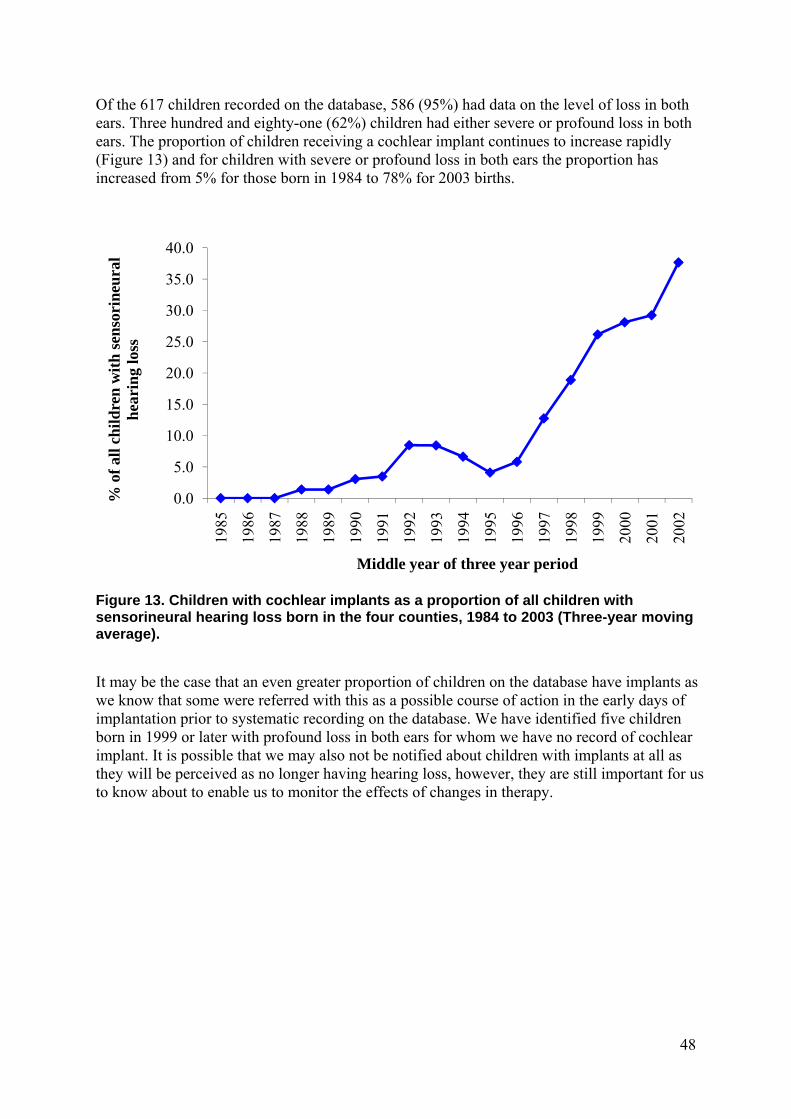
Of the 617 children recorded on the database, 586 (95%) had data on the level of loss in both ears. Three hundred and eighty-one (62%) children had either severe or profound loss in both ears. The proportion of children receiving a cochlear implant continues to increase rapidly (Figure 13) and for children with severe or profound loss in both ears the proportion has increased from 5% for those born in 1984 to 78% for 2003 births.
Figure 13. Children with cochlear implants as a proportion of all children with sensorineural hearing loss born in the four counties, 1984 to 2003 (Three-year moving average).
It may be the case that an even greater proportion of children on the database have implants as we know that some were referred with this as a possible course of action in the early days of implantation prior to systematic recording on the database. We have identified five children born in 1999 or later with profound loss in both ears for whom we have no record of cochlear implant. It is possible that we may also not be notified about children with implants at all as they will be perceived as no longer having hearing loss, however, they are still important for us to know about to enable us to monitor the effects of changes in therapy.
0.0
5.0
10.0
15.0
20.0
25.0
30.0
35.0
40.0
1985
1986
1987
1988
1989
1990
1991
1992
1993
1994
1995
1996
1997
1998
1999
2000
2001
2002
% o
f al
l ch
ild
ren
wit
h s
enso
rin
eura
l h
eari
ng
loss
Middle year of three year period
49
VISION LOSS
4Child Definition: Corrected visual acuity in the better eye of 6/18 or less. If visual acuity cannot be measured, an assessment of the degree of visual impairment is made on the behavioural responses of the child. Children with intra-ocular implants are included on the database.
___________________
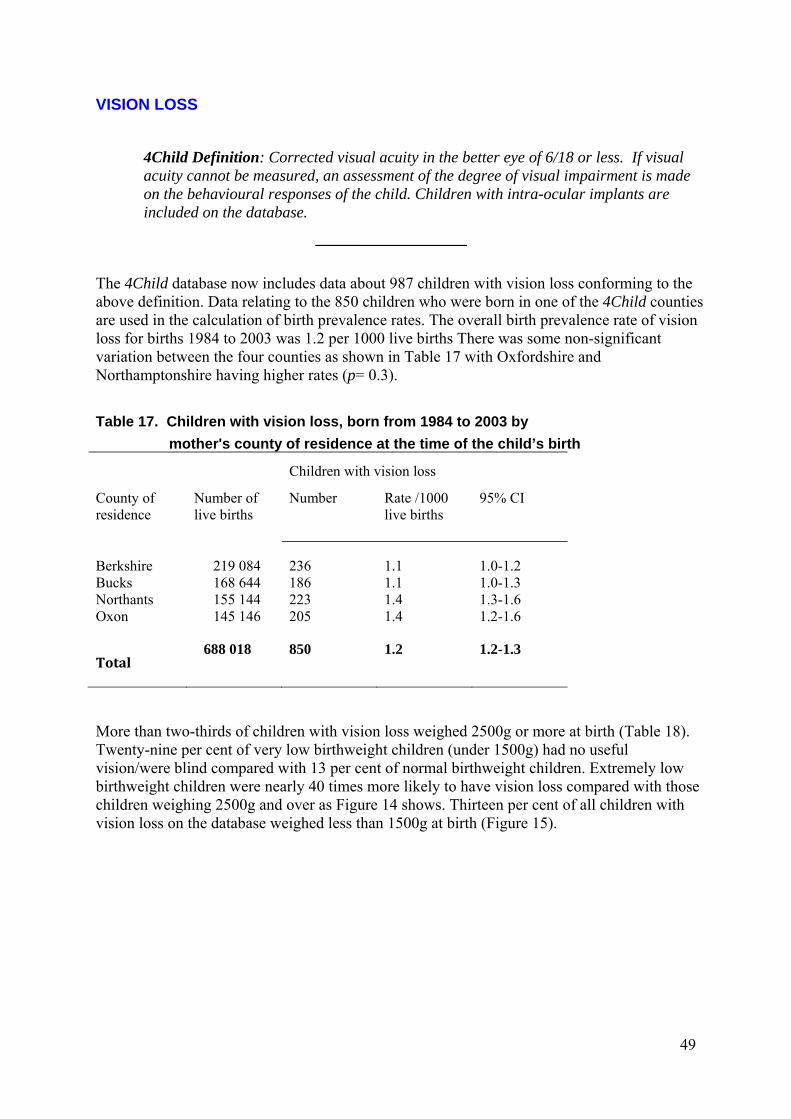
The 4Child database now includes data about 987 children with vision loss conforming to the above definition. Data relating to the 850 children who were born in one of the 4Child counties are used in the calculation of birth prevalence rates. The overall birth prevalence rate of vision loss for births 1984 to 2003 was 1.2 per 1000 live births There was some non-significant variation between the four counties as shown in Table 17 with Oxfordshire and Northamptonshire having higher rates (p= 0.3).
Table 17. Children with vision loss, born from 1984 to 2003 by
mother's county of residence at the time of the child’s birth
Children with vision loss
County of residence
Number of live births
Number
Rate /1000 live births
95% CI
Berkshire 219 084 236 1.1 1.0-1.2Bucks 168 644 186 1.1 1.0-1.3Northants 155 144 223 1.4 1.3-1.6Oxon 145 146 205 1.4 1.2-1.6
Total 688 018 850 1.2 1.2-1.3
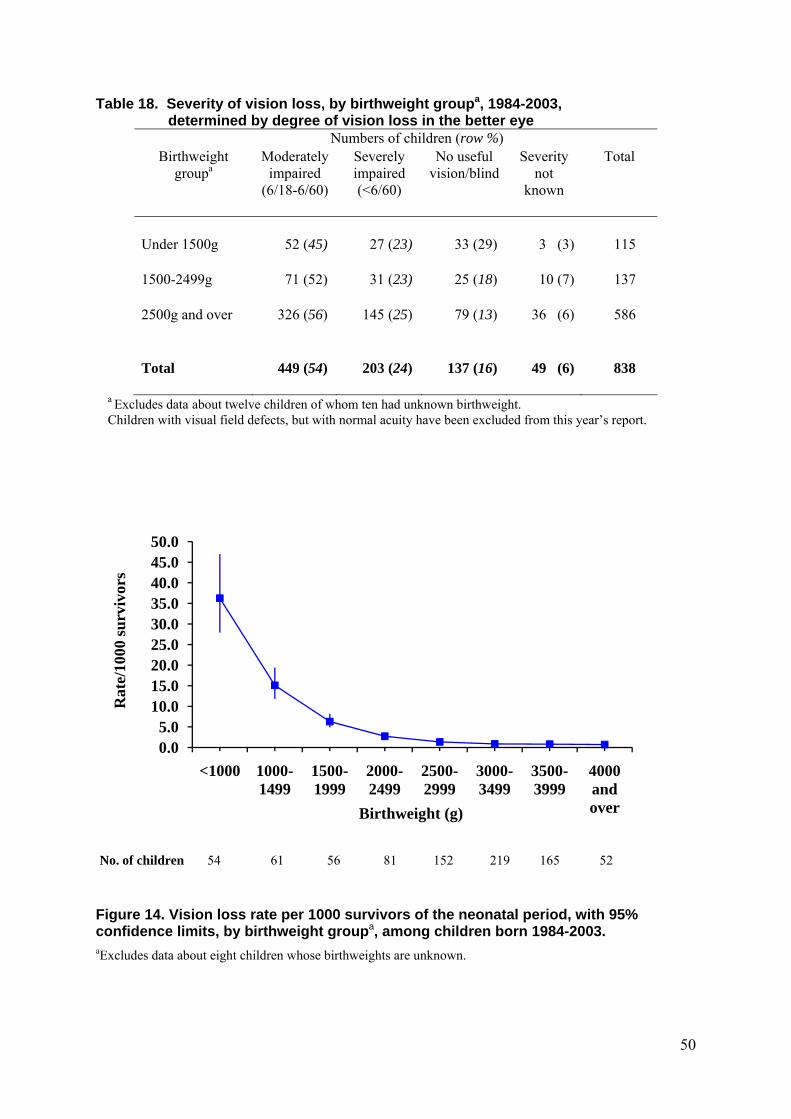
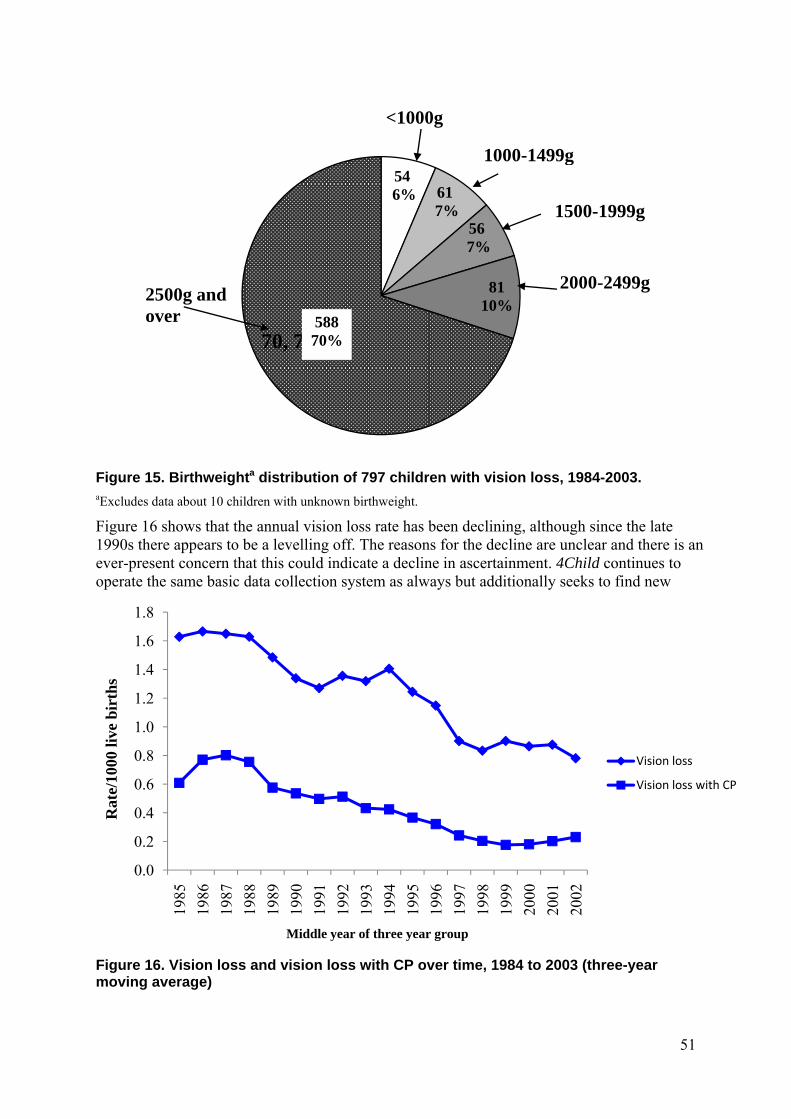
More than two-thirds of children with vision loss weighed 2500g or more at birth (Table 18). Twenty-nine per cent of very low birthweight children (under 1500g) had no useful vision/were blind compared with 13 per cent of normal birthweight children. Extremely low birthweight children were nearly 40 times more likely to have vision loss compared with those children weighing 2500g and over as Figure 14 shows. Thirteen per cent of all children with vision loss on the database weighed less than 1500g at birth (Figure 15).
50
Table 18. Severity of vision loss, by birthweight groupa, 1984-2003, determined by degree of vision loss in the better eye
Numbers of children (row %) Birthweight
groupa Moderately
impaired (6/18-6/60)
Severely impaired (<6/60)
No useful vision/blind
Severity not
known
Total
Under 1500g
52 (45) 27 (23) 33 (29) 3 (3) 115
1500-2499g
71 (52) 31 (23) 25 (18) 10 (7) 137
2500g and over
326 (56) 145 (25) 79 (13) 36 (6) 586
Total 449 (54) 203 (24) 137 (16) 49 (6) 838
a Excludes data about twelve children of whom ten had unknown birthweight. Children with visual field defects, but with normal acuity have been excluded from this year’s report.
Figure 14. Vision loss rate per 1000 survivors of the neonatal period, with 95% confidence limits, by birthweight groupa, among children born 1984-2003. aExcludes data about eight children whose birthweights are unknown.
0.05.0
10.015.020.025.030.035.040.045.050.0
<1000 1000-1499
1500-1999
2000-2499
2500-2999
3000-3499
3500-3999
4000 and over
Rat
e/10
00 s
urv
ivor
s
Birthweight (g)
No. of children 54 61 56 81 152 219 165 52
51
Figure 15. Birthweighta distribution of 797 children with vision loss, 1984-2003. aExcludes data about 10 children with unknown birthweight.
Figure 16 shows that the annual vision loss rate has been declining, although since the late 1990s there appears to be a levelling off. The reasons for the decline are unclear and there is an ever-present concern that this could indicate a decline in ascertainment. 4Child continues to operate the same basic data collection system as always but additionally seeks to find new
Figure 16. Vision loss and vision loss with CP over time, 1984 to 2003 (three-year moving average)
546% 61
7%567%
8110%
70, 70%
<1000g
1000-1499g
1500-1999g
2000-2499g2500g andover 588
70%
0.0
0.2
0.4
0.6
0.8
1.0
1.2
1.4
1.6
1.8
1985
1986
1987
1988
1989
1990
1991
1992
1993
1994
1995
1996
1997
1998
1999
2000
2001
2002
Rat
e/10
00 li
ve b
irth
s
Middle year of three year group
Vision loss
Vision loss with CP
52
sources of notifications to address this concern. Recent work by Bodeau-Livinec et al9 which used data from 4Child, explored the possibility of a decline in notification and found this to be unlikely to completely explain the decrease.
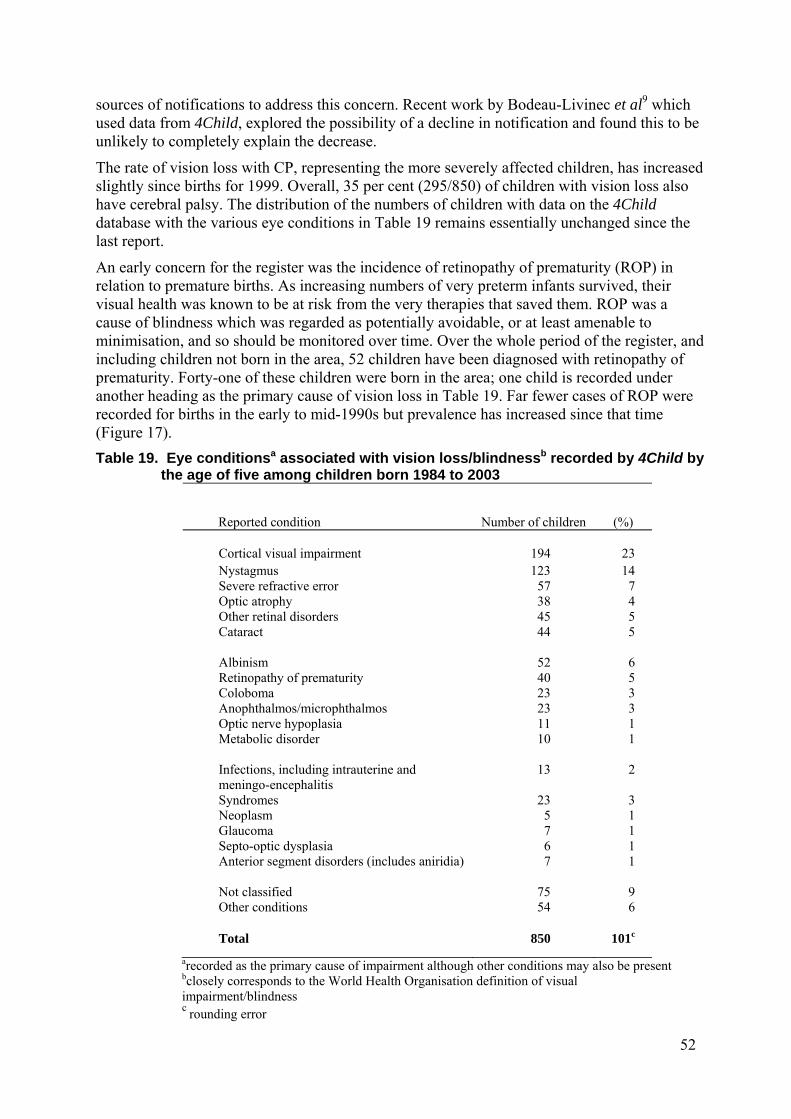
The rate of vision loss with CP, representing the more severely affected children, has increased slightly since births for 1999. Overall, 35 per cent (295/850) of children with vision loss also have cerebral palsy. The distribution of the numbers of children with data on the 4Child database with the various eye conditions in Table 19 remains essentially unchanged since the last report.
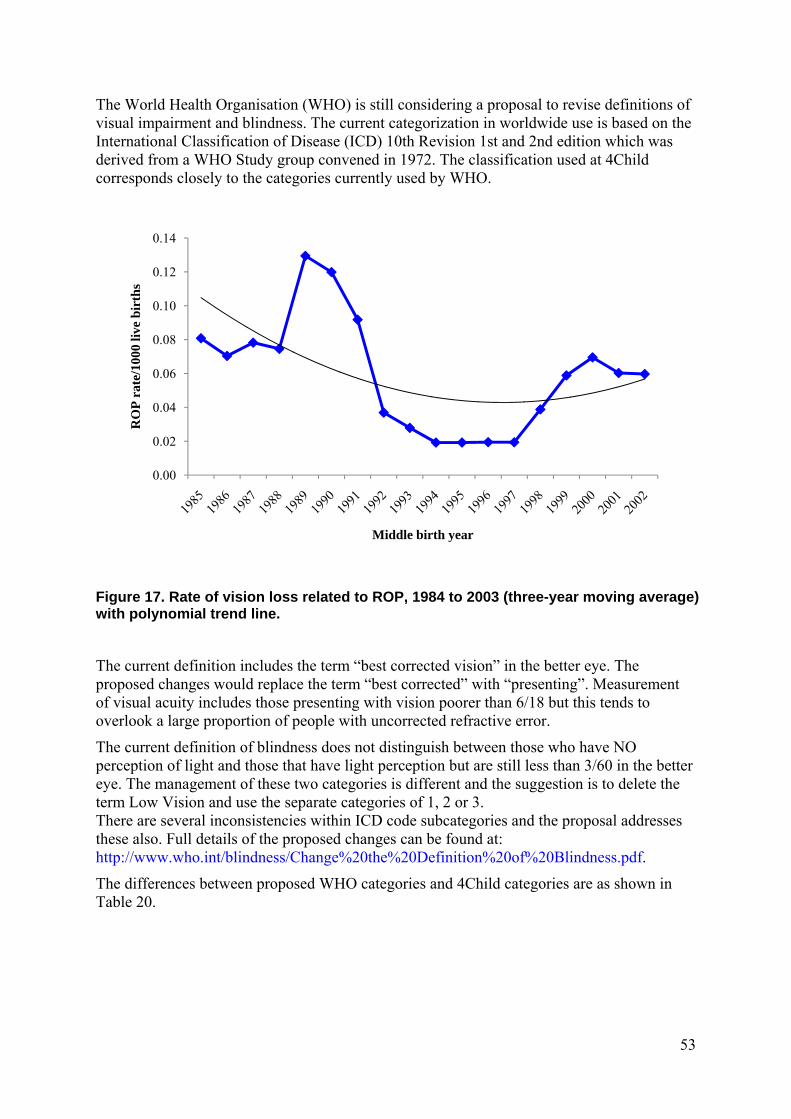
An early concern for the register was the incidence of retinopathy of prematurity (ROP) in relation to premature births. As increasing numbers of very preterm infants survived, their visual health was known to be at risk from the very therapies that saved them. ROP was a cause of blindness which was regarded as potentially avoidable, or at least amenable to minimisation, and so should be monitored over time. Over the whole period of the register, and including children not born in the area, 52 children have been diagnosed with retinopathy of prematurity. Forty-one of these children were born in the area; one child is recorded under another heading as the primary cause of vision loss in Table 19. Far fewer cases of ROP were recorded for births in the early to mid-1990s but prevalence has increased since that time (Figure 17).
Table 19. Eye conditionsa associated with vision loss/blindnessb recorded by 4Child by the age of five among children born 1984 to 2003
Reported condition
Number of children
(%)
Cortical visual impairment 194 23 Nystagmus 123 14 Severe refractive error 57 7 Optic atrophy 38 4 Other retinal disorders 45 5 Cataract 44 5 Albinism 52 6 Retinopathy of prematurity 40 5 Coloboma 23 3 Anophthalmos/microphthalmos 23 3 Optic nerve hypoplasia 11 1 Metabolic disorder 10 1 Infections, including intrauterine and meningo-encephalitis
13 2
Syndromes 23 3 Neoplasm 5 1 Glaucoma 7 1 Septo-optic dysplasia 6 1 Anterior segment disorders (includes aniridia) 7 1 Not classified 75 9 Other conditions 54 6 Total 850 101c
arecorded as the primary cause of impairment although other conditions may also be present
bclosely corresponds to the World Health Organisation definition of visual impairment/blindness c rounding error
53
The World Health Organisation (WHO) is still considering a proposal to revise definitions of visual impairment and blindness. The current categorization in worldwide use is based on the International Classification of Disease (ICD) 10th Revision 1st and 2nd edition which was derived from a WHO Study group convened in 1972. The classification used at 4Child corresponds closely to the categories currently used by WHO.
Figure 17. Rate of vision loss related to ROP, 1984 to 2003 (three-year moving average) with polynomial trend line.
The current definition includes the term “best corrected vision” in the better eye. The proposed changes would replace the term “best corrected” with “presenting”. Measurement of visual acuity includes those presenting with vision poorer than 6/18 but this tends to overlook a large proportion of people with uncorrected refractive error.
The current definition of blindness does not distinguish between those who have NO perception of light and those that have light perception but are still less than 3/60 in the better eye. The management of these two categories is different and the suggestion is to delete the term Low Vision and use the separate categories of 1, 2 or 3. There are several inconsistencies within ICD code subcategories and the proposal addresses these also. Full details of the proposed changes can be found at: http://www.who.int/blindness/Change%20the%20Definition%20of%20Blindness.pdf.
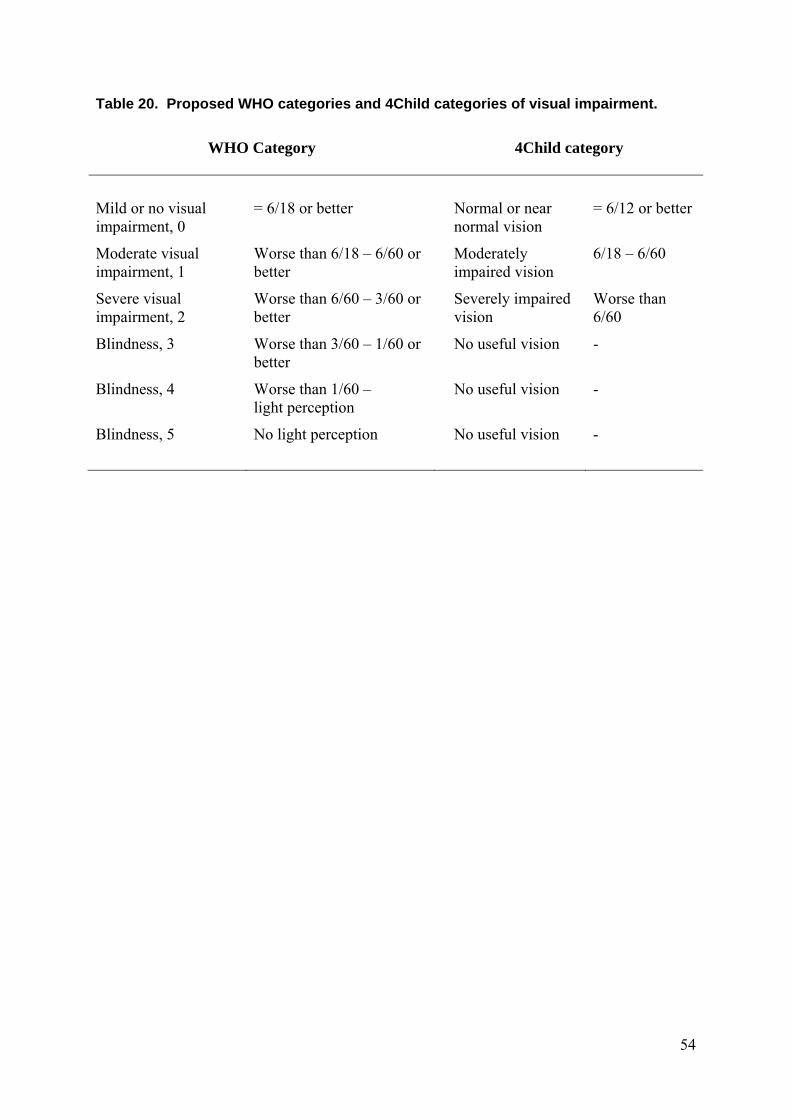
The differences between proposed WHO categories and 4Child categories are as shown in Table 20.
0.00
0.02
0.04
0.06
0.08
0.10
0.12
0.14
RO
P r
ate/
1000
live
bir
ths
Middle birth year
54
Table 20. Proposed WHO categories and 4Child categories of visual impairment.
WHO Category
4Child category
Mild or no visual impairment, 0
= 6/18 or better Normal or near normal vision
= 6/12 or better
Moderate visual impairment, 1
Worse than 6/18 – 6/60 or better
Moderately impaired vision
6/18 – 6/60
Severe visual impairment, 2
Worse than 6/60 – 3/60 or better
Severely impaired vision
Worse than 6/60
Blindness, 3 Worse than 3/60 – 1/60 or better
No useful vision -
Blindness, 4 Worse than 1/60 – light perception
No useful vision -
Blindness, 5 No light perception No useful vision -
55
CEREBRAL PALSY
4Child Definition: A permanent impairment of voluntary movement or posture presumed to be due to permanent damage to the immature brain. Data about children with progressive disorders and those with profound hypotonia and no other neurological signs (often associated with severe cognitive/ intellectual delay) are excluded. Data about children who die aged less than one year of age will also be excluded. Cerebral palsy is an umbrella term which includes a heterogeneous group of conditions and can arise at any point during brain development.
Definitions for cerebral palsy have evolved over the decades much as the condition itself evolves with the development of a child. Definitions are critically important in being able to describe the condition and how it affects different children. 4Child is a participant in the Surveillance of Cerebral Palsy in Europe collaboration (SCPE) and it is the definition agreed during plenary debates at SCPE that is used to describe the range of motor impairments affecting children on the 4Child database (see Appendix 7).
There were 1360 children with cerebral palsy, born to mothers living in the four counties between 1984 and 2003 and notified to 4Child. As Table 22 shows, this gives an overall cerebral palsy birth prevalence of 2.0 per 1000 live births. Eighty-seven children (6%) are understood to have cerebral palsy that was related to an identifiable event occurring after the first 28 days of life and are classified as having CP of postneonatal origin or what is sometimes called, late impairment. More information about children with cerebral palsy of postneonatal origin can be found on page 77. The rate of cerebral palsy, excluding cases arising postneonatally, is 1.9 per 1000 live births. Further detail on prevalence rates can be found in Table 30.
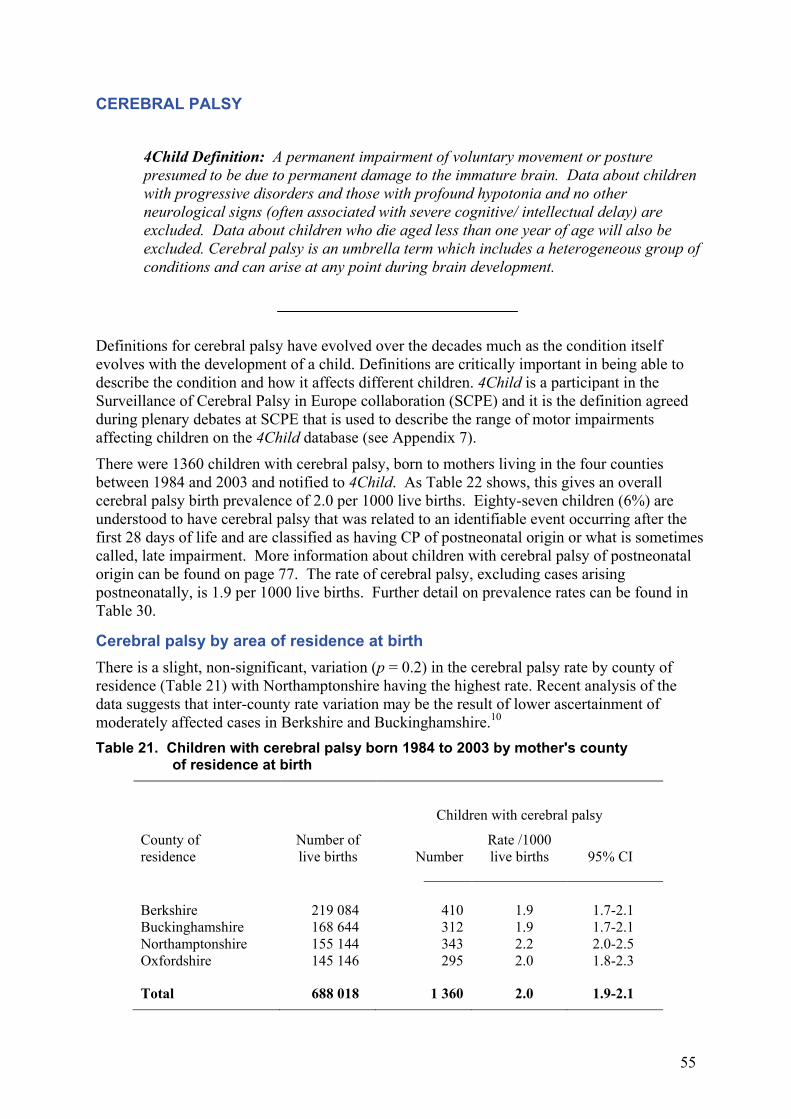
Cerebral palsy by area of residence at birth There is a slight, non-significant, variation (p = 0.2) in the cerebral palsy rate by county of residence (Table 21) with Northamptonshire having the highest rate. Recent analysis of the data suggests that inter-county rate variation may be the result of lower ascertainment of moderately affected cases in Berkshire and Buckinghamshire.10 Table 21. Children with cerebral palsy born 1984 to 2003 by mother's county
of residence at birth
Children with cerebral palsy
County of residence
Number of live births
Number
Rate /1000 live births
95% CI
Berkshire 219 084 410 1.9 1.7-2.1 Buckinghamshire 168 644 312 1.9 1.7-2.1 Northamptonshire 155 144 343 2.2 2.0-2.5 Oxfordshire 145 146 295 2.0 1.8-2.3 Total 688 018 1 360 2.0 1.9-2.1
56
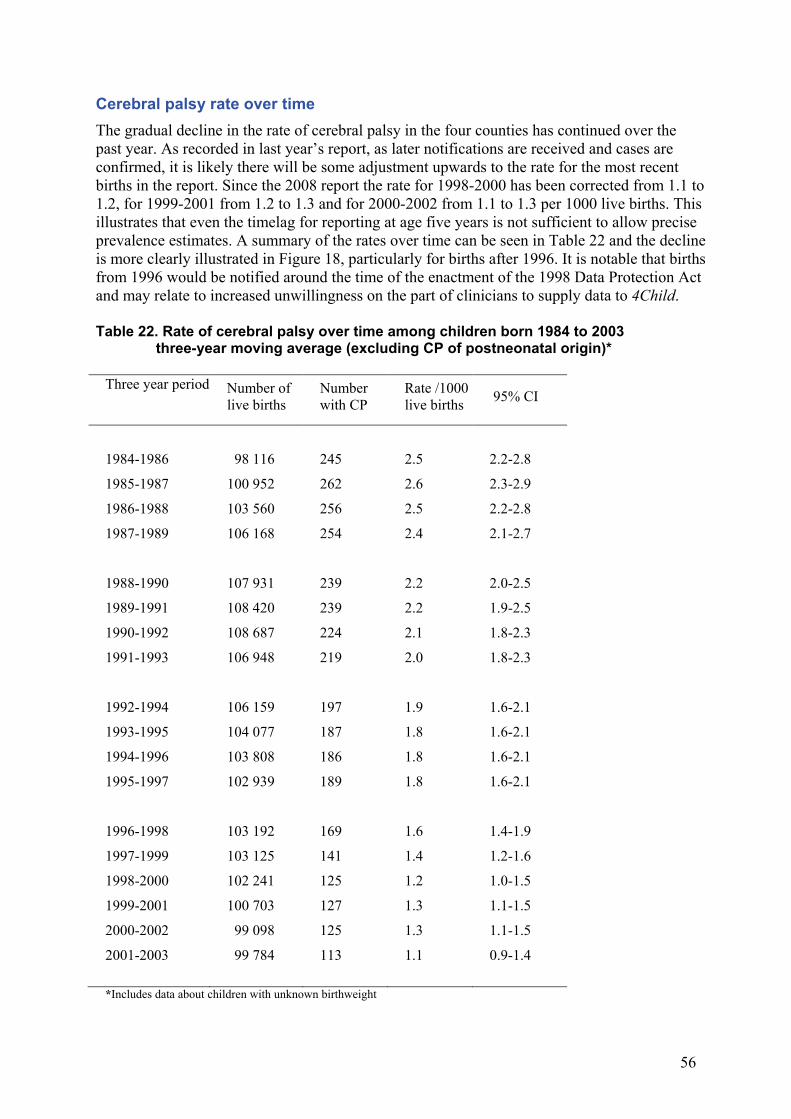
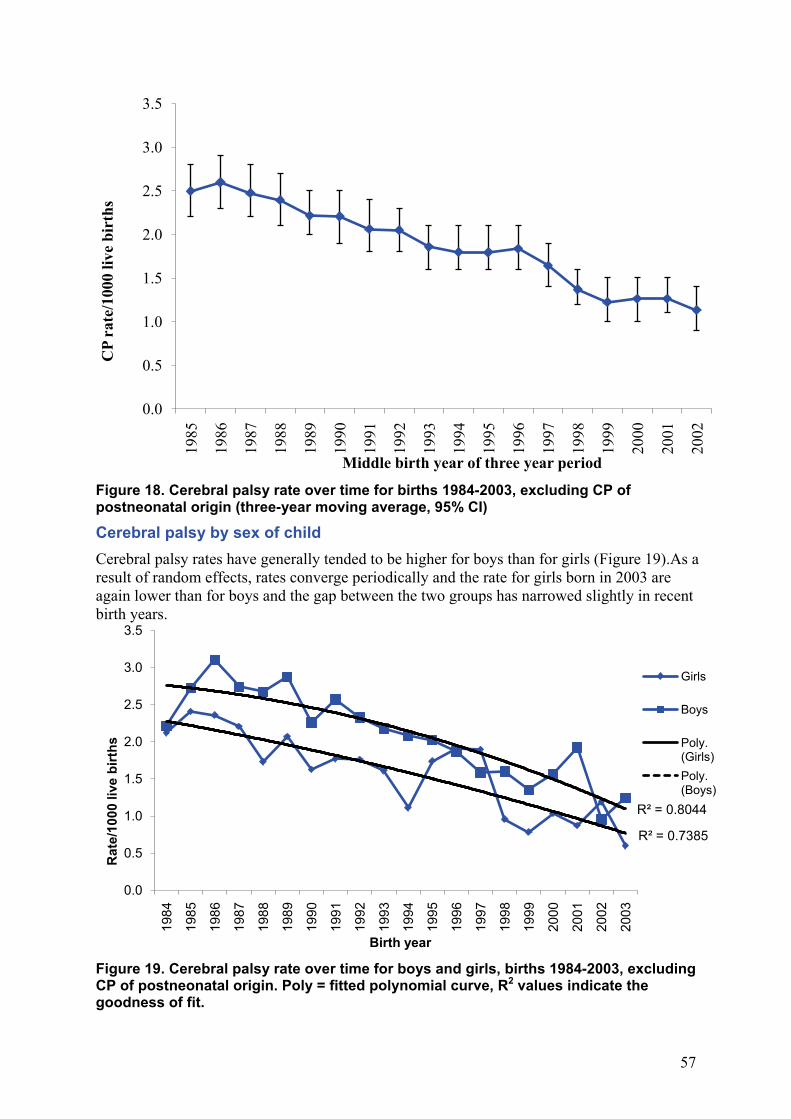
Cerebral palsy rate over time The gradual decline in the rate of cerebral palsy in the four counties has continued over the past year. As recorded in last year’s report, as later notifications are received and cases are confirmed, it is likely there will be some adjustment upwards to the rate for the most recent births in the report. Since the 2008 report the rate for 1998-2000 has been corrected from 1.1 to 1.2, for 1999-2001 from 1.2 to 1.3 and for 2000-2002 from 1.1 to 1.3 per 1000 live births. This illustrates that even the timelag for reporting at age five years is not sufficient to allow precise prevalence estimates. A summary of the rates over time can be seen in Table 22 and the decline is more clearly illustrated in Figure 18, particularly for births after 1996. It is notable that births from 1996 would be notified around the time of the enactment of the 1998 Data Protection Act and may relate to increased unwillingness on the part of clinicians to supply data to 4Child. Table 22. Rate of cerebral palsy over time among children born 1984 to 2003
three-year moving average (excluding CP of postneonatal origin)*
Three year period
Number of live births
Number with CP
Rate /1000 live births 95% CI
1984-1986 98 116 245 2.5 2.2-2.8
1985-1987 100 952 262 2.6 2.3-2.9
1986-1988 103 560 256 2.5 2.2-2.8
1987-1989 106 168 254 2.4 2.1-2.7
1988-1990 107 931 239 2.2 2.0-2.5
1989-1991 108 420 239 2.2 1.9-2.5
1990-1992 108 687 224 2.1 1.8-2.3
1991-1993 106 948 219 2.0 1.8-2.3
1992-1994 106 159 197 1.9 1.6-2.1
1993-1995 104 077 187 1.8 1.6-2.1
1994-1996 103 808 186 1.8 1.6-2.1
1995-1997 102 939 189 1.8 1.6-2.1
1996-1998 103 192 169 1.6 1.4-1.9
1997-1999 103 125 141 1.4 1.2-1.6
1998-2000 102 241 125 1.2 1.0-1.5
1999-2001 100 703 127 1.3 1.1-1.5
2000-2002 99 098 125 1.3 1.1-1.5
2001-2003 99 784 113 1.1 0.9-1.4
*Includes data about children with unknown birthweight
57
Figure 18. Cerebral palsy rate over time for births 1984-2003, excluding CP of postneonatal origin (three-year moving average, 95% CI)
Cerebral palsy by sex of child Cerebral palsy rates have generally tended to be higher for boys than for girls (Figure 19).As a result of random effects, rates converge periodically and the rate for girls born in 2003 are again lower than for boys and the gap between the two groups has narrowed slightly in recent birth years.
Figure 19. Cerebral palsy rate over time for boys and girls, births 1984-2003, excluding CP of postneonatal origin. Poly = fitted polynomial curve, R2 values indicate the goodness of fit.
0.0
0.5
1.0
1.5
2.0
2.5
3.0
3.5
1985
1986
1987
1988
1989
1990
1991
1992
1993
1994
1995
1996
1997
1998
1999
2000
2001
2002
CP
rate
/100
0 liv
e bi
rths
Middle birth year of three year period
R² = 0.7385
R² = 0.8044
0.0
0.5
1.0
1.5
2.0
2.5
3.0
3.5
1984
1985
1986
1987
1988
1989
1990
1991
1992
1993
1994
1995
1996
1997
1998
1999
2000
2001
2002
2003
Rat
e/10
00 li
ve b
irths
Birth year
Girls
Boys
Poly. (Girls)Poly. (Boys)
58
The difference in the rates between boys and girls is most apparent in the 1500-2499g birthweight group where the relative risk for boys is almost twice that for girls of the same weight, as Table 23 shows. Whereas the relative risk for boys of all birthweights is only 30 per cent greater than for girls Table 23. Children with cerebral palsy born from 1984 to 2003 by sex and by birthweight group (excluding cerebral palsy of postneonatal origin)
Number of live births
Number with cerebral palsy
Rate of cerebral palsy/1000 live
births
Relative risk
boys/girls
95% CI
Birthweight (g)
Boys Girls Boys Girls Boys Girls
Under 1500 3 507 3 317 151 112 43.1 33.8 1.3 1.0-1.6 1500-2499 18 276 20 584 193 124 10.6 6.0 1.8 1.4-2.2 2500 or over 326 787 306 867 394 289 1.2 0.9 1.3 1.1-1.5 Unknown 4 447 4 233 3 7 - - - - All 353 017 335 001 741 532 2.1 1.6 1.3 1.2-1.5
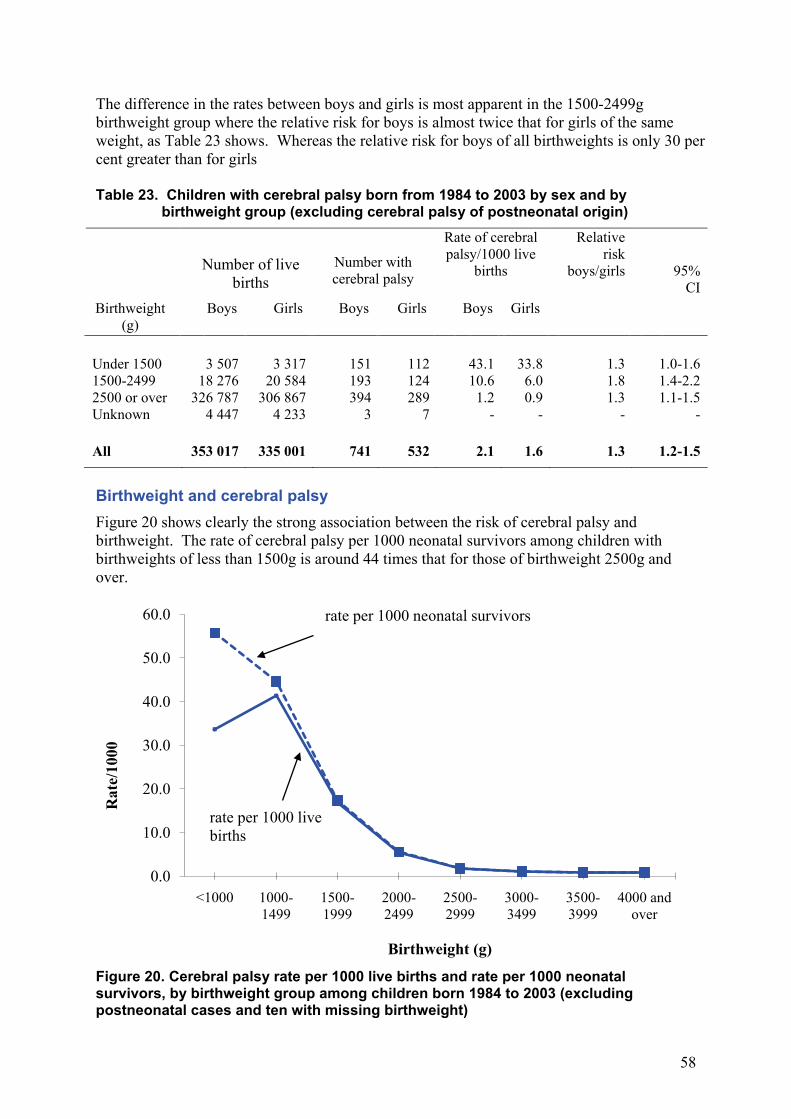
Birthweight and cerebral palsy Figure 20 shows clearly the strong association between the risk of cerebral palsy and birthweight. The rate of cerebral palsy per 1000 neonatal survivors among children with birthweights of less than 1500g is around 44 times that for those of birthweight 2500g and over.
Figure 20. Cerebral palsy rate per 1000 live births and rate per 1000 neonatal survivors, by birthweight group among children born 1984 to 2003 (excluding postneonatal cases and ten with missing birthweight)
0.0
10.0
20.0
30.0
40.0
50.0
60.0
<1000 1000-1499
1500-1999
2000-2499
2500-2999
3000-3499
3500-3999
4000 and over
Rat
e/10
00
Birthweight (g)
rate per 1000 neonatal survivors
rate per 1000 live births
59
The rate per 1000 live births for those babies who weighed less than 1000g appears lower than the 1000g to 1499g group but this is probably due to the high mortality before a diagnosis of cerebral palsy could be made among these extremely low birthweight babies. When a child survives the neonatal period but dies before one year and is said to have cerebral palsy e.g. on the death certificate, their data are not included on the database (see page 32) as a progressive cause of motor impairment cannot be excluded..
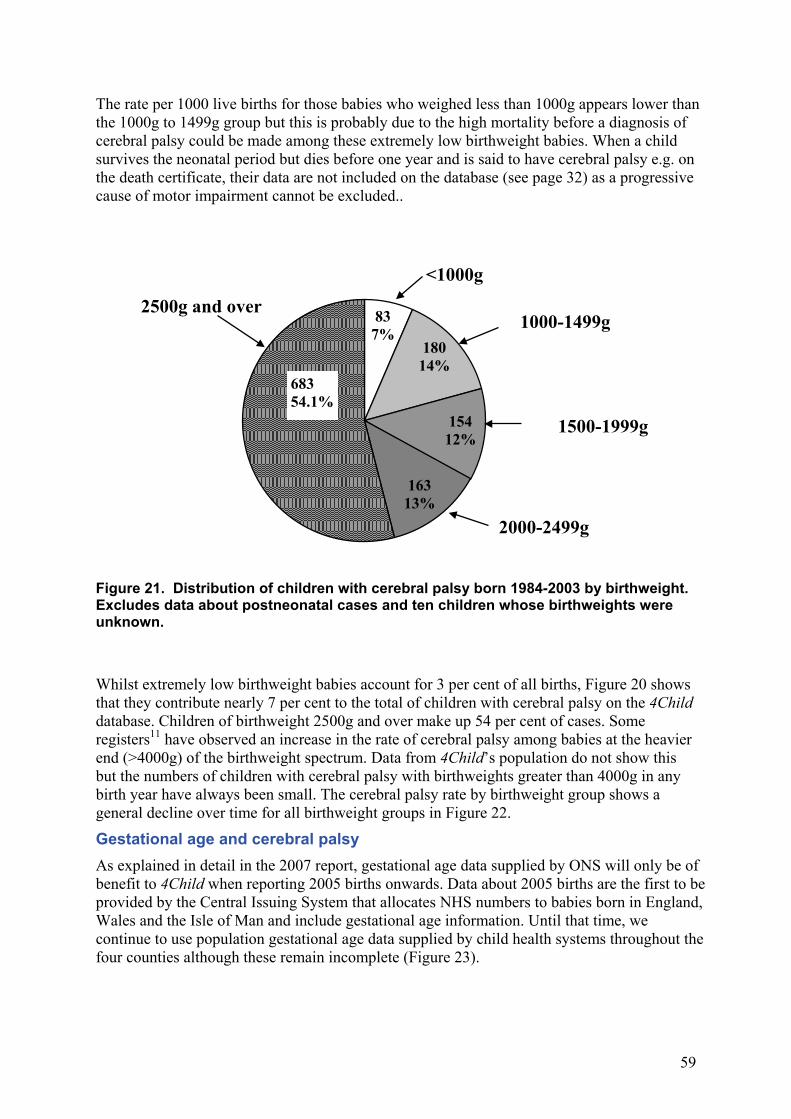
Figure 21. Distribution of children with cerebral palsy born 1984-2003 by birthweight. Excludes data about postneonatal cases and ten children whose birthweights were unknown.
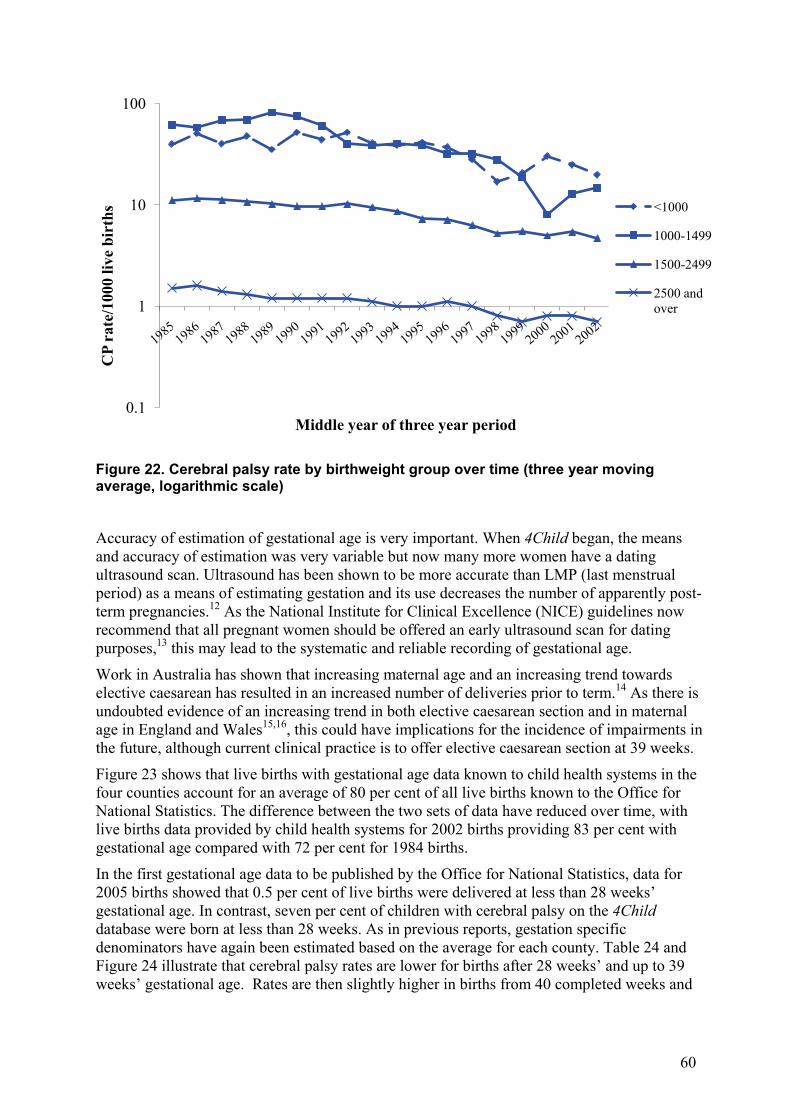
Whilst extremely low birthweight babies account for 3 per cent of all births, Figure 20 shows that they contribute nearly 7 per cent to the total of children with cerebral palsy on the 4Child database. Children of birthweight 2500g and over make up 54 per cent of cases. Some registers11 have observed an increase in the rate of cerebral palsy among babies at the heavier end (>4000g) of the birthweight spectrum. Data from 4Child’s population do not show this but the numbers of children with cerebral palsy with birthweights greater than 4000g in any birth year have always been small. The cerebral palsy rate by birthweight group shows a general decline over time for all birthweight groups in Figure 22.
Gestational age and cerebral palsy As explained in detail in the 2007 report, gestational age data supplied by ONS will only be of benefit to 4Child when reporting 2005 births onwards. Data about 2005 births are the first to be provided by the Central Issuing System that allocates NHS numbers to babies born in England, Wales and the Isle of Man and include gestational age information. Until that time, we continue to use population gestational age data supplied by child health systems throughout the four counties although these remain incomplete (Figure 23).
837%
18014%
15412%
16313%
68354.1%
<1000g
1000-1499g
1500-1999g
2000-2499g
2500g and over
60
Figure 22. Cerebral palsy rate by birthweight group over time (three year moving average, logarithmic scale)
Accuracy of estimation of gestational age is very important. When 4Child began, the means and accuracy of estimation was very variable but now many more women have a dating ultrasound scan. Ultrasound has been shown to be more accurate than LMP (last menstrual period) as a means of estimating gestation and its use decreases the number of apparently post-term pregnancies.12 As the National Institute for Clinical Excellence (NICE) guidelines now recommend that all pregnant women should be offered an early ultrasound scan for dating purposes,13 this may lead to the systematic and reliable recording of gestational age.
Work in Australia has shown that increasing maternal age and an increasing trend towards elective caesarean has resulted in an increased number of deliveries prior to term.14 As there is undoubted evidence of an increasing trend in both elective caesarean section and in maternal age in England and Wales15,16, this could have implications for the incidence of impairments in the future, although current clinical practice is to offer elective caesarean section at 39 weeks.
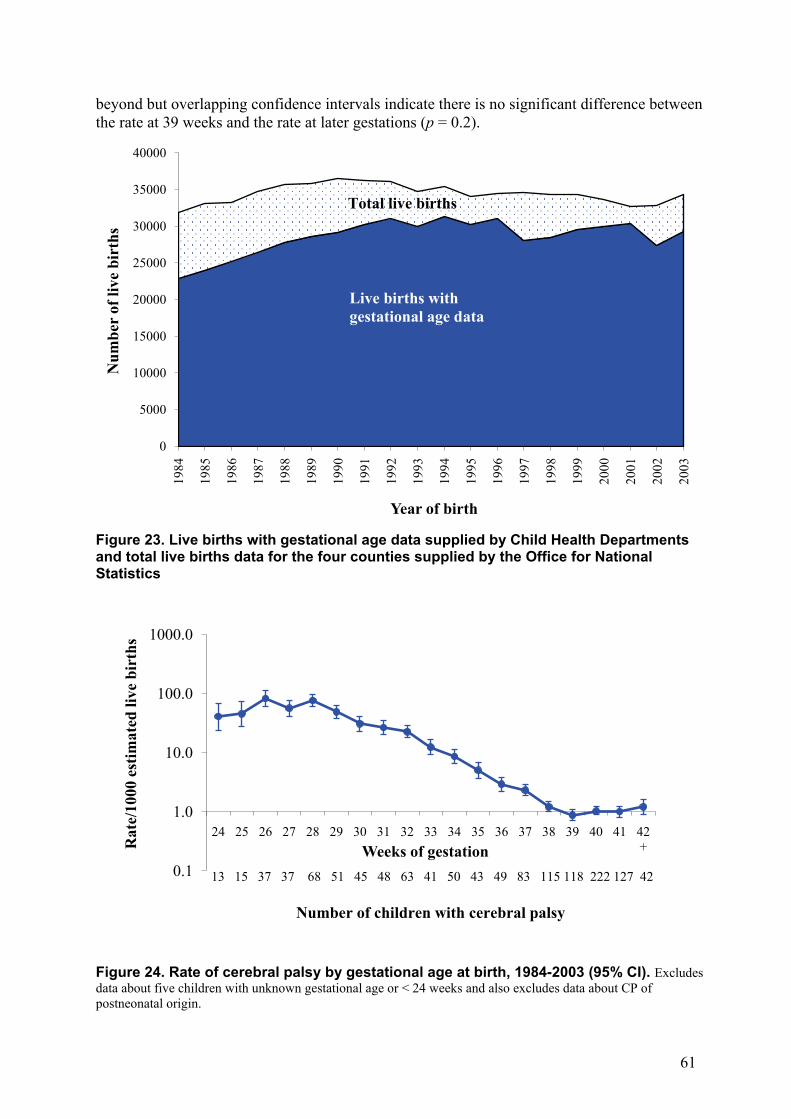
Figure 23 shows that live births with gestational age data known to child health systems in the four counties account for an average of 80 per cent of all live births known to the Office for National Statistics. The difference between the two sets of data have reduced over time, with live births data provided by child health systems for 2002 births providing 83 per cent with gestational age compared with 72 per cent for 1984 births.
In the first gestational age data to be published by the Office for National Statistics, data for 2005 births showed that 0.5 per cent of live births were delivered at less than 28 weeks’ gestational age. In contrast, seven per cent of children with cerebral palsy on the 4Child database were born at less than 28 weeks. As in previous reports, gestation specific denominators have again been estimated based on the average for each county. Table 24 and Figure 24 illustrate that cerebral palsy rates are lower for births after 28 weeks’ and up to 39 weeks’ gestational age. Rates are then slightly higher in births from 40 completed weeks and
0.1
1
10
100C
P ra
te/1
000
live
birt
hs
Middle year of three year period
<1000
1000-1499
1500-2499
2500 and over
61
beyond but overlapping confidence intervals indicate there is no significant difference between the rate at 39 weeks and the rate at later gestations (p = 0.2).
Figure 23. Live births with gestational age data supplied by Child Health Departments and total live births data for the four counties supplied by the Office for National Statistics
Figure 24. Rate of cerebral palsy by gestational age at birth, 1984-2003 (95% CI). Excludes data about five children with unknown gestational age or < 24 weeks and also excludes data about CP of postneonatal origin.
0
5000
10000
15000
20000
25000
30000
35000
40000
1984
1985
1986
1987
1988
1989
1990
1991
1992
1993
1994
1995
1996
1997
1998
1999
2000
2001
2002
2003
Num
ber
of li
ve b
irth
s
Year of birth
Total live births
Live births with gestational age data
0.1
1.0
10.0
100.0
1000.0
24 25 26 27 28 29 30 31 32 33 34 35 36 37 38 39 40 41 42 +R
ate/
1000
est
imat
ed li
ve b
irth
s
Weeks of gestation13 15 37 37 68 51 45 48 63 41 50 43 49 83 115 118 222 127 42
Number of children with cerebral palsy
62
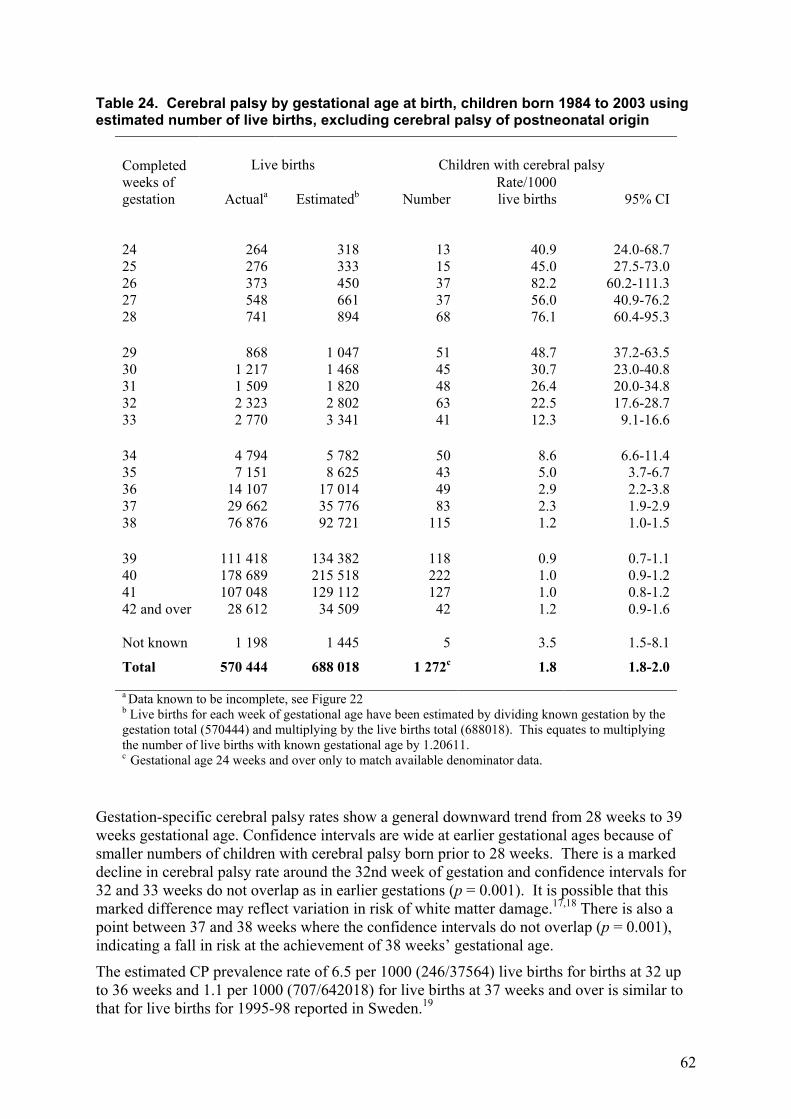
Table 24. Cerebral palsy by gestational age at birth, children born 1984 to 2003 using estimated number of live births, excluding cerebral palsy of postneonatal origin
Completed weeks of gestation
Live births Children with cerebral palsy
Actuala Estimatedb Number Rate/1000 live births 95% CI
24 264 318 13 40.9 24.0-68.7 25 276 333 15 45.0 27.5-73.0 26 373 450 37 82.2 60.2-111.3 27 548 661 37 56.0 40.9-76.2 28 741 894 68 76.1 60.4-95.3 29 868 1 047 51 48.7 37.2-63.5 30 1 217 1 468 45 30.7 23.0-40.8 31 1 509 1 820 48 26.4 20.0-34.8 32 2 323 2 802 63 22.5 17.6-28.7 33 2 770 3 341 41 12.3 9.1-16.6 34 4 794 5 782 50 8.6 6.6-11.4 35 7 151 8 625 43 5.0 3.7-6.7 36 14 107 17 014 49 2.9 2.2-3.8 37 29 662 35 776 83 2.3 1.9-2.9 38 76 876 92 721 115 1.2 1.0-1.5 39 111 418 134 382 118 0.9 0.7-1.1 40 178 689 215 518 222 1.0 0.9-1.2 41 107 048 129 112 127 1.0 0.8-1.2 42 and over 28 612 34 509 42 1.2 0.9-1.6 Not known 1 198 1 445 5 3.5 1.5-8.1 Total 570 444 688 018 1 272c 1.8 1.8-2.0
a Data known to be incomplete, see Figure 22 b Live births for each week of gestational age have been estimated by dividing known gestation by the gestation total (570444) and multiplying by the live births total (688018). This equates to multiplying the number of live births with known gestational age by 1.20611. c Gestational age 24 weeks and over only to match available denominator data.
Gestation-specific cerebral palsy rates show a general downward trend from 28 weeks to 39 weeks gestational age. Confidence intervals are wide at earlier gestational ages because of smaller numbers of children with cerebral palsy born prior to 28 weeks. There is a marked decline in cerebral palsy rate around the 32nd week of gestation and confidence intervals for 32 and 33 weeks do not overlap as in earlier gestations (p = 0.001). It is possible that this marked difference may reflect variation in risk of white matter damage.17,18 There is also a point between 37 and 38 weeks where the confidence intervals do not overlap (p = 0.001), indicating a fall in risk at the achievement of 38 weeks’ gestational age.
The estimated CP prevalence rate of 6.5 per 1000 (246/37564) live births for births at 32 up to 36 weeks and 1.1 per 1000 (707/642018) for live births at 37 weeks and over is similar to that for live births for 1995-98 reported in Sweden.19
63
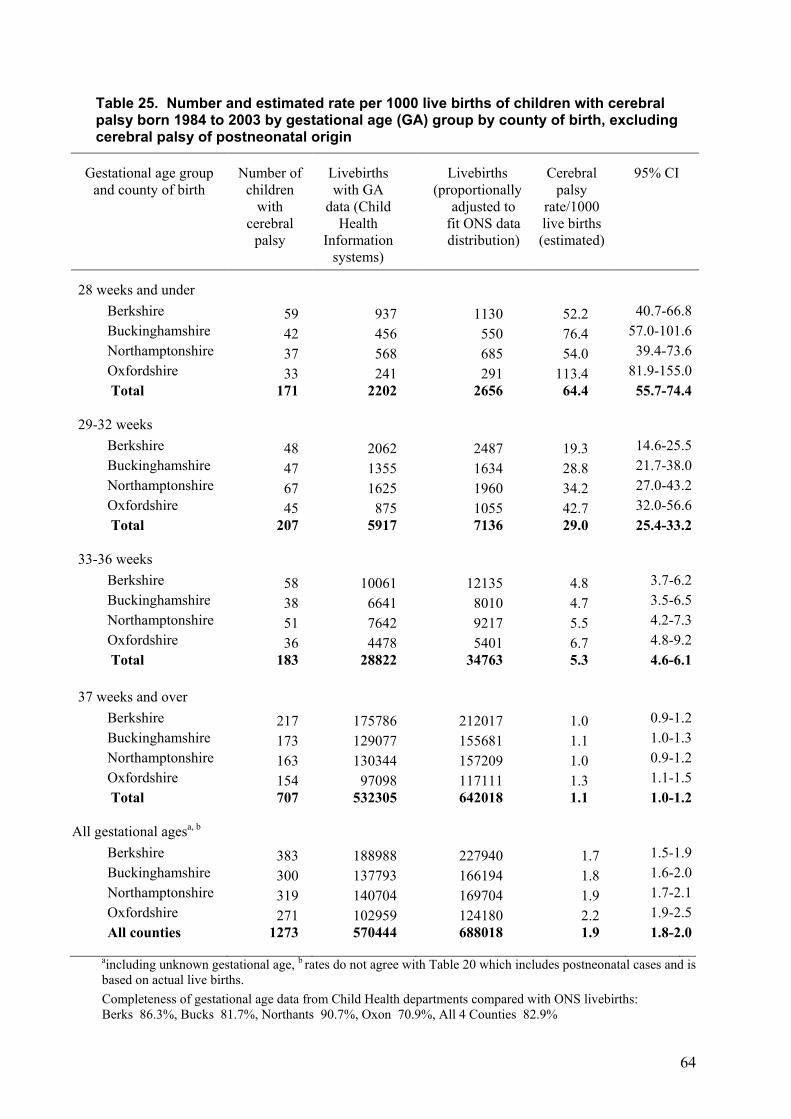
The same method of adjusting the available gestational age denominator data to produce estimates for the total population was used to produce Table 25. Completeness of gestational age data is very variable for the four counties so each county has been adjusted individually. This individual adjustment makes little difference when data for the four counties are aggregated but becomes important when dividing the data into counties and gestational age groups. As in the 2008 report, Oxfordshire has the highest CP rate in all birthweight groups, although the difference in rates is significant only at 32 weeks and under (p = 0.001). Confidence intervals are very wide for the cerebral palsy rates for the earlier gestational ages where the numbers of cases are small. At 37 weeks and over, the rates are almost uniform and there was no significant difference in rate by county (p = 0.2).
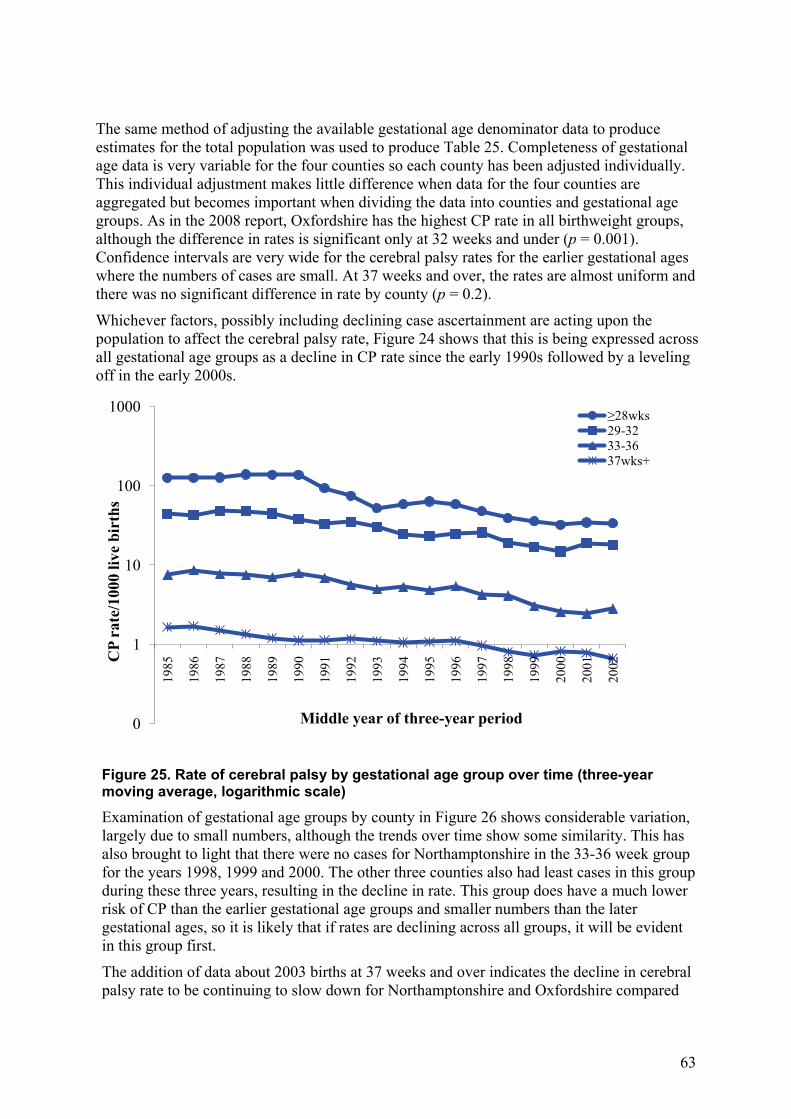
Whichever factors, possibly including declining case ascertainment are acting upon the population to affect the cerebral palsy rate, Figure 24 shows that this is being expressed across all gestational age groups as a decline in CP rate since the early 1990s followed by a leveling off in the early 2000s.
Figure 25. Rate of cerebral palsy by gestational age group over time (three-year moving average, logarithmic scale)
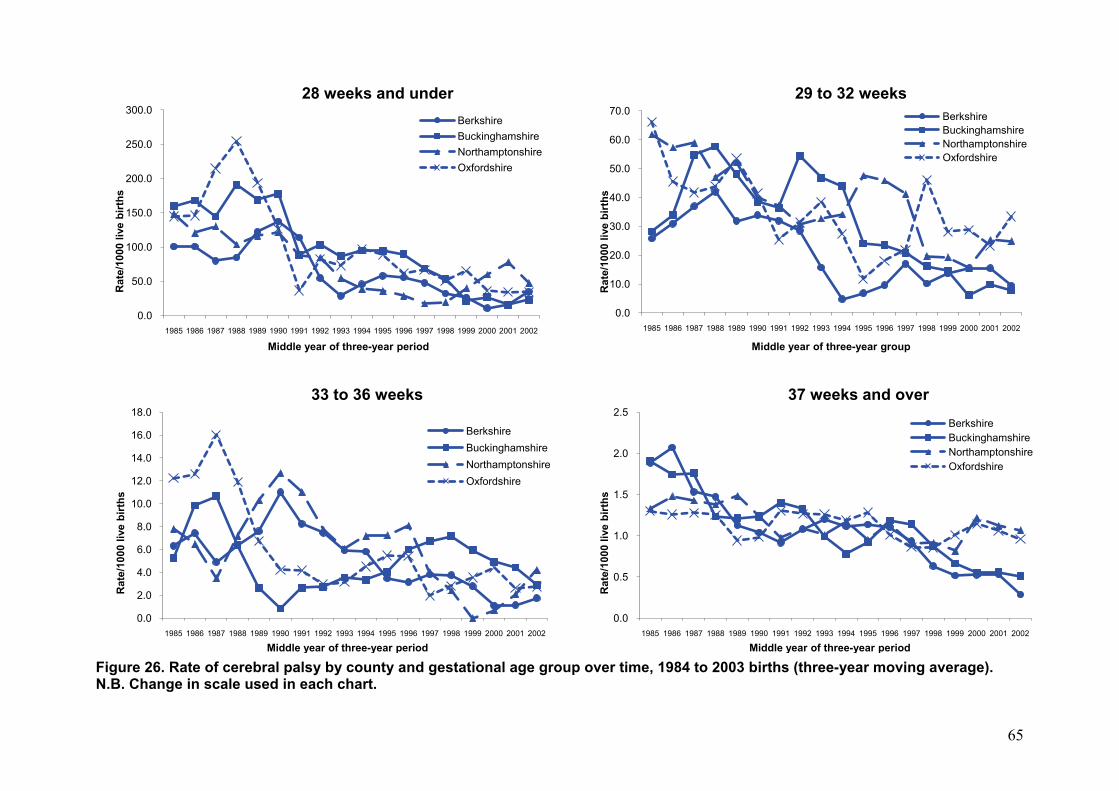
Examination of gestational age groups by county in Figure 26 shows considerable variation, largely due to small numbers, although the trends over time show some similarity. This has also brought to light that there were no cases for Northamptonshire in the 33-36 week group for the years 1998, 1999 and 2000. The other three counties also had least cases in this group during these three years, resulting in the decline in rate. This group does have a much lower risk of CP than the earlier gestational age groups and smaller numbers than the later gestational ages, so it is likely that if rates are declining across all groups, it will be evident in this group first.
The addition of data about 2003 births at 37 weeks and over indicates the decline in cerebral palsy rate to be continuing to slow down for Northamptonshire and Oxfordshire compared
0
1
10
100
1000
1985
1986
1987
1988
1989
1990
1991
1992
1993
1994
1995
1996
1997
1998
1999
2000
2001
2002C
P ra
te/1
000
live
birt
hs
Middle year of three-year period
≥28wks29-3233-3637wks+
64
Table 25. Number and estimated rate per 1000 live births of children with cerebral palsy born 1984 to 2003 by gestational age (GA) group by county of birth, excluding cerebral palsy of postneonatal origin
Gestational age group
and county of birth Number of
children with
cerebral palsy
Livebirths with GA
data (Child Health
Information systems)
Livebirths (proportionally
adjusted to fit ONS data distribution)
Cerebral palsy
rate/1000 live births (estimated)
95% CI
28 weeks and under
Berkshire 59 937 1130 52.2 40.7-66.8 Buckinghamshire 42 456 550 76.4 57.0-101.6 Northamptonshire 37 568 685 54.0 39.4-73.6 Oxfordshire 33 241 291 113.4 81.9-155.0 Total
171 2202 2656 64.4 55.7-74.4
29-32 weeks Berkshire 48 2062 2487 19.3 14.6-25.5 Buckinghamshire 47 1355 1634 28.8 21.7-38.0 Northamptonshire 67 1625 1960 34.2 27.0-43.2 Oxfordshire 45 875 1055 42.7 32.0-56.6 Total
207 5917 7136 29.0 25.4-33.2
33-36 weeks Berkshire 58 10061 12135 4.8 3.7-6.2 Buckinghamshire 38 6641 8010 4.7 3.5-6.5 Northamptonshire 51 7642 9217 5.5 4.2-7.3 Oxfordshire 36 4478 5401 6.7 4.8-9.2 Total
183 28822 34763 5.3 4.6-6.1
37 weeks and over Berkshire 217 175786 212017 1.0 0.9-1.2 Buckinghamshire 173 129077 155681 1.1 1.0-1.3 Northamptonshire 163 130344 157209 1.0 0.9-1.2 Oxfordshire 154 97098 117111 1.3 1.1-1.5 Total
707 532305 642018 1.1 1.0-1.2
All gestational agesa, b Berkshire 383 188988 227940 1.7 1.5-1.9 Buckinghamshire 300 137793 166194 1.8 1.6-2.0 Northamptonshire 319 140704 169704 1.9 1.7-2.1 Oxfordshire 271 102959 124180 2.2 1.9-2.5 All counties 1273 570444 688018 1.9 1.8-2.0
aincluding unknown gestational age, b rates do not agree with Table 20 which includes postneonatal cases and is based on actual live births. Completeness of gestational age data from Child Health departments compared with ONS livebirths: Berks 86.3%, Bucks 81.7%, Northants 90.7%, Oxon 70.9%, All 4 Counties 82.9%
65
Figure 26. Rate of cerebral palsy by county and gestational age group over time, 1984 to 2003 births (three-year moving average). N.B. Change in scale used in each chart.
0.0
50.0
100.0
150.0
200.0
250.0
300.0
1985 1986 1987 1988 1989 1990 1991 1992 1993 1994 1995 1996 1997 1998 1999 2000 2001 2002
Rat
e/10
00 li
ve b
irths
Middle year of three-year period
28 weeks and underBerkshireBuckinghamshireNorthamptonshireOxfordshire
0.0
10.0
20.0
30.0
40.0
50.0
60.0
70.0
1985 1986 1987 1988 1989 1990 1991 1992 1993 1994 1995 1996 1997 1998 1999 2000 2001 2002
Rat
e/10
00 li
ve b
irths
Middle year of three-year group
29 to 32 weeksBerkshireBuckinghamshireNorthamptonshireOxfordshire
0.0
2.0
4.0
6.0
8.0
10.0
12.0
14.0
16.0
18.0
1985 1986 1987 1988 1989 1990 1991 1992 1993 1994 1995 1996 1997 1998 1999 2000 2001 2002
Rat
e/10
00 li
ve b
irths
Middle year of three-year period
33 to 36 weeks
BerkshireBuckinghamshireNorthamptonshireOxfordshire
0.0
0.5
1.0
1.5
2.0
2.5
1985 1986 1987 1988 1989 1990 1991 1992 1993 1994 1995 1996 1997 1998 1999 2000 2001 2002
Rat
e/10
00 li
ve b
irths
Middle year of three-year period
37 weeks and overBerkshireBuckinghamshireNorthamptonshireOxfordshire
66
with Berkshire and Buckinghamshire. Northamptonshire and Oxfordshire’s term CP rates have changed very little over time with average annual rates of 1.2 and 1.1 per 1000 live births, respectively. Berkshire and Buckinghamshire, the larger counties, both had much higher rates at around 2 per 1000 live births at the start of the register and these rates have fallen much further.
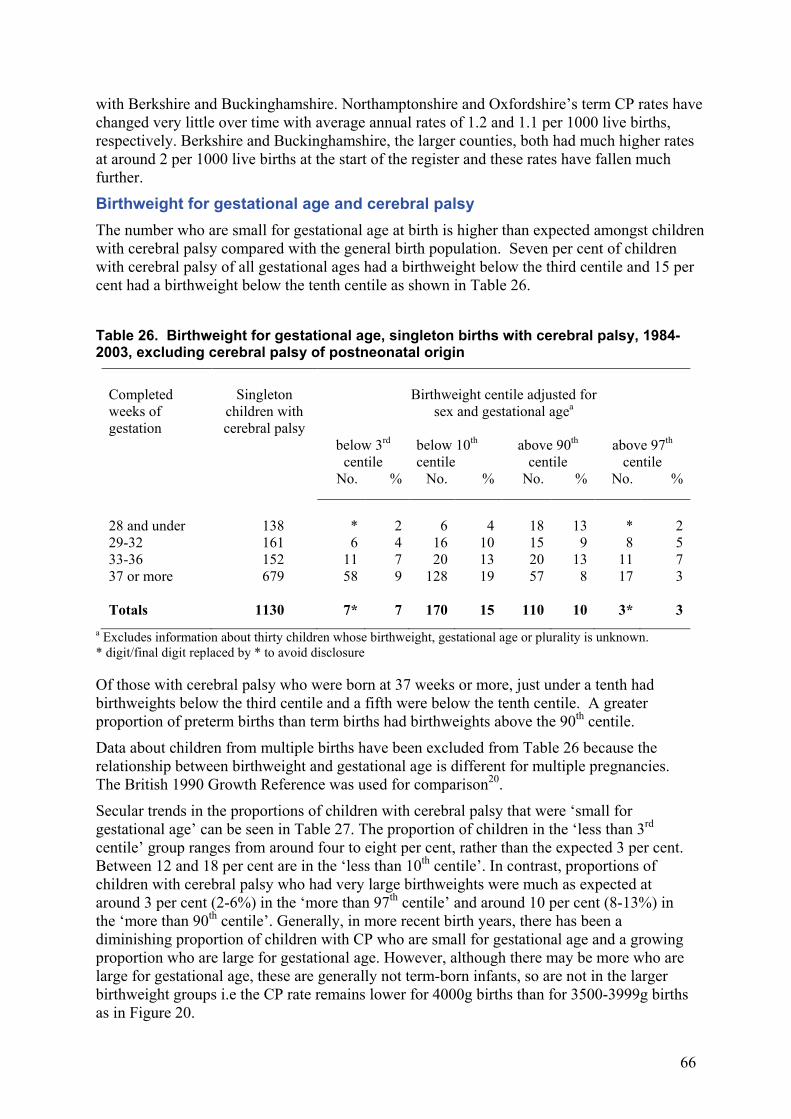
Birthweight for gestational age and cerebral palsy The number who are small for gestational age at birth is higher than expected amongst children with cerebral palsy compared with the general birth population. Seven per cent of children with cerebral palsy of all gestational ages had a birthweight below the third centile and 15 per cent had a birthweight below the tenth centile as shown in Table 26. Table 26. Birthweight for gestational age, singleton births with cerebral palsy, 1984-2003, excluding cerebral palsy of postneonatal origin
Completed weeks of gestation
Singleton
children with cerebral palsy
Birthweight centile adjusted for
sex and gestational agea
below 3rd centile
below 10th centile
above 90th
centile above 97th
centile No. % No. % No. % No. %
28 and under 138 * 2 6 4 18 13 * 2 29-32 161 6 4 16 10 15 9 8 5 33-36 152 11 7 20 13 20 13 11 7 37 or more 679 58 9 128 19 57 8 17 3
Totals 1130 7* 7 170 15 110 10 3* 3
a Excludes information about thirty children whose birthweight, gestational age or plurality is unknown. * digit/final digit replaced by * to avoid disclosure Of those with cerebral palsy who were born at 37 weeks or more, just under a tenth had birthweights below the third centile and a fifth were below the tenth centile. A greater proportion of preterm births than term births had birthweights above the 90th centile.
Data about children from multiple births have been excluded from Table 26 because the relationship between birthweight and gestational age is different for multiple pregnancies. The British 1990 Growth Reference was used for comparison20.
Secular trends in the proportions of children with cerebral palsy that were ‘small for gestational age’ can be seen in Table 27. The proportion of children in the ‘less than 3rd centile’ group ranges from around four to eight per cent, rather than the expected 3 per cent. Between 12 and 18 per cent are in the ‘less than 10th centile’. In contrast, proportions of children with cerebral palsy who had very large birthweights were much as expected at around 3 per cent (2-6%) in the ‘more than 97th centile’ and around 10 per cent (8-13%) in the ‘more than 90th centile’. Generally, in more recent birth years, there has been a diminishing proportion of children with CP who are small for gestational age and a growing proportion who are large for gestational age. However, although there may be more who are large for gestational age, these are generally not term-born infants, so are not in the larger birthweight groups i.e the CP rate remains lower for 4000g births than for 3500-3999g births as in Figure 20.
67
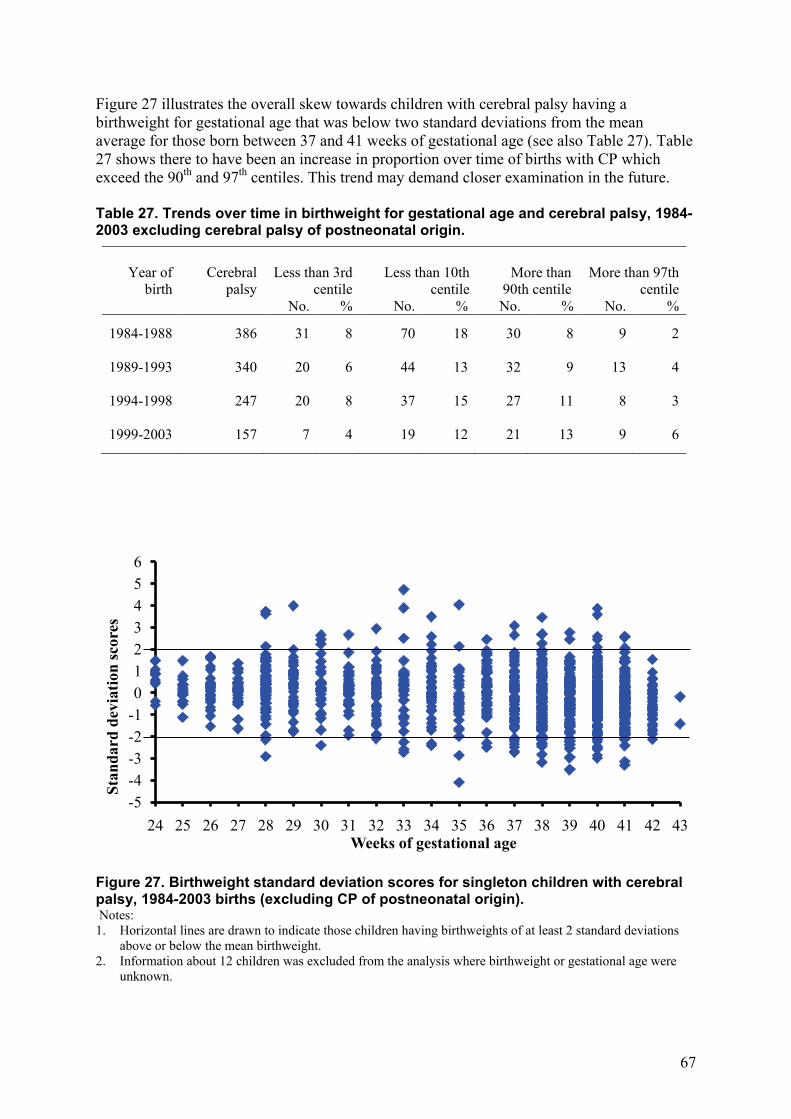
Figure 27 illustrates the overall skew towards children with cerebral palsy having a birthweight for gestational age that was below two standard deviations from the mean average for those born between 37 and 41 weeks of gestational age (see also Table 27). Table 27 shows there to have been an increase in proportion over time of births with CP which exceed the 90th and 97th centiles. This trend may demand closer examination in the future. Table 27. Trends over time in birthweight for gestational age and cerebral palsy, 1984-2003 excluding cerebral palsy of postneonatal origin.
Year of
birth
Cerebral
palsy
Less than 3rd
centile
Less than 10th
centile
More than
90th centile
More than 97th
centile No. % No. % No. % No. %
1984-1988 386 31 8 70 18 30 8 9 2
1989-1993 340 20 6 44 13 32 9 13 4 1994-1998 247 20 8 37 15 27 11 8 3
1999-2003 157 7 4 19 12 21 13 9 6
Figure 27. Birthweight standard deviation scores for singleton children with cerebral palsy, 1984-2003 births (excluding CP of postneonatal origin). Notes: 1. Horizontal lines are drawn to indicate those children having birthweights of at least 2 standard deviations
above or below the mean birthweight. 2. Information about 12 children was excluded from the analysis where birthweight or gestational age were
unknown.
-5-4-3-2-10123456
24 25 26 27 28 29 30 31 32 33 34 35 36 37 38 39 40 41 42 43
Stan
dard
dev
iatio
n sc
ores
Weeks of gestational age
68
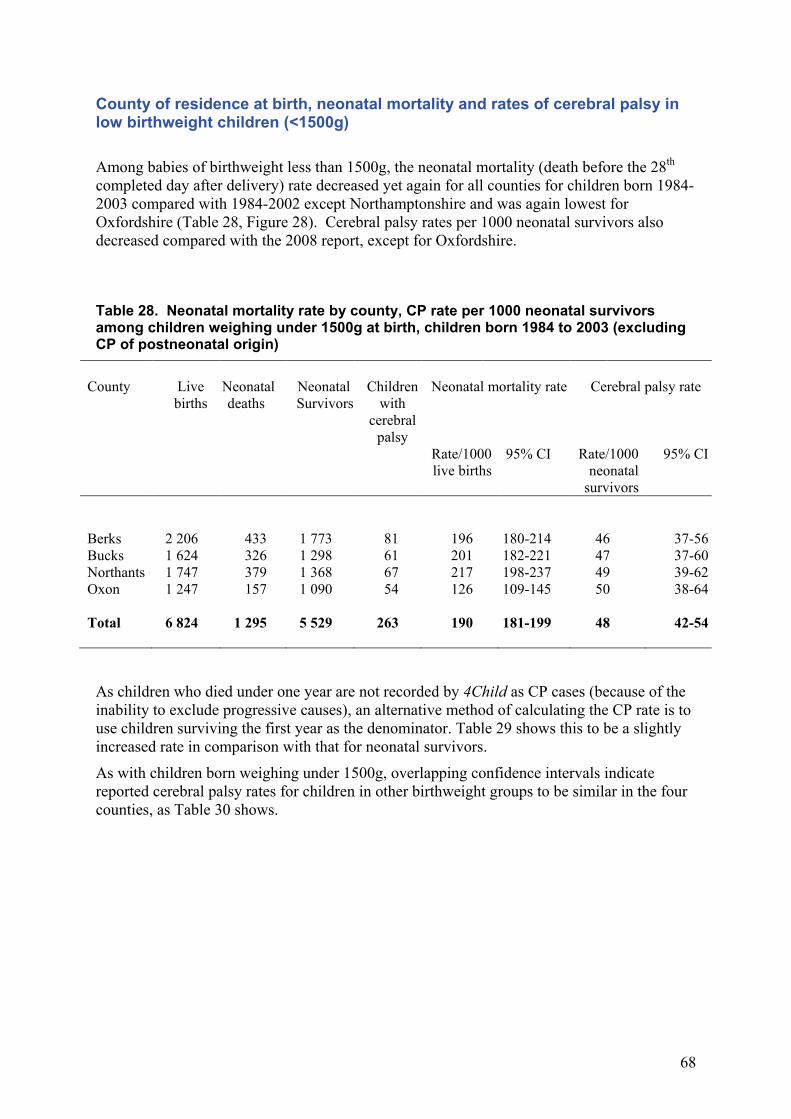
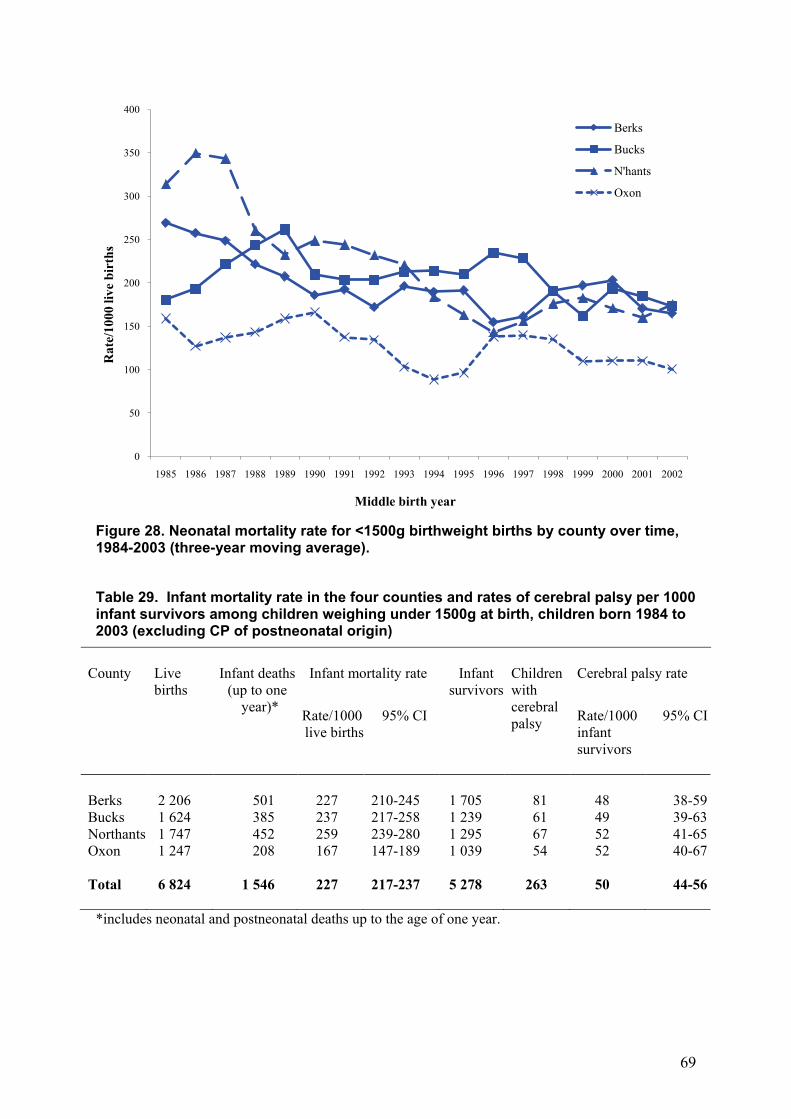
County of residence at birth, neonatal mortality and rates of cerebral palsy in low birthweight children (<1500g) Among babies of birthweight less than 1500g, the neonatal mortality (death before the 28th completed day after delivery) rate decreased yet again for all counties for children born 1984-2003 compared with 1984-2002 except Northamptonshire and was again lowest for Oxfordshire (Table 28, Figure 28). Cerebral palsy rates per 1000 neonatal survivors also decreased compared with the 2008 report, except for Oxfordshire.
Table 28. Neonatal mortality rate by county, CP rate per 1000 neonatal survivors among children weighing under 1500g at birth, children born 1984 to 2003 (excluding CP of postneonatal origin)
County Live
births Neonatal deaths
Neonatal Survivors
Children with
cerebral palsy
Neonatal mortality rate Cerebral palsy rate
Rate/1000 live births
95% CI Rate/1000 neonatal
survivors
95% CI
Berks 2 206 433 1 773 81 196 180-214 46 37-56 Bucks 1 624 326 1 298 61 201 182-221 47 37-60 Northants 1 747 379 1 368 67 217 198-237 49 39-62 Oxon 1 247 157 1 090 54 126 109-145 50 38-64 Total 6 824 1 295 5 529 263 190 181-199 48 42-54
As children who died under one year are not recorded by 4Child as CP cases (because of the inability to exclude progressive causes), an alternative method of calculating the CP rate is to use children surviving the first year as the denominator. Table 29 shows this to be a slightly increased rate in comparison with that for neonatal survivors.
As with children born weighing under 1500g, overlapping confidence intervals indicate reported cerebral palsy rates for children in other birthweight groups to be similar in the four counties, as Table 30 shows.
69
Figure 28. Neonatal mortality rate for <1500g birthweight births by county over time, 1984-2003 (three-year moving average). Table 29. Infant mortality rate in the four counties and rates of cerebral palsy per 1000 infant survivors among children weighing under 1500g at birth, children born 1984 to 2003 (excluding CP of postneonatal origin)
County Live
births Infant deaths
(up to one year)*
Infant mortality rate Infant survivors
Children with cerebral palsy
Cerebral palsy rate
Rate/1000 live births
95% CI Rate/1000 infant survivors
95% CI
Berks 2 206 501 227 210-245 1 705 81 48 38-59 Bucks 1 624 385 237 217-258 1 239 61 49 39-63 Northants 1 747 452 259 239-280 1 295 67 52 41-65 Oxon 1 247 208 167 147-189 1 039 54 52 40-67 Total 6 824 1 546 227 217-237 5 278 263 50 44-56
*includes neonatal and postneonatal deaths up to the age of one year.
0
50
100
150
200
250
300
350
400
1985 1986 1987 1988 1989 1990 1991 1992 1993 1994 1995 1996 1997 1998 1999 2000 2001 2002
Rat
e/10
00 li
ve b
irth
s
Middle birth year
Berks
Bucks
N'hants
Oxon
70
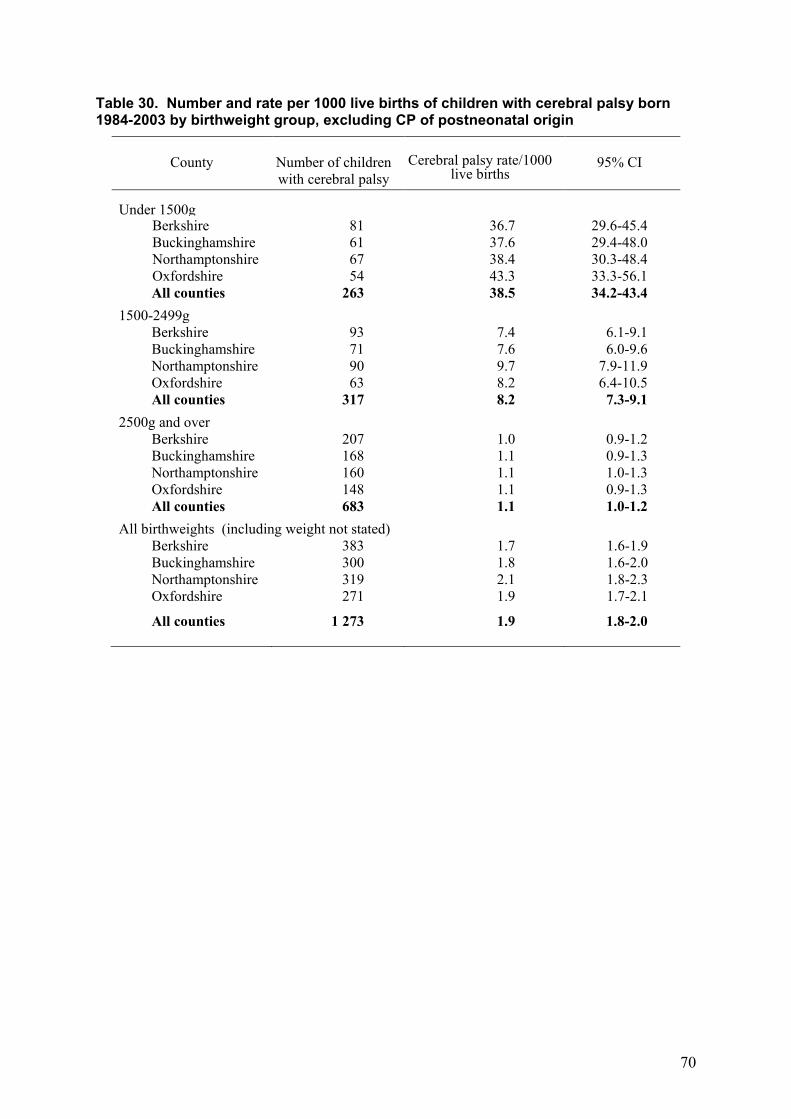
Table 30. Number and rate per 1000 live births of children with cerebral palsy born 1984-2003 by birthweight group, excluding CP of postneonatal origin
County
Number of children with cerebral palsy
Cerebral palsy rate/1000
live births
95% CI
Under 1500g
Berkshire Buckinghamshire Northamptonshire Oxfordshire
81 61 67 54
36.7 37.6 38.4 43.3
29.6-45.4 29.4-48.0 30.3-48.4 33.3-56.1
All counties
263 38.5 34.2-43.4 1500-2499g
Berkshire Buckinghamshire Northamptonshire Oxfordshire
93 71 90 63
7.4 7.6 9.7 8.2
6.1-9.1 6.0-9.6
7.9-11.9 6.4-10.5
All counties
317 8.2 7.3-9.1 2500g and over
Berkshire Buckinghamshire Northamptonshire Oxfordshire
207 168 160 148
1.0 1.1 1.1 1.1
0.9-1.2 0.9-1.3 1.0-1.3 0.9-1.3
All counties
683 1.1 1.0-1.2 All birthweights (including weight not stated)
Berkshire Buckinghamshire Northamptonshire Oxfordshire
383 300 319 271
1.7 1.8 2.1 1.9
1.6-1.9 1.6-2.0 1.8-2.3 1.7-2.1
All counties 1 273 1.9 1.8-2.0
71
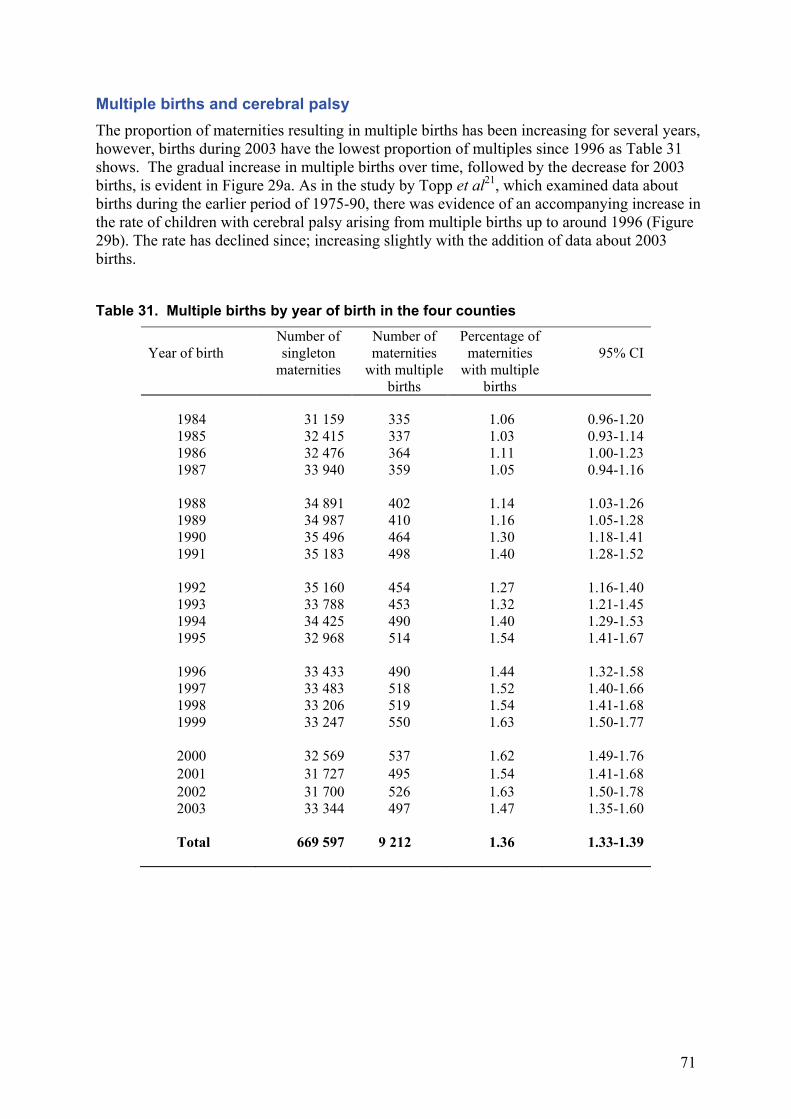
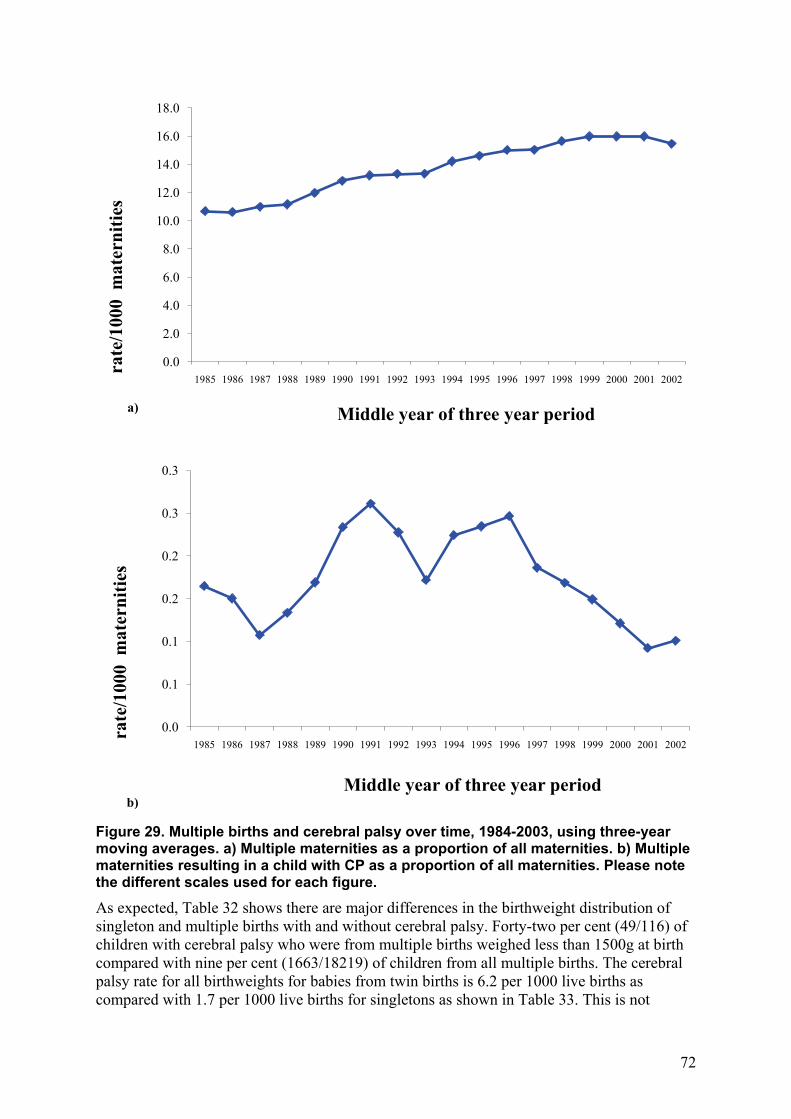
Multiple births and cerebral palsy The proportion of maternities resulting in multiple births has been increasing for several years, however, births during 2003 have the lowest proportion of multiples since 1996 as Table 31 shows. The gradual increase in multiple births over time, followed by the decrease for 2003 births, is evident in Figure 29a. As in the study by Topp et al21, which examined data about births during the earlier period of 1975-90, there was evidence of an accompanying increase in the rate of children with cerebral palsy arising from multiple births up to around 1996 (Figure 29b). The rate has declined since; increasing slightly with the addition of data about 2003 births.
Table 31. Multiple births by year of birth in the four counties
Year of birth
Number of singleton
maternities
Number of maternities
with multiple births
Percentage of maternities
with multiple births
95% CI
1984 31 159 335 1.06 0.96-1.20 1985 32 415 337 1.03 0.93-1.14 1986 32 476 364 1.11 1.00-1.23 1987 33 940 359 1.05 0.94-1.16 1988 34 891 402 1.14 1.03-1.26 1989 34 987 410 1.16 1.05-1.28 1990 35 496 464 1.30 1.18-1.41 1991 35 183 498 1.40 1.28-1.52 1992 35 160 454 1.27 1.16-1.40 1993 33 788 453 1.32 1.21-1.45 1994 34 425 490 1.40 1.29-1.53 1995 32 968 514 1.54 1.41-1.67 1996 33 433 490 1.44 1.32-1.58 1997 33 483 518 1.52 1.40-1.66 1998 33 206 519 1.54 1.41-1.68 1999 33 247 550 1.63 1.50-1.77 2000 32 569 537 1.62 1.49-1.76 2001 31 727 495 1.54 1.41-1.68 2002 31 700 526 1.63 1.50-1.78 2003 33 344 497 1.47 1.35-1.60 Total 669 597 9 212 1.36 1.33-1.39
72
Figure 29. Multiple births and cerebral palsy over time, 1984-2003, using three-year moving averages. a) Multiple maternities as a proportion of all maternities. b) Multiple maternities resulting in a child with CP as a proportion of all maternities. Please note the different scales used for each figure.
As expected, Table 32 shows there are major differences in the birthweight distribution of singleton and multiple births with and without cerebral palsy. Forty-two per cent (49/116) of children with cerebral palsy who were from multiple births weighed less than 1500g at birth compared with nine per cent (1663/18219) of children from all multiple births. The cerebral palsy rate for all birthweights for babies from twin births is 6.2 per 1000 live births as compared with 1.7 per 1000 live births for singletons as shown in Table 33. This is not
0.0
2.0
4.0
6.0
8.0
10.0
12.0
14.0
16.0
18.0
1985 1986 1987 1988 1989 1990 1991 1992 1993 1994 1995 1996 1997 1998 1999 2000 2001 2002
rate
/100
0 m
ater
nitie
s
Middle year of three year period
0.0
0.1
0.1
0.2
0.2
0.3
0.3
1985 1986 1987 1988 1989 1990 1991 1992 1993 1994 1995 1996 1997 1998 1999 2000 2001 2002
rate
/100
0 m
ater
nitie
s
Middle year of three year period
a)
b)
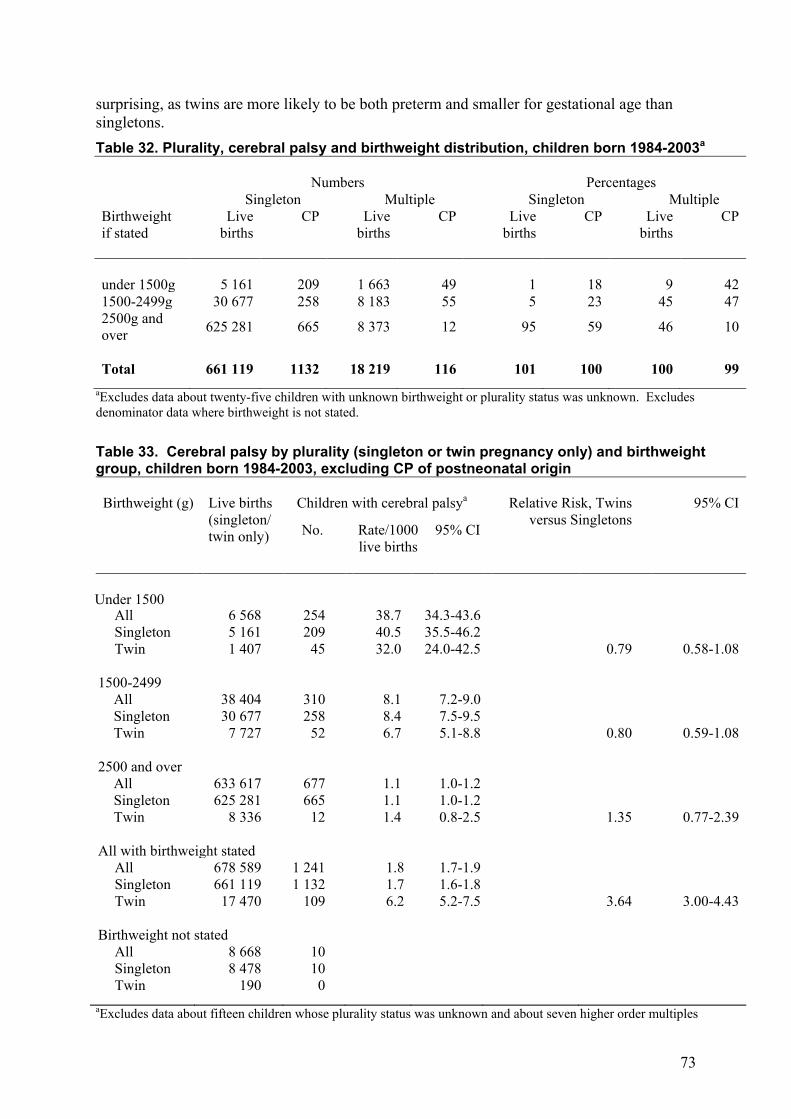
73
surprising, as twins are more likely to be both preterm and smaller for gestational age than singletons. Table 32. Plurality, cerebral palsy and birthweight distribution, children born 1984-2003a Numbers Percentages Singleton Multiple Singleton Multiple Birthweight if stated
Live births
CP Live births
CP Live births
CP Live births
CP
under 1500g 5 161 209 1 663 49 1 18 9 42 1500-2499g 30 677 258 8 183 55 5 23 45 47 2500g and over 625 281 665 8 373 12 95 59 46 10
Total 661 119 1132 18 219 116 101 100 100 99 aExcludes data about twenty-five children with unknown birthweight or plurality status was unknown. Excludes
denominator data where birthweight is not stated.
Table 33. Cerebral palsy by plurality (singleton or twin pregnancy only) and birthweight group, children born 1984-2003, excluding CP of postneonatal origin Birthweight (g) Live births
(singleton/ twin only)
Children with cerebral palsya Relative Risk, Twins versus Singletons
95% CI
No. Rate/1000 live births
95% CI
Under 1500
All Singleton Twin
6 568 5 161 1 407
254 209
45
38.7 40.5 32.0
34.3-43.6 35.5-46.2 24.0-42.5
0.79
0.58-1.08 1500-2499
All Singleton Twin
38 404 30 677
7 727
310 258
52
8.1 8.4 6.7
7.2-9.0 7.5-9.5 5.1-8.8
0.80
0.59-1.08 2500 and over
All Singleton Twin
633 617 625 281
8 336
677 665
12
1.1 1.1 1.4
1.0-1.2 1.0-1.2 0.8-2.5
1.35
0.77-2.39 All with birthweight stated
All Singleton Twin
678 589 661 119
17 470
1 241 1 132
109
1.8 1.7 6.2
1.7-1.9 1.6-1.8 5.2-7.5
3.64
3.00-4.43 Birthweight not stated
All Singleton Twin
8 668 8 478
190
10
10 0
aExcludes data about fifteen children whose plurality status was unknown and about seven higher order multiples
74
When children from multiple births are compared with singletons of similar birthweights, however, a different picture emerges. Multiple births have a lower rate of cerebral palsy in all low birthweight groups and this is particularly marked in the very low birthweight group (less than 1500g) and the 1500-2499g group but this is not statistically significant (p = 0.1). Within each birthweight category, low birthweight children from multiple births are likely to be of higher gestational ages and therefore, to be more mature than singletons of the same birthweight and are less likely to be pathologically low birthweight. This may account for their lower rate of cerebral palsy by birthweight group.
As the completeness of gestational age data improves within the region, evaluation of the parts played by both birthweight and gestational age independently will also be further illuminated.
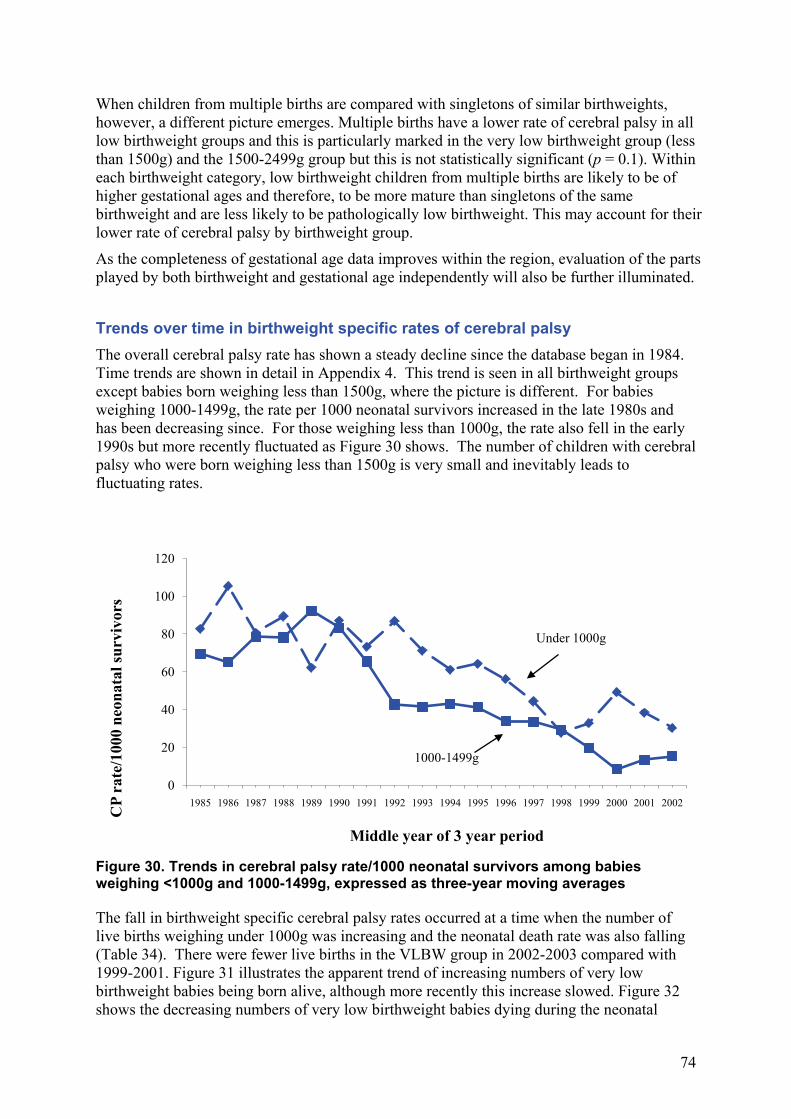
Trends over time in birthweight specific rates of cerebral palsy The overall cerebral palsy rate has shown a steady decline since the database began in 1984. Time trends are shown in detail in Appendix 4. This trend is seen in all birthweight groups except babies born weighing less than 1500g, where the picture is different. For babies weighing 1000-1499g, the rate per 1000 neonatal survivors increased in the late 1980s and has been decreasing since. For those weighing less than 1000g, the rate also fell in the early 1990s but more recently fluctuated as Figure 30 shows. The number of children with cerebral palsy who were born weighing less than 1500g is very small and inevitably leads to fluctuating rates.
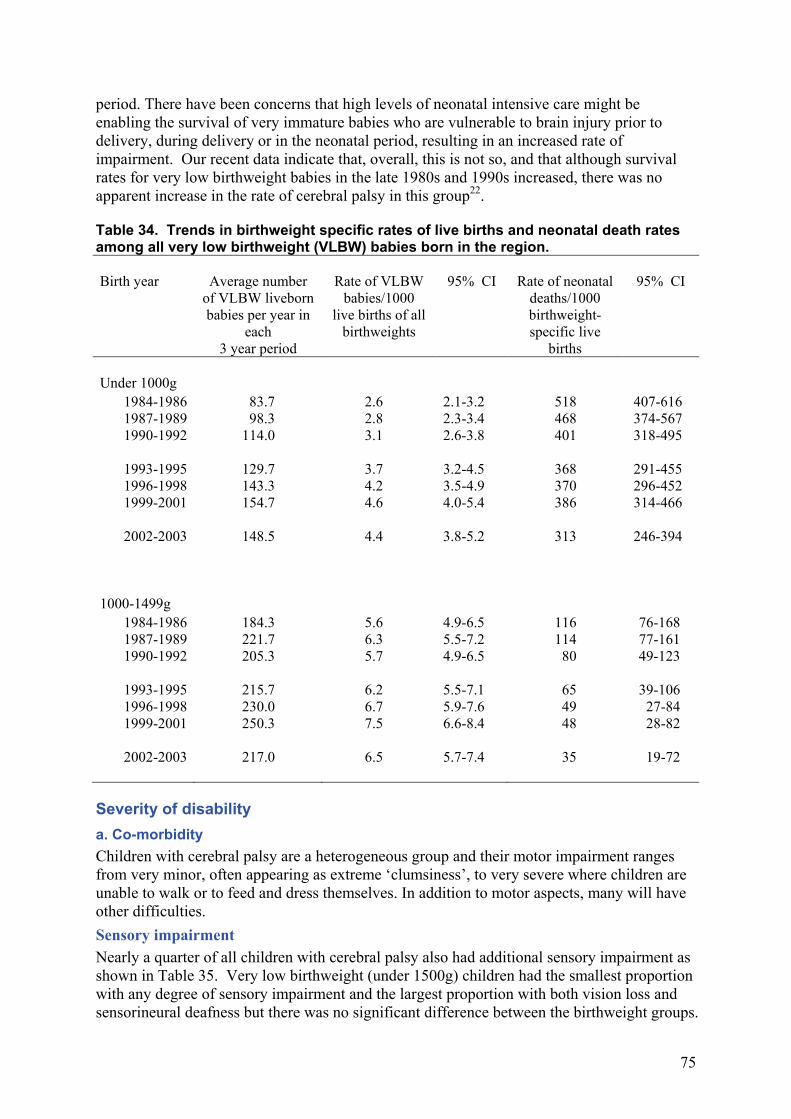
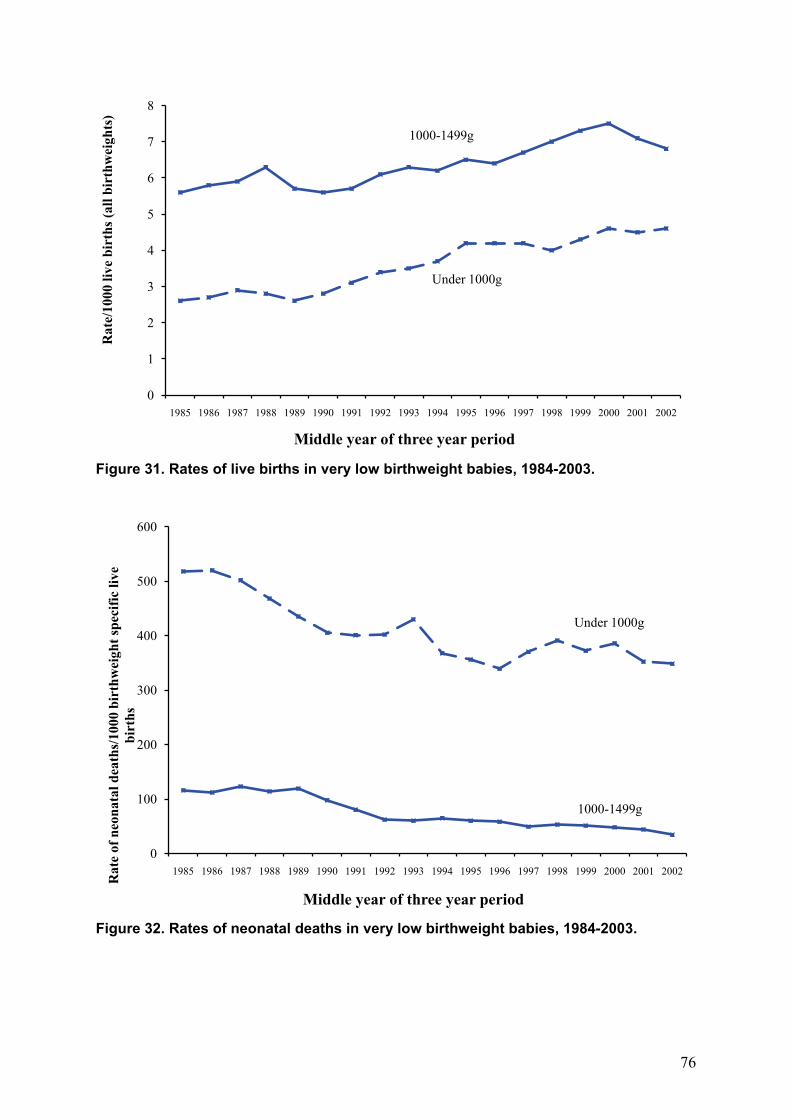
Figure 30. Trends in cerebral palsy rate/1000 neonatal survivors among babies weighing <1000g and 1000-1499g, expressed as three-year moving averages The fall in birthweight specific cerebral palsy rates occurred at a time when the number of live births weighing under 1000g was increasing and the neonatal death rate was also falling (Table 34). There were fewer live births in the VLBW group in 2002-2003 compared with 1999-2001. Figure 31 illustrates the apparent trend of increasing numbers of very low birthweight babies being born alive, although more recently this increase slowed. Figure 32 shows the decreasing numbers of very low birthweight babies dying during the neonatal
0
20
40
60
80
100
120
1985 1986 1987 1988 1989 1990 1991 1992 1993 1994 1995 1996 1997 1998 1999 2000 2001 2002
CP
rate
/100
0 ne
onat
al su
rviv
ors
Middle year of 3 year period
1000-1499g
Under 1000g
75
period. There have been concerns that high levels of neonatal intensive care might be enabling the survival of very immature babies who are vulnerable to brain injury prior to delivery, during delivery or in the neonatal period, resulting in an increased rate of impairment. Our recent data indicate that, overall, this is not so, and that although survival rates for very low birthweight babies in the late 1980s and 1990s increased, there was no apparent increase in the rate of cerebral palsy in this group22. Table 34. Trends in birthweight specific rates of live births and neonatal death rates among all very low birthweight (VLBW) babies born in the region. Birth year Average number
of VLBW liveborn babies per year in
each 3 year period
Rate of VLBW babies/1000
live births of all birthweights
95% CI Rate of neonatal deaths/1000 birthweight-specific live
births
95% CI
Under 1000g
1984-1986 83.7 2.6 2.1-3.2 518 407-616 1987-1989 98.3 2.8 2.3-3.4 468 374-567 1990-1992 114.0 3.1 2.6-3.8 401 318-495
1993-1995 129.7 3.7 3.2-4.5 368 291-455 1996-1998 143.3 4.2 3.5-4.9 370 296-452 1999-2001 154.7 4.6 4.0-5.4 386 314-466
2002-2003 148.5 4.4 3.8-5.2 313 246-394
1000-1499g
1984-1986 184.3 5.6 4.9-6.5 116 76-168 1987-1989 221.7 6.3 5.5-7.2 114 77-161 1990-1992 205.3 5.7 4.9-6.5 80 49-123
1993-1995 215.7 6.2 5.5-7.1 65 39-106 1996-1998 230.0 6.7 5.9-7.6 49 27-84 1999-2001 250.3 7.5 6.6-8.4 48 28-82
2002-2003 217.0 6.5 5.7-7.4 35 19-72
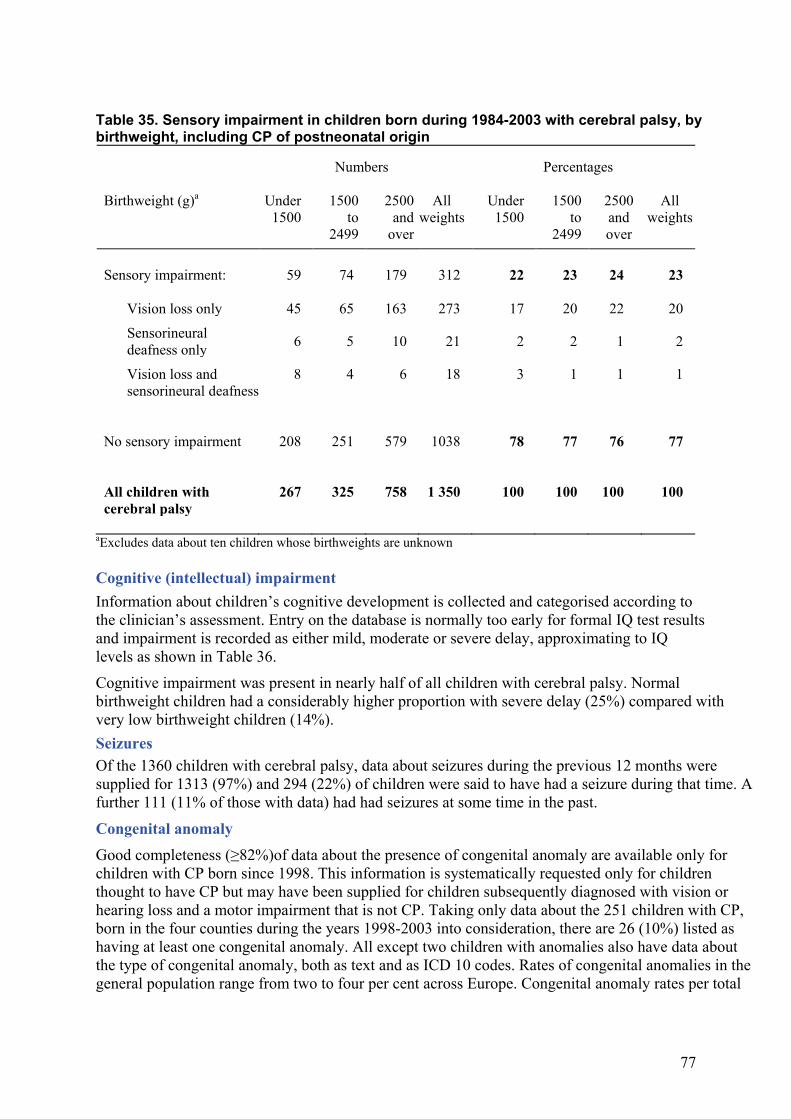
Severity of disability a. Co-morbidity Children with cerebral palsy are a heterogeneous group and their motor impairment ranges from very minor, often appearing as extreme ‘clumsiness’, to very severe where children are unable to walk or to feed and dress themselves. In addition to motor aspects, many will have other difficulties. Sensory impairment Nearly a quarter of all children with cerebral palsy also had additional sensory impairment as shown in Table 35. Very low birthweight (under 1500g) children had the smallest proportion with any degree of sensory impairment and the largest proportion with both vision loss and sensorineural deafness but there was no significant difference between the birthweight groups.
76
Figure 31. Rates of live births in very low birthweight babies, 1984-2003.
Figure 32. Rates of neonatal deaths in very low birthweight babies, 1984-2003.
0
1
2
3
4
5
6
7
8
1985 1986 1987 1988 1989 1990 1991 1992 1993 1994 1995 1996 1997 1998 1999 2000 2001 2002
Rat
e/10
00 li
ve b
irth
s (al
l bir
thw
eigh
ts)
Middle year of three year period
1000-1499g
Under 1000g
0
100
200
300
400
500
600
1985 1986 1987 1988 1989 1990 1991 1992 1993 1994 1995 1996 1997 1998 1999 2000 2001 2002
Rat
e of
neo
nata
l dea
ths/
1000
bir
thw
eigh
t spe
cific
live
bi
rths
Middle year of three year period
Under 1000g
1000-1499g
77
Table 35. Sensory impairment in children born during 1984-2003 with cerebral palsy, by birthweight, including CP of postneonatal origin
Numbers Percentages Birthweight (g)a Under
1500 1500
to 2499
2500 and
over
All weights
Under 1500
1500 to
2499
2500 and over
All weights
Sensory impairment:
59 74 179 312 22 23 24 23
Vision loss only 45 65 163 273 17 20 22 20 Sensorineural deafness only 6 5 10 21 2 2 1 2
Vision loss and sensorineural deafness
8 4 6 18 3 1 1 1
No sensory impairment
208 251 579 1038 78 77 76 77
All children with cerebral palsy
267 325 758 1 350 100 100 100 100
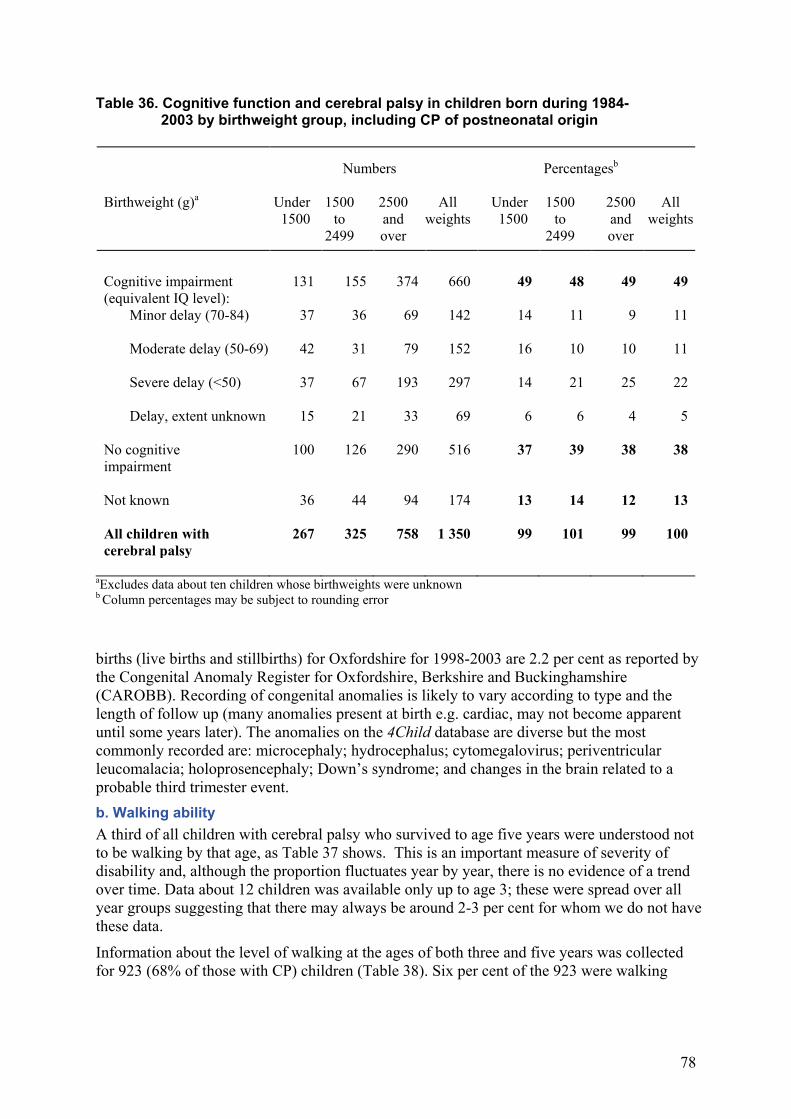
aExcludes data about ten children whose birthweights are unknown Cognitive (intellectual) impairment Information about children’s cognitive development is collected and categorised according to the clinician’s assessment. Entry on the database is normally too early for formal IQ test results and impairment is recorded as either mild, moderate or severe delay, approximating to IQ levels as shown in Table 36.
Cognitive impairment was present in nearly half of all children with cerebral palsy. Normal birthweight children had a considerably higher proportion with severe delay (25%) compared with very low birthweight children (14%). Seizures
Of the 1360 children with cerebral palsy, data about seizures during the previous 12 months were supplied for 1313 (97%) and 294 (22%) of children were said to have had a seizure during that time. A further 111 (11% of those with data) had had seizures at some time in the past.
Congenital anomaly
Good completeness (≥82%)of data about the presence of congenital anomaly are available only for children with CP born since 1998. This information is systematically requested only for children thought to have CP but may have been supplied for children subsequently diagnosed with vision or hearing loss and a motor impairment that is not CP. Taking only data about the 251 children with CP, born in the four counties during the years 1998-2003 into consideration, there are 26 (10%) listed as having at least one congenital anomaly. All except two children with anomalies also have data about the type of congenital anomaly, both as text and as ICD 10 codes. Rates of congenital anomalies in the general population range from two to four per cent across Europe. Congenital anomaly rates per total
78
Table 36. Cognitive function and cerebral palsy in children born during 1984- 2003 by birthweight group, including CP of postneonatal origin
Numbers Percentagesb Birthweight (g)a Under
1500 1500
to 2499
2500 and over
All weights
Under 1500
1500 to
2499
2500 and over
All weights
Cognitive impairment (equivalent IQ level):
131 155 374 660 49 48 49 49
Minor delay (70-84) 37 36 69 142 14 11 9 11
Moderate delay (50-69) 42 31 79 152 16 10 10 11
Severe delay (<50) 37 67 193 297 14 21 25 22
Delay, extent unknown 15 21 33 69 6 6 4 5 No cognitive impairment
100
126
290
516
37
39
38
38
Not known
36
44
94
174
13
14
12
13
All children with cerebral palsy
267 325 758 1 350 99 101 99 100
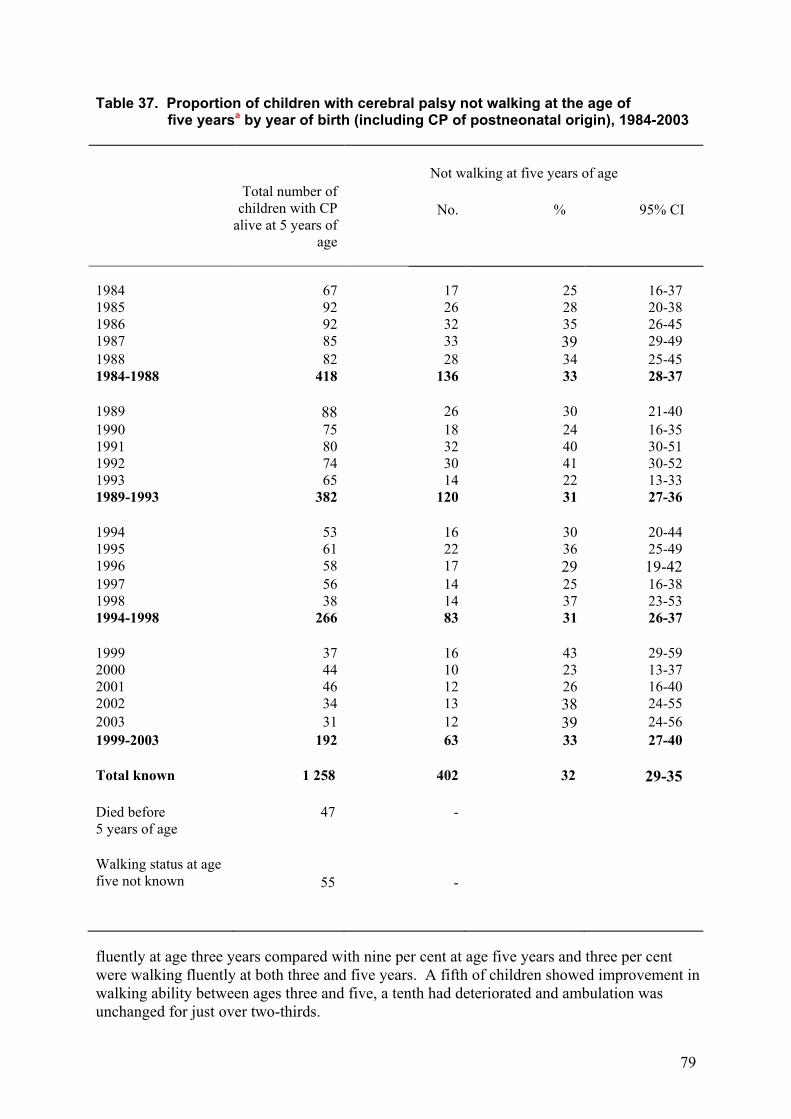
aExcludes data about ten children whose birthweights were unknown b Column percentages may be subject to rounding error births (live births and stillbirths) for Oxfordshire for 1998-2003 are 2.2 per cent as reported by the Congenital Anomaly Register for Oxfordshire, Berkshire and Buckinghamshire (CAROBB). Recording of congenital anomalies is likely to vary according to type and the length of follow up (many anomalies present at birth e.g. cardiac, may not become apparent until some years later). The anomalies on the 4Child database are diverse but the most commonly recorded are: microcephaly; hydrocephalus; cytomegalovirus; periventricular leucomalacia; holoprosencephaly; Down’s syndrome; and changes in the brain related to a probable third trimester event. b. Walking ability A third of all children with cerebral palsy who survived to age five years were understood not to be walking by that age, as Table 37 shows. This is an important measure of severity of disability and, although the proportion fluctuates year by year, there is no evidence of a trend over time. Data about 12 children was available only up to age 3; these were spread over all year groups suggesting that there may always be around 2-3 per cent for whom we do not have these data.
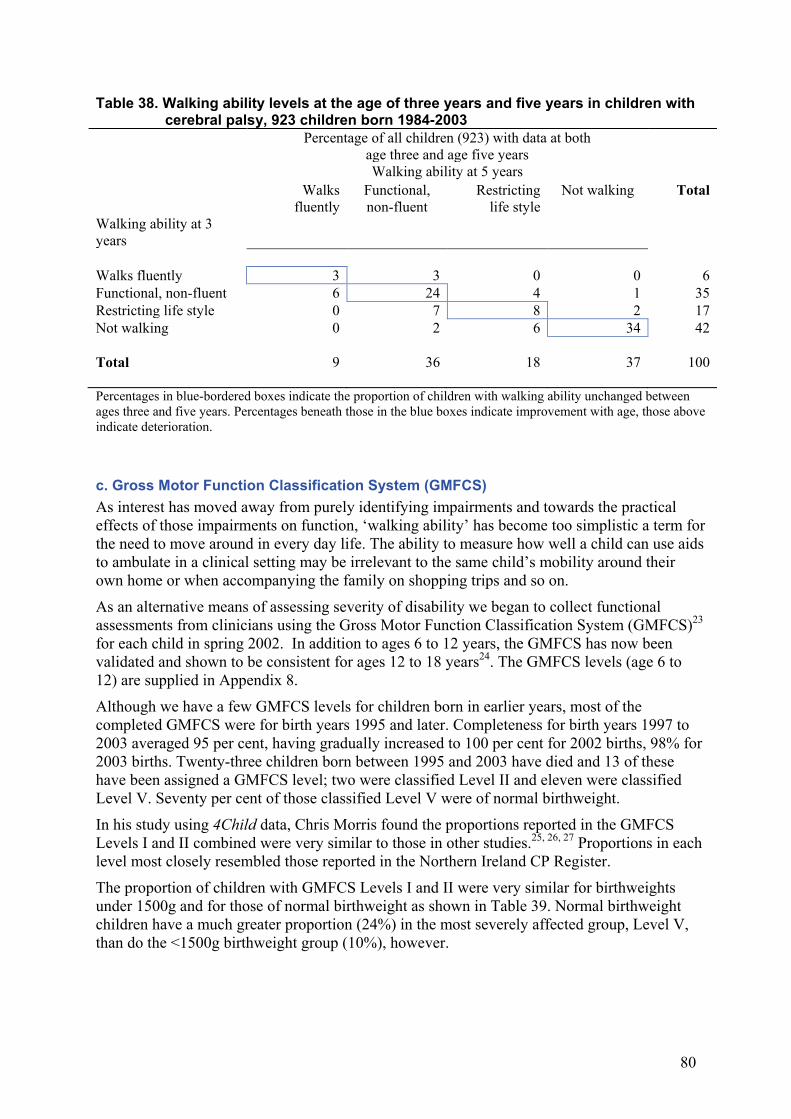
Information about the level of walking at the ages of both three and five years was collected for 923 (68% of those with CP) children (Table 38). Six per cent of the 923 were walking
79
Table 37. Proportion of children with cerebral palsy not walking at the age of five yearsa by year of birth (including CP of postneonatal origin), 1984-2003 Not walking at five years of age
Total number of children with CP
alive at 5 years of age
No.
%
95% CI
1984 67 17 25 16-37 1985 92 26 28 20-38 1986 92 32 35 26-45 1987 85 33 39 29-49 1988 82 28 34 25-45 1984-1988 418 136 33 28-37 1989 88 26 30 21-40 1990 75 18 24 16-35 1991 80 32 40 30-51 1992 74 30 41 30-52 1993 65 14 22 13-33 1989-1993 382 120 31 27-36 1994 53 16 30 20-44 1995 61 22 36 25-49 1996 58 17 29 19-42 1997 56 14 25 16-38 1998 38 14 37 23-53 1994-1998 266 83 31 26-37 1999 37 16 43 29-59 2000 44 10 23 13-37 2001 46 12 26 16-40 2002 34 13 38 24-55 2003 31 12 39 24-56 1999-2003 192 63 33 27-40 Total known 1 258 402 32 29-35 Died before 5 years of age
47 -
Walking status at age five not known
55
-
fluently at age three years compared with nine per cent at age five years and three per cent were walking fluently at both three and five years. A fifth of children showed improvement in walking ability between ages three and five, a tenth had deteriorated and ambulation was unchanged for just over two-thirds.
ORECI
80
Table 38. Walking ability levels at the age of three years and five years in children with cerebral palsy, 923 children born 1984-2003 Percentage of all children (923) with data at both
age three and age five years
Walking ability at 5 years Walks
fluently Functional, non-fluent
Restricting life style
Not walking Total
Walking ability at 3 years
Walks fluently 3 3 0 0 6 Functional, non-fluent 6 24 4 1 35 Restricting life style 0 7 8 2 17 Not walking 0 2 6 34 42 Total 9 36 18 37 100 Percentages in blue-bordered boxes indicate the proportion of children with walking ability unchanged between ages three and five years. Percentages beneath those in the blue boxes indicate improvement with age, those above indicate deterioration. c. Gross Motor Function Classification System (GMFCS) As interest has moved away from purely identifying impairments and towards the practical effects of those impairments on function, ‘walking ability’ has become too simplistic a term for the need to move around in every day life. The ability to measure how well a child can use aids to ambulate in a clinical setting may be irrelevant to the same child’s mobility around their own home or when accompanying the family on shopping trips and so on.
As an alternative means of assessing severity of disability we began to collect functional assessments from clinicians using the Gross Motor Function Classification System (GMFCS)23
for each child in spring 2002. In addition to ages 6 to 12 years, the GMFCS has now been validated and shown to be consistent for ages 12 to 18 years24. The GMFCS levels (age 6 to 12) are supplied in Appendix 8.
Although we have a few GMFCS levels for children born in earlier years, most of the completed GMFCS were for birth years 1995 and later. Completeness for birth years 1997 to 2003 averaged 95 per cent, having gradually increased to 100 per cent for 2002 births, 98% for 2003 births. Twenty-three children born between 1995 and 2003 have died and 13 of these have been assigned a GMFCS level; two were classified Level II and eleven were classified Level V. Seventy per cent of those classified Level V were of normal birthweight.
In his study using 4Child data, Chris Morris found the proportions reported in the GMFCS Levels I and II combined were very similar to those in other studies.25, 26, 27 Proportions in each level most closely resembled those reported in the Northern Ireland CP Register.
The proportion of children with GMFCS Levels I and II were very similar for birthweights under 1500g and for those of normal birthweight as shown in Table 39. Normal birthweight children have a much greater proportion (24%) in the most severely affected group, Level V, than do the <1500g birthweight group (10%), however.
81
Table 40. Gross Motor Function Classification by birthweight group in children with cerebral palsy, birth years 1995 to 2003 Birthweight group (g) Numbers Percentages
<1500g 1500-2499g
2500g and
over All
weights <1500g 1500-2499g
2500g and
over All
weights GMFCS
Level Level I 26 32 69 127 34 34 33 33 Level II 16 16 46 78 21 17 22 20 Level III 13 16 20 49 17 17 9 13 Level IV 14 17 26 57 18 18 12 15 Level V 8 14 51 73 10 15 24 19 77 95 212 384 100 101a 100 100
a rounding error
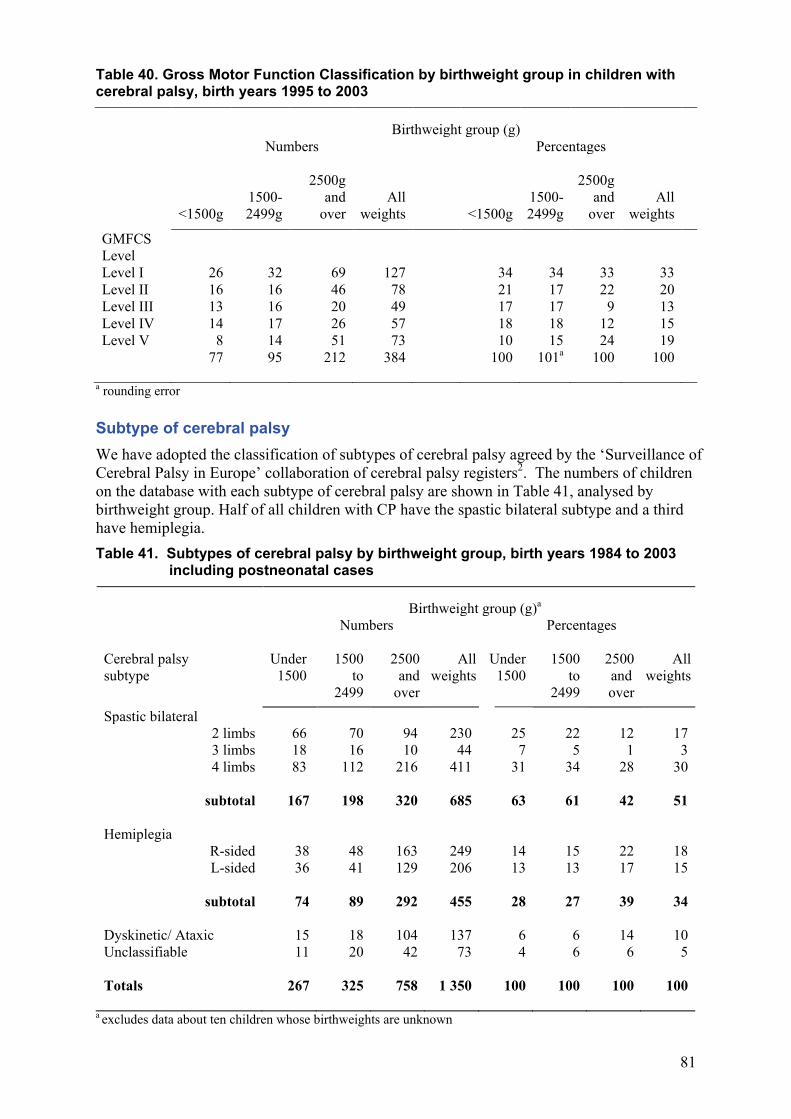
Subtype of cerebral palsy We have adopted the classification of subtypes of cerebral palsy agreed by the ‘Surveillance of Cerebral Palsy in Europe’ collaboration of cerebral palsy registers2. The numbers of children on the database with each subtype of cerebral palsy are shown in Table 41, analysed by birthweight group. Half of all children with CP have the spastic bilateral subtype and a third have hemiplegia. Table 41. Subtypes of cerebral palsy by birthweight group, birth years 1984 to 2003 including postneonatal cases
Birthweight group (g)a Numbers Percentages Cerebral palsy subtype
Under 1500
1500 to
2499
2500 and
over
All weights
Under 1500
1500 to
2499
2500 and over
All weights
Spastic bilateral 2 limbs 66 70 94 230 25 22 12 17 3 limbs 18 16 10 44 7 5 1 3 4 limbs 83 112 216 411 31 34 28 30
subtotal 167 198 320 685 63 61 42 51
Hemiplegia
R-sided 38 48 163 249 14 15 22 18 L-sided 36 41 129 206 13 13 17 15
subtotal 74 89 292 455 28 27 39 34
Dyskinetic/ Ataxic 15 18 104 137 6 6 14 10 Unclassifiable 11 20 42 73 4 6 6 5 Totals 267 325 758 1 350 100 100 100 100
a excludes data about ten children whose birthweights are unknown
82
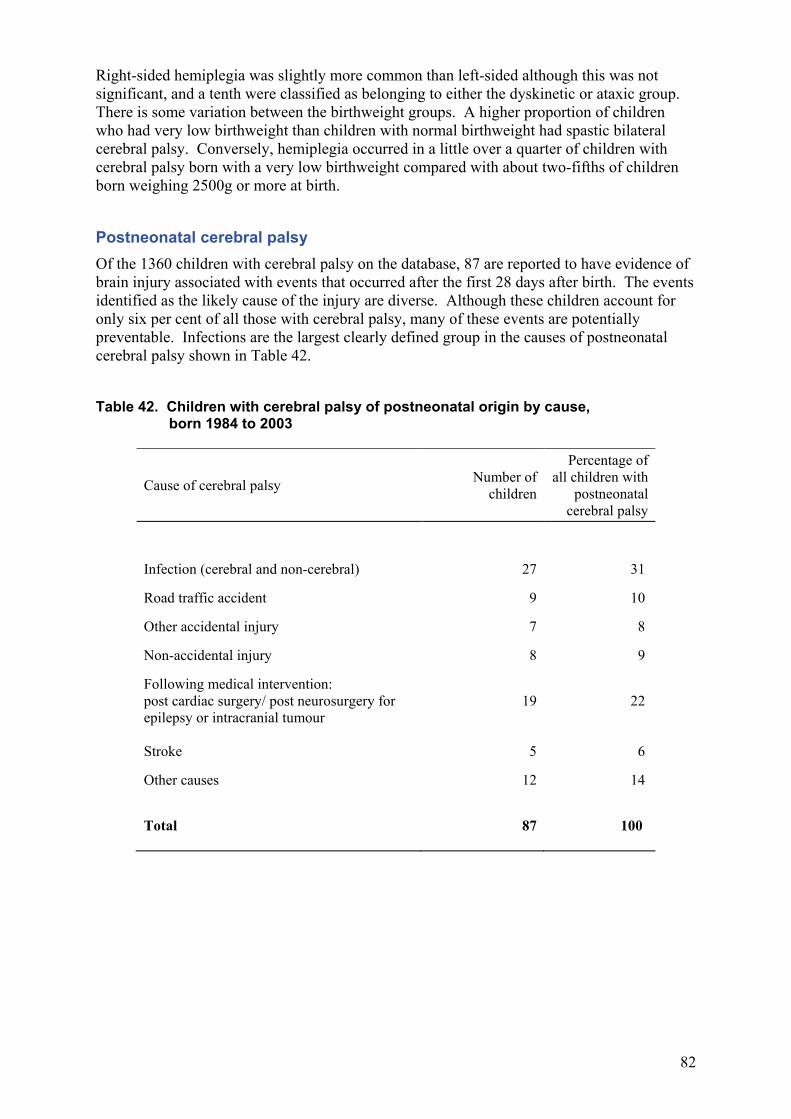
Right-sided hemiplegia was slightly more common than left-sided although this was not significant, and a tenth were classified as belonging to either the dyskinetic or ataxic group. There is some variation between the birthweight groups. A higher proportion of children who had very low birthweight than children with normal birthweight had spastic bilateral cerebral palsy. Conversely, hemiplegia occurred in a little over a quarter of children with cerebral palsy born with a very low birthweight compared with about two-fifths of children born weighing 2500g or more at birth. Postneonatal cerebral palsy Of the 1360 children with cerebral palsy on the database, 87 are reported to have evidence of brain injury associated with events that occurred after the first 28 days after birth. The events identified as the likely cause of the injury are diverse. Although these children account for only six per cent of all those with cerebral palsy, many of these events are potentially preventable. Infections are the largest clearly defined group in the causes of postneonatal cerebral palsy shown in Table 42. Table 42. Children with cerebral palsy of postneonatal origin by cause, born 1984 to 2003
Cause of cerebral palsy Number of children
Percentage of all children with
postneonatal cerebral palsy
Infection (cerebral and non-cerebral) 27 31
Road traffic accident 9 10
Other accidental injury 7 8
Non-accidental injury 8 9
Following medical intervention: post cardiac surgery/ post neurosurgery for epilepsy or intracranial tumour
19
22
Stroke 5 6
Other causes 12 14
Total 87 100
83
ACKNOWLEDGEMENTS For over a quarter century (now in its 27th year of data collection) 4Child, in its many incarnations, has been in operation. The database represents a rich and unique source of information about children with conditions that have a considerable impact on both them and their families. 4Child exists in an environment which is highly competitive for funding and highly reliant upon the goodwill and interest of a diverse range of people. We would like to thank all of those who have contributed so much to 4Child’s long life thus far.
The people 4Child is about people in all senses. Not only is the database about the individuals whose data are held on it but also the many people who contribute information. In the autumn we lost the programming support of Andy King which has been so vital to the design and development of the current database software. Andy has taken the post of Senior Trials Programmer at NPEU which will keep him even busier than he was already. Our thanks go to Andy for being such an important and stalwart member of the team who will be very much missed. We wish Andy all the very best in his new job. Helen Davenport has now been with us a year, has settled quickly and very much made the job her own. 4Child is much more than a database and requires a wide range of input to make it function effectively. 4Child relies on support from all the many families and children, clinicians and clerical staff who give of their time and effort.
Our thanks go first to the families and children who take part, and the health visitors, doctors and administrative staff at general practices.
Thanks, too, to the clinical and administrative staff at hospitals, child development centres and child health departments who do such a lot of work notifying, completing data forms and answering questions throughout the year.
Our advisory group are an integral part of the development of 4Child, particularly with regard to the ongoing work involved in the consent pilot study, and our thanks go to all of them. We would especially like to thank Mr Ian Mackenzie for his many years of contributing to the development of 4Child. Ian stepped down from the group in October 2009 to enjoy what we hope will be a long and happy retirement.
4Child is given considerable computing and administrative support by NPEU staff, for which we are immensely grateful.
Much help and advice is supplied by Office for National Statistics staff, in addition to the denominator data about live births in the four counties, for which we are very grateful.
There are many others, for example, in education services, who also play their part, and to all of them we send our thanks.
Funding 4Child is currently funded through the Health Care Quality Improvement Partnership. The NPEU is funded by a grant from the Department of Health in England. The views expressed in this report are those of the authors and do not necessarily reflect the views of the Department of Health.
84
The Advisory Group Mrs Kathryn Baker-Heyes, Orthoptist, Northampton Miss Hannah Bryan-Brown, lay member, Oxford Mr John Elston, Consultant Ophthalmologist, Oxford Ms Karin Gray, Scope, Gloucester Dr Mark Hunter (Chair), Consultant Community Paediatrician, Northampton Ms Julia Hyde, Community Paediatric Physiotherapist, HEPAC, Oxford Dr Rosalind Jefferson, Consultant Community Paediatrician, Reading Dr Jenny Kurinczuk, 4Child Medical Co-ordinator and Deputy Director of NPEU Professor Alison Macfarlane, Professor of Perinatal Health, The City University, London Mr Ian Mackenzie, Consultant Obstetrician & Gynaecologist, Oxford Dr Christopher Morris, Principal Orthotist, Oxford, now Senior Research Fellow in Child Health, Peninsula Medical School, University of Exeter Professor Andrew Wilkinson, Consultant Paediatrician, Oxford
Approvals Multi Centre Research Ethics approval was obtained from Thames Valley MREC, approval reference: 02/12/026, now Berkshire Research Ethics Committee, OREC/REC, Building L27, University of Reading, London Road, Reading, RG1 5AQ Approval for Section 60 Support was given by the Patient Information Advisory Group (PIAG), reference: 4-09(b)/2003, now administrated by the National Information Governance Board (NIGB), Floor 7 New Kings Beam House, 22 Upper Ground, London SE1 9BW Data Protection Act 1998, Registration number: Z575783X
85
REFERENCES
1. Surman G, Bonelli S, Chalmers J, Colver A, Dolk H, King A, Kurinczuk JJ, Parkes J, Platt MJ. UKCP: a collaborative network of cerebral palsy registers in the United Kingdom. J Pub Health. 2006;28(2): 148-56.
2. Surveillance of cerebral palsy in Europe: a collaboration of cerebral palsy surveys and registers. Surveillance of Cerebral Palsy in Europe (SCPE). Dev Med Child Neurol. 2000, 42(12) 816-824.
3. Surman G, Hemming K, Platt MJ, Parkes J, Green A, Hutton J, Kurinczuk JJ. Children with cerebral palsy: severity and trends over time. Paediatric and Perinatal Epidemiology. Published Online: Aug 11 2009 1:21. DOI: 10.1111/j.1365-3016.2009.01060.x
4. Dolk H, Pattenden S, Bonellie S, Colver A, King A, Kurinczuk JJ, Parkes J, Platt MJ, Surman
G. Socio-economic inequalities in cerebral palsy prevalence in the United Kingdom: a register based study. Paediatric and Perinatal Epidemiology. In press.
5. Blair E, Stanley FJ. Issues in the classification and epidemiology of cerebral palsy. Mental Retardation and Developmental Disabilities Research Reviews 1997; 3: 184-193.
6. Evans P, Johnson A, Mutch L, Alberman E. A Standard Form for Recording Clinical Findings in Children with a Motor Deficit of Central Origin. Dev Med Child Neurol. 1989 31:117-129.
7. Bax MCO. Terminology and classification of cerebral palsy. Dev Med Child Neurol. 1964 6:295-307.
8. Rosenbaum P, Paneth N, Leviton A, Goldstein M, Bax M, Damiano D, Dan B, Jacobsson B. A report: the definition and classification of cerebral palsy, April 2006. Dev Med Child Neurol Suppl. 2007 Feb; 109: 8-14.
9. Bodeau-Livinec F, Surman G, Kaminski M, Wilkinson AR, Ancel P, Kurinczuk JJ. Recent trends in visual impairment and blindness in the UK. Arch Dis Child. 2007;92:1099-1104.
10. Surman G, da Silva AAM, Kurinczuk JJ. Evaluation of an impairments register using capture-recapture techniques. Arch Dis Child, submitted Dec 2009.
11. Uvebrant P, Hagberg G. Intrauterine growth in children with cerebral palsy. Acta Paediatrica. 1992, 81(5):407-412.
12. Taipale P, Hiilesmaa V. Predicting delivery date by ultrasound and last menstrual period in early gestation. Obstet Gynecol. 2001 Feb; 97(2):189-94.
13. Clinical Guideline 6. Antenatal care: Routine care for the healthy pregnant woman. October 2003 National Institute for Clinical Excellence, Mid City Place, 71 High Holborn, London WC1V 6NA.
14. Roberts CL, Taylor L, Henderson-Smart D. Trends in births at and beyond term: evidence of a change? BJOG. 2005; 106: 937-942
15. Maternity bulletin retrieved 9 September 2009 from Department of Health website: http://www.dh.gov.uk/PublicationsAndStatistics/Publications/PublicationsStatistics/PublicationsStatisticsArticle/fs/en?CONTENT_ID=4107060&chk=IY7Bqa
16. Maher J, Macfarlane A. Trends in live births and birthweight by social class, marital status and mother’s age, 1976–2000. Health Statistics Quarterly downloaded 9 September 2009 from: http://www.statistics.gov.uk/downloads/theme_health/HSQ23.pdf
17. Acquired damage to the developing brain: timing and causation. Ed. Waney Squier. Arnold 2002.
18. Back SA, Luo NL, Borenstein NS, Levine JM, Volpe JJ, Kinney HC. Late oligodendrocyte progenitors coincide with the developmental window of vulnerability for human perinatal white matter injury. The Journal of Neuroscience. 2001, 21(4):1302-1312.
86
19. Himmelmann K, Hagberg G, Beckung E, Hagberg B, Uvebrant P. The changing panorama of cerebral palsy in Sweden. IX. Prevalence and origin in the birth-year period 1995-1998. Acta Paediatrica. 2005; 94:287-294.
20. Child Growth Foundation, 2 Mayfield Avenue, London W4 1PW.
21. Topp M, Huusom LD, Langhoof-Roos J, Delhumeau C, Hutton JL, Dolk H. Multiple birth and cerebral palsy in Europe: a multicenter study. Acta Obstet Gynecol Scand. 2004 83: 548-553.
22. Surman G, Newdick H, Johnson A. Cerebral palsy rates among low-birthweight infants fell in the 1990s. Dev Med Child Neurol 2003, 45(7): 456-62.
23. Palisano R, Rosenbaum P, Walter S, Russell D, Wood E, Galuppi B. Development and reliability of a system to classify gross motor function in children with cerebral palsy. Dev Med Child Neurol. 1997, 39, (4): 214-223.
24. Morris C, Dias LS (Eds). Paediatric Orthotics (No. 175 in Clinics in Developmental Medicine series). 2007. Mac Keith Press, 30 Furnival Street, London EC4A 1JQ.
25. Beckung E, Hagberg G. Correlation between ICIDH handicap code and Gross Motor Function Classification System in children with cerebral palsy. Dev Med Child Neurol. 2000 Oct;42(10):669-73.
26. Beckung E, Hagberg G. Neuroimpairments, activity limitations, and participation restrictions in children with cerebral palsy. Dev Med Child Neurol. 2002 May;44(5):309-16.
27. Parkes J, Dolk H, Hill N. Children and Young People with Cerebral Palsy in Northern Ireland - Birth years 1977-1997. 2005. A Comprehensive Report from The Northern Ireland Cerebral Palsy Register. Queen’s University Belfast.
87
Useful and Related Websites 4Child http://www.npeu.ox.ac.uk/4child/
Congenital Anomaly Register for Oxfordshire, Berkshire and Buckinghamshire (CAROBB)
http://www.npeu.ox.ac.uk/carobb
General Medical Council
http://www.gmc-uk.org/guidance/current/library/confidentiality_faq.asp
National Information Governance Board, Patient Information Advisory Group
http://www.dh.gov.uk/ab/PIAG/index.htm
Surveillance of Cerebral Palsy in Europe (SCPE)
http://www-rheop.ujf-grenoble.fr/scpe2/site_scpe/index.php
Collaborative Network of Cerebral Palsy Registers and Surveys in the UK (UKCP)
http://www.liv.ac.uk/PublicHealth/ukcp/UKCP.html
Gross Motor Function Classification System http://www-fhs.mcmaster.ca/canchild/
Revised and expanded GMFCS documents are available at
http://www.canchild.ca/en/measures/gmfcs.asp
Statistics Authority UK (ONS) http://www.statisticsauthority.gov.uk/