sensor technology interface - egr.msu.edu · produced. we are hoping to sell 10,000+ of these...
TRANSCRIPT

Sensor Technology Interface
Final Report
Sponsor
FitnessMetrics, LLC
ECE 480 Team 1
Nick Henry
Kelton Ho
Nick Huff
Robert Pollum
Brian Wirsing

1
Executive Summary
Modern society is interlinked through a network of not only people, but their respective
electronic devices as well. The devices permeate people’s lives so thoroughly that it is rare to see
someone without an electronic device, be it a watch, a cellphone, a computer.
Yet, these devices have not even touched the surface of what is possible.
Recent research has delved into so called “smart” devices. These smart devices are
ordinary, everyday gadgets that together with sensors widely broaden the possibilities of what is
capable. However, there are just as many types of sensors as there are electronic devices.
To communicate with each of these sensors through custom hardware is an expensive and
tedious process. Hence, there is a need for a system that can flawlessly connect different sensors
and make sense of this data.
We have developed an open source microcontroller on which users can connect a wide
variety of sensors to their smartphone. Our design creates a cheap and easy interface in which
everyday people can connect the sensors in their lives while making that data meaningful. The
microcontroller paired with the included Android app will give people the tools they need to
bridge the data collected by electronics with the reality, widening the gap for what is real and
possible.
Acknowledgments:
The scope for this project was wide and the possibilities far. Without the support of the
sponsors, facilitator, and others, this project could not have been completed. Specifically, the
team would like to thank:
Our sponsors Anthony Carriveau and Bernie Holmes for providing funding, advice and
their continuing support for a developing project.
Andy Rubin and Massimo Banzi for allowing their respective Android platform and
Arduino microcontrollers to be open-sourced and available for all.
Our families for their support through a time-consuming semester.

2
Table of Contents
Chapter 1 - Introduction and Background 4
Introduction 4
Background 5
Chapter 2 - Solution Exploration and Selection 7
Section 1 - FAST Diagram 7
Section 2 - House of Quality 8
Section 3 - Budget 9
Section 4 - GANTT Chart 12
Chapter 3 - Technical Work Performed 15
Section 1 - Hardware Design Efforts 15
Section 2 - Hardware Implementation 16
Section 3 - Software Design Requirements 20
Section 4 - Software Implementation 20
Subsection 1 - Microcontroller Program 21
Subsection 2 - Android Application 25
Chapter 4 - Testing 32
Section 1 - Hardware Testing 32
Section 2 - Software Testing 33
Chapter 5 - Conclusions 36
Section 1 - Final Prototype 36
Section 2 - Cost 36
Subsection 1 - Prototype Cost 36
Subsection 2 - Production Cost 37
Section 3 - Schedule 37
Section 4 - Findings 37
Section 5 – Future Work 38
Appendix 1 - Technical Roles 40
Nick Henry 40

3
Kelton Ho 41
Nick Huff 42
Robert Pollum 43
Brian Wirsing 44
Appendix 2 - References 47
Appendix 3 - Technical Attachments 47

4
Chapter 1 – Introduction and background
Introduction
Sensors are becoming increasingly prevalent in our everyday lives. Members of society
are surrounded by various kinds of sensors that send and receive information. The protocols used
by these sensors can vary drastically; variations include sensors that are wired or wireless, analog
or digital. Viewing the data from all of these sensors was shown to be of high priority. Usually,
each sensor is connected to a unique user interface which displays that sensor’s information.
Therefore, in order to view the information from five different sensors, one needs to get it from
five different UIs, which is not ideal. This causes clutter and creates a hassle for users who are
increasingly trying to become more connected to their personal networks.
One solution to this problem is to consolidate the information from these sensors onto
one platform, which can then display all of the sensors’ data into one UI. This platform consists
of two components: a sensor interface (SI) to receive the sensor information, and an Android app
to display the information to the user. Having a user friendly UI will aid in adoption while
programmers can add new features. Since its inception, the Sensor Interface has been an open
source platform, creating the unique advantage of possibly having thousands of developers all
working on this product. By designing with the open-source philosophy in mind, people can
contribute their personal skills and creativity in order to create a one-of-a-kind product that will
continuously evolve into a more advanced and efficient platform.
The constraints of the Sensor Technology Interface Project were broad, and left a lot of
room for creative input. The four main constraints were cost, size, power, and types of sensors.
Keeping the microcontroller open source was also a high priority so that others can build off of
what the project will start. Low cost was of a high priority as keeping the Sensor Interface low
cost allows for larger adoption rates and long term lower costs once they are hopefully mass
produced. We are hoping to sell 10,000+ of these microcontrollers within the next few years with
an expected cost around $25. As more people adopt the microcontroller into their everyday lives,
the cost could potentially lower even further.
When a portable device is being designed, the size-to-power ratio will always be of
concern. Designing with the small size in mind allows the microcontroller to be used in
5
applications where larger designs would not be feasible . This microcontroller could be put into
appliances, toys, clothes, etc. A smaller size remains a higher priority over power consumption,
but power use is still important. The design allows the microcontroller to last several months on
one charge, which will allow it to be kept in use for long periods of time without any form of
maintenance. Having the microcontroller constantly communicate its data over Bluetooth
drastically reduces its battery’s lifetime. Therefore, the microcontroller has local storage in the
an SD card slot. This enables the microcontroller to store data and send it in intervals specified
by the user.
Background
On the hardware side, there are a number of products currently on the market that can
perform some of the requirements of this project. The RFDuino is the best example [1]. The
RFDuino is a small microcontroller with a built-in Bluetooth module. It is able to perform many
of projects functions, such as communicating with wired and wireless sensors, transmitting
information to an Android device via Bluetooth, and storing data to an SD card. However, the
main problem with this solution, along with many others like it, is that the RFDuino must be
programmed to perform this operation. This makes the RFDuino an impossible solution for users
who don’t know how to program, and an impractical solution for those that can program, but
don’t want to. A better product would already have the code pre-compiled, the input ports
clearly labeled, and require little to no setup from the user.
On the software side, there are some Android apps that interface with certain
microcontrollers. One example is ArduDroid [2]. This app communicates with an Arduino
microcontroller via a Bluetooth connection. Using ArduDroid, users can read data coming from
an Arduino board, send data back to the Arduino board, and configure Arduino GPIO pins to
function as either input or output. The main problem with this app is that it does not perform the
specific functions required, such as listing multiple Arduino port outputs, saving data, and
graphing data history. To accomplish these tasks, an app should be designed from scratch with
these functions in mind.
The sensor interface will ultimately work with smart phones, specifically Android
devices, which pride themselves on being sleek, stylish, and above all, open. The portability and
6
creative nature of the design needed to match the idea of the internet being in more and more
products. The bulk of our design was not our only convenience issue; The design should also not
require constant maintenance in the form of charging or changing batteries too frequently. All of
these features would be beside the point if no one had an interest in using this device, so we had
to create interesting functionality and innovative features to draw people into wanting to have
this attached to their phones at all times.
In order to implement this functionality, a list of required parts for the microcontroller to
interface with was created. There will need to be many forms of inputting and outputting data
via wired and wireless connections. This data must be able to be stored until it is able to be
buffered and sent to the phone. The data collected had to have a reasonable level of quality and
real time streaming capabilities which meant time stamping all of the information collected as
well as sampling frequently in order to get a smooth plot of whatever information a sensor might
be transmitting. All of this data would mean nothing without a user interface for the Android
devices. The Android device must be able to input the data from the microcontroller and
organize and display it in a way that is convenient for the user. Once it has displayed this data it
will then upload to a cloud form of storage to be further processed. There are many other features
that an optimal, but not realistically viable given our time frame and other constraints.

7
Chapter 2 – Solution Exploration and Selection
Section 1 – FAST Diagram
The complete system design with its logical components is more easily presented by
utilizing the FAST diagram. The FAST diagram is able to take what could possibly be a
complicated project and break it down to an easy to follow format. Having a recognizable format
such as this enables the designer to best focus their efforts on what is needed in the final product.
The FAST diagram developed by the team is shown below.
Figure 2.1 - Fast Diagram
8
The Sensor Interface can be broken down into three main components: The Android app,
the microcontroller, and the sensors which it communicates with. The Android app and
microcontroller are essentially the support behind the sensors to collect, store, transfer and
display data. Designing more advanced sensors was beyond the scope of this project, so the
Android app and microcontroller became the areas of focus. The Sensor Interface was designed
to accept a wide variety of sensors, Bluetooth, analog, digital, wired and I2C. Any of the sensors
can also be connected to another Bluetooth module to allow a wide variety of wireless sensors to
communicate with the central Sensor Interface microcontroller. Once the microcontroller has
logged data from the microcontroller, it stores the data via a microSD card. Storing the data in
with an onsite microSD card has several advantages, most of which that it allows for minimal
power consumption by not constantly transferring the data to the Android phone. Logging data in
this way allows the microcontroller to store data for weeks or months without any
communication to the Android phone if desired. Once the data is wanted, simply connecting the
Android phone to the microcontroller will transfer the data to the phone once the Android app is
launched. From there, the phone can display the data and use it as the user sees fit.
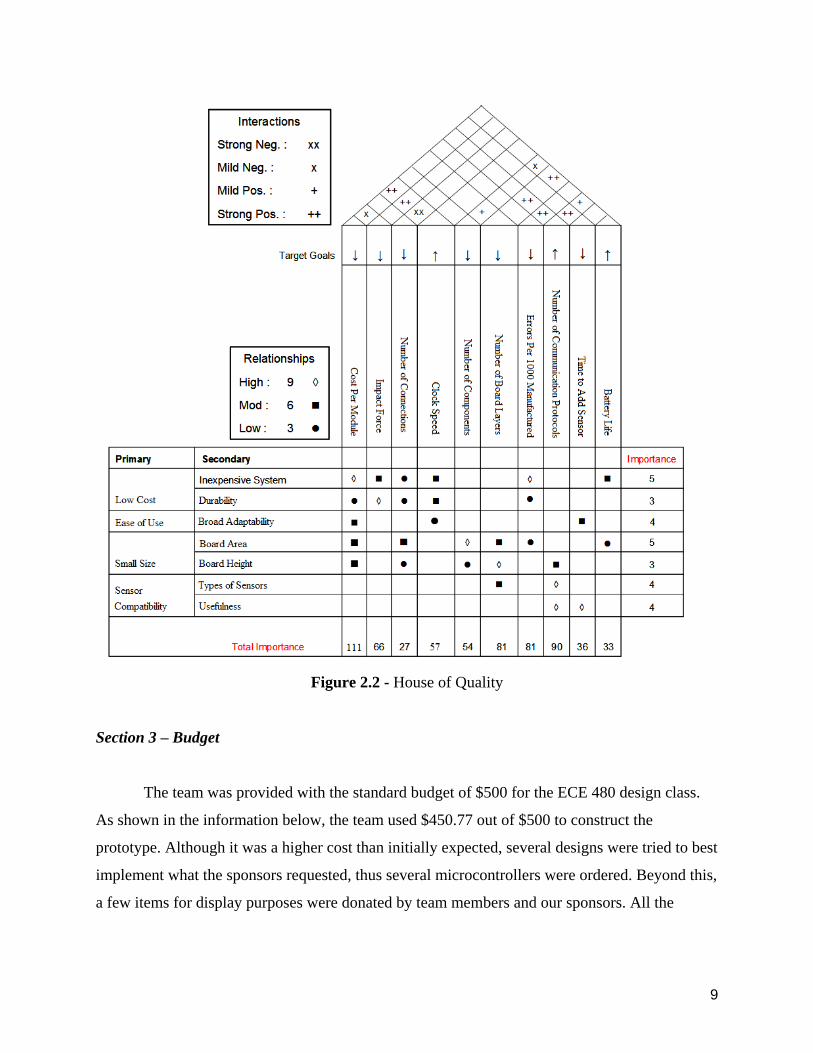
Section 2 – House of Quality
The House of Quality provides excellent insight into translating what the customer wants
are into what can be done. By organizing the customer’s wants by order of importance, we can
effectively gauge how our design can be improved against measurable engineering field data.
This methodology forces the designer to look past the obvious and really learn to put out a
product that can match and exceed the customers’ expectations. The House of Quality completed
for the team is shown below.
9
Figure 2.2 - House of Quality
Section 3 – Budget
The team was provided with the standard budget of $500 for the ECE 480 design class.
As shown in the information below, the team used $450.77 out of $500 to construct the
prototype. Although it was a higher cost than initially expected, several designs were tried to best
implement what the sponsors requested, thus several microcontrollers were ordered. Beyond this,
a few items for display purposes were donated by team members and our sponsors. All the
10
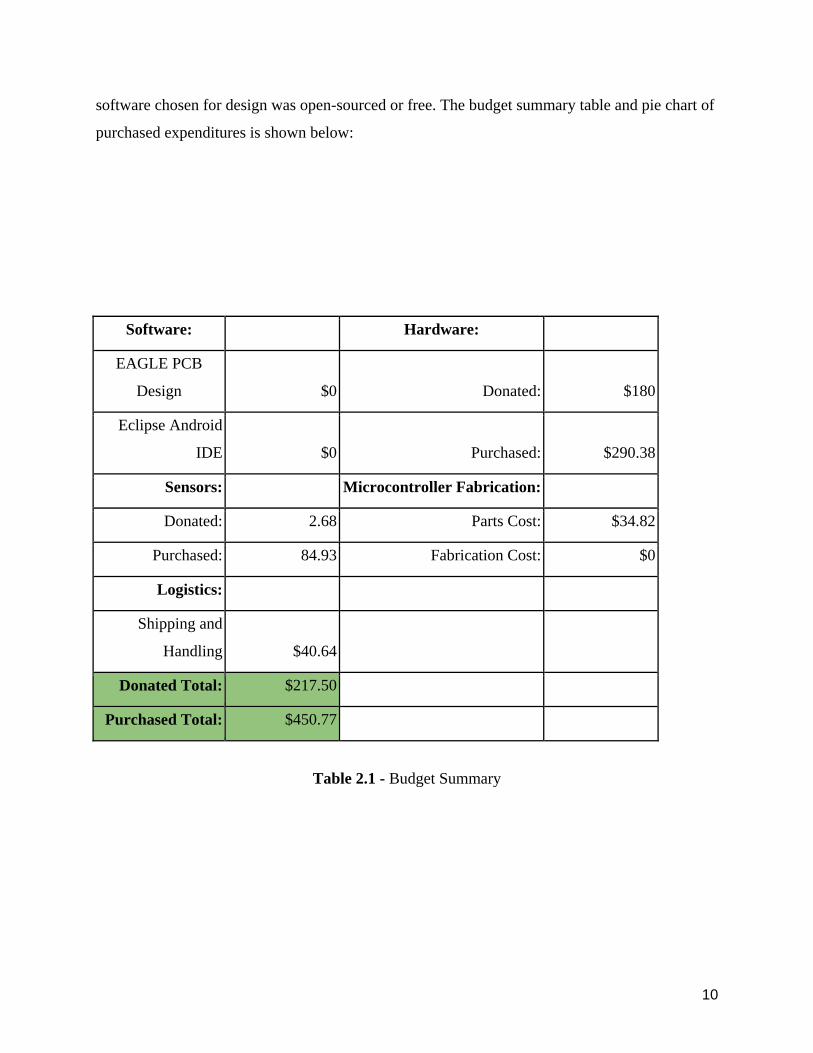
software chosen for design was open-sourced or free. The budget summary table and pie chart of
purchased expenditures is shown below:
Software: Hardware:
EAGLE PCB
Design $0 Donated: $180
Eclipse Android
IDE $0 Purchased: $290.38
Sensors: Microcontroller Fabrication:
Donated: 2.68 Parts Cost: $34.82
Purchased: 84.93 Fabrication Cost: $0
Logistics:
Shipping and
Handling $40.64
Donated Total: $217.50
Purchased Total: $450.77
Table 2.1 - Budget Summary
11
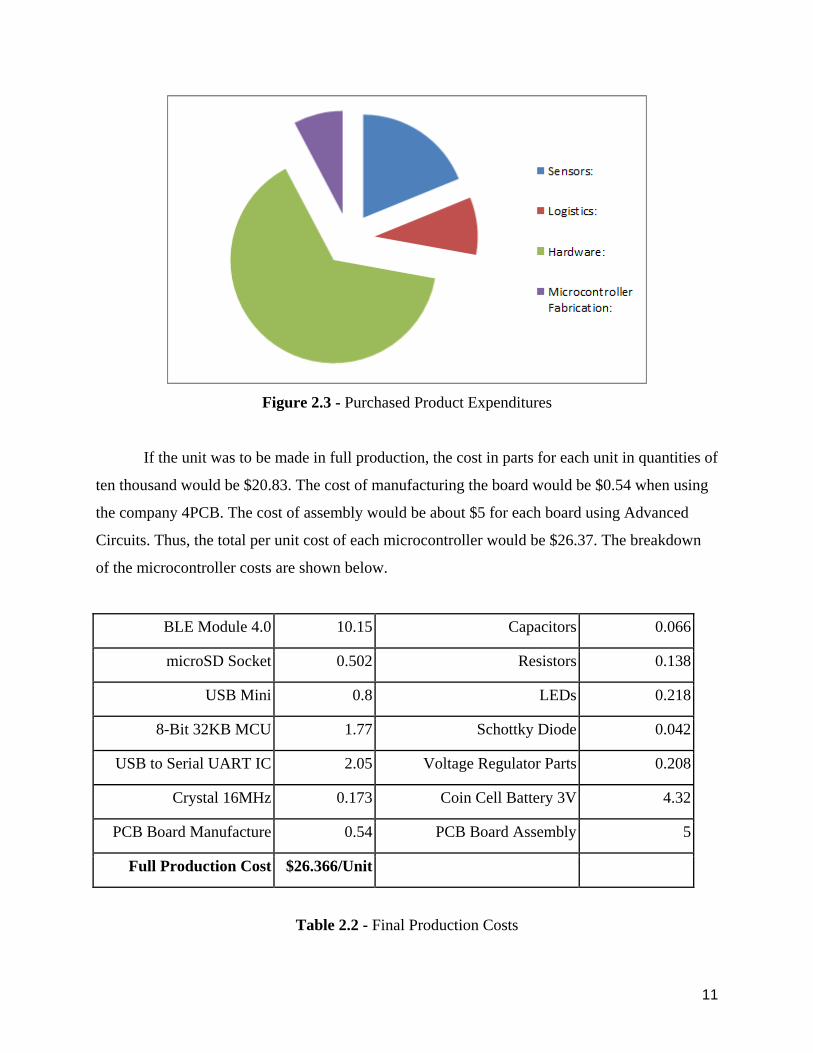
Figure 2.3 - Purchased Product Expenditures
If the unit was to be made in full production, the cost in parts for each unit in quantities of
ten thousand would be $20.83. The cost of manufacturing the board would be $0.54 when using
the company 4PCB. The cost of assembly would be about $5 for each board using Advanced
Circuits. Thus, the total per unit cost of each microcontroller would be $26.37. The breakdown
of the microcontroller costs are shown below.
BLE Module 4.0 10.15 Capacitors 0.066
microSD Socket 0.502 Resistors 0.138
USB Mini 0.8 LEDs 0.218
8-Bit 32KB MCU 1.77 Schottky Diode 0.042
USB to Serial UART IC 2.05 Voltage Regulator Parts 0.208
Crystal 16MHz 0.173 Coin Cell Battery 3V 4.32
PCB Board Manufacture 0.54 PCB Board Assembly 5
Full Production Cost $26.366/Unit
Table 2.2 - Final Production Costs
12
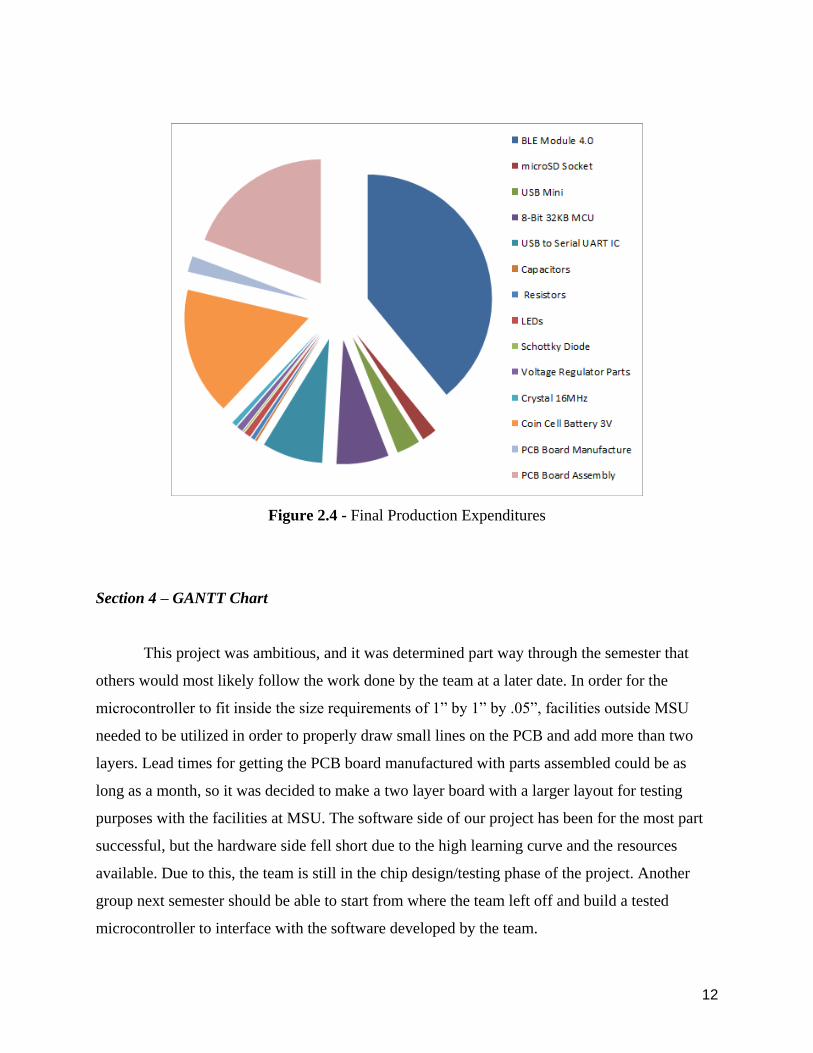
Figure 2.4 - Final Production Expenditures
Section 4 – GANTT Chart
This project was ambitious, and it was determined part way through the semester that
others would most likely follow the work done by the team at a later date. In order for the
microcontroller to fit inside the size requirements of 1” by 1” by .05”, facilities outside MSU
needed to be utilized in order to properly draw small lines on the PCB and add more than two
layers. Lead times for getting the PCB board manufactured with parts assembled could be as
long as a month, so it was decided to make a two layer board with a larger layout for testing
purposes with the facilities at MSU. The software side of our project has been for the most part
successful, but the hardware side fell short due to the high learning curve and the resources
available. Due to this, the team is still in the chip design/testing phase of the project. Another
group next semester should be able to start from where the team left off and build a tested
microcontroller to interface with the software developed by the team.

13
Figure 2.5 - Initial GANTT Chart Part A
14
Figure 2.6 - Initial GANTT Chart Part B

15
Chapter 3 – Technical Work Performed
Section 1 – Hardware Design Efforts
The Sensor Interface’s hardware requirements include a microcontroller, a Bluetooth
module, an SD card module, and a battery. The microcontroller is responsible for collecting
connected sensor readings, altering sensor parameters, and transferring sensor readings to the
other hardware components when necessary. It must be able to read both analog sensors and
digital I2C sensors. The SD card module’s role is to provide a large memory space to store sensor
readings over long periods of time, our minimum requirement was set at one hour. This module
should both write to an SD card and read from an SD card when required. The Bluetooth module
is needed to communicate with the Android device. It receives commands from the Android
device and sends them to the microcontroller so that it can perform the correct task. The
Bluetooth module also transmits sensor readings back to the Android device. These modules can
all be purchased separately and connected with wires together in order to implement a design
where all of this functionality is joined; however having separate modules would be clunky and
inconvenient for travel. The team’s proposed solution was to design a microcontroller that
included all of these parts on one board so that it can remain small and efficient in design.
In order to create a customized microcontroller first a list was created containing every
component the microcontroller would need on the board, first using through hole components in
order to create a prototype design (see Table 3.1.1) and then using SMT package components in
order to be prepared for future advances. The microcontroller board that was designed houses a
micro USB port, a BLE module, a coin cell battery, and a microSD card shield along with the
standard components necessary for a chip to control the incoming and outgoing data. Designing
this product in the Eagle software takes careful planning and time to continually adjust where
traces through the board will be routed. Eagle contains a large number of components in
premade libraries. These built-in parts covered nearly everything needed to add to the design,
however some of the more specific components had to be added to the design manually. The
BLE module, coin cell shield, and micro SD shield were the only three parts not already included
in the libraries. To get these designs to populate in the same space as the rest of the board the
16
eagle files needed to be imported from manufacturer websites which required use of the
professional version of the software. These are imported as separate schematics but can be
edited simultaneously with the main schematic and attached by using labels instead of wires to
join the different ports. Even with separate schematics the physical layouts are represented in the
same board layout page. Once all of the components are populated into the board they needed to
be manually arranged in the board space we allocated, this was 3” by 3” for the original
prototype. In order to fit all of the components in the through hole style careful arrangement of
parts was needed on both the top and bottom of the board, this proved to be a challenge when
routing traces as the bottom is typically reserved for routing only. Routing traces can begin by
using the auto-route function built into Eagle. This however will not make every connection
necessary for the board to function if it cannot find an easy path from point A to B. With the
remaining connection a path must be manually connected along with vias to connect the ports
from the different components. This task should be done with utmost care as this is where errors
are most likely to be made during this process for instance errors we discovered after our board
had been manufactured were that some of the traces were drawn too close together and the
machinery that was available to the team could not cut the copper with enough precision, this led
to several pads being treated as one which shorted many connections. Using higher precision
equipment could have solved this problem which would have required the team to send the
design to an outside source to be manufactured which would require time and money that was
unavailable at this point in the design process. This problem would have also been avoided if the
SMT package components were being used instead of the larger through-hole versions. This
would have saved valuable space which could have been used for routing. The schematic
designs and board layout (pictured in Appendix III figures 3.1.1-3.1.6) that were manufactured
are not able to replace the Arduino board for the team at this point in time, however reprocessing
these until they are fully functional is the next logical step in creating a product such as this for
the market. This would lower the cost and raise the utility and convenience for the product.
Section 2 – Hardware Implementation
The microcontroller used is an Arduino Uno, shown in Figure 3.1. This is a popular
microcontroller that is easy to wire and program. It has sufficient analog input ports to read from

17
various analog sensors simultaneously, and also features a Serial Data (SDA) line and a Serial
Clock (SCL) line. Both an SDA line and an SCL line are required to support I2C sensors. With
these input ports, the Arduino Uno is able to read from three different analog sensors and two
digital sensors simultaneously. Furthermore, the Arduino Uno includes Serial Peripheral
Interface (SPI) functionality, which allows it to interface with certain peripheral hardware
devices, such as SD card modules. On top of this, the board also allows digital ports to be
configured to act as Serial Receive (RX) or Serial Transmit (TX) lines. These are necessary to
connect with a Bluetooth module correctly. Finally, because of its popularity, many hardware
modules are designed to work specifically with Arduino microcontrollers, including those that
the Sensor Interface requires, like Bluetooth modules and SD card modules.
Figure 3.1 - Arduino Uno
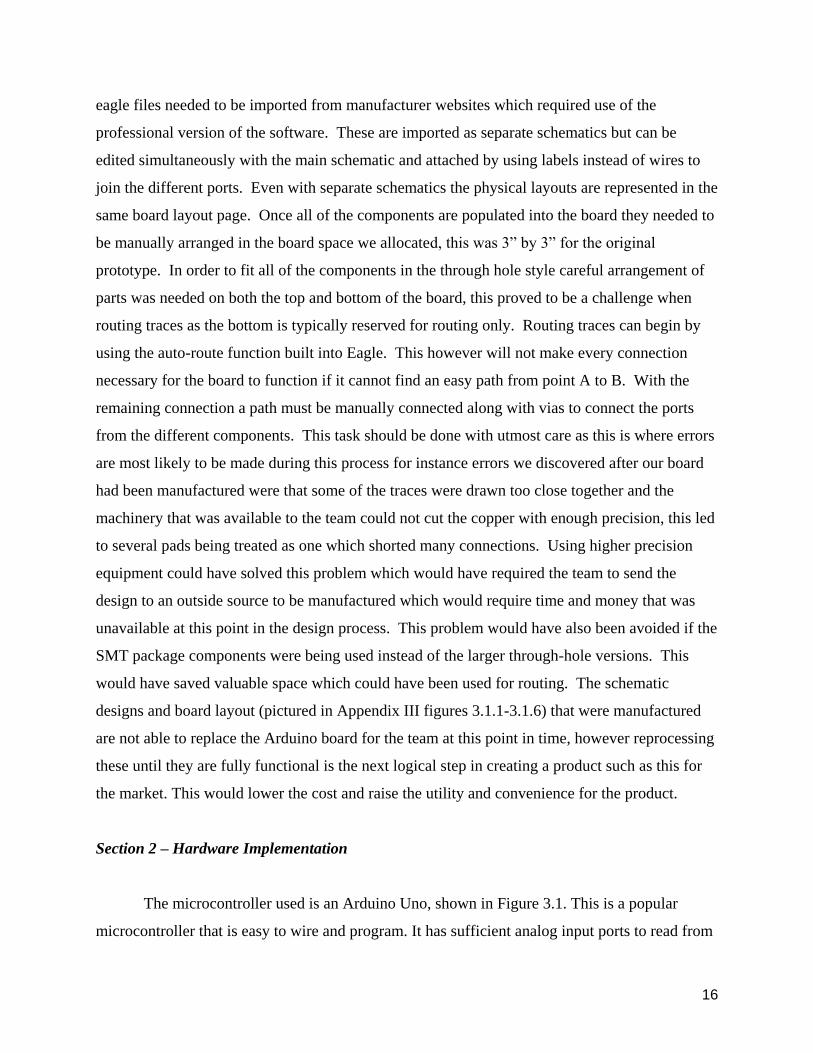
The Bluetooth module used is the Sunkee HC-05 Bluetooth Module, shown in Figure 3.2.
This module is cheap, readily available, and quick to acquire. It is also designed to ensure
compatibility with Arduino microcontrollers. Furthermore, it is highly customizable, such as
allowing its name to be changed, modifying its access password, and switching from master
mode to slave mode. This last feature is important because it will enable future development of
the Sensor Interface to add wireless Bluetooth sensor reading functionality. To communicate
with Bluetooth sensors, the module should be in Master mode. However, when communicating
with the Android device, the module should be in Slave mode. This Bluetooth module’s ability
to switch between these 2 modes will allow the Sensor Interface to communicate with Bluetooth
sensors as wired sensors.
18
Figure 3.2 - Sunkee HC-05 Bluetooth Module
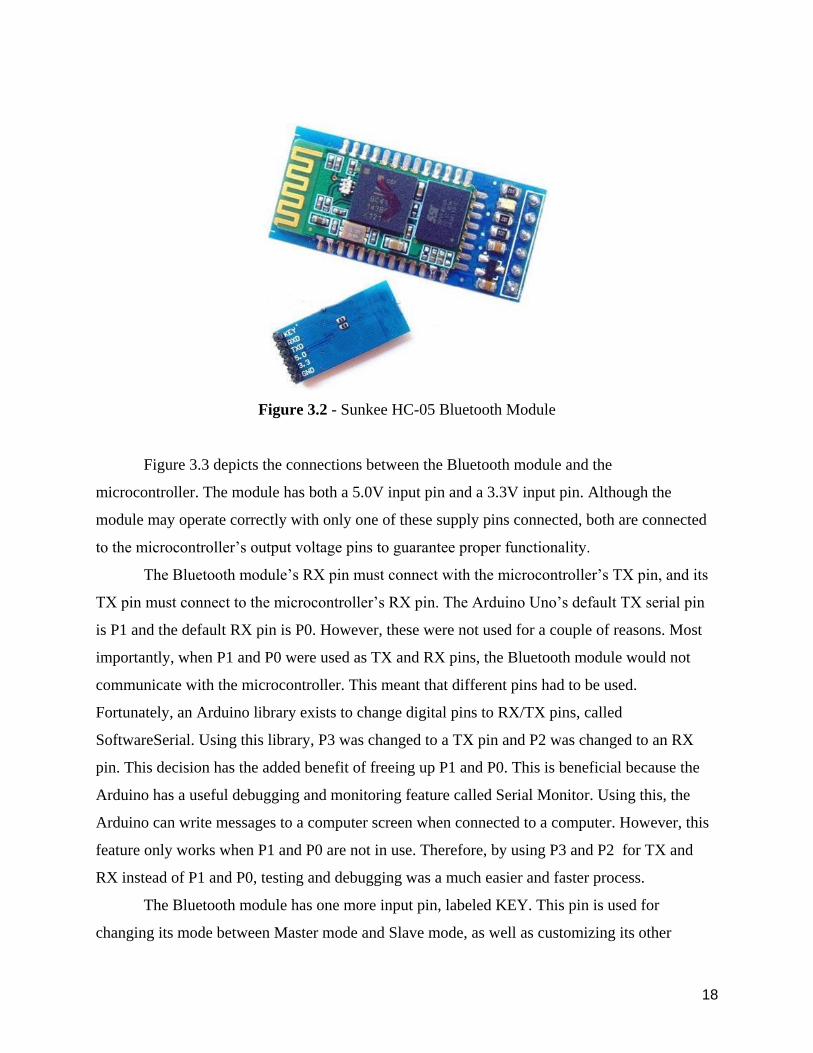
Figure 3.3 depicts the connections between the Bluetooth module and the
microcontroller. The module has both a 5.0V input pin and a 3.3V input pin. Although the
module may operate correctly with only one of these supply pins connected, both are connected
to the microcontroller’s output voltage pins to guarantee proper functionality.
The Bluetooth module’s RX pin must connect with the microcontroller’s TX pin, and its
TX pin must connect to the microcontroller’s RX pin. The Arduino Uno’s default TX serial pin
is P1 and the default RX pin is P0. However, these were not used for a couple of reasons. Most
importantly, when P1 and P0 were used as TX and RX pins, the Bluetooth module would not
communicate with the microcontroller. This meant that different pins had to be used.
Fortunately, an Arduino library exists to change digital pins to RX/TX pins, called
SoftwareSerial. Using this library, P3 was changed to a TX pin and P2 was changed to an RX
pin. This decision has the added benefit of freeing up P1 and P0. This is beneficial because the
Arduino has a useful debugging and monitoring feature called Serial Monitor. Using this, the
Arduino can write messages to a computer screen when connected to a computer. However, this
feature only works when P1 and P0 are not in use. Therefore, by using P3 and P2 for TX and
RX instead of P1 and P0, testing and debugging was a much easier and faster process.
The Bluetooth module has one more input pin, labeled KEY. This pin is used for
changing its mode between Master mode and Slave mode, as well as customizing its other

19
properties. These options are not used currently, but they may be in the future. Therefore, this pin
is connected to P4 on the Arduino Uno if property changes are ever desired.
Figure 3.3 - Microcontroller - Bluetooth Module Connectivity
The Bluetooth module used is the Kootek SD Card Module, shown in Figure 3.4. This is
an inexpensive component that was designed to function correctly when connected to Arduino
products. It supports both SD card reads and writes.
Figure 3.4 - Kootek SD Card Module
The connections between the SD card module and the microcontroller can be seen in
Figure 3.5. The SD card requires both a 5V and a 3.3V supply to consistently operate correctly.
During testing, only the 5V pin was connected, which resulted in correct SD accesses only every
other time. This problem was corrected by connecting the 3.3V pin to the microcontroller’s 3.3V
output as well.

20
The SD card module requires connections to the microcontroller’s SPI pins. These are the
Arduino’s P11, P12, and P13. P11 is the Arduino’s Master In Slave Out (MISO) pin, P12 is its
Serial Clock (SCK) pin, and P13 is its Master Out Slave In (MOSI) pin. These connect to the SD
card module’s corresponding pins. Furthermore, The SD card module needs a connection for
Chip Select (CS), which tells it whether or not it can communicate with the microcontroller. The
default pin for this on the Arduino Uno is P10.
Figure 3.5 - Microcontroller - SD Card Module Connectivity
Section 3 – Software Design Requirements
The software design of the Sensor Interface is composed of 2 major components: the
code describing the microcontroller program and the code describing the Android application.
The microcontroller code is responsible for managing the sensors that are connected to it, as well
as their readings. Determining which sensor ports to read from, how fast to read from them,
when to store sensor readings to the SD card, and when to transmit sensor readings to the
Android device is all defined in this code.
The Android application’s role is to act as the user interface for the user. It should display
information about all of the sensors connected to the microcontroller, as well as allow the user to
add sensors to monitor, delete sensors, and change sensor properties.
Section 4 – Software Implementation

21
Subsection 1 – Microcontroller Program
The primary role of the program on the microcontroller is to manage and monitor
sensors, so a data structure called Sensor is defined. Table 3.1 shows the elements that make up a
Sensor data structure. The microcontroller can monitor a maximum of five sensors, which
consist of three analog sensors and two digital sensors. These sensors are kept track of in a 5-
element array called mSensors. The first three elements are for analog sensors and the last two
elements are for digital sensors. The number representing index of the mSensors array will be
referred to as that corresponding sensor’s ID.
Name Type Description
mPort int Which physical port this sensor is connected to (0-4)
mValues[10] int Array of readings from this sensor.
mIndex int Current location in the values array
mLastSampleTime long Most recent time a reading was taken from this sensor
mSampleRate float Number of times a second that a sensor reading should occur
mEnabled boolean Whether or not reading for this sensor should take place
Table 3.1 - Sensor data structure
Arduino microcontrollers require two functions to be defined in their code: setup() and
loop(). When the Arduino runs its program, it runs setup() first, and only once. Afterwards, it
runs loop() repeatedly. The setup() function is useful for initializations, so the five sensors have
their data elements initialized. The three analog sensors correlate to analog ports A0, A1, and A2
on the Arduino Uno, so these values are assigned to the mPort element for mSensors[0],
mSensors[1], and mSensors[2], respectively. Digital I2C sensors all connect to the two analog
pins A4 and A5, and the way to differentiate between them is their component address. The
program stores this address value in the mPort element for mSensors[3] and mSensors[4].

22
The other data elements for all five sensors are initialized identically: mIndex is set to -1,
mLastSampleTime is set to millis(), mSampleRate is set to 1, and mEnabled is set to false. The
function millis() returns the amount of time that the program has been running in milliseconds.
By initializing mLastSampleTime to millis(), it effectively sets it to the current time.
There are a few other initializations that also take place in setup(). There are a number of
communication channels that must be set up. These are the serial channel to the Bluetooth
module, the communication channel to the SD card module, and the I2C channel to the digital
sensors. On top of these, a serial channel to the computer is useful to have for debugging
purposes. The Bluetooth and computer serial channels are initialized at a 9600 baud rate. Finally,
since the SD library is being used, the Arduino’s hardware Slave Select (SS) pin must be set as
an output for SD communication to function correctly. This is pin 10 on the Arduino Uno.
The loop() function accomplishes two tasks: sampling connected sensors at the correct
time and receiving commands from the Android device and performing them. For reading the
sensors, the following process takes place for each of the five sensors. First, the program checks
if the sensor’s mEnabled element is set to true. If so, then the program checks if the time elapsed
(in milliseconds) between mLastSampleTime and the current time (using millis()) is greater than
1000 / mSampleRate, the sample period in milliseconds. If this is true, then the microcontroller
should sample the sensor and retrieve a reading. However, a number of things happen prior to the
reading. First, the sensor’s mLastSampleTime element is set to the current time, using millis().
Then, the sensor’s mIndex element is incremented by 1. If the mIndex value at this point equals
10 then this signifies that the sensor’s mValues array is full. When this occurs, the
microcontroller writes the entire contents of this sensor’s mValues array to the SD card. The
microcontroller orders the SD card module to open a file named the sensor’s ID, appended by
“.txt”. For example, if sensor[2] is having its values written to the SD card, the SD card module
would open file “2.txt”. Then, all 10 sensor readings in the mValues array are written to the file,
one line for each reading. The last step in this process is to set the sensor’s mIndex element back
to 0.
Now, the microcontroller can retrieve a sensor reading. Depending on whether the sensor
is analog, or digital, the process differs slightly. For analog sensors, the microcontroller performs
an analogRead() on the sensor’s mPort, and assigns the resulting value to the sensor’s mValues
array at the current mIndex value. For digital sensors, the microcontroller performs
23
requestFrom() operation on the sensor’s address, which is stored in its mPort element. Then, the
microcontroller reads two values, which are the most significant byte (MSB) and least significant
byte (LSB) of the reading. To combine these two separate bytes into one data type, the MSB is
shifted left by 8 bits, using OR logic with the LSB, and then assigned to an integer variable. I2C
sensors return values of varying numbers of bits, so this new value should finally be shifted right
accordingly. For example, if the I2C sensor that was read returns 12-bit values, then the
combined integer value (16 bits) should be shifted right by 4 bits. This final value is then stored
in the sensor’s mValues array at the sensor’s current mIndex value.
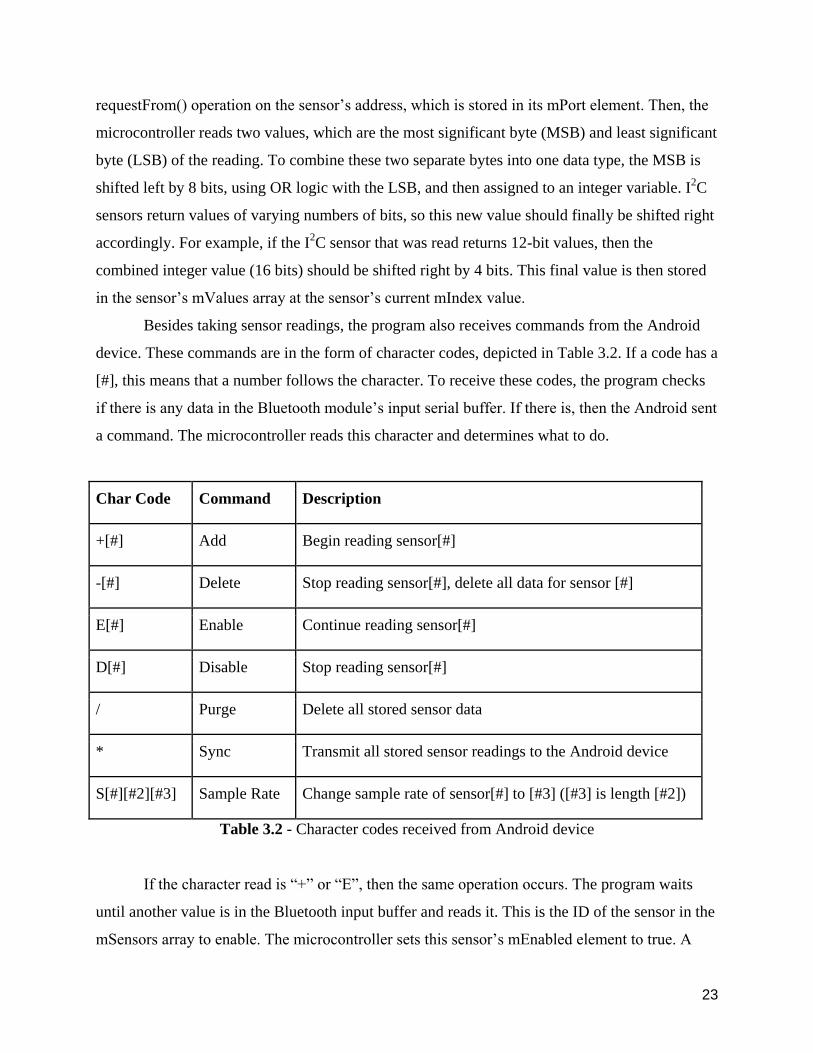
Besides taking sensor readings, the program also receives commands from the Android
device. These commands are in the form of character codes, depicted in Table 3.2. If a code has a
[#], this means that a number follows the character. To receive these codes, the program checks
if there is any data in the Bluetooth module’s input serial buffer. If there is, then the Android sent
a command. The microcontroller reads this character and determines what to do.
Char Code Command Description
+[#] Add Begin reading sensor[#]
-[#] Delete Stop reading sensor[#], delete all data for sensor [#]
E[#] Enable Continue reading sensor[#]
D[#] Disable Stop reading sensor[#]
/ Purge Delete all stored sensor data
* Sync Transmit all stored sensor readings to the Android device
S[#][#2][#3] Sample Rate Change sample rate of sensor[#] to [#3] ([#3] is length [#2])
Table 3.2 - Character codes received from Android device
If the character read is “+” or “E”, then the same operation occurs. The program waits
until another value is in the Bluetooth input buffer and reads it. This is the ID of the sensor in the
mSensors array to enable. The microcontroller sets this sensor’s mEnabled element to true. A

24
similar process occurs if “D” is received, except the program sets the sensor’s mEnabled element
to false. If the microcontroller receives a “-” character, it will also set the sensor’s mEnabled
element to false, but it will also delete the sensor’s corresponding file on the SD card and reset
all of its elements to their default values. This includes setting the sensor’s mIndex back to -1
and setting its mSampleRate to 1.
In the case of a received “/” character, the microcontroller orders the SD card module to
delete all stored senor files on the SD card.
If the microcontroller receives a “S”, then it obtains the sensor mIndex like in the
previously-mentioned cases. However, receiving the mSampleRate from the input buffer value is
more involved. The program waits until another value is in the input buffer. This value
represents the number of bytes that constitutes the incoming mSampleRate. The microcontroller
waits until this many bytes are in the input buffer, reads them into a character array, and converts
this array into a float value which is then set as the new mSampleRate for the specified sensor.
Figure 3.6 gives a visual representation of the byte format for setting sensor[2]’s mSampleRate
element to 2.25.
Figure 3.6 - Byte format for “S” command
If the received character is “*”, then the microcontroller opens each sensor file on the SD
card. For every value in every file, the program writes the sensor’s ID followed by a “#”
character to the Bluetooth serial output buffer, then writes the stored value in the file, followed
by a “$”. This way, the Android device can discern which sensor corresponds to the incoming
values in its Bluetooth input buffer. Figure 3.7 provides an example of this format if mSensors[1]
had stored a value of 512 and sent this data to the output buffer. After all of the files are read and
the values written to the output buffer, they are deleted. Finally, the program goes through each
sensor’s mValues array up to the current mIndex and writes these values to the output buffer in
the same fashion described previously.

25
Figure 3.7 - Output buffer format for sensor data transfer
Subsection 2 – Android Application
The Android application is responsible for two main tasks: to act as a user interface that
displays sensor information and to communicate with the microcontroller regarding sensor
configuration and readings. The communication protocol used to interface with the
microcontroller is Bluetooth. Fortunately, the Android API includes a Bluetooth library that
simplifies this communication.
Before the program is run, there are a few requirements that must be met for the
application to run correctly. First, the Android device must support Bluetooth communication.
Also, the Arduino must be powered on and be within range of the Android’s Bluetooth module.
Furthermore, the Android and the Bluetooth module connected to the Arduino must be paired
before the program is run. This can usually be accomplished within the Android’s Bluetooth
settings. The pin number needed to pair with the Bluetooth module is 1234. As a precaution, all
other Bluetooth devices should also be unpaired from the Android, so that the only device
bonded to it is the Arduino’s Bluetooth module.
When the Android application is first run, one of its first operations is to establish a
connection between it and the microcontroller’s Bluetooth module. To do this the following steps
are done: First, the application determines if Bluetooth is enabled on the Android device. If it is
not, then the program enables Bluetooth. Then, the application stores all of the devices that are
currently bonded with the Android in a Set data type. It chooses the last device in this Set as the
Bluetooth device that it will connect with. This is why it is necessary to pair the Arduino’s
Bluetooth module with the Android before running the program, as well as why all other pair
devices should be unpaired.

26
The process to actually connect to a Bluetooth device can be time-consuming and may
stall the program. For this reason, the steps to form the connection take place in a separate
thread, called ConnectThread. This thread’s constructor accepts the Bluetooth device that the
Android is connecting to as a parameter. Using this device, the program creates a socket that will
be used for communication. Afterwards, the Android and the Arduino’s Bluetooth module are
connected through this socket. This is the lengthy process that can stall the program. When this is
finished both devices are connected to each other and can communicate. However, this
interaction can also block the program, so it takes place in a separate thread, called
ConnectedThread.
ConnectedThread accepts the socket used for connection as a parameter for its
constructor. With it, the program obtains the Android’s input stream and the output stream for
Bluetooth communication. When the Android want to send data to the Arduino, it can write to
the output stream. Similarly, the Android will receive data from the microcontroller via the input
stream.
Writing to the output stream is straightforward. The application first converts the data
that it want to transmit into a string. Then, this string is converted into a byte array, and this byte
array is written to the output buffer.
Reading from the input stream is more complicated. This is because many bytes of data
can arrive in the input stream between stream readings, but not necessarily all of the bytes in the
message. This is why the terminating characters “#” and “$” are used to signify sensor IDs and
sensor readings from the Arduino. See Figure 3.7 for an example of this. When data is read in the
input stream, it is added to a buffer. After this happens, the buffer is iterated through, beginning
at the location after the last terminating character was found, either a “#” or a “$” (this may have
happened before this input stream reading). If another terminating character is found, the
program “handles” the data between the previously-found terminating character and this newly-
found character. Depending on the newly-found character, the program will handle the data as
either a sensor ID or a sensor reading. This process continues until the end of the buffer. If the
last character in the buffer is a terminating character, the buffer is subsequently cleared.
When the program obtains the data between two terminating characters, it is often desired
to use it in the UI thread. In order to send data from a separate thread to the UI thread, a Handler
must be used. If the data obtained is a sensor ID, the Handler stores the ID as an integer value. If
27
the data is a sensor reading, the Handler converts the data into an integer and updates the sensor
object that has the same ID as the one previously stored with the sensor reading that was just
received.
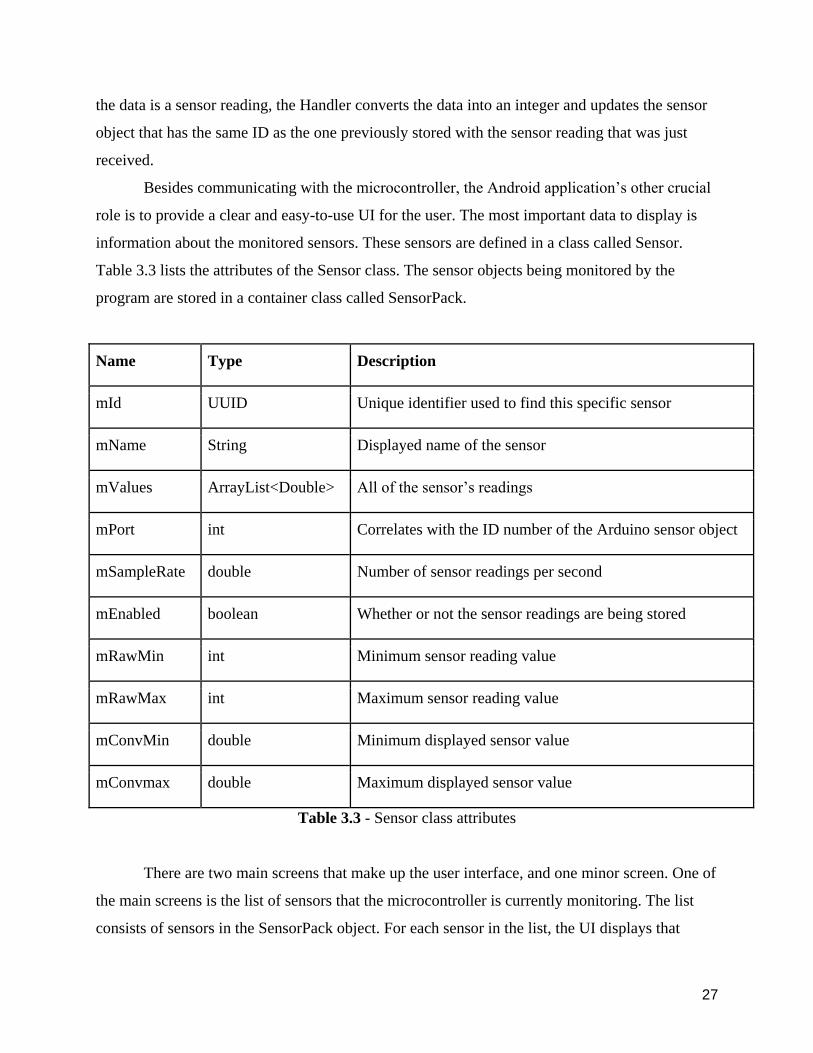
Besides communicating with the microcontroller, the Android application’s other crucial
role is to provide a clear and easy-to-use UI for the user. The most important data to display is
information about the monitored sensors. These sensors are defined in a class called Sensor.
Table 3.3 lists the attributes of the Sensor class. The sensor objects being monitored by the
program are stored in a container class called SensorPack.
Name Type Description
mId UUID Unique identifier used to find this specific sensor
mName String Displayed name of the sensor
mValues ArrayList<Double> All of the sensor’s readings
mPort int Correlates with the ID number of the Arduino sensor object
mSampleRate double Number of sensor readings per second
mEnabled boolean Whether or not the sensor readings are being stored
mRawMin int Minimum sensor reading value
mRawMax int Maximum sensor reading value
mConvMin double Minimum displayed sensor value
mConvmax double Maximum displayed sensor value
Table 3.3 - Sensor class attributes
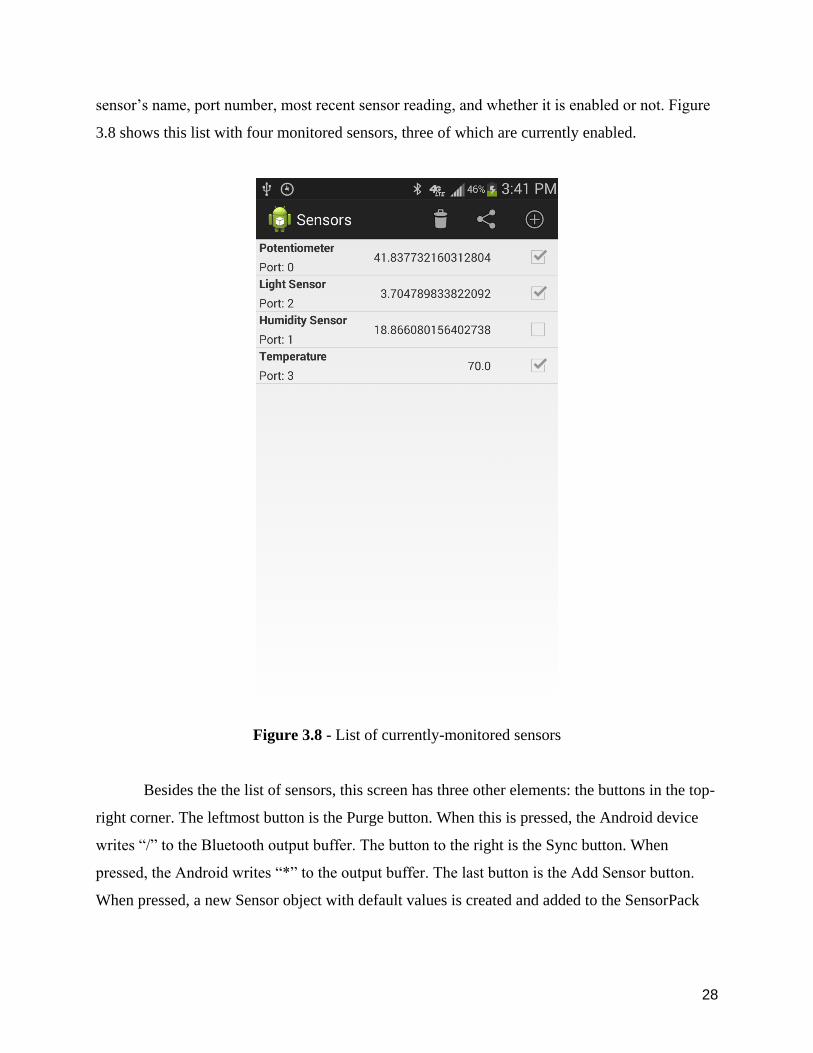
There are two main screens that make up the user interface, and one minor screen. One of
the main screens is the list of sensors that the microcontroller is currently monitoring. The list
consists of sensors in the SensorPack object. For each sensor in the list, the UI displays that
28
sensor’s name, port number, most recent sensor reading, and whether it is enabled or not. Figure
3.8 shows this list with four monitored sensors, three of which are currently enabled.
Figure 3.8 - List of currently-monitored sensors
Besides the the list of sensors, this screen has three other elements: the buttons in the top-
right corner. The leftmost button is the Purge button. When this is pressed, the Android device
writes “/” to the Bluetooth output buffer. The button to the right is the Sync button. When
pressed, the Android writes “*” to the output buffer. The last button is the Add Sensor button.
When pressed, a new Sensor object with default values is created and added to the SensorPack

29
container. Then, the screen switches to the Sensor Properties screen, which displays the new
sensor’s attributes. This screen will be described in more detail later.
There are a couple other features in this list view. First, by pushing on one of the sensors
in the list, the Sensor Properties screen appears displaying the selected sensor’s attributes. Also,
by click-and-holding a sensor in the list, the user is given the option to delete it. If the user
chooses to do so, the sensor is removed from the list, deleted from the SensorPack, and the
Android sends “-[#]” to the output buffer, were [#] is the sensor’s port value (which corresponds
to the Arduino sensor object’s ID value).
When either the New Sensor button is pressed, or when a sensor in the list is pushed, a
new screen appears that displays properties about the sensor. Figure 3.9 shows what this screen
may look like. The text fields are automatically populated with the element values of the sensor.
From this screen, the user can change the sensor’s attributes.

30
Figure 3.9 - Sensor properties
The Sensor Properties screen has a few interesting qualities. If a port is already being
used by another sensor in the SensorPack, then that port is unavailable for selection. Also, the
Sensor Interface has a maximum sample rate of 20 samples per second. If the user enters a value
higher than this in the Sample Rate field, it is automatically changed to 20. The Sensor Interface
also has a minimum sample rate of 0.1, so the same process occurs if the user enters a value
lower than this. Finally, for the converted sample rate values, if the user enters “.”, an error can
occur since “.” is not a valid double value. Therefore, in this case, the application changes the
input to “0.”, which is a valid double.
31
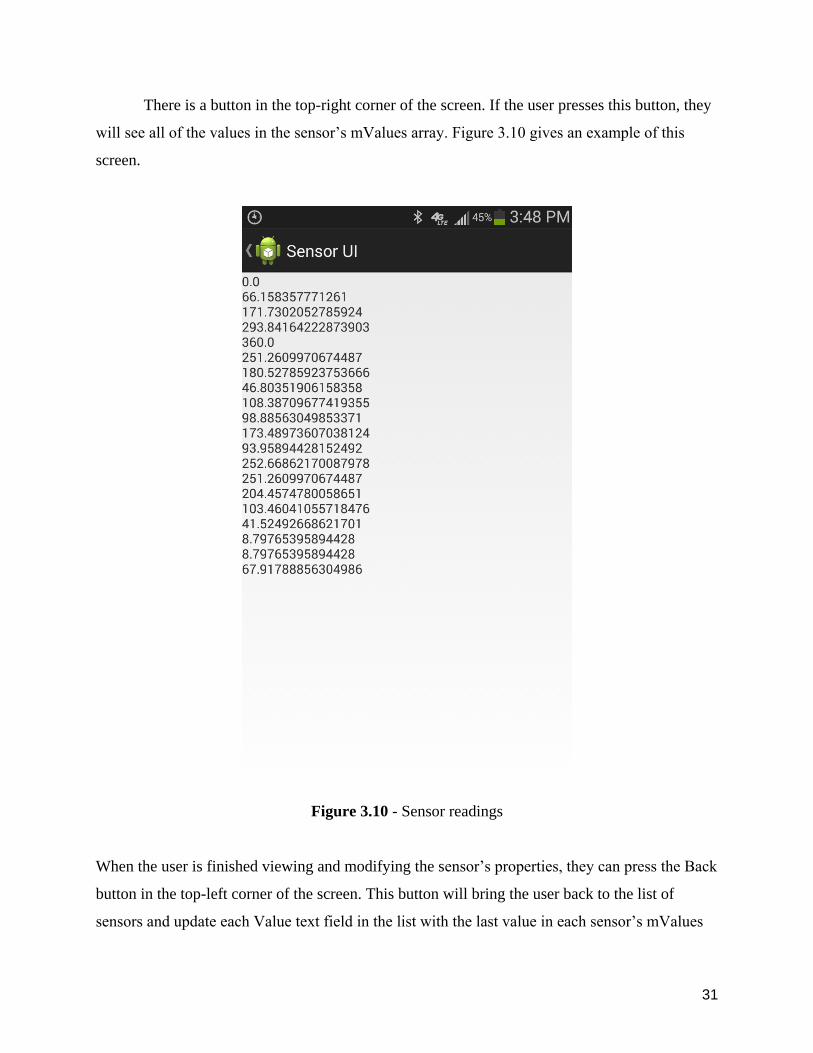
There is a button in the top-right corner of the screen. If the user presses this button, they
will see all of the values in the sensor’s mValues array. Figure 3.10 gives an example of this
screen.
Figure 3.10 - Sensor readings
When the user is finished viewing and modifying the sensor’s properties, they can press the Back
button in the top-left corner of the screen. This button will bring the user back to the list of
sensors and update each Value text field in the list with the last value in each sensor’s mValues

32
array. Also, if any changes were made to the sensor’s sample rate or port value, this information
is sent to the output buffer. In the case of a port change, the application write “-[#1]”, followed
by “+[#2]” to the output buffer. [#1] is the previous port value and [#2] is the new port value. If
the enabled checkbox changed, the program writes either “E[#]” (for enabled) or “D[#]” (for
disabled) to the output buffer, where [#] is the sensor’s mPort value. In the case of a sample rate
change, the program writes “S[#1][#2][#3]”, where [#1] is the sensor’s mPort value, [#3] is the
sensor’s new mSampleRate value, and [#2] is the length of [#3].
If the Android application ever receives input from the Arduino, it will process the
incoming data and pull a port number and a sensor reading from it, and call a function to store
the value in the corresponding Sensor’s mValues array. To do this, the program utilizes the
sensor’s mRawMin, mRawMax, mConvMin, and mConvMax attributes. The raw values
represent the range of values that the incoming sensor reading could be. Typically for analog
sensors, this range is from 0 to 1023 because the Arduino’s analogRead() return a value in this
range corresponding to a voltage reading between 0 and 5. For example, a reading of 0V returns
0, 5V returns 1023, and 2.5V returns 512. However, this value may not be useful to the user.
They may want to see the data between a different range of values. This is what the conv values
represent. The program scales the input sensor reading to the appropriate value within the range
specified by mConvMin and mConvMax. For example, if these two attributes are set to 0 and
100 respectfully, and the sensor reading is 512, the sensor adds a value of 50 into its mValues
array and updates the corresponding text field in the sensor list.
Chapter 4 – Testing
Section 1 – Hardware Testing
The ability to test the capability of the hardware and software was important to the results
of the project. Being able to test the hardware however is a difficult task as many of the tests of
the hardware and software are a binary result, either it works or it doesn’t work. This makes the
real test data for the team, the reliability of the different components being used.

33
Creating a reliable product that will consistently work as desired is an obstacle of
designing a product from scratch. In order to accomplish this goal, thorough research had to be
done for separate portions of the products. The most popular modules were used due to their
affordability and accuracy/reliability for the price.
One such module that was ordered was for the project was the HC-05 Bluetooth 2.0
module to allow for Bluetooth communication with the a phone as mentioned above. The main
test that was able to be done with the Bluetooth module was the speed of communication that
could reliably be used. Communication with this module is done through the serial lines which is
measured in units called Baud (Bd) or bits/sec. The module has several settings for the available
supported baud rates from 9,600 Bd to up to 460,800 Bd. While the maximal speed available to
the device is ideal, other limitations come into play. The availability of serial communication
lines on the ATMega328P chip is limited and caused the team to require the Software Serial
Arduino Library. This library has been tested reliably up to 115,200 Bd and is as now the upper
limit imposed upon the serial communication with the Bluetooth module.
The HC-05 Bluetooth module has a secondary programming mode that allows for
communications to be tested with the module itself. The baud rate of the chip was varied
between the available baud settings to test the ability to communicate directly with the module.
As there were only select number of rates that could be set (9,600; 19,200; 38,400; 57,600;
115,200) the highest available (115,200) was chosen for optimal communication speed. Testing
in at 115,200 caused the microcontroller to not reliably receive a signal from the HC-05
Bluetooth module and so the rate was reduced until a fully functioning baud rate was found. In
the end, 38,400 Bd allowed very solid results when communicating with the module and so
became the set rate. Research on different forums discussing the HC-05 supported this
conclusion stating that while the manual of the chip states supported rates of up to 460,800 Bd,
the chip only functioned with rates less than 57,600 Bd.
Section 2 – Software Testing
Software testing included more testing of reliability and after reaching certain points in
the project began to have constant working expectations, meaning that the developed software
would always work after the initial testing had been finished. There were two different pieces of
34
software to be tested and so each had to be subjected to different requirements and tests. These
software aspects were the Android code to be developed and Arduino microcontroller code that
controlled the data flow of the sensors.
Android programming for the phone application is destined to contain flaws as the
amount of programming required to create a deployable application is extremely large. To
simplify the end goal, the application was tested only under a user correctly navigating through
menus as well as starting device use in a specific order (Powering on the microcontroller and
then starting the phone application). Each successive feature added to the application needed to
be used under various conditions to find flaws in logic that could cause the application to crash
or not function as intended.
Since the application built in Android was based on tutorials for building basic Android
applications, the original menu navigation pieces that were built on functioned as expected.
Starting at the home menu that is seen when the application boots up, pressing the plus symbol in
the upper right, overlays (shows) a new window with the current options for adding the sensors.
This is true for all other screens that appear when navigating menus. Appearance and
disappearance of the menus in a smooth manner without the application crashing or freezing
shows that the code for displaying the menu goes through the correct channels. Multiple button
presses to show/hide the menu showed that this simple visual process was fully functional.
When adding and removing sensors in the interface, many issues could arise in the
application. Once added, the home screen needed to display the information of the added sensor.
A simple check of whether the information displayed is correct after addition corresponds to a
functioning sensor addition. The same case is true for removal of a sensor. After a sensor is
removed from the list of currently reading sensors, the information should no longer be displayed
on the home screen since stored information for the sensor is not necessary. Adding and
removing sensors was an iterative process for code development adding features such as:
enabling/disabling so that it can be activated/deactivated but data isn’t deleted; modifying the
conversion factor for a sensor so that the data displayed on the phone is meaningful; changing
the sampling rate to sample more/less often.
As stated earlier, there are going to be flaws/bugs in the Android application that don’t
currently behave as expected. One such error that has been found is when the screen tries to
rotate to a landscape view. Any data that has been displayed when the screen is in being viewed
35
in portrait is no longer displayed. The current cause of this easily found issue has to do with the
code for viewing the screens themselves but is currently not known and is something to be
looked into in future work. Moreover, not powering up the microcontroller before starting the
Android application causes the application to crash when trying to change any settings that
require communication with the microcontroller. Crashing happens due to the lack of a bluetooth
device being connected to the phone.
A number of sensors were used in testing: a potentiometer, an analog luminosity sensor,
an analog humidity sensor, and a digital temperature sensor. The potentiometer and the humidity
sensor both had voltage dividers built into them, so wiring the voltage divider pin of each to
analog ports on the microcontroller was simple. However, the luminosity sensor only consisted
of two pins and generated a resistance between them, where this resistance depended on the
ambient light. Therefore, a voltage divider was created manually. First, the minimum and
maximum resistances of the light sensor were measured. These values were 32Ω and 2KΩ,
respectively. From these values, it was determined to put the sensor in series with a 270Ω
resistor. With this configuration, when connected to a 5V source, the voltage across the sensor
would be between 0.53V and 4.4V, respectively. Equation 4.1 shows these calculations. The
digital temperature sensor was connected to the appropriate analog pins for I2C communication.
Equation 4.1 - Min and Max Luminosity Sensor Voltage Drops
The microcontroller was connected to a computer during testing. This way, the Arduino’s
Serial Monitor could be used to debug the microcontroller program and locate and fix errors. The
program was written such that when a sensor was read, it would write the sensor’s ID number
followed by the reading to the Serial Monitor. Also, whenever the Arduino received a command
character from the Android device, it would write this character to the Serial Monitor as well.
This allowed for verification that the Bluetooth communication worked as intended and that the
microcontroller performed the correct action for the given command.

36
The Bluetooth module wired to the microcontroller has an LED which flashes in two
patterns: a disconnected pattern and a connected pattern. After opening the Android application,
monitoring this flash pattern was one of the first diagnostic tests used. If the pattern did not
change to the connected pattern, than there was an error that needed to be found and fixed.
Otherwise, the Android connected to the Arduino’s Bluetooth module successfully.
When the Android application is first run, the sensor list should be empty, since no
sensors were added yet. Pressing the Purge or Sync button should send “/” or “*” to the Arduino,
which should print the character to the Serial Monitor. However, nothing else should happen
since no sensors are added to be synced and no data exists to be purged. From here, testing
consisted of adding multiple sensors to be monitored simultaneously, changing their sample rates
and seeing the result in the Serial Monitor, and enabling, disabling, syncing, and deleting sensors
to verify that the programs on both the microcontroller and the Android device functioned
correctly.
Chapter 5 – Conclusion
Section 1 - Final Prototype
During the course of the semester, a successful prototype for the Sensor Technology
Interface, as well as designs for both the final printed circuit board and the server-side supported
backend library, has been completed. The prototype consisted of devices running versions 4.1.2
and 4.2 of the Android mobile operating system, the Arduino Uno microcontroller, as well as
various sensors. A wide range of sensors were tested, including analog and digital sensors both
wired and wireless, as well as sensors using different protocols. However, the final prototype
will showcase a digital temperature and humidity sensor, as well as analog light and water level
sensors, as well as a potentiometer to sense angle.
Section 2 - Cost
Subsection 1 - Prototype Cost

37
The project cost consisted of donated hardware, purchased hardware and software, and
donated time for microcontroller fabrication. The total donated amount totals $217.50, and the
total purchase amount totals $450.77. This cost includes sensors and microcontrollers not used in
the final prototype, such as the SensorTag and the RFduino. Although it was a higher cost than
initially expected, several designs were tried to best implement what the sponsors requested, thus
several microcontrollers were ordered. All of the microcontrollers can still be used to create
more advanced wireless and/or wireless sensors.
Subsection 2 - Production Cost
The projected cost will be $26.36, if bought in units of ten thousand. This costs includes
the manufacturing of the printed circuit board, $0.54; the price of the individual parts, $20.84;
and the price of assembly, $5. Although this final production cost is slightly over the target
production cost of $20, if the USB module and the battery are sold separately, the overall cost
will fall below the target cost of $20/unit. The BLE Bluetooth module is also relatively new, and
should be expected to lower in price as more products adopt the standard.
Section 3 - Schedule
This project was ambitious, and it was determined part way through the semester that
others would most likely follow the work done by the team at a later date. Lead times for getting
the PCB board manufactured with parts assembled could be as long as a month, so it was decided
to make a two layer board with a larger layout for testing purposes with the facilities at MSU.
The software side of our project has been for the most part successful, but the hardware side falls
short due to the high learning curve on building a microcontroller from scratch and the resources
available at MSU. Due to this, the team is still in the chip design/testing phase of the project.
Another group next semester should be able to start from where the team left off and build a
tested microcontroller to interface with the software developed by the team.
Section 4 - Findings
The final prototype consists of a final tested sample rate of 20 samples/second for each
38
sensor. It also includes a variable size SD card that can provide more than 1 hour of buffered
input. The required dimensions were not accomplished with our through hole design. However,
with a DIP design, it will reach the desired sample size. Furthermore, the application allows the
user to clear the buffer, enable and disable sensors, as well as allow the user to specify a
conversion factor. The sensors working with our interface allows for I2C digital sensors, and
analog sensors. All sensors use the analog input pins. Furthermore, the device can run on a
battery. The sponsor has since replaced the TRRS communication requirement with Bluetooth.
The timestamps also work, as well as the library backend, however they have not been
fully integrated into the interface due to an early miscommunication of writing the library in C
instead of java, and that there is currently no way to pull files from the microcontroller itself.
Section 5 - Future Work
Currently, the project lacks a full integrated backend to make it function out of the box
without preconfiguration. The Android application itself requires more development/testing to
ensure that the end user can intuitively and without fail use the interface. To achieve the out of
box performance, the process of being able to connect to any sensor interface device without
large amounts user interaction is required, meaning configuring and saving Bluetooth connection
to a Sensor Interface device. Once data can be reliably sent to and logged on the phone, the
ability to view data graphically can be implemented. Furthermore, the timestamp needs to be
integrated into the system as well for being able to know the date and time of the data recorded.
In terms of the microcontroller software, more sensors should be tested to show true
compatibility, and Bluetooth 4.0 needs to be fully implemented for lower power consumption,
updating from the use of the current HC-05 Bluetooth 2.0 module. Code for the microcontroller
should be reviewed/revised to achieve optimal performance and utilize the available resources as
best as possible. Additions to the microcontroller for entering separate modes such as sleep,
configuration, and communication modes need to be programmed in. A sensor application
protocol should be further developed for communicating the sensor data necessary identifying
processing the sensor data for easier use.
Switching to the Sensor Interface hardware, the printed circuit board should be
redesigned to use the surface components necessary in order to produce at the minimal size
possible. Without a fully developed printed circuit board, power consumption of the device could

39
not be measured which is necessary to decide on the battery that would be required. Lack of a
printed circuit board with surface mount components also makes knowing the optimized board
size difficult. Though it’s arbitrary, choosing a connection method to connect sensors to the
Sensor Interface in an efficient and expandable manner needs to be developed. Other than fixing
small errors that may result in the initial production phases, different wireless modules for
communicating with sensors could be implemented in future versions of the product. Beyond
these minor setbacks, the foundation created by the team will lead the Sensor Interface towards
success.
40
Appendix 1 – Technical Roles
Nick Henry - Lab Manager
Over the course of the semester Nick Henry worked on several different aspects of the
teams design project, including both hardware and software. To start the semester he planned on
working alongside Brian Wirsing on learning Android coding and creating the user interface to
control the sensors in the project. Instead of using the traditional Eclipse and java programming
Nick explored with software called AppInventor 2. This software was created by MIT as
alternative to learning java and it created a more intuitive coding environment. He ran through
several tutorials and researched ways use a smart device’s built-in features to create a more
interactive program. This research helped him to create several test apps that are shown in
Figure A.1 and figure A.2 that highlighted some of AppInventors unique capabilities. Nick’s
research into this program also led him to discover its incompatibility with standard java code.
By using this standalone program the team would not be able to integrate existing code into the
new code and so they abandoned this route of creating the Android software. Once this direction
changed so did Nick’s role and he began work on the hardware design portion of the teams
project. He began watching tutorials, reading, and asking knowledgeable colleagues about how
to design printed circuit boards in Eagle design software. Robert Pollum and Nick created a list
of components that they would need in order to achieve every aspect that they required from the
sensor interface circuit, this table is shown in Table 3.1. From this list of parts he imported
schematics into Eagle and arranged them onto the designed PCB area in a way to allow
convenient access to the I/O devices and to allow the pin headers to be conveniently located for
the input of sensors. Nick then worked on routing the traces to allow for every connection

41
required. This task unfortunately also did not get implemented into the team’s final design, they
are planning on running the sensor interface project from an Arduino Uno with attached BLE,
SD, and power modules instead of the designed package. This is due to the fact that the
manufacturing capabilities available at MSU could not cut traces precise enough for the designed
pathways and sending the design to a manufacturing facility that could design to these specs
would require more time and money than they had originally allocated to this portion of the
project. The final board design created by Nick is shown in Figure 3.1.1.
Kelton Ho - Document Manager
Kelton was a programmer throughout the semester. He started on designing a viable
library to store information from many different types of sensors. He took design influences from
the way the command “lsusb” command handles both vendors and device IDs in 16 bit hex. He
then took a list of what information sensors will need to access in order to function properly, and
added some of the basic variables needed. He also did research on external libraries, so that a
custom XML parser was not needed. He did a full test of all functions with sample out included
in the Appendix.
When he started working on the Android portion of the project, he managed and served
as technical support for git conflicts and merges. He also contributed research and knowledge on
Android programming, as well as designing and prototyping functions for getting and setting
valid input for sample rate. He also helped to design the sensor fragment, as well as portions of
the main sensor list fragment. He also worked on debugging application crashes: first, with
Bluetooth off, the application suffered a fatal crash; second, if Bluetooth was on but the phone
was not paired the application still crashed; third, values entered for raw values, converted
42
values, and sample rate could not be deleted completely to enter a new one and would not take
decimals. The first bug was fixed by not starting the application until Bluetooth was fully loaded.
The application does assume that the microcontroller is properly paired and connected, as the
second bug still exists. The final bug was fixed by buffering the input and setting a decimal into
the string “0.” to be displayed back to the interface.
Finally, following the implementation of communication between the android device and
the microcontroller, there was sometimes a pause between sending an operator and the sending
of the real data, leading to an invalid input entry. This was fixed by discarding invalid input
between operators.
Nick Huff - Team Manager
If there’s anything that’s been learned about the design process this semester, it’s that the
design process is not linear. There are several different avenues that one can take in the design
process, and sometimes the best route is discovered only after another has been started. Many of
the roles originally assigned had to be modified to accomplish the task at hand to keep within
time constraints. Nick’s role was to work on a design of the microcontroller by applying his
electrical engineering knowledge in a real world application. In order to effectively offer the
sponsors the microcontroller they were looking for, it was decided that that the best course of
action would be to reverse engineer an Arduino microcontroller and add the additional parts such
as a microSD card slot, BLE Bluetooth 4.0 functionality, and standalone battery operation. Nick
found the different Arduino board schematics online and balanced the advantages and
disadvantages in each setup. He helped source the parts necessary to add onto the
microcontroller to fit the sponsor's requirements. After some research, it was determined that the
43
sponsors request for a 1” by 1” by .05” microcontroller would not be possible due to the time
constraints and the resources available. Nick Huff aided Nick Henry worked on the Eagle
Schematic designs, and weighed the technical capabilities of facilities here at MSU against
outside companies to build an effective product. At the beginning of the semester, he learned
how to write Android applications using Eclipse, and wrote several sample programs to brush up
and Android programming. His main focus was on the action bar for the Android app, creating
the front end for the back end functionality implemented by Brian. He created the layout to add
additional sensors, sync with the data gathered by the microcontroller, and delete sensors that
were no longer necessary. Nick also used his hands on shop experience to complete the display
for design day and used his CAD experience to make several 3D printed parts to bring additional
functionality for the display board.
Robert Pollum - Presentation Manager
Robert’s main varied throughout the semester. He has knowledge/experience in several
different areas of the project and so worked where and when help was needed or requested.
Much of the work included research for different aspects of the project. The research for the
beginning of the project included the platform and available specs of the different
microcontrollers that could be used for the project. Microcontroller units were selected for
several different aspects that were believed to be important for the project. Later research
included printed circuit board design, such as finding schematics to prototype boards that were
being used to allow for an easier base for the final printed circuit board design. The parts that
were to be used for the board were also researched and double checked to ensure the final
product would both work and have all the necessary components.

44
Later in the project, a designation for working on peripheral aspects of the
microcontroller code was assigned. Code was developed and researched for adding timestamps
to the files created on the required SD card. Further development and research produced the
ability to use character arrays for file names, which saves the Static Read Only Memory (SRAM)
from being used up by constant character arrays. Though the research and development wasn’t
fully completed, code was developed to allow the HC-05 Bluetooth module to be reprogrammed
and change the module from a master configuration into a slave. Being able to reprogram the
module would for alternate uses for the overall project and give the module itself the ability to be
very flexible.
The role of presentation manager was also the assigned role for Robert in the group.
Overall presentations were checked over and roughly an even amount of work was done by the
individual group members. The presentation poster design was worked with and influence by
both Nick Henry and Robert himself.
Brian Wirsing - Webmaster
Brian Wirsing was a valuable team member throughout the duration of this project. His
assigned task for the project was to develop code for both the microcontroller and the Android
program. The work he accomplished on the microcontroller enables it to perform many key
functions that his group’s sponsors requested. For example, the code he developed allows the
microcontroller to enable and disable sensor ports, indicating whether or not the sensor should
read from these ports. Also, the microcontroller can modify the individual sample rates of each
of these sensor ports, allowing it to read some sensors at a faster rate than other sensors. He
helped make the Sensor Interface compatible with a multitude of different types of sensors, such
45
as analog and digital sensors. The microcontroller has limited integrated memory, which is not
suitable for extended sensor monitoring, so Brian added the capability to store the collected
sensor data in an SD card. Furthermore, the microcontroller can read from the SD card to retrieve
the stored sensor data. Finally, the microcontroller has to receive its instructions from an Android
device, so Brian added to ability to communicate with a Bluetooth module connected to the
microcontroller. With this, the Sensor Interface receives which ports to enable and disable, what
the sample rate for a given port should be, and if it should send back sensor data to the Android
device.
Brian also helped write the code for the Android program, which acts as a user interface
to display sensor information to the user and allow the user to modify certain parameters of the
Sensor Interface easily. He designed the UI to show all of the current sensors in a list, displaying
each sensor’s name, port, last received value, and enabled/disabled status. He added a “Sync”
button to refresh the entire sensor values with the most recent value received from the
microcontroller. A sensor can be deleted from this list by press-and-holding it for a short
duration and selecting “Delete.” Furthermore, Brian added the ability to add new sensors to
monitor by clicking the “New” button. This opens a “Sensor Properties” window where the user
can give the sensor a name, specify the port it’s connected to on the microcontroller, enter a
desired sample rate, enable or disable it, and convert the value received from the microcontroller
to a different value. This last point is important because analog sensors generate values between
0 and 1023. However, if the analog sensor is a temperature sensor capable of reading values from
-20°C to 120°C, the user will want to see the value in terms of a temperature instead of an
arbitrary 0 – 1023 scale. Brian added the necessary functionality to allow for this. Users can also
edit current sensors by clicking them in the sensor list, which will open this same “Sensor
Properties” window, thereby allowing them to alter the sensor parameters further.
One of the most important aspects of the Sensor Interface is the wireless Bluetooth
connection between the microcontroller and the Android device. Through this connection, the
Android tells the microcontroller which ports to read from and how fast, while the
microcontroller sends back sensor values whenever instructed. Most of this functionality resides
within code on the Android side. Brian programmed the Android application such that when it is
run, it enables Bluetooth on the device if it is turned off. Then, it connects to Bluetooth module
wired to the microcontroller, enabling wireless communication. The Android program then

46
constantly reads the Bluetooth input stream waiting for data from the microcontroller, while
writing to the output stream only when instructed to by the user’s input.
47
Appendix 2 – References
[1] "RFduino - Home." RFduino - Home. N.p., n.d. Web. 21 Feb. 2014.
<http://www.rfduino.com/>.
[2] "ArduDroid: Simple Bluetooth control for Arduino and Android - TechBitar"
ArduDroid. N.p., n.d. Web. 21 Feb. 2014. <http://www.techbitar.com/ardudroid-simple-
bluetooth-control-for-arduino-and-android.html>.
[3] "Arduino - Serial." Arduino - Serial. N.p., n.d. Web. 22 Apr. 2014.
<http://arduino.cc/en/reference/serial>.
[4] "Arduino - SPI." Arduino - SPI. N.p., n.d. Web. 22 Apr. 2014.
<http://arduino.cc/en/Reference/SPI>.
[5] "Arduino - Wire." Arduino - Wire. N.p., n.d. Web. 22 Apr. 2014.
<http://arduino.cc/en/reference/wire>.
[6] "Bluetooth." Android Developers. N.p., n.d. Web. 22 Apr. 2014.
<http://developer.android.com/guide/topics/connectivity/bluetooth.html>.
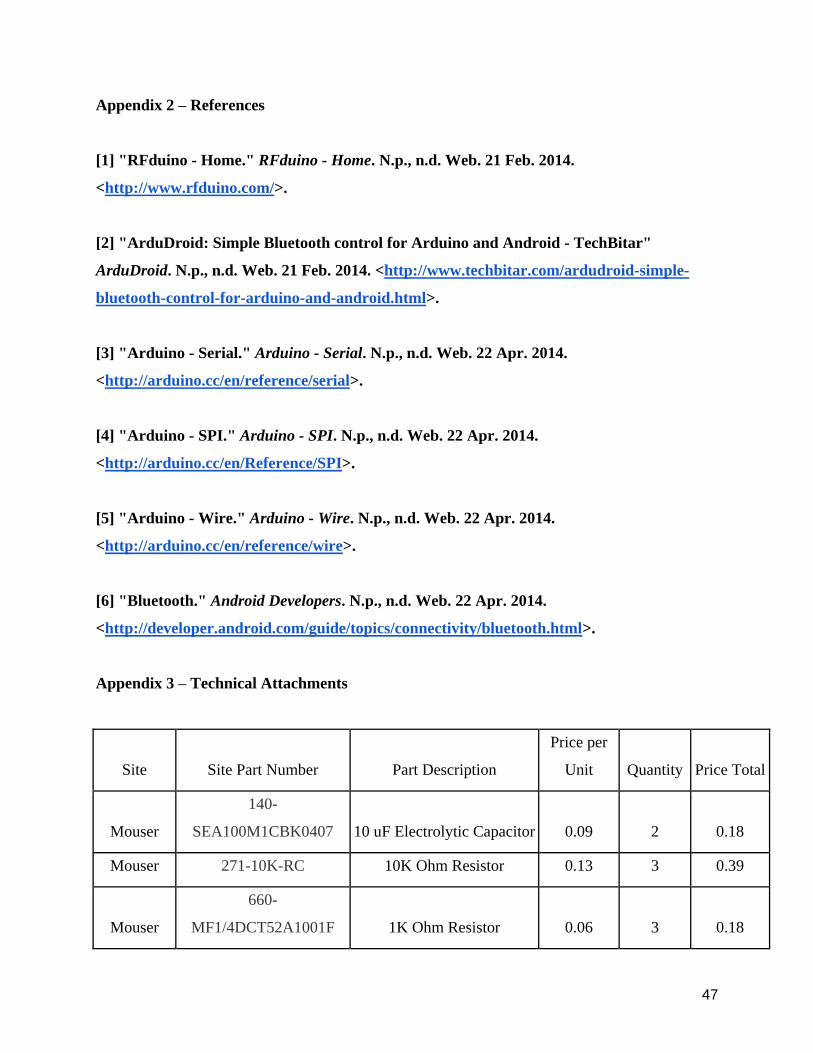
Appendix 3 – Technical Attachments
Site Site Part Number Part Description
Price per
Unit Quantity Price Total
Mouser
140-
SEA100M1CBK0407 10 uF Electrolytic Capacitor 0.09 2 0.18
Mouser 271-10K-RC 10K Ohm Resistor 0.13 3 0.39
Mouser
660-
MF1/4DCT52A1001F 1K Ohm Resistor 0.06 3 0.18
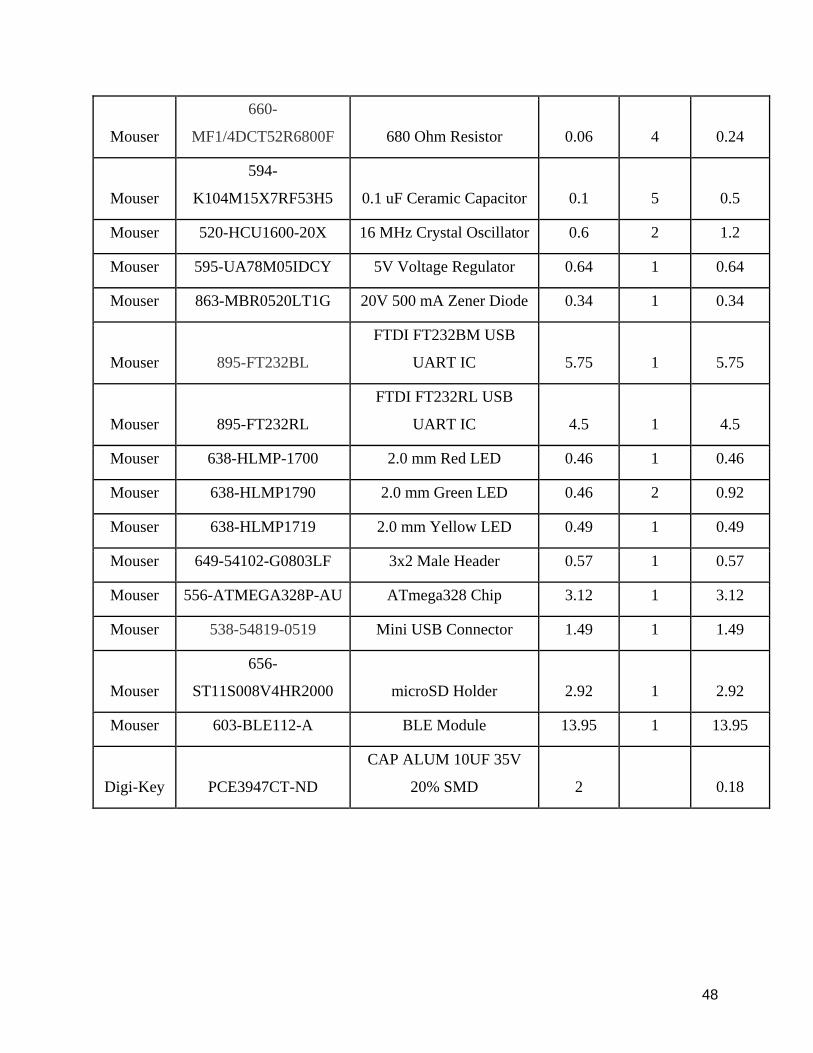
48
Mouser
660-
MF1/4DCT52R6800F 680 Ohm Resistor 0.06 4 0.24
Mouser
594-
K104M15X7RF53H5 0.1 uF Ceramic Capacitor 0.1 5 0.5
Mouser 520-HCU1600-20X 16 MHz Crystal Oscillator 0.6 2 1.2
Mouser 595-UA78M05IDCY 5V Voltage Regulator 0.64 1 0.64
Mouser 863-MBR0520LT1G 20V 500 mA Zener Diode 0.34 1 0.34
Mouser 895-FT232BL
FTDI FT232BM USB
UART IC 5.75 1 5.75
Mouser 895-FT232RL
FTDI FT232RL USB
UART IC 4.5 1 4.5
Mouser 638-HLMP-1700 2.0 mm Red LED 0.46 1 0.46
Mouser 638-HLMP1790 2.0 mm Green LED 0.46 2 0.92
Mouser 638-HLMP1719 2.0 mm Yellow LED 0.49 1 0.49
Mouser 649-54102-G0803LF 3x2 Male Header 0.57 1 0.57
Mouser 556-ATMEGA328P-AU ATmega328 Chip 3.12 1 3.12
Mouser 538-54819-0519 Mini USB Connector 1.49 1 1.49
Mouser
656-
ST11S008V4HR2000 microSD Holder 2.92 1 2.92
Mouser 603-BLE112-A BLE Module 13.95 1 13.95
Digi-Key PCE3947CT-ND
CAP ALUM 10UF 35V
20% SMD 2
0.18

49
Table A3.1.1 - Component List
Figure A3.1.1 - Eagle Schematic chip
Figure A3.1.2 - Eagle Schematic battery

50
Figure A3.1.3 - Eagle Schematic BLE chip
Figure A3.1.4 - Eagle Schematic Micro SD shield

51
Figure A3.1.5 - Eagle Board Layout Design
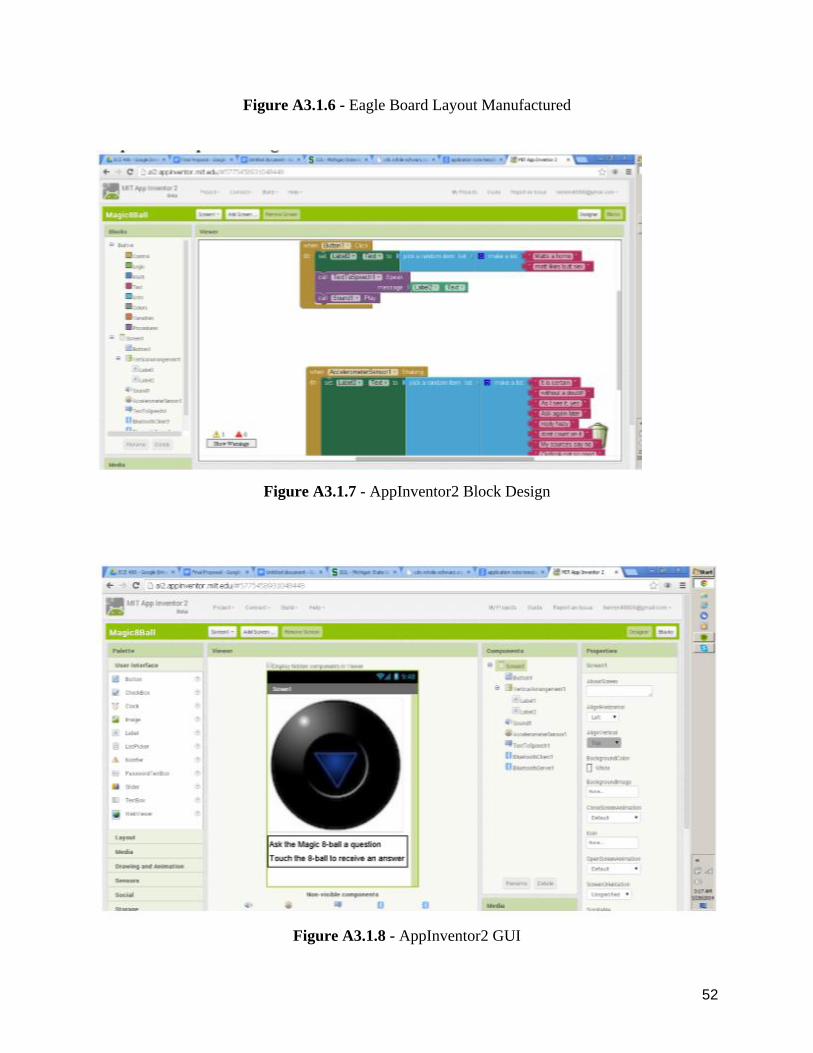
52
Figure A3.1.6 - Eagle Board Layout Manufactured
Figure A3.1.7 - AppInventor2 Block Design
Figure A3.1.8 - AppInventor2 GUI