sensing pollution on online social networks: a ...marfia/pubblicazioni/j025.pdf · sensing...
TRANSCRIPT

Noname manuscript No.(will be inserted by the editor)
Sensing pollution on online social networks: atransportation perspective
Rita Tse · Yubin Xiao · Giovanni Pau ·Serge Fdida · Marco Roccetti · GustavoMarfia
Received: date / Accepted: date
Abstract Transportation policy and planning strategies, as well as Intelli-gent Transportation Systems (ITS), can all play important roles in decreasingpollution levels and their negative effects. Interestingly, limited effort has beendevoted to exploring the potential of social network analysis in such context.Social networks provide direct feedback from people and, hence, potentiallyvaluable information. A post telling how a person feels about pollution ata given time at a given location, could be useful to policy-makers, plannersor environmentally-aware ITS designers. This work verifies the feasibility ofsensing air pollution from social networks and of integrating such informa-tion with real sensors feeds, unveiling how people advertise such phenomenon,acting themselves as smart objects, and how online posts relate to true pol-lution levels. This work explores a new dimension in pollution sensing for thebenefit of environmental and transportation research in future smart cities,confronting over 1,500,000 posts and pollution readings obtained from govern-mental on-the-field sensors over a one-year span.
Keywords Smart objects · transportation · social networks · sensors · traffic ·human perception
1 Introduction
Traffic amounts to a societal problem in many different countries of the world.Although high traffic levels are typically considered a sign of prosperity, and,
Rita Tse, Yubin XiaoMacao Polytechnic Institute, Macao, China
Giovanni Pau, Serge FdidaUniversity Pierre et Marie Curie Sorbonne Universities, Paris, France
Marco Roccetti, Gustavo Marfia (corresponding author)University of Bologna, Bologna, Italy
2 Rita Tse et al.
as such, initially often welcomed, prolonged exposures to high traffic levels alsobring in a number of economic and health issues that include: loss of productiv-5
ity, drivers’ stress, and a plethora of diseases caused by the excess of chemicalagents that are released by combustion engines (e.g., microscopic particles,carbon monoxide, etc., (Peters et al., 2004), (Townsend, 2002)). Clearly, manydifferent countermeasures have been taken during the decades, which include,but are not limited to, implementing better public transportation systems10
(Florian, 1977), gradually substituting petroleum-based combustion engineswith cleaner propellers (e.g., electric, ethanol or methane (Reed and Lerner,1973), (Agarwal, 2007)) and to the enforcement of congestion taxes (for thosewho drive through given city areas during pre-defined time frames) (Rotariset al., 2010). Such countermeasures are very often the result of the transporta-15
tion policy and planning community research works and discussions, aimingat the development of cleaner and more sustainable cities. In essence, fromthe policy and planning pespective, the problem amounts to understand howtransportation decision-making can better support public health objectives,including reduced crashes and pollution emissions and increased physical ac-20
tivity. In the past, conventional transportation planning overlooked its nega-tive (or, also, positive) health impacts, while now a general awareness existsthat raising the priority of health objectives may support planning reformswhich lead to more balanced transportation systems. In essence, it is todaywidely understood that the implementation of sustainable and green trans-25
portation policies and plans, in the context of an integrated smart city, maybe a cost-effective way of improving public health.
In the meantime, computerized systems capable of managing traffic re-sources (e.g., traffic light cycle times) and providing real-time traffic relatedinformation to drivers (e.g., construction sites, traffic loaded roads) have flour-30
ished, with the aim of optimizing the use of the available road and signalinginfrastructures with the development of Intelligent Transportation Systems(ITSs) (WEILAND and Purser, 2000). The ITS community has initially fo-cused its attention on technical problems, in areas ranging from mathemati-cal optimization (Ran and Boyce, 2012), (TANIGUCHI et al., 2001), (Betts,35
1998), to synchronous and asynchronous distributed communications (Harten-stein and Laberteaux, 2008), (Ben Jaballah et al., 2014a), (Ben Jaballah et al.,2014b), queuing theory (Faouzi et al., 2011) and traffic congestion detectionand forecasting (Marfia and Roccetti, 2011), just to mention a few. In fact,the primary scope of ITSs was at large interpreted as that of measuring traffic40
states in order to facilitate, through centralized (e.g., enforcing traffic lighttimings) (Zhou et al., 2010) or decentralized means (e.g., providing traffic in-formation to personal navigation systems) (Zhao, 2000), traffic flows (Wang,2010). A fundamental role in ITSs has been played by traffic sampling sys-tems (i.e., those systems that measure and report the amount of traffic that45
is flowing through a given road) (Kong et al., 2013), systems which exploitdifferent type of technologies (e.g., cellular, sensor and vehicular ad hoc net-work data) to estimate traffic flows in real-time. Now, with the progressivespread of a general environmental awareness and the development of novel

Sensing pollution on online social networks: a transportation perspective 3
sustainable mobility paradigms, the reduction of pollution levels has moved50
from being considered one of the positive side effects produced by the use ofITSs to become one of their primary objectives (Boriboonsomsin et al., 2012),(Banister, 2008). As a consequence, researchers have started investigating howpollution information could be used to modify and influence traffic control al-gorithms, giving environmental measurements a clear, policy-sensitive role in55
future traffic management and control schemes. Pollution sensors have, hence,become important feeds of information, just as important as traffic flow sen-sors, to be considered in the design of ITSs (Blythe et al., 2008), (Costabileand Allegrini, 2008). Such evolution should clearly push urban areas to de-ploy pervasive pollution sensor systems at large, as their output information60
could then be put to good use to improve traffic management and emissioncontainment operations.
However, although the policy makers and managers of many governmental,and non, industrial and transportation actors require the enforcement of lawsand processes leading to a clean environment and although the cost of pollu-65
tion sensing platforms is progressively decreasing, a pervasive and widespreaddeployment of such sensing technologies is still not financially sustainable(ranging from a few thousand dollars for light-scattering particulate mattermonitors to a hundred thousand dollars for microbalance ones). Both satel-lite and terrestrial solutions are being studied for a fine grained pollution70
estimation and simulation, with different results in terms of sensitivity, resolu-tion and accuracy (Tang and Wang, 2007), (Ma et al., 2008), (Honicky et al.,2008), (Ibarra-Berastegi et al., 2008), (Athanasiadis et al., 2009), (Hoff andChristopher, 2009), (Thatcher and Hurley, 2010), (Barzyk et al., 2015), (Fal-lah Shorshani et al., 2015). The common denominator, however, of all these75
technologies is the use of specialized hardware devices capable, by differentmeans, of estimating the presence and concentration of specific pollutants. Nosystem has instead involved so far any feedback received from the public. Thereasons of such oversight may be mainly found in the following two points:(a) a rapid and large scale collection of information from the public has been80
difficult, so far, and, (b) no large scale study provides any proof regardingthe reliability of such information (i.e., studies performed on limited groups ofresidents of given areas revealed that actual pollution situations may be verydifferent from what people perceive) (Hyslop, 2009).
New lifestyles, habits and ways of communicating have, however, emerged,85
with the now extensive use of Online Social Networks (OSNs). With OSNs,personal communications are no more limited to one-to-one patterns of ex-change of information (typical with phone calls and emails), but often (e.g.,the case of a public post with multiple replies) follow a structure where in-formation flows in a one-to-all fashion, allowing posts and comments to be90
read, answered and reposted by a multitude of users. In addition, posts can inprinciple touch upon any topics, as users can communicate anything with nocensorship, in some cases acting as a sensor (Srivastava et al., 2012), (Frater-nali et al., 2012). All this to express the following idea: the big data of OSNuser posts, that typically exposes what a person thinks and how s/he feels95
4 Rita Tse et al.
and behaves, could be an interesting source of pollution related information,actively contributing to the greater good (Ferretti et al., 2010), (Palazzi et al.,2010). In essence, a person equipped with a mobile phone, when posting on anOSN, can himself/herself act as a smart object, providing relevant information,i.e., pollution information, about the surrounding environment. The validity of100
such idea, clearly, requires a proof. In particular, it requires assessing whetherand how frequently people touch upon pollution topics when moving within anurban setting. In addition, even if a sufficient number of posts were available,their value would also need to be checked: could the observation of a givennumber of posts complaining about air quality really represent a red flag indi-105
cating that pollution conditions are not contained within their required limits?The quantity and quality of user posts need, hence, to be evaluated in orderto assess how researchers may effectively exploit such information.
The contribution of this paper is that of laying the foundation to betterunderstand: (a) how OSN data could be integrated into transportation policy,110
planning and system operations, (b) utilizing pollution related posts providedby people moving into urban settings, (c) while assessing whether the submit-ted posts follow a pattern which reflects effective pollution conditions. To doso, we: (a) analyze how OSN data may fit, in practice, in transportation designand implementations, (b) verifying the feasibility of utilizing mobile users as115
smart objects while reporting pollution feedback. This is performed analyz-ing over 1,500,000 Sina Weibo (a very popular social networking platform inChina) posts uploaded during a period of one year in five Chinese cities, HongKong, Guangzhou, Beijing, Chengdu and Shanghai.
This paper is organized as follows. After reviewing the approaches that fall120
closest to the one that has been presented in Section 2, a discussion regardingthe implications of this work on transportation policy, planning and systemsis carried out in Section 3. An analysis of how OSN data relates to pollutionsensor data in Sections 4, 5 and 6. The paper concludes with Section 7.
2 Related Work125
A wealth of research has been carried out on transportation policy, planningand systems (Rotemberg, 1985), (Kashani and Saridis, 1983), (Papageorgiou,1984), (Leontiadis et al., 2011), (Marfia and Roccetti, 2011), (Franchi andMalpezzi, 2013), (Mahmassani et al., 1993), (Ben-Akiva et al., 1997), (Jayakr-ishnan et al., 1993), (Ben-Akiva et al., 1994), . Only recently, however, clearly130
due to their sudden popularity and widespread use, the opportunity of puttingto good use any information that could be found on social networks has beenconsidered. The following briefly analyzes a few representative examples.
In (Kaufman, 2012), the author recommends the adoption of social mediapolicies for transportation providers seeking to inform, engage and motivate135
their customers. The author, in particular, considers the specific case of NewYork, where millions of commuters and tourists daily move. In essence, socialmedia are selected as they may not only serve to spread traffic and mobility
Sensing pollution on online social networks: a transportation perspective 5
information, but also to support existing communities (e.g., commuters, sin-gle parents taking kids to school, etc.), while providing a direct channel of140
communication which may solicite and encourage direct feedback from cus-tomers. Twitter and Facebook, and other microparticipation media, for ex-ample, are increasingly being exploited by transportation policy-makers andplanners. The contribution of Evans-Cowley and Griffin moves along theselines examining more than 49,000 posts on Twitter to assess public engage-145
ment, sentiment and the impact of user posts on the decision-making processrequired by the design of a city wide strategic mobility plan (Evans-Cowleyand Griffin, 2012). The conclusion of the authors is that microparticipationthrough social media is potentially effective, but nevertheless experiences sub-stantial communication barriers to make it really effective for the support of150
decision making processes. In (Goodspeed, 2013) the author pushes forth acontroversial perspective to the use of social media for a new theoretical un-derstanding of social life in cities. In essence, the author emphasizes the limitsof such data in different ways: posts are typically poor of content, hence, maybe easily misinterpreted, while being hardly generalizable as they often report155
upon specific places at given times. Concluding, in his contribution Goodspeedurges the adoption of mixed methods and action research. The work presentedin this paper moves into such direction, as it aims at finding and assessing anypollution-related information that may be available from geo-tagged posts onOSNs in order to expand the reach of conventional sensors.160
Focusing the attention now on ITSs, the authors of VoiceTweet, for exam-ple, devised a system that leverages on Twitter feeds to communicate trafficinformation perceived by a driver (Sha et al., 2013). In practice, a driver, whenstuck in traffic, can share his/her driving experience recording a voice tweetwith his/her social navigator. The social navigator then: (a) tags the message165
with its timestamp and the vehicle’s location, and, (b) sends the message toa server that, in turn, groups together all the messages that are received fromnearby locations during a given time frame. The server periodically sends outtweet digests on social channels: when receiving such messages, social naviga-tors prune off any unnecessary information (e.g., outdated or off route informa-170
tion) and compute a new route, or update the existing one. Clearly, VoiceTweetrequires the creation of a platform and of a wide user base (but this may notbe an issue, as the Waze experience has demonstrated (Jatowt et al., 2013)).Nevertheless, such solution only marginally exploits the enormous potential ofOSNs, as Twitter is here employed as a communication channel conveying the175
information created by a new service customer set, rather than as an avail-able source of spontaneous data. Social networking has also been exploited,within the ITS context, to alleviate traffic through the implementation of adynamic ride sharing community service. A recent work proposes the use of aninformation grid system, which, leveraging on OSNs, implements a carpool-180
ing service (Fu et al., 2008). Pedestrians and drivers can utilize the proposedsystem uploading their schedule and locations of interest (i.e., origin and des-tination points) on OSNs. The system downloads such information from OSNsand seeks for the best time/location correspondences between pedestrians and
6 Rita Tse et al.
drivers. If feasible solutions are found, both parties are informed and conve-185
niently left with the freedom of taking advantage of the proposed opportunity,or not. This work, just as the previous one, exploits OSNs as communicationmeans, rather than as independent sources of information. Interestingly, both(Miller, 2013) and (Mahmassani, 2011) discuss the opportunities that couldbe created with the integration of cooperative technologies and ITSs. In par-190
ticular, Miller envisions a virtual environment where data streams are fused,interpreted and made available with tools for human engagement and shareddecision-making (Miller, 2013). Following a similar line of reasoning, Mahmas-sani acknowledges that ITSs have incredibly progressed with the advent ofmobile platforms and apps, but also recognizes that there is a long way to195
go to take full advantage of the personalization/customization/socializationopportunities that they pose ahead of ITS planners and designers. While bothworks provide important intuitions, neither one, nor the other, practically ex-plain how such ideas could be put to good use to boost existing ITS solutions.
A second stream of research relevant for this study includes all those works200
which analyze the human awareness and perception of air pollution. Severalscientific contributions have shown how, for example, a direct exposure to pol-lution dramatically increases a population’s awareness for this problem. Suchfinding is congruent with the belief that everyday personal experience is im-portant in providing evidence of environmental risk (Bickerstaff and Walker,205
2001). In addition, it has been observed that long-term residents tend to ex-hibit denial or exaggerated perceptions when compared to newcomers (Edel-stein, 1988). Interestingly, the level of annoyance exhibited by the populationfor air pollution has grown to be considered an effective measure of overall en-vironmental quality, to the point that some countries also record such quantity210
for national environmental monitoring purposes (Jacquemin et al., 2007). Inessence, all of the reported studies conclude that a general worry for pollutionexists and that such concern is acknowledged being important for policy andplanning purposes. Nevertheless, no work has to this date considered assessingsuch risk resorting to the richest available source of human information, a.k.a.215
the Internet. This work opens such path, carrying out a large assessment basedon over one 1,500,000 posts found on online social networks.
In essence, to the best of the authors’ knowledge, this work is the firstaiming at unveiling whether the people who move inside an area of interestmay be exploited, through the lens of social media, as smart objects for the220
detection of pollution.
3 Pollution-aware transportation policy, planning and systems
A methodical integration of OSN sources of information in transportation pol-icy, planning and systems requires an understanding of what such data mayeffectively provide and of how it may influence future mobility solutions. Before225
proceeding, a clarification is required regarding how OSNs may fit transporta-tion needs. Agreeing with the caution recommended by many works, regarding

Sensing pollution on online social networks: a transportation perspective 7
the reliability of public perception, in general, and the use of any informationthat may be found on OSNs, this contribution aims at advancing the state ofthe art regarding the integration an OSN source of pollution data with the230
feeds gathered from traditional sensors (Bickerstaff, 2004), (Goodspeed, 2013).The following subsections, hence, proceed providing an overview of how OSNbased pollution information may fit existing transportation policy, planningand systems.
3.1 Policy, Planning and OSN-based Pollution235
As reviewed in Section 2, there is a widespread concern for pollution: manycountries constantly monitor pollutant levels in order to drive their transporta-tion policy and planning (Bickerstaff, 2004), (Lindholm and Blinge, 2014). Inaddition, traditional sensors are not the only means by which pollution assess-ment is being conducted, there is growing interest for the annoyance suffered,240
as a consequence of pollution, by people (Jacquemin et al., 2007). Annoyance,in fact, has raised to be regarded as a useful measure of perceived ambientquality and a complementary tool for health surveillance and transportationmanagement. In such scenario, it is important to understand the utility thatany information gathered on OSNs may have.245
The utility of OSN-based information may be assessed adopting two differ-ent perspectives. In particular, aiming at automatically estimating pollutantlevels, problems such as perception, reliability and interpretability of OSNposts emerge. In essence, consider the simple case where a human being, sayJohn, perceives a given pollutant. Even if John correctly perceives that pollu-250
tant, the reliability of what he says online is not guaranteed. In addition, sayJohn perceived the pollutant correctly and is convinced he reported what heperceived online, his post may still be misunderstood by a computer algorithm,for a long list of reasons (e.g., jargon, ironic expression, cultural approach,etc.). Adopting such perspective, hence, the validity of the OSN information255
regarding a given location at a given time should be verified finding ways ofconfronting posts with pollutant levels measured by nearby traditional sensors(Figure 1).
Regardless of the accuracy of any OSN-based information, such informationmay still be interesting for policy and planning purposes. In fact, considering260
the matrix of possible information outcomes, shown in Figure 2, it is possibleto analyze four possible cases:
1. Both OSN-posts and pollution sensors signal high pollution;2. Both OSN-posts and pollution sensors signal low pollution;3. The annoyance that emerges from OSNs is high, while pollution levels are265
low;4. The annoyance that emerges from OSNs is low, while pollution levels are
high.
While finding 1) and 2) would indeed be interesting in order to adopt OSNposts as sensors, also scenarios 3) and 4) are relevant for policy and planning.270

8 Rita Tse et al.
In fact, both of such situations signal a mismatch between what is perceivedby the population, according to OSNs, and the reality of things. Finding a highannoyance level and low pollution values can require responding to questionslike: are the methodologies adopted to assess pollution levels sound? Whyare people perceiving (and complaining) so harshly about pollution, when275
pollution appears contained below reasonable values? Similar questions maybe asked in the opposite situation, while a lack of interest for the problemmay pose an interesting policy question, regarding the degree of awarenessand knowledge of the population concerning such problem.
Pollu%on sensor
Traffic! Can’t breadth
It is very humid
The road is congested There is an
accident ahead!
Traffic!
Terrible weather
Sooo humid!
The road is
blocked
Fig. 1: Information mix: extending sensor coverage using OSN posts.
3.2 ITSs and Pollution280
Before describing which type of ITS architecture could effectively incorporateOSN-based sources of information, it is worthwhile summarizing how suchcomplex systems are organized. Two main approaches have emerged with theaim of limiting the business and societal costs of vehicular congestion (Ben-Akiva et al., 1994), (Wootton et al., 1995), (Hellinga et al., 1995). The first285

Sensing pollution on online social networks: a transportation perspective 9
High Annoyance
No Annoyance
High Pollu1on No Pollu1on
Known situa1on
Ideal situa1on
• Sampling methodology
problem? • Percep1on problem?
• Sampling methodology
problem? • Percep1on problem? • Awareness problem?
Fig. 2: Information alignment matrix: possible scenarios and implications fortransportation policy and planning.
amounts to provide aggregate traffic information (e.g., intensity of traffic vol-umes estimated and lane occupancy rates estimated with video cameras andinduction loops) to Advanced Traffic Management Systems (ATMSs) to con-trol the road infrastructure (e.g., traffic light cycles or congestion charges)and to provide aggregate traffic information to drivers (e.g., with dynamic290
message signs and FM radios). The second approach is, instead, based on theidea of feeding road traversal times, sampled with probe vehicles, to AdvancedTraveler’s Information Systems (ATISs) which, in turn, supply drivers with afeedback on traffic and suggested routes (i.e., a driver’s optimal route) to theirdestinations.295
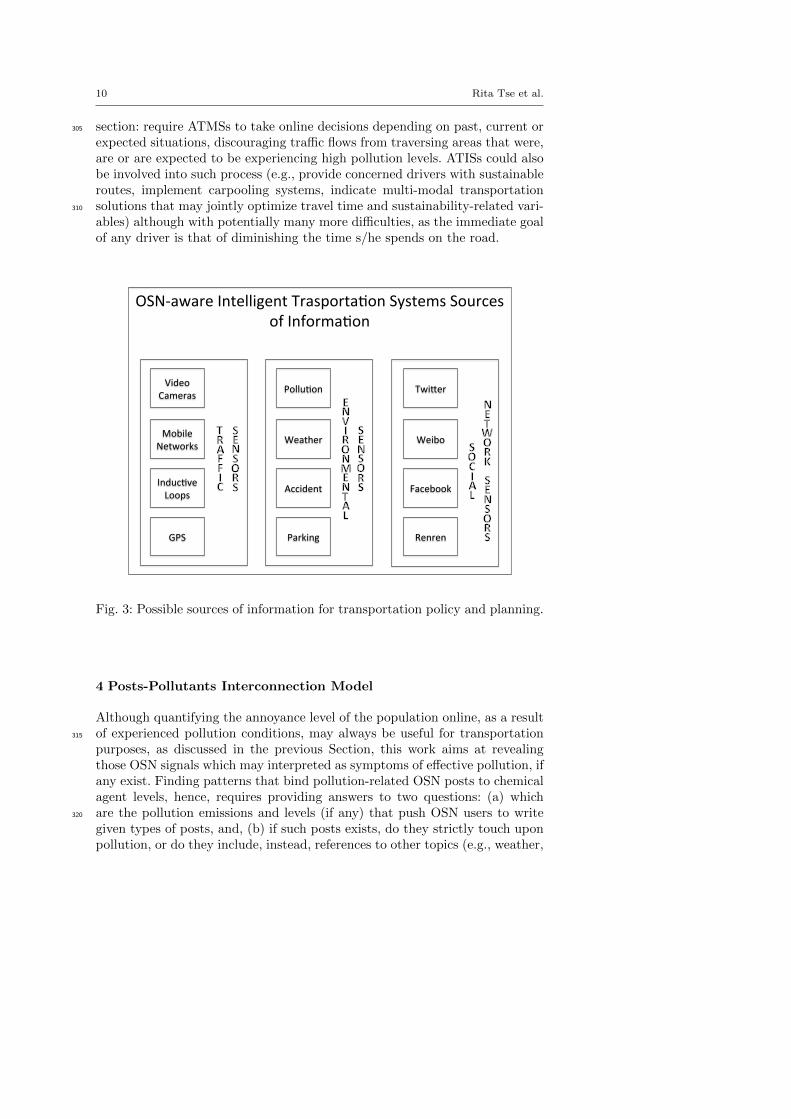
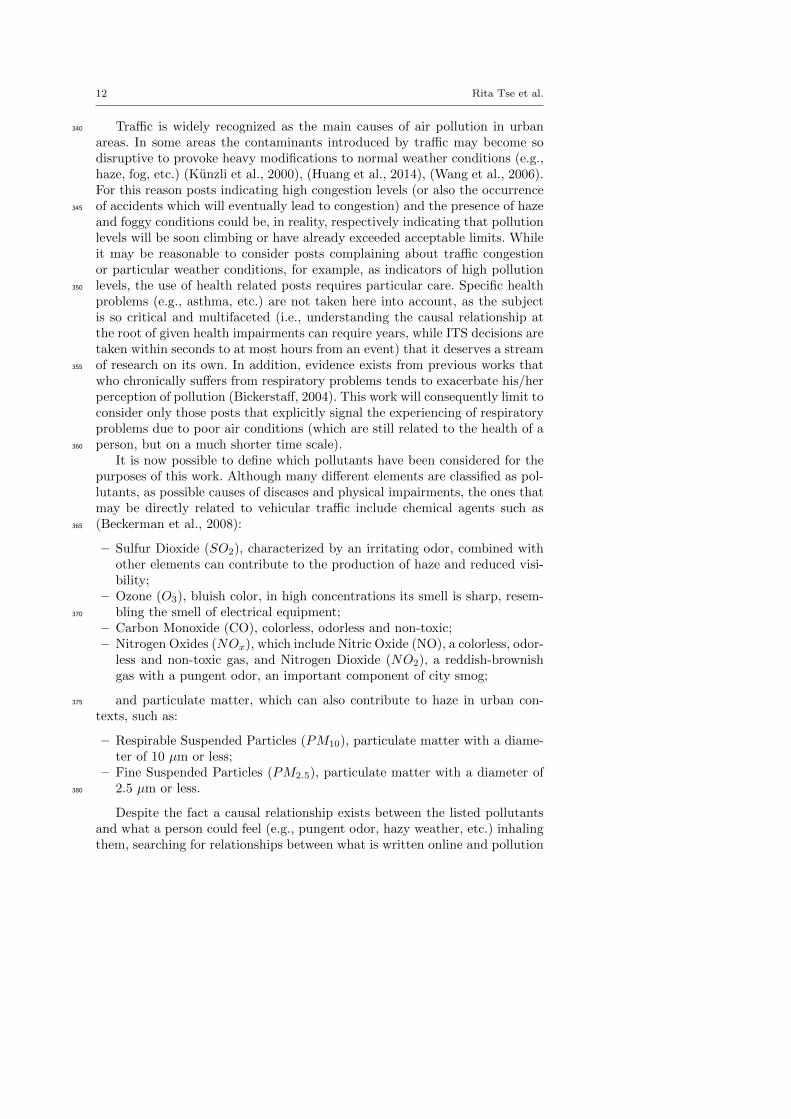
Both of such approaches deal with a plethora of traffic information sources(e.g., cellular networks, vehicular ad hoc networks, induction loops, video cam-eras, etc.) that have or are in the process of becoming available (?). The idea isto also integrate data derived from OSNs, just as sensor data, into such infras-tructure (Figure 3). In order to do this, for the particular case of pollution data,300
it is important to remind that the two systems are operated by players withcompletely different points of view and needs: transportation authorities runATMSs, while ATISs are marketed by private businesses. The authorities couldimplement on a short-term basis what has been discussed in the previous Sub-
10 Rita Tse et al.
section: require ATMSs to take online decisions depending on past, current or305
expected situations, discouraging traffic flows from traversing areas that were,are or are expected to be experiencing high pollution levels. ATISs could alsobe involved into such process (e.g., provide concerned drivers with sustainableroutes, implement carpooling systems, indicate multi-modal transportationsolutions that may jointly optimize travel time and sustainability-related vari-310
ables) although with potentially many more difficulties, as the immediate goalof any driver is that of diminishing the time s/he spends on the road.
OSN-‐aware Intelligent Trasporta4on Systems Sources of Informa4on
Mobile Networks
GPS
Video Cameras
Induc4ve Loops
TwiDer Pollu4on
Weather
Accident
Parking
Renren
Fig. 3: Possible sources of information for transportation policy and planning.
4 Posts-Pollutants Interconnection Model
Although quantifying the annoyance level of the population online, as a resultof experienced pollution conditions, may always be useful for transportation315
purposes, as discussed in the previous Section, this work aims at revealingthose OSN signals which may interpreted as symptoms of effective pollution, ifany exist. Finding patterns that bind pollution-related OSN posts to chemicalagent levels, hence, requires providing answers to two questions: (a) whichare the pollution emissions and levels (if any) that push OSN users to write320
given types of posts, and, (b) if such posts exists, do they strictly touch uponpollution, or do they include, instead, references to other topics (e.g., weather,
Sensing pollution on online social networks: a transportation perspective 11
congestion, ability to breath, etc.)? An answer to both of such questions canbe given proceeding in the following order: the candidate sentinel topics andthe pollutants of interest are identified in this Section, whereas the search for325
any existing patterns between such quantities is postponed to the on-the-fielddata analysis conducted as part of this work.
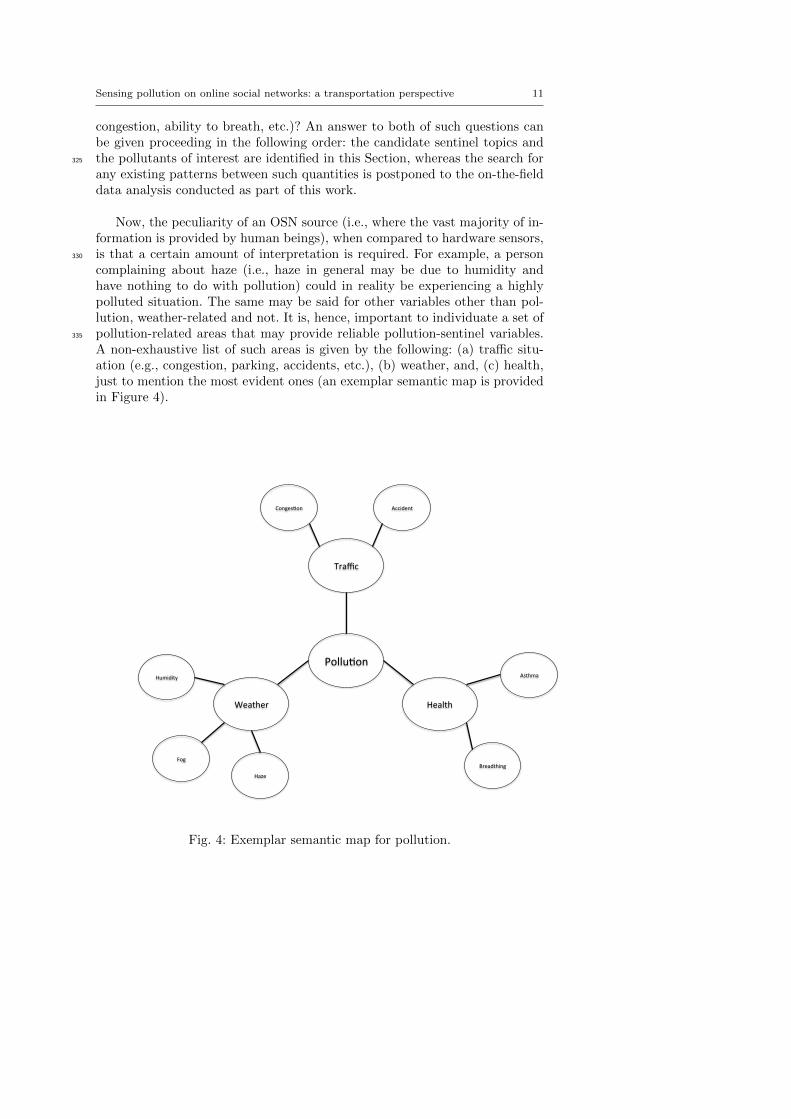
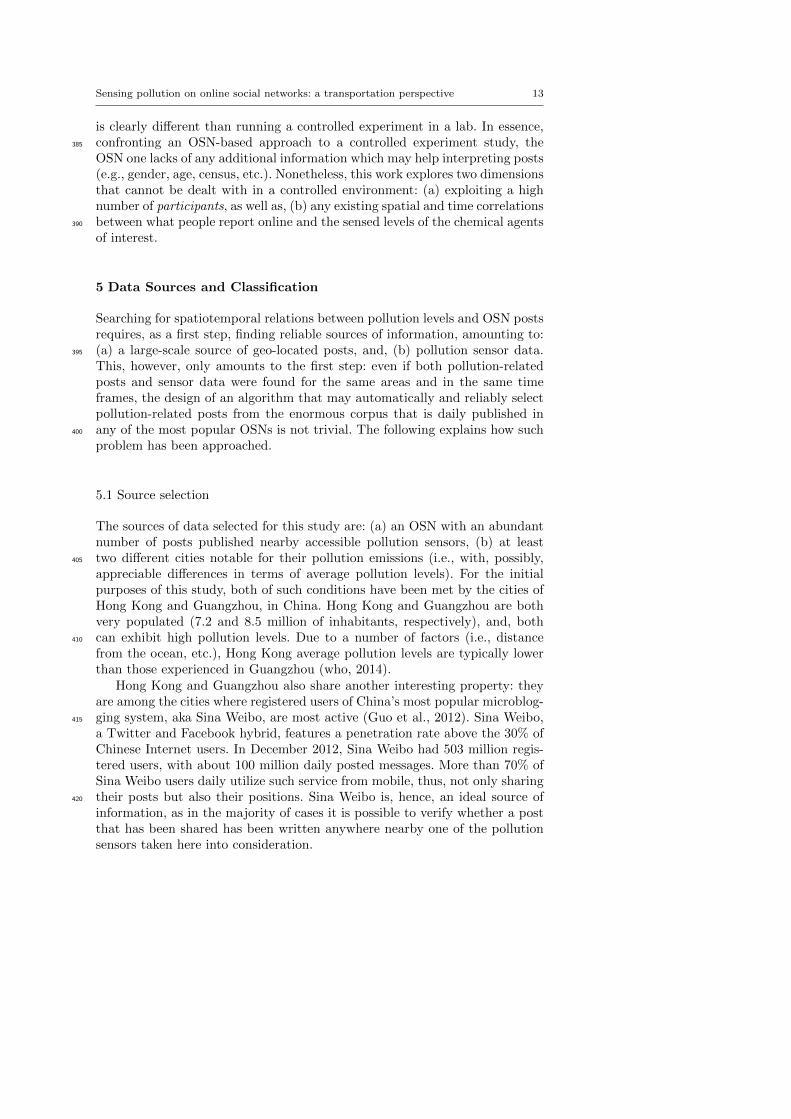
Now, the peculiarity of an OSN source (i.e., where the vast majority of in-formation is provided by human beings), when compared to hardware sensors,is that a certain amount of interpretation is required. For example, a person330
complaining about haze (i.e., haze in general may be due to humidity andhave nothing to do with pollution) could in reality be experiencing a highlypolluted situation. The same may be said for other variables other than pol-lution, weather-related and not. It is, hence, important to individuate a set ofpollution-related areas that may provide reliable pollution-sentinel variables.335
A non-exhaustive list of such areas is given by the following: (a) traffic situ-ation (e.g., congestion, parking, accidents, etc.), (b) weather, and, (c) health,just to mention the most evident ones (an exemplar semantic map is providedin Figure 4).
Pollu%on
Weather Health
Traffic
Humidity
Fog
Haze
Conges%on Accident
Breadthing
Asthma
Fig. 4: Exemplar semantic map for pollution.
12 Rita Tse et al.
Traffic is widely recognized as the main causes of air pollution in urban340
areas. In some areas the contaminants introduced by traffic may become sodisruptive to provoke heavy modifications to normal weather conditions (e.g.,haze, fog, etc.) (Kunzli et al., 2000), (Huang et al., 2014), (Wang et al., 2006).For this reason posts indicating high congestion levels (or also the occurrenceof accidents which will eventually lead to congestion) and the presence of haze345
and foggy conditions could be, in reality, respectively indicating that pollutionlevels will be soon climbing or have already exceeded acceptable limits. Whileit may be reasonable to consider posts complaining about traffic congestionor particular weather conditions, for example, as indicators of high pollutionlevels, the use of health related posts requires particular care. Specific health350
problems (e.g., asthma, etc.) are not taken here into account, as the subjectis so critical and multifaceted (i.e., understanding the causal relationship atthe root of given health impairments can require years, while ITS decisions aretaken within seconds to at most hours from an event) that it deserves a streamof research on its own. In addition, evidence exists from previous works that355
who chronically suffers from respiratory problems tends to exacerbate his/herperception of pollution (Bickerstaff, 2004). This work will consequently limit toconsider only those posts that explicitly signal the experiencing of respiratoryproblems due to poor air conditions (which are still related to the health of aperson, but on a much shorter time scale).360
It is now possible to define which pollutants have been considered for thepurposes of this work. Although many different elements are classified as pol-lutants, as possible causes of diseases and physical impairments, the ones thatmay be directly related to vehicular traffic include chemical agents such as(Beckerman et al., 2008):365
– Sulfur Dioxide (SO2), characterized by an irritating odor, combined withother elements can contribute to the production of haze and reduced visi-bility;
– Ozone (O3), bluish color, in high concentrations its smell is sharp, resem-bling the smell of electrical equipment;370
– Carbon Monoxide (CO), colorless, odorless and non-toxic;– Nitrogen Oxides (NOx), which include Nitric Oxide (NO), a colorless, odor-
less and non-toxic gas, and Nitrogen Dioxide (NO2), a reddish-brownishgas with a pungent odor, an important component of city smog;
and particulate matter, which can also contribute to haze in urban con-375
texts, such as:
– Respirable Suspended Particles (PM10), particulate matter with a diame-ter of 10 µm or less;
– Fine Suspended Particles (PM2.5), particulate matter with a diameter of2.5 µm or less.380
Despite the fact a causal relationship exists between the listed pollutantsand what a person could feel (e.g., pungent odor, hazy weather, etc.) inhalingthem, searching for relationships between what is written online and pollution
Sensing pollution on online social networks: a transportation perspective 13
is clearly different than running a controlled experiment in a lab. In essence,confronting an OSN-based approach to a controlled experiment study, the385
OSN one lacks of any additional information which may help interpreting posts(e.g., gender, age, census, etc.). Nonetheless, this work explores two dimensionsthat cannot be dealt with in a controlled environment: (a) exploiting a highnumber of participants, as well as, (b) any existing spatial and time correlationsbetween what people report online and the sensed levels of the chemical agents390
of interest.
5 Data Sources and Classification
Searching for spatiotemporal relations between pollution levels and OSN postsrequires, as a first step, finding reliable sources of information, amounting to:(a) a large-scale source of geo-located posts, and, (b) pollution sensor data.395
This, however, only amounts to the first step: even if both pollution-relatedposts and sensor data were found for the same areas and in the same timeframes, the design of an algorithm that may automatically and reliably selectpollution-related posts from the enormous corpus that is daily published inany of the most popular OSNs is not trivial. The following explains how such400
problem has been approached.
5.1 Source selection
The sources of data selected for this study are: (a) an OSN with an abundantnumber of posts published nearby accessible pollution sensors, (b) at leasttwo different cities notable for their pollution emissions (i.e., with, possibly,405
appreciable differences in terms of average pollution levels). For the initialpurposes of this study, both of such conditions have been met by the cities ofHong Kong and Guangzhou, in China. Hong Kong and Guangzhou are bothvery populated (7.2 and 8.5 million of inhabitants, respectively), and, bothcan exhibit high pollution levels. Due to a number of factors (i.e., distance410
from the ocean, etc.), Hong Kong average pollution levels are typically lowerthan those experienced in Guangzhou (who, 2014).
Hong Kong and Guangzhou also share another interesting property: theyare among the cities where registered users of China’s most popular microblog-ging system, aka Sina Weibo, are most active (Guo et al., 2012). Sina Weibo,415
a Twitter and Facebook hybrid, features a penetration rate above the 30% ofChinese Internet users. In December 2012, Sina Weibo had 503 million regis-tered users, with about 100 million daily posted messages. More than 70% ofSina Weibo users daily utilize such service from mobile, thus, not only sharingtheir posts but also their positions. Sina Weibo is, hence, an ideal source of420
information, as in the majority of cases it is possible to verify whether a postthat has been shared has been written anywhere nearby one of the pollutionsensors taken here into consideration.

14 Rita Tse et al.
In addition, for Hong Kong is has been possible to access multiple sourcesof pollution information: SO2, CO, O3, NOx, NO2, PM10 and PM2.5 sensors425
from multiple sites. For the purpose of this work, the Central, Causeway Bayand Mongkok sites have been chosen, as they cover the downtown areas of thecity. In Guangzhou, instead, a downtown sensor located inside and operatedby the American Embassy provides PM2.5 hourly information.
5.2 Post classification430
Starting on October 3rd 2012, throughout April 3rd 2014, approximately 640thousand Sina Weibo posts written by 228,684 users and 910 thousand postspublished by 505,033, have been recorded, respectively, in the areas of HongKong and Guangzhou. Of all this corpus of data, only those posts that havebeen written within a radius of 5 km from any of the accessible pollution435
sensors (i.e., a value chosen as a tradeoff between finding a sufficient numberof posts and observing pollution conditions consistent with the reference sen-sors) have been considered. Now the final step required to be able to supporta comparison between pollution levels and pollution-related posts was the se-lection of the latter. Pollution-related post classification has been conducted440
according to the strategy indicated in Section 4, i.e., searching for any poststhat were related to air pollution in any of the following four categories: (a)pollution, (b) weather, (c) traffic, or, (d) health. To do so in an automatic way,three different paths have been followed.
The first path has been that of utilizing a well-accepted methodology in445
text classification, which is a Naıve Bayesian classifier (McCallum and Nigam,1998). This has been performed resorting to the PyMining Naıve Bayes im-plementation, which supported the construction of a database of relevant fea-tures concerning the pollution, weather, traffic and health. In order to test thesoundness of the classifications operated with this algorithm, a total number450
of 1000 posts, randomly taken from those that have been classified as relatedto pollution, have been divided into 10 subsets of 100 posts each and checkedby 10 independent human classifiers, respectively. Unfortunately, this checkrevealed that the average performance of this method was as low as 61%.
The second path has, hence, involved utilized a second popular classifi-455
cation mechanism, namely a Support Vector Machine (SVM) (Hearst et al.,1998). In order to classify the Chinese text, this strategy required walkingthrough two successive steps, training and testing. During the training part, atraining document containing relevant terms related to pollution was manuallycreated and its words were segmented to formulate a model from the computed460
eigenvalues and term-frequency inverse-document-frequency matrix. The ap-plication of such model improved the classification performance, compared tothe use of Naıve Bayes. The same test that was utilized for Naıve Bayes, in thiscase revealed an average performance of 88% (i.e., 88% of the posts classifiedas pollution-related where effectively pollution-related).465
Sensing pollution on online social networks: a transportation perspective 15
The third and final path entailed utilizing a dictionary constructed uti-lizing the keywords most frequently found in pollution-related posts. Table 1summarizes the keywords that have been used to individuate posts falling intoeach of the four categories. Interestingly, the use of such terms provided anaverage performance of 91%, higher than any of the machine learning algo-470
rithms employed so far. We hence opted for utilizing such methodology forpost classification in the rest of this work.
Table 1: Pollution-related terms dictionary.
Category Terms (English translation)Pollution Pollution, poor air, gray sky, air qualityWeather Haze, fog, gray sky, bad weatherTraffic Traffic jams, congestionHealth Unable to breadth
As further and final checks, additional tests have been performed on thefinal sets of data (ca. 15,000 posts in Hong Kong and almost 4,000 postsin Guangzhou), in order to ensure that the obtained posts were effectively475
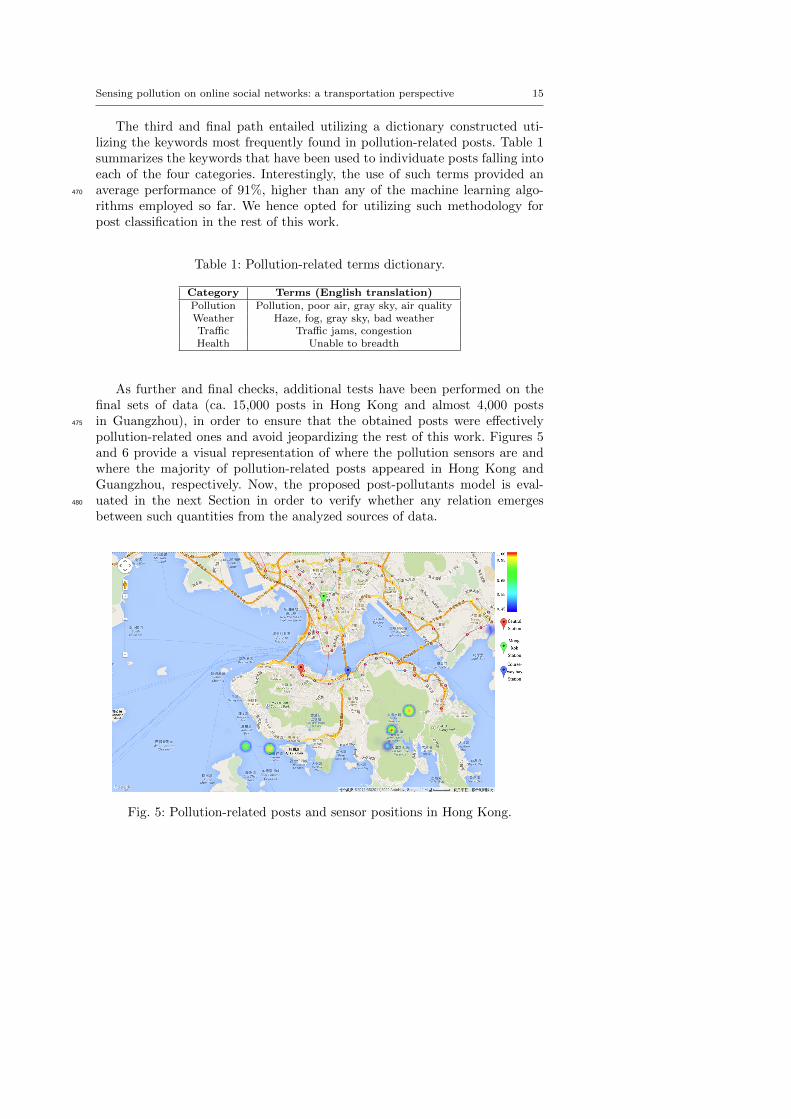
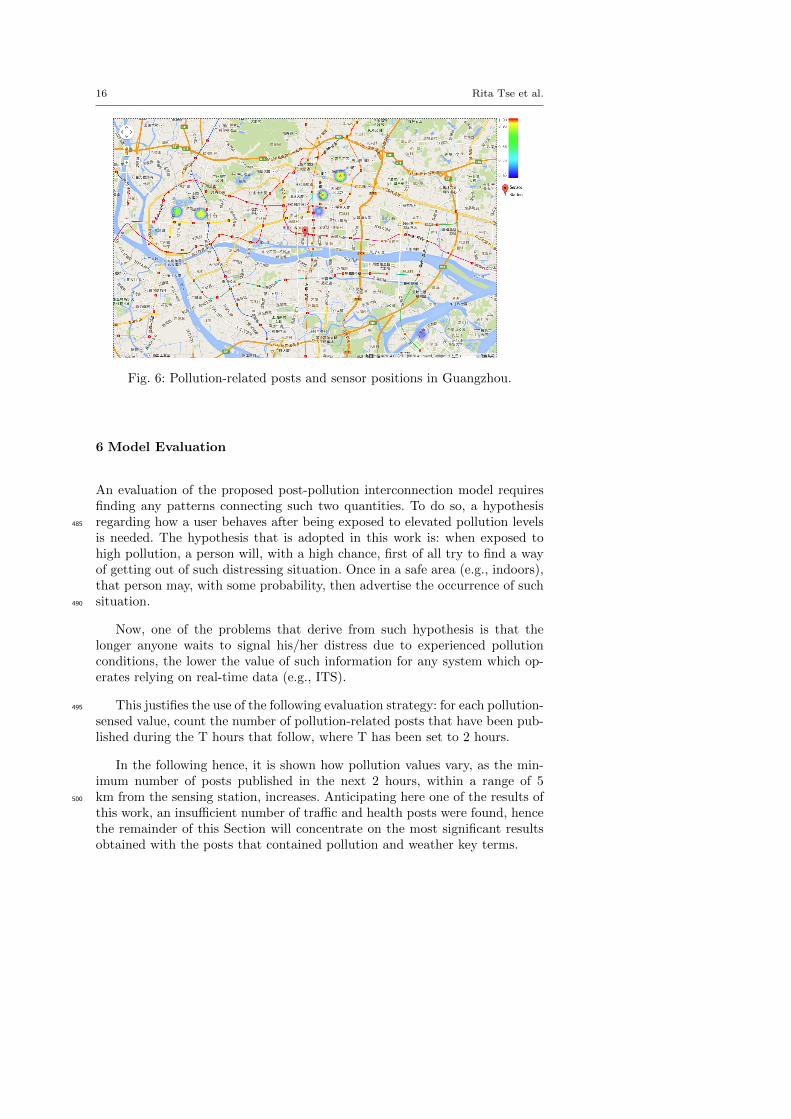
pollution-related ones and avoid jeopardizing the rest of this work. Figures 5and 6 provide a visual representation of where the pollution sensors are andwhere the majority of pollution-related posts appeared in Hong Kong andGuangzhou, respectively. Now, the proposed post-pollutants model is eval-uated in the next Section in order to verify whether any relation emerges480
between such quantities from the analyzed sources of data.
Fig. 5: Pollution-related posts and sensor positions in Hong Kong.
16 Rita Tse et al.
Fig. 6: Pollution-related posts and sensor positions in Guangzhou.
6 Model Evaluation
An evaluation of the proposed post-pollution interconnection model requiresfinding any patterns connecting such two quantities. To do so, a hypothesisregarding how a user behaves after being exposed to elevated pollution levels485
is needed. The hypothesis that is adopted in this work is: when exposed tohigh pollution, a person will, with a high chance, first of all try to find a wayof getting out of such distressing situation. Once in a safe area (e.g., indoors),that person may, with some probability, then advertise the occurrence of suchsituation.490
Now, one of the problems that derive from such hypothesis is that thelonger anyone waits to signal his/her distress due to experienced pollutionconditions, the lower the value of such information for any system which op-erates relying on real-time data (e.g., ITS).
This justifies the use of the following evaluation strategy: for each pollution-495
sensed value, count the number of pollution-related posts that have been pub-lished during the T hours that follow, where T has been set to 2 hours.
In the following hence, it is shown how pollution values vary, as the min-imum number of posts published in the next 2 hours, within a range of 5km from the sensing station, increases. Anticipating here one of the results of500
this work, an insufficient number of traffic and health posts were found, hencethe remainder of this Section will concentrate on the most significant resultsobtained with the posts that contained pollution and weather key terms.
Sensing pollution on online social networks: a transportation perspective 17
6.1 Term Categories vs. Pollution Levels
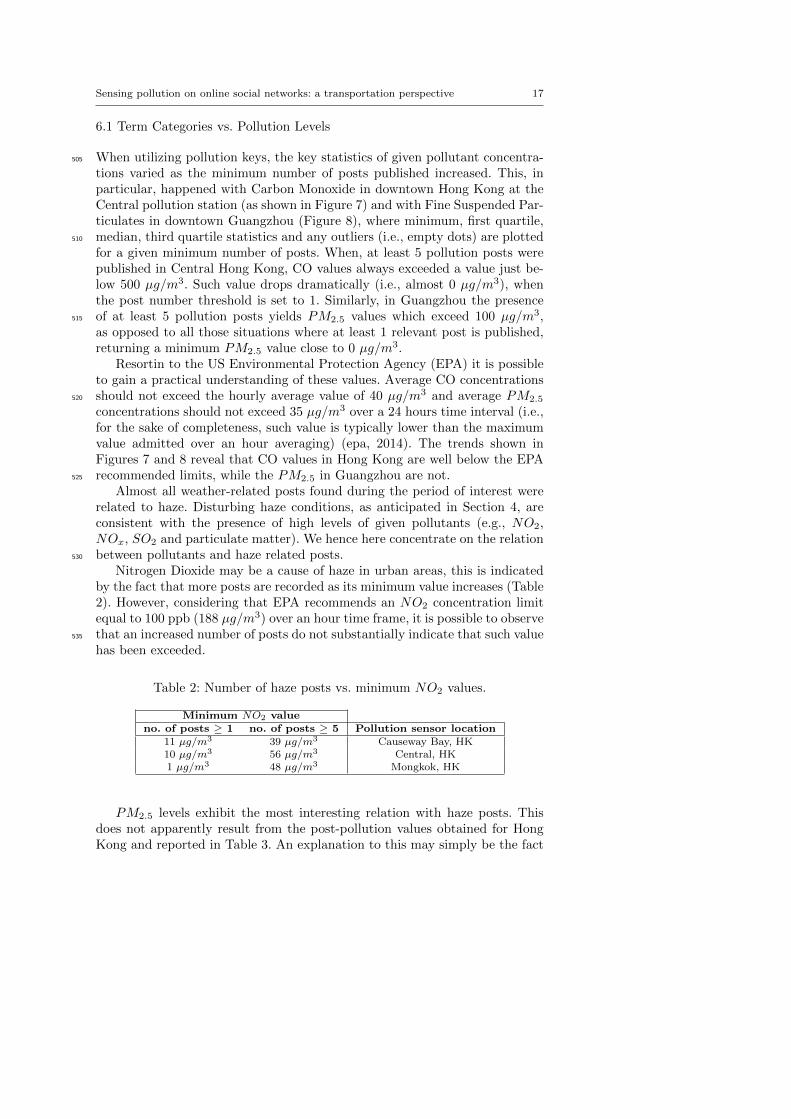
When utilizing pollution keys, the key statistics of given pollutant concentra-505
tions varied as the minimum number of posts published increased. This, inparticular, happened with Carbon Monoxide in downtown Hong Kong at theCentral pollution station (as shown in Figure 7) and with Fine Suspended Par-ticulates in downtown Guangzhou (Figure 8), where minimum, first quartile,median, third quartile statistics and any outliers (i.e., empty dots) are plotted510
for a given minimum number of posts. When, at least 5 pollution posts werepublished in Central Hong Kong, CO values always exceeded a value just be-low 500 µg/m3. Such value drops dramatically (i.e., almost 0 µg/m3), whenthe post number threshold is set to 1. Similarly, in Guangzhou the presenceof at least 5 pollution posts yields PM2.5 values which exceed 100 µg/m3,515
as opposed to all those situations where at least 1 relevant post is published,returning a minimum PM2.5 value close to 0 µg/m3.
Resortin to the US Environmental Protection Agency (EPA) it is possibleto gain a practical understanding of these values. Average CO concentrationsshould not exceed the hourly average value of 40 µg/m3 and average PM2.5520
concentrations should not exceed 35 µg/m3 over a 24 hours time interval (i.e.,for the sake of completeness, such value is typically lower than the maximumvalue admitted over an hour averaging) (epa, 2014). The trends shown inFigures 7 and 8 reveal that CO values in Hong Kong are well below the EPArecommended limits, while the PM2.5 in Guangzhou are not.525
Almost all weather-related posts found during the period of interest wererelated to haze. Disturbing haze conditions, as anticipated in Section 4, areconsistent with the presence of high levels of given pollutants (e.g., NO2,NOx, SO2 and particulate matter). We hence here concentrate on the relationbetween pollutants and haze related posts.530
Nitrogen Dioxide may be a cause of haze in urban areas, this is indicatedby the fact that more posts are recorded as its minimum value increases (Table2). However, considering that EPA recommends an NO2 concentration limitequal to 100 ppb (188 µg/m3) over an hour time frame, it is possible to observethat an increased number of posts do not substantially indicate that such value535
has been exceeded.
Table 2: Number of haze posts vs. minimum NO2 values.
Minimum NO2 valueno. of posts ≥ 1 no. of posts ≥ 5 Pollution sensor location
11 µg/m3 39 µg/m3 Causeway Bay, HK10 µg/m3 56 µg/m3 Central, HK1 µg/m3 48 µg/m3 Mongkok, HK
PM2.5 levels exhibit the most interesting relation with haze posts. Thisdoes not apparently result from the post-pollution values obtained for HongKong and reported in Table 3. An explanation to this may simply be the fact

18 Rita Tse et al.
1 5
050
100
150
200
Central HK: CO vs. weibo posts
Minimum number of pollution related weibo posts
CO
[10µg/m3 ]
Fig. 7: Pollution posts vs. CO values in Central, Hong Kong.
that average values in Hong Kong, for PM2.5, fall in the 30-40 µg/m3 range, in540
essence approximately equal to the EPA 35 µg/m3 limit. Hazy conditions arereported in literature when PM2.5 values exceed those obtained in Hong Kong(Sun et al., 2006). The situation in Guangzhou appears different, according tothe visual relation between haze-related posts and PM2.5 levels returned byFigure 9: more posts (i.e., at least 15 haze related posts) are published as the545
minimum value of PM2.5 falls above 100 µg/m3, hence, well beyond acceptablevalues (Zhang et al., 2014). A closer look at such data reveals that the dayswhen Sina Weibo users in Guangzhou noticed higher haze levels, publishingat least 15 posts, are the 13th of December 2013, the 8th and the 25th ofJanuary, the 17th 18th and 26th of February and the 3rd and 12th of March550
2014, all part of a period where high haze and pollution have been recordedfor Guangzhou.
It was possible to establish a dependence also between the values of CO con-centration and the number of weather-related posts published by Sina Weibousers. Table 4 shows this trend, which is more evident in Central than in other555
locations in Hong Kong.
Sensing pollution on online social networks: a transportation perspective 19
1 5
0100
200
300
400
500
600
American Embassy GZ: FSP vs. weibo posts
Minimum number of pollution related weibo posts
PM2.5
[µg/m3 ]
Fig. 8: Pollution posts vs. PM2.5 values at the American Embassy, Guangzhou.
Table 3: Number of haze posts vs. minimum PM2.5 values.
Minimum PM2.5 valueno. of posts ≥ 1 no. of posts ≥ 5 Pollution sensor location
2 µg/m3 7 µg/m3 Causeway Bay, HK3 µg/m3 8 µg/m3 Central, HK1 µg/m3 5 µg/m3 Mongkok, HK
6.2 Extending the Evaluation
The results described in Subsection 6.1 strongly indicate the existence of atrend between: (a) haze, a topic often mentioned on OSNs by the citizens ofHong Kong and Guangzhou and, (b) high PM2.5 values. To corroborate such560
result Guangzhou data is further validated and the same approach is extendedto Beijing, Shanghai and Chengdu.
A further check on Guangzhou data entailed first establishing whether per-sons or machines had published the posts considered in Figure 9 concerninghaze in Guangzhou. The entire data set has been reviewed. Of almost 4000565
20 Rita Tse et al.
1 5 10 15 20 25 30 35 40
0100
200
300
400
500
600
American Embassy GZ: FSP vs. weibo posts
Minimum number of haze related weibo posts
PM2.5
[µg/m3 ]
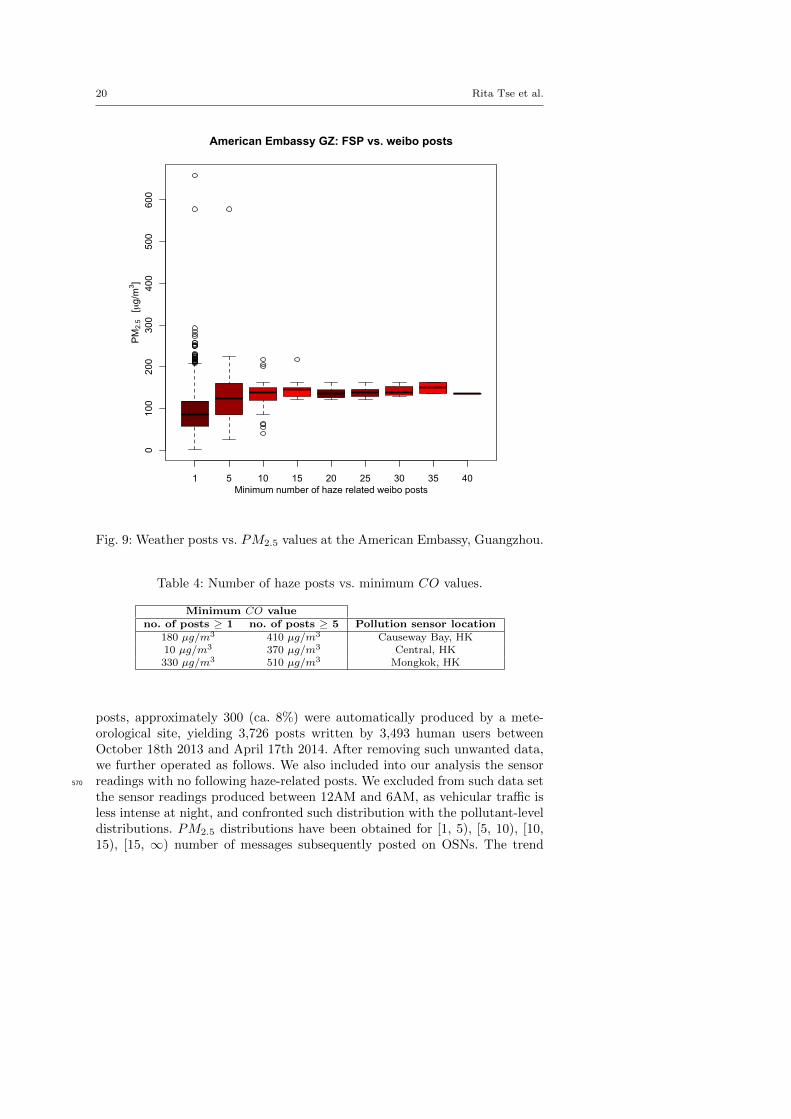
Fig. 9: Weather posts vs. PM2.5 values at the American Embassy, Guangzhou.
Table 4: Number of haze posts vs. minimum CO values.
Minimum CO valueno. of posts ≥ 1 no. of posts ≥ 5 Pollution sensor location
180 µg/m3 410 µg/m3 Causeway Bay, HK10 µg/m3 370 µg/m3 Central, HK330 µg/m3 510 µg/m3 Mongkok, HK
posts, approximately 300 (ca. 8%) were automatically produced by a mete-orological site, yielding 3,726 posts written by 3,493 human users betweenOctober 18th 2013 and April 17th 2014. After removing such unwanted data,we further operated as follows. We also included into our analysis the sensorreadings with no following haze-related posts. We excluded from such data set570
the sensor readings produced between 12AM and 6AM, as vehicular traffic isless intense at night, and confronted such distribution with the pollutant-leveldistributions. PM2.5 distributions have been obtained for [1, 5), [5, 10), [10,15), [15, ∞) number of messages subsequently posted on OSNs. The trend

Sensing pollution on online social networks: a transportation perspective 21
emerging in Figure 10a confirms that minimum PM2.5 levels increase as the575
number of haze-related published posts increase.
Now, for the four sites that have been so far considered, the average PM2.5
values for 2013 were 33 µg/m3 in Hong Kong Mongkok, 34 in Hong Kong Cen-tral, 45 in Hong Kong Causeway Bay and 52.2 in Guangzhou, respectively.The same average values obtained by the sensor stations taken under consid-580
eration in Beijing, Shanghai and Chengdu were 90.1, 60.7 and 86.3 µg/m3,respectively. The observation period for the three new cities taken under con-sideration is October 21th 2014 December 17th 2014.
A total number of 292,590, 283,179 and 248,939 posts were published from135,870, 127,320 and 111,641 accounts, respectively, in Beijing, Shanghai and585
Chengdu. Processing such posts, it has been possible to observe that 1,492, 426and 416 haze-related posts were published by respectively 1421, 415 and 379human users in the three cities of interest (Beijing, Shanghai and Chengdu,in this order). Of these posts, 1312, 248 and 228 were published within a 5km radius from a source of PM2.5 data. Figures 10b, 10c and 10d confirm590
what was first observed in Guangzhou: as the number of haze-related postsincrease, the minimum value of PM2.5 emissions increase, generally indicatinghaze-related posts as a symptom of high PM2.5 values.
6.3 Model Analysis
The result inferred in Subsection 6.2, concentrations of PM2.5 exceeding given595
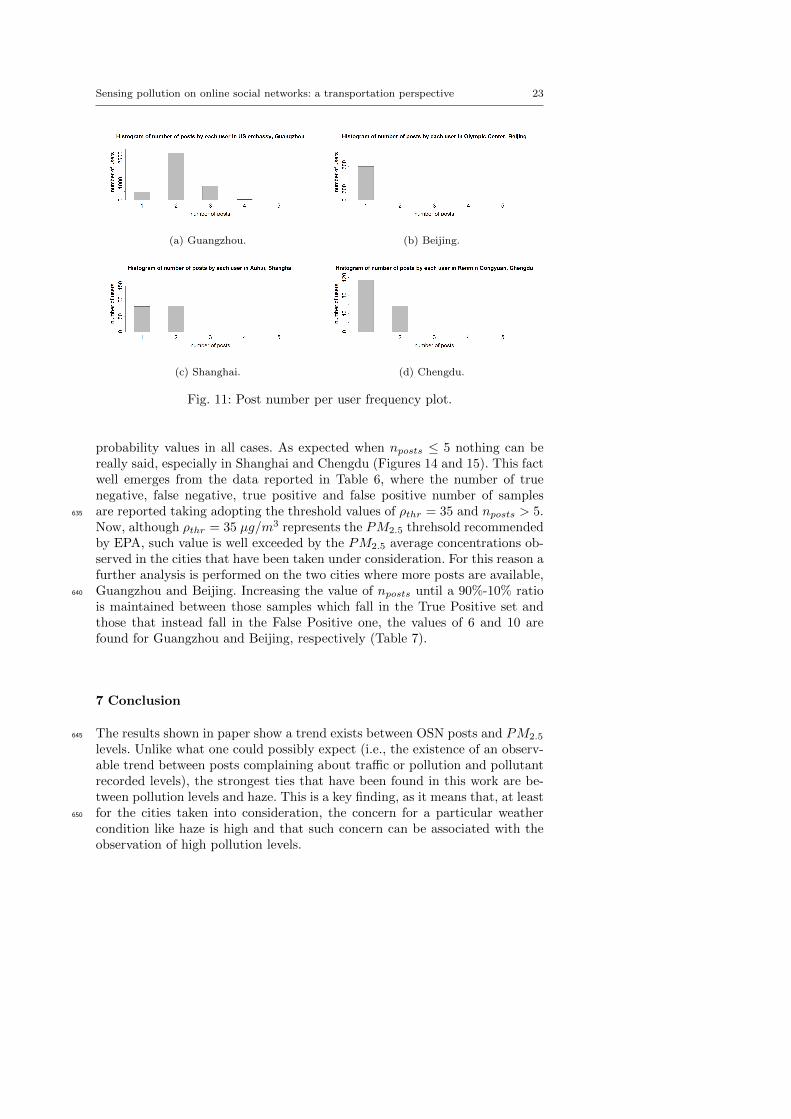
values are often signalled by multiple posts concerning haze appearing onWeibo, does not leverage on the fact that given Weibo users may be more re-liable than others. If this were true, monitoring selected users may result con-venient in order to better track PM2.5 concentrations. The frequency graphsshown in Figure 11 indicates such approach would not work in the observed600
cities, as no user posted more than 5 messages concerning haze, while thegreat majority posted at most 2. Such scenario does not support the design ofalgorithms that may leverage on the past history of users, at least on the timeintervals considered in this paper.
Now, to better quantify the relation between posts and pollution, the605
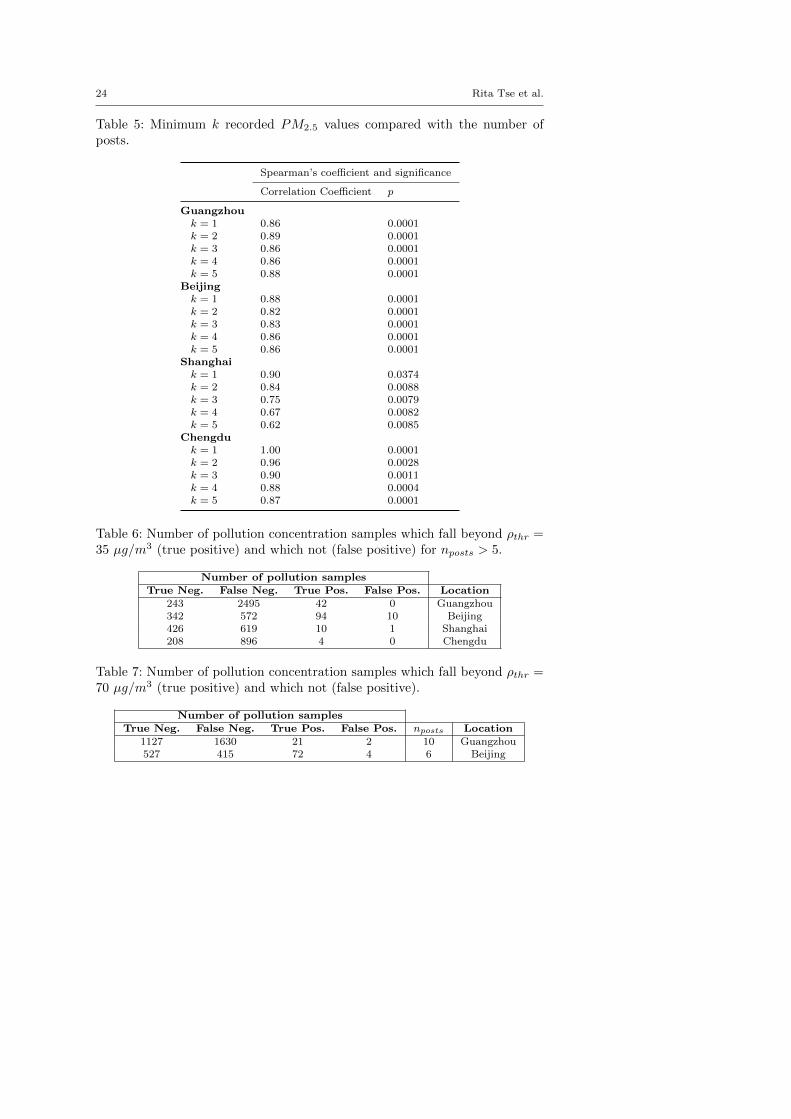
Spearman’s rank correlation coefficient is adopted. In essence, such coeffi-cient provides a non-parametric measure of statistical dependence betweentwo variables assessing how well the relationship between two variables canbe described using a monotonic function. A Spearman correlation value of 1indicates the variables are a perfect monotone function one of the other. Table610
5 provides the Spearman correlation coefficients and their associated statis-tical significance values obtained when comparing two variables: number ofposts vs. the k smallest pollution values recorded in correspondence of thegiven number of posts. In essence, coefficients close to 1 prove what alreadyobserved in Subsection 6.2, a higher number of haze-related posts signals an615
increased minimum concentration value of PM2.5.

22 Rita Tse et al.
(a) Guangzhou. (b) Beijing.
(c) Shanghai. (d) Chengdu.
Fig. 10: Weather posts (w/o automatically generated posts) vs. PM2.5 values.
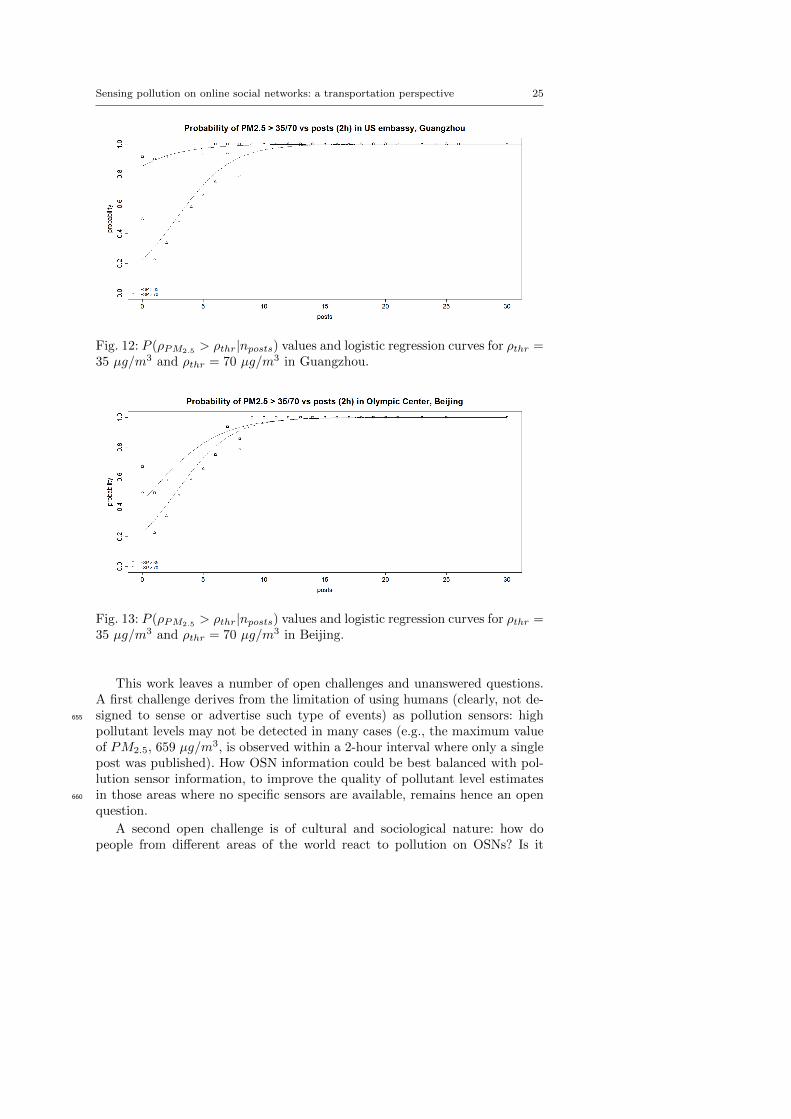
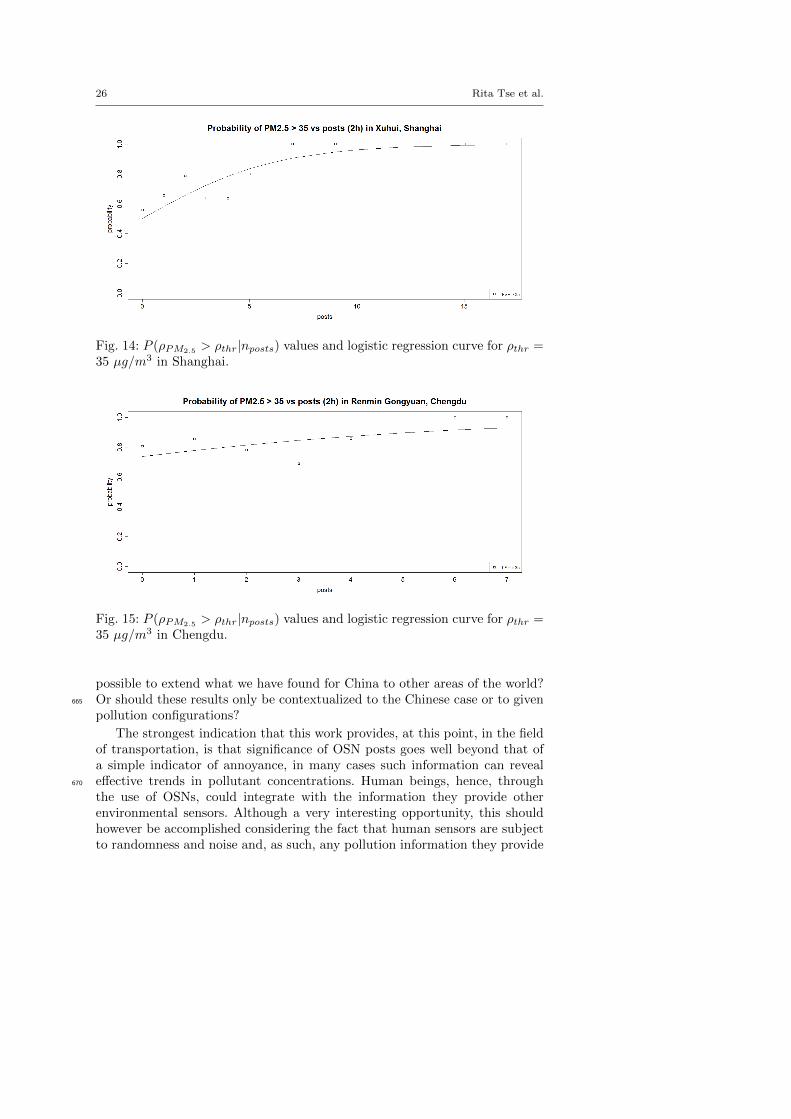
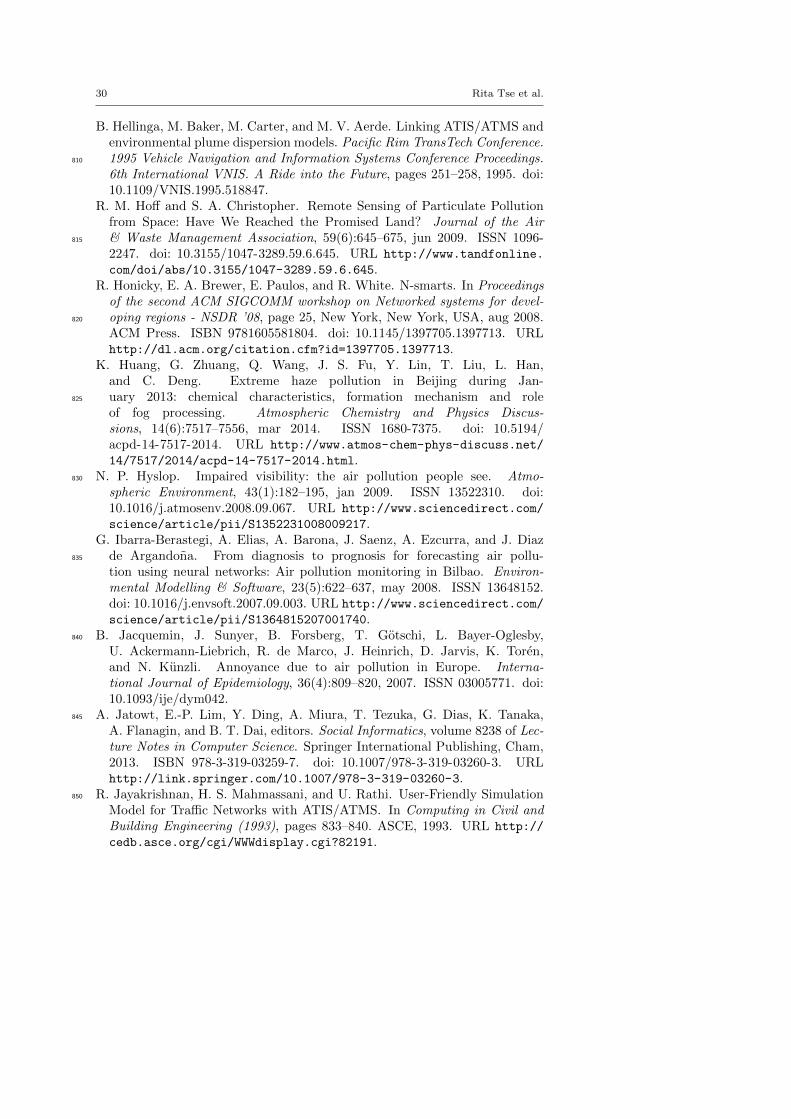
The coefficient values provided in Table 5 establish the existence of amonotonic relationship between the number of posts and the minimum con-centration of PM2.5. Such relation is further assessed computing another fig-ure of merit: P (ρPM2.5
> ρthr|nposts), where ρPM2.5amounts to the concen-620
tration of PM2.5, ρthr to a constant (i.e., concentration threshold value ofinterest) and nposts to the number of haze related posts. In simple words,P (ρPM2.5
> ρthr|nposts) represents the probability that a given PM2.5 conce-tration value is exceeded, conditioned to the number of posts that appearedon the OSN. Along with the values of P (ρPM2.5
> ρthr|nposts), for ρthr = 35625
and 70 in Figures 12 and 13 and ρthr = 35 in Figures 14 and 15, also therespective logistic regression curves are provided. In essence, higher values ofnpost correspond to a higher probability of observing pollution samples whichexceed ρthr. In particular, a value of nposts > 5 (obtained maximizing the truepositive occurrence rate throughout the four scenarios of interest) returns high630
Sensing pollution on online social networks: a transportation perspective 23
(a) Guangzhou. (b) Beijing.
(c) Shanghai. (d) Chengdu.
Fig. 11: Post number per user frequency plot.
probability values in all cases. As expected when nposts ≤ 5 nothing can bereally said, especially in Shanghai and Chengdu (Figures 14 and 15). This factwell emerges from the data reported in Table 6, where the number of truenegative, false negative, true positive and false positive number of samplesare reported taking adopting the threshold values of ρthr = 35 and nposts > 5.635
Now, although ρthr = 35 µg/m3 represents the PM2.5 threhsold recommendedby EPA, such value is well exceeded by the PM2.5 average concentrations ob-served in the cities that have been taken under consideration. For this reason afurther analysis is performed on the two cities where more posts are available,Guangzhou and Beijing. Increasing the value of nposts until a 90%-10% ratio640
is maintained between those samples which fall in the True Positive set andthose that instead fall in the False Positive one, the values of 6 and 10 arefound for Guangzhou and Beijing, respectively (Table 7).
7 Conclusion
The results shown in paper show a trend exists between OSN posts and PM2.5645
levels. Unlike what one could possibly expect (i.e., the existence of an observ-able trend between posts complaining about traffic or pollution and pollutantrecorded levels), the strongest ties that have been found in this work are be-tween pollution levels and haze. This is a key finding, as it means that, at leastfor the cities taken into consideration, the concern for a particular weather650
condition like haze is high and that such concern can be associated with theobservation of high pollution levels.
24 Rita Tse et al.
Table 5: Minimum k recorded PM2.5 values compared with the number ofposts.
Spearman’s coefficient and significance
Correlation Coefficient p
Guangzhouk = 1 0.86 0.0001k = 2 0.89 0.0001k = 3 0.86 0.0001k = 4 0.86 0.0001k = 5 0.88 0.0001
Beijingk = 1 0.88 0.0001k = 2 0.82 0.0001k = 3 0.83 0.0001k = 4 0.86 0.0001k = 5 0.86 0.0001
Shanghaik = 1 0.90 0.0374k = 2 0.84 0.0088k = 3 0.75 0.0079k = 4 0.67 0.0082k = 5 0.62 0.0085
Chengduk = 1 1.00 0.0001k = 2 0.96 0.0028k = 3 0.90 0.0011k = 4 0.88 0.0004k = 5 0.87 0.0001
Table 6: Number of pollution concentration samples which fall beyond ρthr =35 µg/m3 (true positive) and which not (false positive) for nposts > 5.
Number of pollution samplesTrue Neg. False Neg. True Pos. False Pos. Location
243 2495 42 0 Guangzhou342 572 94 10 Beijing426 619 10 1 Shanghai208 896 4 0 Chengdu
Table 7: Number of pollution concentration samples which fall beyond ρthr =70 µg/m3 (true positive) and which not (false positive).
Number of pollution samplesTrue Neg. False Neg. True Pos. False Pos. nposts Location
1127 1630 21 2 10 Guangzhou527 415 72 4 6 Beijing
Sensing pollution on online social networks: a transportation perspective 25
Fig. 12: P (ρPM2.5> ρthr|nposts) values and logistic regression curves for ρthr =
35 µg/m3 and ρthr = 70 µg/m3 in Guangzhou.
Fig. 13: P (ρPM2.5> ρthr|nposts) values and logistic regression curves for ρthr =
35 µg/m3 and ρthr = 70 µg/m3 in Beijing.
This work leaves a number of open challenges and unanswered questions.A first challenge derives from the limitation of using humans (clearly, not de-signed to sense or advertise such type of events) as pollution sensors: high655
pollutant levels may not be detected in many cases (e.g., the maximum valueof PM2.5, 659 µg/m3, is observed within a 2-hour interval where only a singlepost was published). How OSN information could be best balanced with pol-lution sensor information, to improve the quality of pollutant level estimatesin those areas where no specific sensors are available, remains hence an open660
question.
A second open challenge is of cultural and sociological nature: how dopeople from different areas of the world react to pollution on OSNs? Is it
26 Rita Tse et al.
Fig. 14: P (ρPM2.5> ρthr|nposts) values and logistic regression curve for ρthr =
35 µg/m3 in Shanghai.
Fig. 15: P (ρPM2.5> ρthr|nposts) values and logistic regression curve for ρthr =
35 µg/m3 in Chengdu.
possible to extend what we have found for China to other areas of the world?Or should these results only be contextualized to the Chinese case or to given665
pollution configurations?
The strongest indication that this work provides, at this point, in the fieldof transportation, is that significance of OSN posts goes well beyond that ofa simple indicator of annoyance, in many cases such information can revealeffective trends in pollutant concentrations. Human beings, hence, through670
the use of OSNs, could integrate with the information they provide otherenvironmental sensors. Although a very interesting opportunity, this shouldhowever be accomplished considering the fact that human sensors are subjectto randomness and noise and, as such, any pollution information they provide

Sensing pollution on online social networks: a transportation perspective 27
should be periodically corroborated with other means of assessing pollution675
levels.
References
EPA Air Criteria, 2014. URL http://www.epa.gov/air/criteria.html.Outdoor Air Database, World Health Organization, 2014.A. K. Agarwal. Biofuels (alcohols and biodiesel) applications as fuels for680
internal combustion engines. Progress in Energy and Combustion Sci-ence, 33(3):233–271, jun 2007. ISSN 03601285. doi: 10.1016/j.pecs.2006.08.003. URL http://www.sciencedirect.com/science/article/pii/
S0360128506000384.I. N. Athanasiadis, A. E. Rizzoli, P. A. Mitkas, and J. M. Gomez, editors.685
Information Technologies in Environmental Engineering. EnvironmentalScience and Engineering. Springer Berlin Heidelberg, Berlin, Heidelberg,2009. ISBN 978-3-540-88350-0. doi: 10.1007/978-3-540-88351-7. URL http:
//www.springerlink.com/index/10.1007/978-3-540-88351-7.D. Banister. The sustainable mobility paradigm. Transport Policy, 15690
(2):73–80, mar 2008. ISSN 0967070X. doi: 10.1016/j.tranpol.2007.10.005. URL http://www.sciencedirect.com/science/article/pii/
S0967070X07000820.T. M. Barzyk, V. Isakov, S. Arunachalam, A. Venkatram, R. Cook, and
B. Naess. A near-road modeling system for community-scale assessments695
oftraffic-related air pollution in the United States. Environmental Modelling& Software, 66:46–56, apr 2015. ISSN 13648152. doi: 10.1016/j.envsoft.2014.12.004. URL http://www.sciencedirect.com/science/article/
pii/S1364815214003594.B. Beckerman, M. Jerrett, J. R. Brook, D. K. Verma, M. A. Arain, and M. M.700
Finkelstein. Correlation of nitrogen dioxide with other traffic pollutantsnear a major expressway. Atmospheric Environment, 42(2):275–290, jan2008. ISSN 13522310. doi: 10.1016/j.atmosenv.2007.09.042. URL http:
//www.sciencedirect.com/science/article/pii/S1352231007008412.M. Ben-Akiva, H. N. Koutsopoulos, and A. Mukundan. A DYNAMIC705
TRAFFIC MODEL SYSTEM FOR ATMS/ATIS OPERATIONS. I VH S Journal, 2(1):1–19, jan 1994. ISSN 1065-5123. doi: 10.1080/10248079408903812. URL http://www.tandfonline.com/doi/abs/10.
1080/10248079408903812#.VY6A3M4y1NM.M. Ben-Akiva, M. Bierlaire, J. Bottom, H. Koutsopoulos, and R. Mishalani.710
DEVELOPMENT OF A ROUTE GUIDANCE GENERATION SYSTEMFOR REAL-TIME APPLICATION. In Transportation Systems 1997, 1997.ISBN 0080429319. URL http://trid.trb.org/view.aspx?id=505713.
W. Ben Jaballah, M. Conti, M. Mosbah, and C. E. Palazzi. Fast andSecure Multihop Broadcast Solutions for Intervehicular Communication.715
IEEE Transactions on Intelligent Transportation Systems, 15(1):433–450,

28 Rita Tse et al.
feb 2014a. ISSN 1524-9050. doi: 10.1109/TITS.2013.2277890. URL http:
//ieeexplore.ieee.org/articleDetails.jsp?arnumber=6595027.W. Ben Jaballah, M. Conti, M. Mosbah, and C. E. Palazzi. A secure alert
messaging system for safe driving. Computer Communications, 46:29–42,720
jun 2014b. ISSN 01403664. doi: 10.1016/j.comcom.2014.03.010. URL http:
//www.sciencedirect.com/science/article/pii/S0140366414000966.J. T. Betts. Survey of Numerical Methods for Trajectory Optimization. Jour-
nal of Guidance, Control, and Dynamics, 21(2):193–207, mar 1998. ISSN0731-5090. doi: 10.2514/2.4231. URL http://arc.aiaa.org/doi/abs/10.725
2514/2.4231.K. Bickerstaff. Risk perception research: Socio-cultural perspectives on the
public experience of air pollution. Environment International, 30(6):827–840, 2004. ISSN 01604120. doi: 10.1016/j.envint.2003.12.001.
K. Bickerstaff and G. Walker. Public understandings of air pollution:730
the‘localisation’ of environmental risk. Global Environmental Change, 11(2):133–145, 2001. URL http://www.sciencedirect.com/science/article/
B6VFV-430WWRB-4/2/a7d1de642bdee7ade8f2542793c2697c.P. Blythe, H. Bryan, P. Watson, B. Sharif, J. Neasham, S. Edwards, J. Wag-
ner, M. Bell, and V. Suresh. An environmental sensor system for per-735
vasively monitoring road networks. In IET Road Transport Informationand Control Conference and the ITS United Kingdom Members’ Con-ference (RTIC 2008), pages 91–91. Institution of Engineering and Tech-nology, jan 2008. ISBN 978-0-86341-920-1. doi: 10.1049/ic.2008.0805.URL http://digital-library.theiet.org/content/conferences/10.740
1049/ic.2008.0805.K. Boriboonsomsin, M. J. Barth, W. Zhu, and A. Vu. Eco-Routing Navigation
System Based on Multisource Historical and Real-Time Traffic Information.IEEE Transactions on Intelligent Transportation Systems, 13(4):1694–1704,dec 2012. ISSN 1524-9050. doi: 10.1109/TITS.2012.2204051. URL http:745
//ieeexplore.ieee.org/articleDetails.jsp?arnumber=6236175.F. Costabile and I. Allegrini. A new approach to link transport emissions
and air quality: An intelligent transport system based on the control oftraffic air pollution. Environmental Modelling & Software, 23(3):258–267,mar 2008. ISSN 13648152. doi: 10.1016/j.envsoft.2007.03.001. URL http:750
//www.sciencedirect.com/science/article/pii/S1364815207000369.M. R. Edelstein. Contaminated communities: The social and psychological
impacts of residential toxic exposure. 1988.J. S. Evans-Cowley and G. Griffin. Microparticipation with So-
cial Media for Community Engagement in Transportation Planning.755
Transportation Research Record: Journal of the Transportation Re-search Board, 2307(-1):90–98, 2012. ISSN 0361-1981. doi: 10.3141/2307-10. URL http://trb.metapress.com/openurl.asp?genre=
article&id=doi:10.3141/2307-10.M. Fallah Shorshani, M. Andre, C. Bonhomme, and C. Seigneur. Mod-760
elling chain for the effect of road traffic on air and water quality: Tech-niques, current status and future prospects. Environmental Modelling &

Sensing pollution on online social networks: a transportation perspective 29
Software, 64:102–123, feb 2015. ISSN 13648152. doi: 10.1016/j.envsoft.2014.11.020. URL http://www.sciencedirect.com/science/article/
pii/S1364815214003466.765
N.-E. E. Faouzi, H. Leung, and A. Kurian. Data fusion in intelligent trans-portation systems: Progress and challenges A survey. Information Fu-sion, 12(1):4–10, jan 2011. ISSN 15662535. doi: 10.1016/j.inffus.2010.06.001. URL http://www.sciencedirect.com/science/article/pii/
S1566253510000643.770
S. Ferretti, M. Furini, C. E. Palazzi, M. Roccetti, and P. Salomoni. WWWrecycling for a better world. Communications of the ACM, 53(4):139, apr2010. ISSN 00010782. doi: 10.1145/1721654.1721692. URL http://dl.
acm.org/ft_gateway.cfm?id=1721692&type=html.M. Florian. A Traffic Equilibrium Model of Travel by Car and Public Tran-775
sit Modes. Transportation Science, may 1977. URL http://pubsonline.
informs.org/doi/abs/10.1287/trsc.11.2.166.F. Franchi and S. Malpezzi. Infomobility: an Integrated Framework,
2013. ISSN 2147-5369. URL http://www.world-education-center.org/
index.php/P-ITCS/article/view/1918.780
P. Fraternali, A. Castelletti, R. Soncini-Sessa, C. Vaca Ruiz, and A. Riz-zoli. Putting humans in the loop: Social computing for Water ResourcesManagement. Environmental Modelling & Software, 37:68–77, nov 2012.ISSN 13648152. doi: 10.1016/j.envsoft.2012.03.002. URL http://www.
sciencedirect.com/science/article/pii/S1364815212000849.785
Y. Fu, Y. Fang, C. Jiang, and J. Cheng. Dynamic ride sharing communityservice on traffic information grid. Proceedings - International Conferenceon Intelligent Computation Technology and Automation, ICICTA 2008, 2:348–352, 2008. doi: 10.1109/ICICTA.2008.399.
R. Goodspeed. The Limited Usefulness of Social Media and Digital Trace790
Data for Urban Social Research. Proceedings of the Sixth InternationalAAAI Conference on Weblogs and Social Media Understanding, pages 2–4, 2013. URL http://www.aaai.org/ocs/index.php/ICWSM/ICWSM13/
paper/viewFile/6178/6290.Z. Guo, Z. Li, H. Tu, and L. Li. Characterizing User Behavior in Weibo.795
In 2012 Third FTRA International Conference on Mobile, Ubiquitous, andIntelligent Computing, pages 60–65. IEEE, jun 2012. ISBN 978-1-4673-1956-0. doi: 10.1109/MUSIC.2012.18. URL http://ieeexplore.ieee.
org/articleDetails.jsp?arnumber=6305825.H. Hartenstein and K. Laberteaux. A tutorial survey on vehicular ad hoc800
networks. IEEE Communications Magazine, 46(6):164–171, jun 2008. ISSN0163-6804. doi: 10.1109/MCOM.2008.4539481. URL http://ieeexplore.
ieee.org/articleDetails.jsp?arnumber=4539481.M. Hearst, S. Dumais, E. Osman, J. Platt, and B. Scholkopf. Support vector
machines. IEEE Intelligent Systems, 13(4):18–28, jul 1998. ISSN 1094-805
7167. doi: 10.1109/5254.708428. URL http://ieeexplore.ieee.org/
articleDetails.jsp?arnumber=708428.
30 Rita Tse et al.
B. Hellinga, M. Baker, M. Carter, and M. V. Aerde. Linking ATIS/ATMS andenvironmental plume dispersion models. Pacific Rim TransTech Conference.1995 Vehicle Navigation and Information Systems Conference Proceedings.810
6th International VNIS. A Ride into the Future, pages 251–258, 1995. doi:10.1109/VNIS.1995.518847.
R. M. Hoff and S. A. Christopher. Remote Sensing of Particulate Pollutionfrom Space: Have We Reached the Promised Land? Journal of the Air& Waste Management Association, 59(6):645–675, jun 2009. ISSN 1096-815
2247. doi: 10.3155/1047-3289.59.6.645. URL http://www.tandfonline.
com/doi/abs/10.3155/1047-3289.59.6.645.R. Honicky, E. A. Brewer, E. Paulos, and R. White. N-smarts. In Proceedings
of the second ACM SIGCOMM workshop on Networked systems for devel-oping regions - NSDR ’08, page 25, New York, New York, USA, aug 2008.820
ACM Press. ISBN 9781605581804. doi: 10.1145/1397705.1397713. URLhttp://dl.acm.org/citation.cfm?id=1397705.1397713.
K. Huang, G. Zhuang, Q. Wang, J. S. Fu, Y. Lin, T. Liu, L. Han,and C. Deng. Extreme haze pollution in Beijing during Jan-uary 2013: chemical characteristics, formation mechanism and role825
of fog processing. Atmospheric Chemistry and Physics Discus-sions, 14(6):7517–7556, mar 2014. ISSN 1680-7375. doi: 10.5194/acpd-14-7517-2014. URL http://www.atmos-chem-phys-discuss.net/
14/7517/2014/acpd-14-7517-2014.html.N. P. Hyslop. Impaired visibility: the air pollution people see. Atmo-830
spheric Environment, 43(1):182–195, jan 2009. ISSN 13522310. doi:10.1016/j.atmosenv.2008.09.067. URL http://www.sciencedirect.com/
science/article/pii/S1352231008009217.G. Ibarra-Berastegi, A. Elias, A. Barona, J. Saenz, A. Ezcurra, and J. Diaz
de Argandona. From diagnosis to prognosis for forecasting air pollu-835
tion using neural networks: Air pollution monitoring in Bilbao. Environ-mental Modelling & Software, 23(5):622–637, may 2008. ISSN 13648152.doi: 10.1016/j.envsoft.2007.09.003. URL http://www.sciencedirect.com/
science/article/pii/S1364815207001740.B. Jacquemin, J. Sunyer, B. Forsberg, T. Gotschi, L. Bayer-Oglesby,840
U. Ackermann-Liebrich, R. de Marco, J. Heinrich, D. Jarvis, K. Toren,and N. Kunzli. Annoyance due to air pollution in Europe. Interna-tional Journal of Epidemiology, 36(4):809–820, 2007. ISSN 03005771. doi:10.1093/ije/dym042.
A. Jatowt, E.-P. Lim, Y. Ding, A. Miura, T. Tezuka, G. Dias, K. Tanaka,845
A. Flanagin, and B. T. Dai, editors. Social Informatics, volume 8238 of Lec-ture Notes in Computer Science. Springer International Publishing, Cham,2013. ISBN 978-3-319-03259-7. doi: 10.1007/978-3-319-03260-3. URLhttp://link.springer.com/10.1007/978-3-319-03260-3.
R. Jayakrishnan, H. S. Mahmassani, and U. Rathi. User-Friendly Simulation850
Model for Traffic Networks with ATIS/ATMS. In Computing in Civil andBuilding Engineering (1993), pages 833–840. ASCE, 1993. URL http://
cedb.asce.org/cgi/WWWdisplay.cgi?82191.

Sensing pollution on online social networks: a transportation perspective 31
H. Kashani and G. Saridis. Intelligent control for urban traffic systems.Automatica, 19(2):191–197, mar 1983. ISSN 00051098. doi: 10.1016/855
0005-1098(83)90091-2. URL http://www.sciencedirect.com/science/
article/pii/0005109883900912.S. M. Kaufman. How Social Media Moves New York:. (1),
2012. doi: http://wagner.nyu.edu/rudincenter/publications/how\ social\ media\ moves\ new\ york.pdf. URL http://wagner.860
nyu.edu/rudincenter/.Q.-J. Kong, Q. Zhao, C. Wei, and Y. Liu. Efficient Traffic State Estima-
tion for Large-Scale Urban Road Networks. IEEE Transactions on In-telligent Transportation Systems, 14(1):398–407, mar 2013. ISSN 1524-9050. doi: 10.1109/TITS.2012.2218237. URL http://ieeexplore.ieee.865
org/articleDetails.jsp?arnumber=6353219.N. Kunzli, R. Kaiser, S. Medina, M. Studnicka, O. Chanel, P. Filliger,
M. Herry, F. Horak, V. Puybonnieux-Texier, P. Quenel, J. Schneider,R. Seethaler, J. C. Vergnaud, and H. Sommer. Public-health impact ofoutdoor and traffic-related air pollution: a European assessment. Lancet,870
356(9232):795–801, sep 2000. ISSN 0140-6736. doi: 10.1016/S0140-6736(00)02653-2. URL http://www.sciencedirect.com/science/article/pii/
S0140673600026532.I. Leontiadis, G. Marfia, D. Mack, C. Mascolo, G. Pau, and M. Gerla. An
Opportunistic Traffic Management System for Vehicular Networks. Perfor-875
mance Evaluation, 12(4):1537–1548, 2011.M. E. Lindholm and M. Blinge. Assessing knowledge and awareness of
the sustainable urban freight transport among Swedish local authoritypolicy planners. Transport Policy, 32:124–131, 2014. ISSN 0967070X.doi: 10.1016/j.tranpol.2014.01.004. URL http://dx.doi.org/10.1016/j.880
tranpol.2014.01.004.Y. Ma, M. Richards, M. Ghanem, Y. Guo, and J. Hassard. Air Pollution
Monitoring and Mining Based on Sensor Grid in London, jun 2008. URLhttp://www.mdpi.com/1424-8220/8/6/3601/htm.
H. S. Mahmassani. Impact of information on traveler decision. In Transporta-885
tion Research Board 90th annual meeting, Washington, DC, 2011.H. S. Mahmassani, S. Peeta, T.-Y. Hu, and A. Ziliaskopoulos. DYNAMIC
TRAFFIC ASSIGNMENT WITH MULTIPLE USER CLASSES FORREAL-TIME ATIS/ATMS APPLICATIONS. In Large Urban Systems.Proceedings of the Advanced Traffic Management Conference, 1993. URL890
http://trid.trb.org/view.aspx?id=406594.G. Marfia and M. Roccetti. Vehicular congestion detection and short-term
forecasting: A new model with results. IEEE Transactions on VehicularTechnology, 60(7):2936–2948, 2011. ISSN 00189545. doi: 10.1109/TVT.2011.2158866.895
A. McCallum and K. Nigam. A comparison of event models for Naive Bayestext classification. In IN AAAI-98 WORKSHOP ON LEARNING FORTEXT CATEGORIZATION, pages 41–48, 1998. URL http://citeseerx.
ist.psu.edu/viewdoc/summary?doi=10.1.1.65.9324.

32 Rita Tse et al.
H. J. Miller. Beyond sharing: Cultivating cooperative transportation systems900
through geographic information science. Journal of Transport Geography,31:296–308, 2013. ISSN 09666923. doi: 10.1016/j.jtrangeo.2013.04.007.
C. E. Palazzi, M. Roccetti, and G. Marfia. Realizing the unexploited potentialof games on serious challenges. Computers in Entertainment, 8(4):1–4, dec2010. ISSN 15443574. doi: 10.1145/1921141.1921143. URL http://dl.905
acm.org/ft_gateway.cfm?id=1921143&type=html.M. Papageorgiou. Multilayer control system design applied to freeway traffic.
IEEE Transactions on Automatic Control, 29(6):482–490, jun 1984. ISSN0018-9286. doi: 10.1109/TAC.1984.1103573. URL http://ieeexplore.
ieee.org/articleDetails.jsp?arnumber=1103573.910
A. Peters, S. von Klot, M. Heier, I. Trentinaglia, A. Hormann, H. E. Wich-mann, and H. Lowel. Exposure to traffic and the onset of myocardial in-farction. The New England journal of medicine, 351(17):1721–1730, 2004.ISSN 0028-4793. doi: 10.1056/NEJMoa040203.
B. Ran and D. Boyce. Dynamic Urban Transportation Network Models: Theory915
and Implications for Intelligent Vehicle-Highway Systems. Springer Science& Business Media, 2012. ISBN 3662007738. URL https://books.google.
com/books?hl=en&lr=&id=VLb0CAAAQBAJ&pgis=1.T. B. Reed and R. M. Lerner. Methanol: A Versatile Fuel for Immediate Use:
Methanol can be made from gas, coal, or wood. It is stored and used in920
existing equipment. Science, 182(4119):1299–1304, dec 1973. ISSN 0036-8075. doi: 10.1126/science.182.4119.1299. URL http://www.sciencemag.
org/content/182/4119/1299.short.L. Rotaris, R. Danielis, E. Marcucci, and J. Massiani. The urban road pricing
scheme to curb pollution in Milan, Italy: Description, impacts and pre-925
liminary costbenefit analysis assessment. Transportation Research Part A:Policy and Practice, 44(5):359–375, jun 2010. ISSN 09658564. doi: 10.1016/j.tra.2010.03.008. URL http://www.sciencedirect.com/science/
article/pii/S0965856410000479.J. J. Rotemberg. The efficiency of equilibrium traffic flows. Journal of Pub-930
lic Economics, 26(2):191–205, mar 1985. ISSN 00472727. doi: 10.1016/0047-2727(85)90004-0. URL http://www.sciencedirect.com/science/
article/pii/0047272785900040.W. Sha, D. Kwak, B. Nath, and L. Iftode. Social vehicle navigation: integrating
shared driving experience into vehicle navigation. Proceedings of the 14th935
Workshop on Mobile Computing Systems and Applications, pages 1–6, 2013.doi: 10.1145/2444776.2444798.
M. Srivastava, T. Abdelzaher, and B. Szymanski. Human-centric sensing.Philosophical transactions. Series A, Mathematical, physical, and engi-neering sciences, 370(1958):176–97, jan 2012. ISSN 1364-503X. doi: 10.940
1098/rsta.2011.0244. URL http://rsta.royalsocietypublishing.org/
content/370/1958/176.short.Y. Sun, G. Zhuang, A. Tang, Y. Wang, and Z. An. Chemical Characteristics of
PM 2.5 and PM 10 in HazeFog Episodes in Beijing. Environmental Science& Technology, 40(10):3148–3155, may 2006. ISSN 0013-936X. doi: 10.1021/945
Sensing pollution on online social networks: a transportation perspective 33
es051533g. URL http://dx.doi.org/10.1021/es051533g.U. Tang and Z. Wang. Influences of urban forms on traffic-induced noise and
air pollution: Results from a modelling system. Environmental Modelling& Software, 22(12):1750–1764, dec 2007. ISSN 13648152. doi: 10.1016/j.envsoft.2007.02.003. URL http://www.sciencedirect.com/science/950
article/pii/S136481520700028X.E. TANIGUCHI, R. G. Thompson, T. YAMADA, and R. van Duin. CITY
LOGISTICS. NETWORK MODELLING AND INTELLIGENT TRANS-PORT SYSTEMS. 2001. URL http://trid.trb.org/view.aspx?id=
673352.955
M. Thatcher and P. Hurley. A customisable downscaling approach for local-scale meteorological and air pollution forecasting: Performance evaluationfor a year of urban meteorological forecasts. Environmental Modelling &Software, 25(1):82–92, jan 2010. ISSN 13648152. doi: 10.1016/j.envsoft.2009.07.014. URL http://www.sciencedirect.com/science/article/960
pii/S1364815209001765.C. L. Townsend. Effects on health of prolonged exposure to low concentrations
of carbon monoxide. Occupational and Environmental Medicine, 59(10):708–711, oct 2002. ISSN 13510711. doi: 10.1136/oem.59.10.708. URL http:
//oem.bmj.com/content/59/10/708.short.965
F.-Y. Wang. Parallel Control and Management for Intelligent TransportationSystems: Concepts, Architectures, and Applications. IEEE Transactions onIntelligent Transportation Systems, 11(3):630–638, sep 2010. ISSN 1524-9050. doi: 10.1109/TITS.2010.2060218. URL http://ieeexplore.ieee.
org/articleDetails.jsp?arnumber=5549912.970
Y. Wang, G. Zhuang, Y. Sun, and Z. An. The variation of characteristics andformation mechanisms of aerosols in dust, haze, and clear days in Beijing.Atmospheric Environment, 40(34):6579–6591, nov 2006. ISSN 13522310.doi: 10.1016/j.atmosenv.2006.05.066. URL http://www.sciencedirect.
com/science/article/pii/S1352231006005437.975
R. J. WEILAND and L. B. Purser. INTELLIGENT TRANSPORTATIONSYSTEMS. Transportation in the New Millennium, 2000. URL http://
trid.trb.org/view.aspx?id=639268.J. Wootton, a. Garcıa-Ortiz, and S. Amin. Intelligent transportation systems:
A global perspective. Mathematical and Computer Modelling, 22(4-7):259–980
268, 1995. ISSN 08957177. doi: 10.1016/0895-7177(95)00137-Q.Z. Zhang, J. Wang, L. Chen, X. Chen, G. Sun, N. Zhong, H. Kan, and
W. Lu. Impact of haze and air pollution-related hazards on hospitaladmissions in Guangzhou, China. Environmental science and pollutionresearch international, 21(6):4236–44, mar 2014. ISSN 1614-7499. doi:985
10.1007/s11356-013-2374-6. URL http://link.springer.com/10.1007/
s11356-013-2374-6.Y. Zhao. Mobile phone location determination and its impact on intel-
ligent transportation systems. IEEE Transactions on Intelligent Trans-portation Systems, 1(1):55–64, mar 2000. ISSN 15249050. doi: 10.1109/990
6979.869021. URL http://ieeexplore.ieee.org/articleDetails.jsp?

34 Rita Tse et al.
arnumber=869021.B. Zhou, J. Cao, X. Zeng, and H. Wu. Adaptive Traffic Light Control in Wire-
less Sensor Network-Based Intelligent Transportation System. In 2010 IEEE72nd Vehicular Technology Conference - Fall, pages 1–5. IEEE, sep 2010.995
ISBN 978-1-4244-3573-9. doi: 10.1109/VETECF.2010.5594435. URL http:
//ieeexplore.ieee.org/articleDetails.jsp?arnumber=5594435.