sensation and perception_osch05_imageslideshow
TRANSCRIPT
PSYCHOLOGY
Chapter 5 SENSATION AND PERCEPTIONPowerPoint Image Slideshow

FIGURE 5.1
If you were standing in the midst of this street scene, you would be absorbing and
processing numerous pieces of sensory input. (credit: modification of work by Cory
Zanker)

FIGURE 5.2
Nearly one third of participants in a study did not notice that a red cross passed on the
screen because their attention was focused on the black or white figures. (credit: Cory
Zanker)

FIGURE 5.3
In the Muller-Lyer illusion, lines appear to be different lengths although they are identical.
(a) Arrows at the ends of lines may make the line on the right appear longer, although the lines are the same
length.
(b) When applied to a three-dimensional image, the line on the right again may appear longer although both
black lines are the same length.

FIGURE 5.4
The amplitude or height of a wave is measured from the peak to the trough. The
wavelength is measured from peak to peak.

FIGURE 5.5
This figure illustrates waves of differing wavelengths/frequencies. At the top of the
figure, the red wave has a long wavelength/short frequency. Moving from top to bottom,
the wavelengths decrease and frequencies increase.

FIGURE 5.6
Light that is visible to humans makes up only a small portion of the electromagnetic
spectrum.
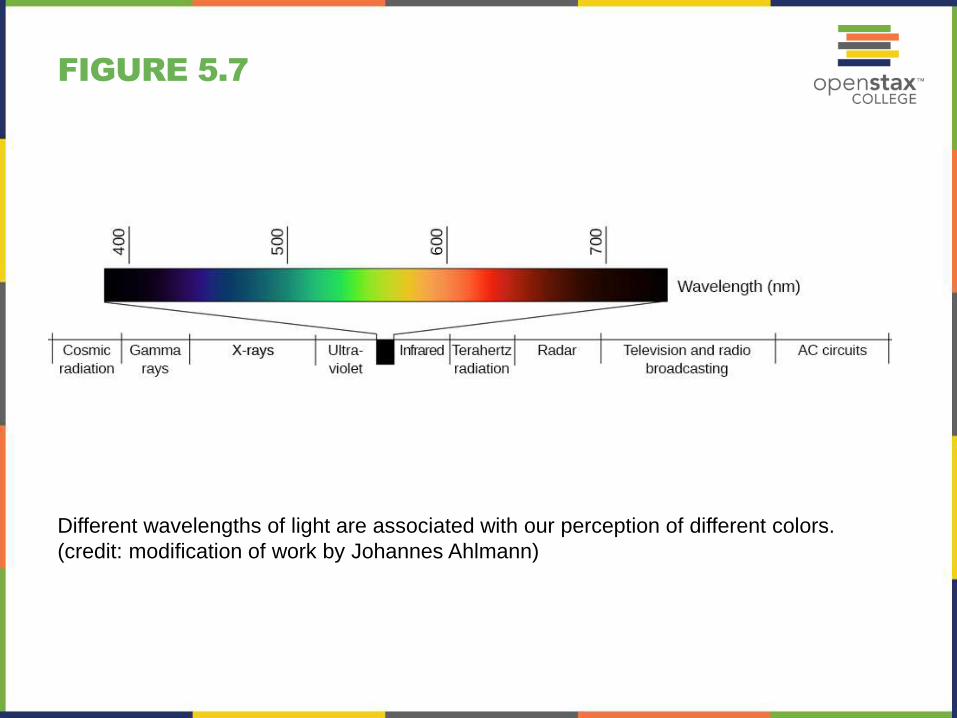
FIGURE 5.7
Different wavelengths of light are associated with our perception of different colors.
(credit: modification of work by Johannes Ahlmann)

FIGURE 5.8
This figure illustrates the loudness of common sounds. (credit “planes”: modification of work by Max Pfandl; credit “crowd”: modification of work by Christian Holmér; credit “blender”: modification of work by Jo Brodie; credit “car”: modification of work by NRMA New Cars/Flickr; credit “talking”: modification of work by Joi Ito; credit “leaves”: modification of work by Aurelijus Valeiša)

FIGURE 5.9
Our eyes take in sensory information that helps us understand the world around us. (credit “top left”: modification of work by “rajkumar1220”/Flickr”; credit “top right”: modification of work by Thomas Leuthard; credit “middle left”: modification of work by Demietrich Baker; credit “middle right”: modification of work by “kaybee07”/Flickr; credit “bottom left”: modification of work by “Isengardt”/Flickr; credit “bottom right”: modification of work by Willem Heerbaart)

FIGURE 5.10
The anatomy of the eye is illustrated in this diagram.

FIGURE 5.11
The two types of photoreceptors are shown in this image. Rods are colored green and
cones are blue.
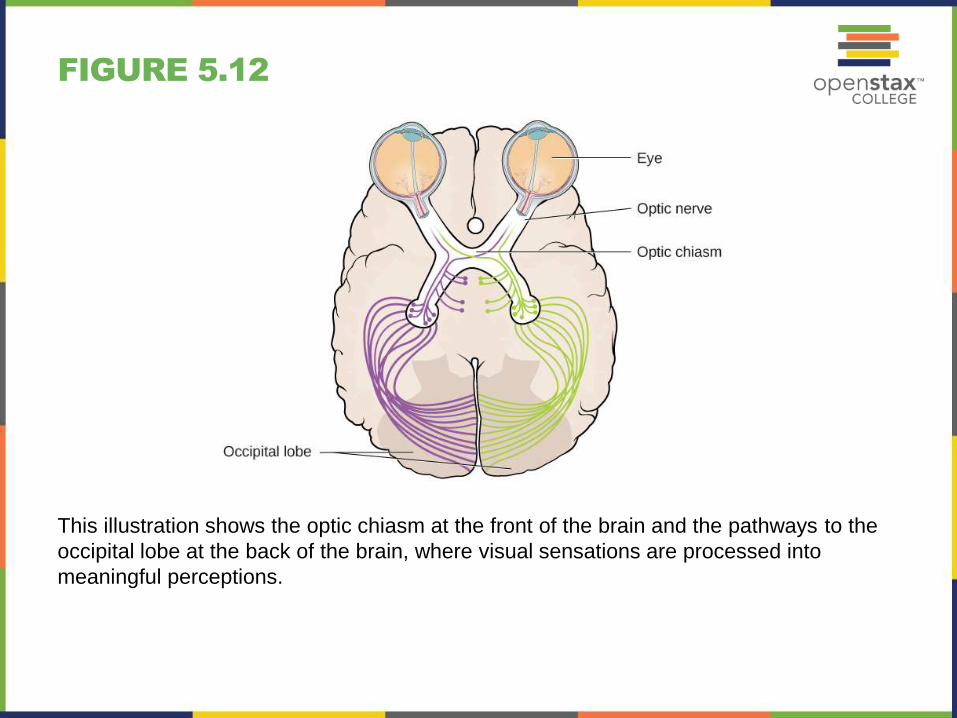
FIGURE 5.12
This illustration shows the optic chiasm at the front of the brain and the pathways to the
occipital lobe at the back of the brain, where visual sensations are processed into
meaningful perceptions.

FIGURE 5.13
This figure illustrates the different sensitivities for the three cone types found in a
normal-sighted individual. (credit: modification of work by Vanessa Ezekowitz)

FIGURE 5.14
Stare at the white dot for 30–60 seconds and then move your eyes to a blank piece of
white paper. What do you see? This is known as a negative afterimage, and it provides
empirical support for the opponent-process theory of color vision.

FIGURE 5.15
We perceive depth in a two-dimensional figure like this one through the use of
monocular cues like linear perspective, like the parallel lines converging as the road
narrows in the distance. (credit: Marc Dalmulder)

FIGURE 5.16
The ear is divided into outer (pinna and tympanic membrane), middle (the three
ossicles: malleus, incus, and stapes), and inner (cochlea and basilar membrane)
divisions.

FIGURE 5.17
Localizing sound involves the use of both monaural and binaural cues. (credit “plane”:
modification of work by Max Pfandl)

FIGURE 5.18
Environmental factors that can lead to conductive hearing loss include regular exposure
to loud music or construction equipment. (a) Rock musicians and (b) construction
workers are at risk for this type of hearing loss. (credit a: modification of work by Kenny
Sun; credit b: modification of work by Nick Allen)
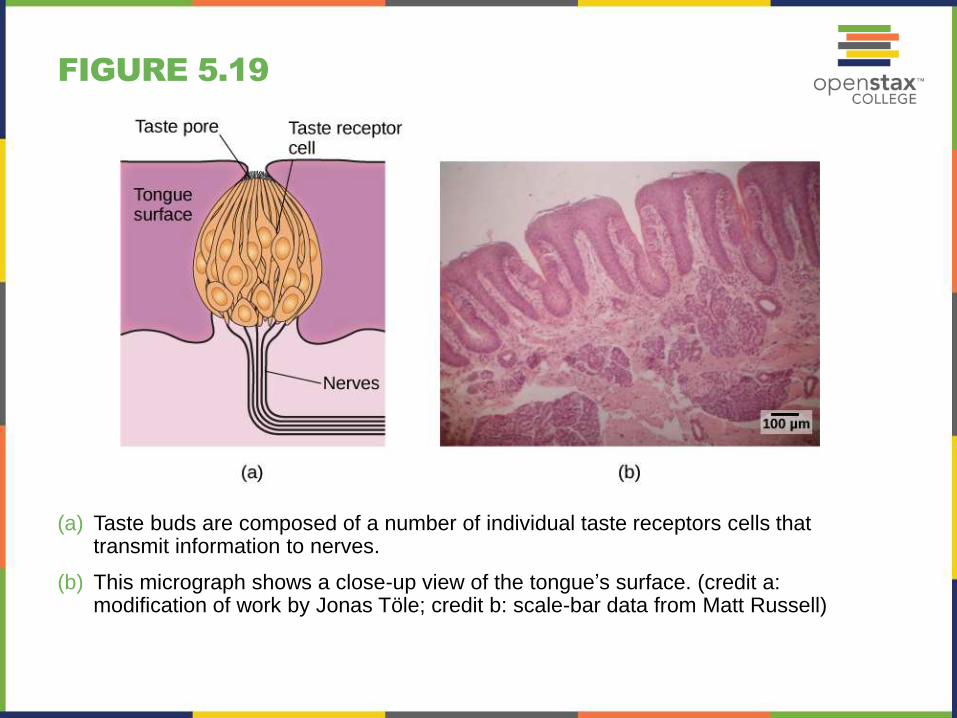
FIGURE 5.19
(a) Taste buds are composed of a number of individual taste receptors cells that transmit information to nerves.
(b) This micrograph shows a close-up view of the tongue’s surface. (credit a: modification of work by Jonas Töle; credit b: scale-bar data from Matt Russell)

FIGURE 5.20
Olfactory receptors are the hair-like parts that extend from the olfactory bulb into the
mucous membrane of the nasal cavity.

FIGURE 5.21
There are many types of sensory receptors located in the skin, each attuned to specific
touch-related stimuli.

FIGURE 5.22
The major sensory organs of the vestibular system are located next to the cochlea in
the inner ear. These include the utricle, saccule, and the three semicircular canals
(posterior, superior, and horizontal).

FIGURE 5.23
The concept of figure-ground relationship explains why this image can be perceived
either as a vase or as a pair of faces.

FIGURE 5.24
The Gestalt principle of proximity suggests that you see (a) one block of dots on the left
side and (b) three columns on the right side.

FIGURE 5.25
When looking at this array of dots, we likely perceive alternating rows of colors. We are
grouping these dots according to the principle of similarity.

FIGURE 5.26
Good continuation would suggest that we are more likely to perceive this as two
overlapping lines, rather than four lines meeting in the center.

FIGURE 5.27
Closure suggests that we will perceive a complete circle and rectangle rather than a
series of segments.

FIGURE 5.28
Take a look at the following figure. How might you influence whether people see a duck
or a rabbit?